
ABSTRACT
In recent years, the lysosome has emerged as a highly dynamic, transcriptionally regulated organelle that is integral to nutrient-sensing and metabolic rewiring. This is coordinated by a lysosome-to-nucleus signaling nexus in which MTORC1 controls the subcellular distribution of the microphthalmia-transcription factor E (MiT/TFE) family of “master lysosomal regulators”. Yet, despite the importance of the lysosome in cellular metabolism, the impact of traditional in vitro culture media on lysosomal dynamics and/or MiT/TFE localization has not been fully appreciated. Here, we identify HEPES, a chemical buffering agent that is broadly applied in cell culture, as a potent inducer of lysosome biogenesis. Supplementation of HEPES to cell growth media is sufficient to decouple the MiT/TFE family members–TFEB, TFE3 and MITF–from regulatory mechanisms that control their cytosolic retention. Increased MiT/TFE nuclear import in turn drives the expression of a global network of lysosomal-autophagic and innate host-immune response genes, altering lysosomal dynamics, proteolytic capacity, autophagic flux, and inflammatory signaling. In addition, siRNA-mediated MiT/TFE knockdown effectively blunted HEPES-induced lysosome biogenesis and gene expression profiles. Mechanistically, we show that MiT/TFE activation in response to HEPES requires its macropinocytic ingestion and aberrant lysosomal storage/pH, but is independent of MTORC1 signaling. Altogether, our data underscore the cautionary use of chemical buffering agents in cell culture media due to their potentially confounding effects on experimental results.
Abbreviations
| CLEAR | = | coordinated lysosomal expression and regulation |
| CTSD | = | cathepsin D |
| DMEM | = | Dulbecco's modified Eagle's medium |
| EIF4EBP1/4E-BP1 | = | eukaryotic translation initiation factor 4E binding protein 1 |
| GBA1 glucocerebrosidase 1 | = | glucosidase, beta, acid |
| GPNMB | = | glycoprotein (transmembrane) nmb |
| GSEA | = | gene-set enrichment analysis |
| HEPES | = | 4-(2-hydroxyethyl)-1-piperazineethanesulfonic acid |
| IL | = | interleukin |
| KEGG | = | Kyoto encyclopedia of genes and genomes |
| MAP1LC3/LC3 | = | microtubule-associated protein 1 light chain 3 |
| LAMP1 | = | lysosomal-associated membrane protein 1 |
| LPS | = | lipopolysaccharide |
| LTG | = | LysoTracker Green |
| MiT/TFE | = | microphthalmia-transcription factor E |
| MITF | = | melanogenesis associated transcription factor |
| MTOR | = | mechanistic target of rapamycin (serine/threonine kinase) |
| MTORC1 | = | MTOR complex 1 |
| PtdIns3K | = | class III phosphatidylinositol 3-kinase |
| RHEB | = | Ras homolog enriched in brain |
| RPMI-1640 | = | Roswell park memorial institute 1640 |
| RRAG/RAG | = | Ras-related GTP binding |
| RRHO | = | rank-rank hypergeometric overlap |
| RPS6/S6 | = | ribosomal protein S6 |
| TFE3 | = | transcription factor E3 |
| TFEB | = | transcription factor EB |
| TLR | = | toll-like receptor |
| v-ATPase | = | vacuolar-type H+-translocating adenosine triphosphatase |
Introduction
Lysosomes are ubiquitous membrane-bound organelles that were first described by de Duve and colleagues [Citation1]. These catabolic structures contain a selection of acid hydrolases capable of degrading a vast repertoire of biological substrates. The lysosomal membrane harbors many multimeric protein complexes involved in transport of metabolites in and out of the lysosome, lumen acidification, trafficking, and fusion with other intracellular structures [Citation2,Citation3] Both endocytic and autophagic pathways converge on the lysosomal apparatus for content degradation. The autophagic-lysosomal axis plays a key role in cellular quality control and recycling of building blocks. Macroautophagy/autophagy facilitates the removal of aggregated or misfolded proteins and the removal of either damaged or functionally redundant organelles under stress conditions [Citation4]. As a result, lysosomal dysfunction has been coupled to a wide range of inherited [Citation5-7] and acquired metabolic disorders [Citation8-11].
Over the past decade, the view of the lysosome has evolved radically from a static recycling center into a highly dynamic, transcriptionally regulated organelle that is integral to nutrient-sensing and metabolic adaptation [Citation2-4]. In 2009, Sardiello et al. defined a conserved lysosome-to-nucleus signaling nexus controlled by the basic helix-loop-helix leucine zipper TFEB (transcription factor EB) [Citation12]. TFEB is a member of the microphthalmia-transcription factor E (MiT/TFE) subfamily, to which TFE3 (transcription factor E3) and MITF (melanogenesis associated transcription factor) also belong [Citation13]. In response to starvation or metabolic stress, TFEB undergoes cytosol-to-nucleus shuttling where it activates a coherent transcriptional program that controls major steps of the autophagic-lysosomal system, such as lysosome biogenesis, autophagosome formation, autophagosome-lysosome fusion, and content degradation [Citation12,Citation14]. TFEB recognizes a specific coordinated lysosomal expression and regulation (CLEAR) motif (GTCACGTGAC) enriched in the promoter regions of certain lysosomal and autophagic genes [Citation15]. A similar mode of action has been ascribed to TFE3 through binding the E-box sequence motif (CANNTG), which partially overlaps with the CLEAR sequence [Citation16,Citation17]. Conversely, MITF regulates only a subset of lysosomal-autophagic genes, but lacks the ability to promote the formation of functional lysosomes [Citation16,Citation18]. It is unknown whether MiT/TFE family members have cooperative, complementary, or nonredundant roles in tailoring the lysosomal system to cell-type or metabolic stress-specific needs.
The first clues for a direct role of the lysosomal apparatus in nutrient sensing emerged from a pioneering study by Sancak et al [Citation19]. They uncovered that the MTORC1 (mechanistic target of rapamycin [serine/threonine kinase] complex 1), a master regulator of cell growth, localized to RAB7/RAS-related GTP-binding protein 7-positive vesicular structures in an amino acid-sensitive fashion [Citation19]. This localization depends on a heterodimeric RRAG/RAG (Ras-related GTP binding) GTPase signaling complex that relays amino acid sufficiency to MTORC1. Recent advances in this field have uncovered that active RRAG heterodimers target MTORC1 to the lysosomal surface via a mechanism that requires the vacuolar-type H+-translocating adenosine triphosphatase (v-ATPase) and Ragulator, a pentameric scaffolding complex that anchors RRAG GTPases to the lysosomal surface [Citation20-22]. These components allow MTORC1 to interact with its upstream activator RHEB (Ras homolog enriched in brain), and in turn control key biosynthetic and catabolic processes [Citation23-25]. In addition to stimulating cell growth under nutrient-rich conditions, MTORC1 acutely inhibits autophagy by phosphorylating a range of autophagy effectors [Citation26-28]. Moreover, MTORC1 signaling has recently been linked to the transcriptional regulation of autophagy by controlling the subcellular localization of MiT/TFE proteins [Citation29-32]. Active RRAG GTPases direct MiT/TFE family members to the lysosomal surface, where they undergo MTORC1-mediated phosphorylation, resulting in their cytosolic retention. During starvation or lysosomal stress, MTORC1 is turned off and MiT/TFE proteins localize to the nucleus and promote lysosomal-autophagic gene expression [Citation29-31].
The recently defined lysosome-based nutrient-sensing apparatus governed by MTORC1 and MIT/TFE family members has positioned the lysosome at the forefront of metabolic research. Indeed, aberrant lysosomal-autophagic transcriptional biology and nutrient sensing has now been implicated in a range of acquired disease states [Citation5-11]. Yet, despite the upsurge of interest in the lysosome as a major nutrient gateway, it is hitherto largely unexplored whether specific in vitro cell culture conditions affect lysosomal function and MiT/TFE subcellular localization. Here, we identify HEPES, a widely applied chemical buffering agent in cell culture—we found >800,000 hits in a Google Scholar search (using “HEPES” AND “in vitro” AND “cell culture”)—as a potent activator of MiT/TFE-dependent lysosomal-autophagic gene networks. Our data emphasize the importance of understanding how cell culture media with its varying chemical, nutrient, and buffer compositions, affect lysosomal homeostasis and cellular metabolism in general.
Results
HEPES drives lysosome biogenesis in cultured cells
Macrophages are specialized phagocytic cells that rely on a dynamic endolysosomal system to cope with varying substrate fluxes that enter through endocytic and autophagic routes. As part of our ongoing studies aimed at unraveling the transcriptional regulation of the lysosomal stress reporter GPNMB (glycoprotein [transmembrane] nmb) [Citation33] in the RAW264.7 (RAW) cell line, we observed a robust on/off state when using distinct growth media. RAW cells cultured in RPMI-1640 medium (22409; Dutch modification; see Materials and Methods) showed a marked induction of GPNMB expression as well as its secreted form, relative to DMEM (31966) (Figure S1A-C). In addition, by using the LysoTracker Green (LTG) dye, a specific marker for acidic organelle compartments, we measured an ∼3.5-fold increase in the number of acidic organelles in RPMI-grown cells by flow cytometry (Figure S1D). Parallel studies using MitoTracker Green demonstrated no evident changes in mitochondrial number (Figure S1E).
To identify the nutrient/chemical in RPMI initiating lysosomal biogenesis in cultured cells, we systematically compared the formulations of the 2 respective growth media. This revealed notable changes in glucose, amino acid, vitamin and inorganic salt concentrations. The most striking discrepancy was the inclusion of the zwitterionic biological buffer HEPES (25 mM) in the RPMI recipe, which was lacking in DMEM. Notably, we confirmed HEPES as the elusive factor driving the induction of acidic organelles by recreating the lysosomal stress phenotype in RAW cells cultured in a HEPES-containing DMEM variant (32430) (A). Conversely, switching cells to HEPES-free RPMI (61870) completely abolished lysosomal biogenesis. In line with these results, supplementing DMEM with culture-grade HEPES (DMEM+H) elicited a progressive and dose-dependent increase of LTG signal and Gpnmb gene expression and protein (B-C and S1F-I). Moreover, this lysosomal stress signature fully resolved upon the withdrawal of HEPES from cell culture media (D-E). To further characterize the impact of HEPES on an ultrastructural level, we resorted to transmission electron microscopy (TEM). This analysis unveiled a striking vacuolation phenotype in DMEM+H-grown cells (F). These vacuoles were readily visible by phase-contrast microscopy and stained positive for LAMP1 (lysosomal-associated membrane protein 1) (G), suggesting that they correspond to late endosomes and/or lysosomes. Additionally, it is important to note that HEPES supplementation to culture media did not adversely affect cell viability (Figure S1J-K).
Figure 1. HEPES drives lysosomal biogenesis in cultured RAW264.7 macrophages. (A) Flow cytometric analysis (FL1) of LTG-stained RAW cells grown in either DMEM (31966), DMEM (32430; containing HEPES), RPMI (61870), or RPMI (22409; containing HEPES). (B) Time-course analysis of LTG staining in cells grown in DMEM supplemented with HEPES (25 mM) for 6–72 h. RPMI-grown cells served as a positive control. (C) Fluorescence microscopy analysis of LTG-stained RAW cells cultured in DMEM or DMEM+H for 24 h. (D-E) RAW cells were adapted to grow in DMEM (32430; containing HEPES) for 7 d, after which culture media were replaced by HEPES-free DMEM (31966) for 6–72 h. A time course for (D) LTG staining and (E) Immunoblot analysis of GPNMB and CTSD protein levels. (F) Transmission electron microscopy (TEM) analysis of RAW cells grown in either DMEM or DMEM+H for 24 h. Scale bar: 1 µm. (G) Phase-contrast and immunofluorescence microscopy analysis of LAMP1-stained cells. (H) Analysis of GBA1 enzymatic activity using a 4-MU-based assay in RAW cells grown in DMEM or DMEM+H for 24 h. (I) Schematic illustration of the DQ-BSA reagent used for quantifying lysosomal proteolytic activity. DQ-BSA added to culture media is rapidly endocytosed, but only emits a fluorescent signal after cleavage by proteases inside lysosomes. (J) Flow cytometric analysis of DQ-BSA cleavage (FL1) in RAW cells grown in DMEM or DMEM+H for 24 h. (K) Western blot analysis and (L) quantification of LC3-II protein levels in RAW cells grown in DMEM or DMEM+H for 24 h, and where indicated treated with bafilomycin A1 (BAF A1; 100 nM) for the last 2 h. Values are expressed as mean ± SEM, n = 3-4 in A-L. **P<0.01.
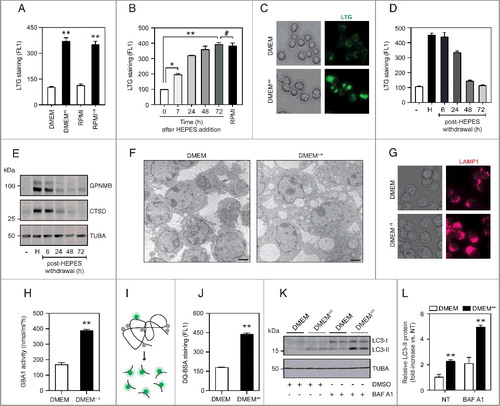
To determine whether the LAMP1-positive structures represent functional lysosomes, we first measured the activities of lysosomal enzymes using a 4-MU assay and activity-based probes (ABP) [Citation34,Citation35]. Indeed, DMEM+H-grown cells displayed a significant increase in active GBA1/glucocerebrosidase 1 (glucosidase, beta, acid) and cysteine cathepsin enzymes (H and S1L-M). We next determined lysosomal proteolytic activity using the dequenched (DQ)-BSA reagent [Citation36], which is readily incorporated by cells via fluid-phase endocytosis. Upon fusion with endo-lysosomes, DQ-BSA is digested into smaller fragments, thereby relieving its self-quenching properties and generating a fluorescent signal that reflects lysosomal degradative capacity (I). Of interest, HEPES supplementation to RAW cell culture media led to a marked increase in DQ-BSA cleavage (J), signifying that these LAMP1-positive structures are, at least in part, functional lysosomes. Lastly, given the highly integrated nature of the autophagy-lysosomal pathway, we explored the impact of HEPES on the conversion of cytosolic MAP1LC3/LC3 (microtubule-associated protein 1 light chain 3)-I to lipidated autophagic membrane-bound LC3-II [Citation37]. The steady-state level of autophagosomes depends on both de novo synthesis and their lysosomal turnover. We therefore measured autophagic flux in the presence and absence of bafilomycin A1, a potent v-ATPase inhibitor that blocks autophagosome-lysosome fusion and thus LC3-II degradation. Under both normal and lysosome-inhibited conditions, LC3-II levels were significantly elevated in DMEM+H-grown RAW cells (K-L), indicating that HEPES drives biogenesis of the autophagic-lysosomal pathway.
HEPES affects MiT/TFE cytoplasmic-nuclear distribution
Of interest, the lysosomal phenotype induced by HEPES closely mirrors a previously defined sucrose-driven vacuolation model [Citation38-40]. In addition, sucrose supplementation induces the nuclear translocation of TFEB and activation of the lysosomal-autophagic gene program [Citation12]. This prompted us to study the subcellular distribution of MiT/TFE family members in response to HEPES. Immunofluorescence analysis showed mainly cytosolic localization of endogenous TFEB, TFE3 and MITF in standard DMEM-grown RAW cells (A). Notably, HEPES supplementation to cell culture media induced a dramatic nuclear translocation of all 3 MiT/TFE family members (A-B). In line with prior studies [Citation12,Citation29-32] sucrose (80 mM) and the MTOR catalytic site inhibitor Torin1 (400 nM) were equally potent in driving the nuclear localization of MiT/TFE family proteins (A-B). These observations were further verified by immunoblotting performed after nuclear-cytosolic fractionation (C). In addition, treating DMEM+H-grown cells with an siRNA cocktail targeting Tfeb, Tfe3, and Mitf, significantly blunted lysosome biogenesis and gene expression (Figure S2A-C), thus directly coupling the HEPES-dependent lysosomal stress response to MiT/TFE activity. In agreement, omitting HEPES from RAW culture media led to a prompt MiT/TFE redistribution back to the cytosol (Figure S2D).
Figure 2. HEPES promotes MiT/TFE nuclear translocation independent of MTORC1 activity. (A) Representative images and (B) quantified MiT/TFE nuclear import in RAW cells treated with HEPES (H), sucrose (S), or Torin1 (T) for 6 h, stained for endogenous TFEB, TFE3, or MITF levels (in green) and counterstained with DAPI (in blue). Values are expressed as percent of cells counted (>100 per experiment). (C) Western blot analysis on cytosolic and nuclear fractions isolated from RAW macrophages treated for 6 h, as indicated. Membranes were probed with antibodies against MiT/TFE family members. TUBA and LMNB1 were used as controls for the cytosolic and nuclear fractions, respectively. (D) HEPES and sucrose supplementation to RAW cell culture media does not inhibit MTORC1 signaling. Western blot analysis on protein extracts isolated from RAW cells treated for 6 h as indicated in the presence and absence of the PtdIns3K inhibitor LY294002 (LY2; 50 µM). Membranes were probed with antibodies against p-EIF4EBP1 (Thr37/46), p-RPS6 (Ser235/236), and TFEB. (E-G) LY2 prevents HEPES-dependent MiT/TFE nuclear redistribution and lysosome biogenesis. (E) Representative images and (F) western blot analysis of MiT/TFE relocalization in RAW cells pretreated with LY2 for 30 min and subsequently cultured in either DMEM or DMEM+H for 6 h. (G) Flow cytometric analysis of LTG-stained cells pre-treated with LY2 and grown in DMEM or DMEM+H for another 16 h. (H-I) HEPES perturbs lysosomal pH/acidification. (H) Flow cytometric analysis of fluorescent intensity (FL1) in LysoSensor™ DND-189 stained RAW cells treated for 2 h, as indicated. (I) Quantified lysosomal pH using LysoSensor™ Yellow/Blue DND-160 in cells grown in DMEM or DMEM+H for 4 h. (J) Flow cytometric analysis of LTG-stained RAW cells grown in DMEM supplemented with HEPES (20 mM), MES (20 mM), PIPES (10 mM), sucrose (80 mM), and Tris-HCl (20 mM) for 16 h. Values are expressed as mean ± SEM, n = 3-4 in A-J. *P < 0.05, **P < 0.01.
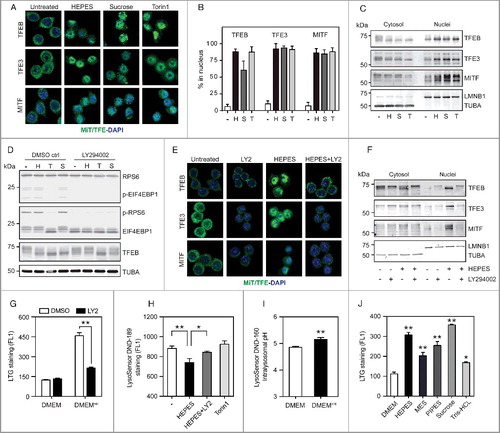
We next aimed to clarify the molecular basis of MiT/TFE activation in DMEM+H-cultured RAW cells. In recent years, MTORC1 has emerged as the major repressor of lysosomal-autophagic transcriptional biology under nutrient-replete conditions via directly phosphorylating MiT/TFE proteins on multiple conserved residues, leading to their cytosolic sequestration [Citation29-32]. Similar to Torin1, HEPES or sucrose supplementation to culture media changed the electrophoretic mobility of TFEB to a fast-migrating form (D), signifying dephosphorylated TFEB that is present in the nucleus [Citation29,Citation30]. Yet, both buffering agents did not alter MTORC1 signaling, as measured by phosphorylation of its substrates RPS6/S6 (ribosomal protein S6) and EIF4EBP1/4E-BP1 (eukaryotic translation initiation factor 4E binding protein 1) (D and S2E), suggesting that HEPES affects MiT/TFE localization via an MTORC1-independent mode of action. To evaluate whether the effects of HEPES rely on active ingestion and delivery to the lysosome, we made use of LY294002 (LY2), a potent inhibitor of the class III phosphatidylinositol 3-kinase (PtdIns3K) and fluid-phase endocytosis [Citation41] (confirmed by monitoring the uptake of FITC-labeled dextran; Figure S2F). A potential caveat of studying the relevance of HEPES uptake is that well-known inhibitors of endocytic trafficking either perturb lysosomal pH or MTORC1 activity [Citation30,Citation42] both of which trigger MiT/TFE redistribution to the nucleus. Notably, although LY2 inhibited MTORC1 signaling to the same extent as Torin1, this was not followed by a significant TFEB molecular weight shift (D). Moreover, LY2 pre-treatment largely prevented the TFEB mobility shift induced by HEPES or sucrose, but not by Torin1 (D). In line with these observations, LY2 strongly blunted the ability of HEPES to drive MiT/TFE nuclear transport and lysosome biogenesis (E-G), whereas the response to Torin1 was unaffected (Figure S2G).
The MiT/TFE factors mobilize to the nucleus in response to inhibitors of the v-ATPase [Citation29-31,Citation33]. We thus reasoned that aberrant HEPES storage may interfere with lysosomal pH regulation. To test this hypothesis, we used LysoSensor™ Green DND-189 (LSG) to measure lysosomal acidification. LSG fluorescence intensity increases in more acidic cellular compartments [Citation43]. We opted for a short-term (2.5 h) exposure to HEPES to exclude MiT/TFE-related compensatory effects aimed at correcting the defective pH status of the lysosome. Flow cytometric analysis of LSG-stained DMEM+H-grown cells showed an LY2-sensitive reduction in fluorescent signal relative to RAW controls (H), reflecting a higher lysosomal pH. In contrast, treating cells with Torin1 had little effect on LSG signal (H). The increase in lysosomal pH was validated by using LysoSensor™ Yellow/Blue DND-160 (I), a ratiometric probe that allows for pH analysis in acidic organelles. These data support a model of aberrant lysosomal pH and/or storage as a mechanism for HEPES-dependent MiT/TFE activation.
LY2 blocks the full lysosomal signature in DMEM+H-grown RAW cells, most likely by its ability to suppress macropinocytosis, a nonselective mode of fluid-phase endocytosis [Citation44]. Supporting this view, supplementing RAW cell culture media with a number of chemical buffering agents (pH 7.4) recapitulated HEPES-driven lysosome biogenesis (J). Lastly, it is important to note that macropinocytosis is a ubiquitous cellular process, although the pinocytic rate varies between distinct cell types [Citation45]. This led us to explore whether HEPES-related lysosomal stress is a universal feature in mammalian cell culture. Indeed, multiple widely used fibroblastic and cancerous cell lines adapted to grow in DMEM+H showed a significant increase in LTG signal, albeit less robust as observed in RAW cells (Figure S2H). Similarly, this was accompanied by a progressive nuclear redistribution of endogenous MiT/TFE proteins (Figure S2G), as shown by immunostaining. Together, these results suggest that HEPES inclusion in cell culture media drives a MiT/TFE-related lysosomal stress pathway.
HEPES disrupts global cellular transcriptional profiles
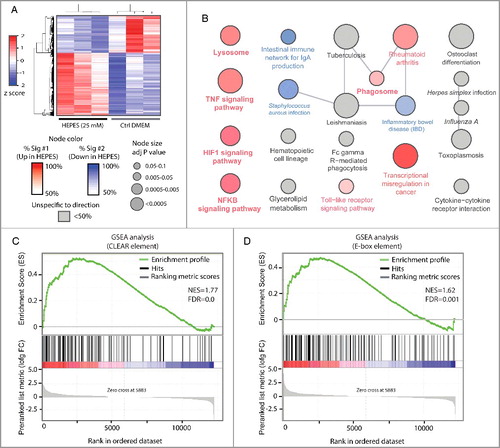
To study the global molecular consequence of HEPES on cellular transcriptional profiles, we conducted RNA-Seq on the RAW cell line. Overall, HEPES supplementation to culture media significantly affected the expression of ∼1738 genes (15.5% of the total; A). The molecular changes induced by HEPES corroborated our phenotypic observations because Kyoto encyclopedia of genes and genomes (KEGG) pathway enrichment analysis unveiled upregulation of genes associated with the lysosome (B). Similarly, gene-set enrichment analysis (GSEA) confirmed our findings that HEPES affects MiT/TFE transcriptional biology, as illustrated by a robust enrichment of numerous lysosome-autophagic genes harboring CLEAR [Citation15] and/or E-box [Citation46] consensus motifs (C-D and S3). Additionally, classical pro-inflammatory pathways were significantly overrepresented among the genes induced by HEPES, for example those involving TNF/TNFA, NFKB/NF-κB, and TLR (toll-like receptor) (A). This outcome is befitting, as MiT/TFE members have recently also been defined as key transcriptional regulators of the host-immune response [Citation33,Citation46-48].
Figure 3. Global molecular consequence of HEPES on the RAW264.7 macrophage cell line. (A) A heatmap transformation of the z-score normalized levels of the top ∼1738 differentially expressed genes (log FC>|0.5| with adj p-value of <0.01) following HEPES supplementation to RAW cell culture media for 24 h. (B) Kyoto Encyclopedia of Genes and Genomes (KEGG) pathway enrichment analysis on 2 lists with either up- or downregulated genes in response to HEPES. Node color indicates cellular pathways that were mostly enriched in upregulated (more red) or downregulated (more blue) genes or nonspecific to direction of the expression change (gray). (C-D) HEPES drives a MiT/TFE-mediated gene signature in RAW cells. Gene set enrichment analysis (GSEA) on the RAW transcriptome following exposure to HEPES for 24 h. Graphs show enrichment plots of ranked gene expression data (red, upregulated; blue, downregulated). The enrichment score is depicted as a green line, and the vertical black bars below indicate the position of lysosomal-autophagic and innate host-immune response genes carrying either validated (C) CLEAR sequences bound by TFEBCitation12,Citation15 or (D) E-box consensus motifs bound by TFE3.Citation46
We next sought to identify whether the HEPES-associated inflammatory signature mirrored a known macrophage polarization state. M1 or ‘classically activated’ macrophages are induced by pro-inflammatory mediators such as lipopolysaccharide (LPS), whereas M2 or the ‘alternatively activated’ state is typically generated after exposure to IL4. To define how the global transcriptional changes in response to HEPES-induced lysosomal stress compared to M1 or M2 polarization states, we conducted parallel RNA-seq on RAW cells treated with 100 ng/ml LPS or 50 ng/ml IL4 for 24 h. We subsequently applied a rank-rank hypergeometric overlap (RRHO) algorithm that enables a global comparison of the molecular consequence of HEPES with those defined by the polarization states. Notably, an RRHO map of the HEPES vs. LPS differentially expressed genes uncovered a significant overlap, as shown by a bright red intensity along the diagonal axis (A). This overlap was further evidenced by a positive correlation (r = 0.54) in the scatter plot of the corresponding Log2FC values (A). Conversely, the RRHO map and scatter plot comparing HEPES and IL4 showed a less conserved correlation pattern (B). Hence, these results indicate that HEPES addition to culture media triggers a lysosomal stress-related inflammatory phenotype that molecularly resembles an M1-like activation state.
Figure 4. HEPES affects host-immune gene programs in RAW macrophages. (A-B) Rank-rank hypergeometric overlap (RRHO) analysis comparing the gene ranking (log FC) affected by HEPES (relative to DMEM) to an (A) M1 polarization state induced by LPS (100 ng/ml), or an (B) M2-specific state induced by IL4 (50 ng/ml). Pixel values in the RRHO map represent the log10-transformed hypergeometric overlap of subsections of 2 ranked gene lists (step size 100 genes). Red values indicate a higher than expected number of overlapping genes in the subsections, and blue values signify a lower than expected overlapping gene number. Below the heatmaps, the metric values (log FC) used for the differential expression levels are plotted in a bar graph along x- and y-axes. A scatter plot (A-B) of the datasets is shown for comparing the RRHO map to a standard metric of correlation (Pearson). The RRHO result and Pearson correlation coefficient reflect a similar relationship. (C) Cytokine array blots on culture media derived from DMEM or DMEM+H-grown cells for 24 h. Secreted cytokines and chemokines in culture media were detected using a Mouse Cytokine Array kit and quantified with the Odyssey V3.0 software (fold-increase relative to DMEM ctrl). Secreted GPNMB levels were measured as a positive control. (D-E) RT-PCR analysis of the specified (D) M1- and M2-specific markers and (E) MiT/TFE target genes in RAW cells grown in DMEM or DMEM+H for 24 h and pulsed with either vehicle Ctrl (-), LPS (100 ng/ml) or IL4 (50 ng/ml) for another 24 h. Gene expression was normalized to Rplp0. Values are expressed as mean ± SEM, n = 3-4 in A-E. *P < 0.05, **P < 0.01. N.S., nonsignificant.
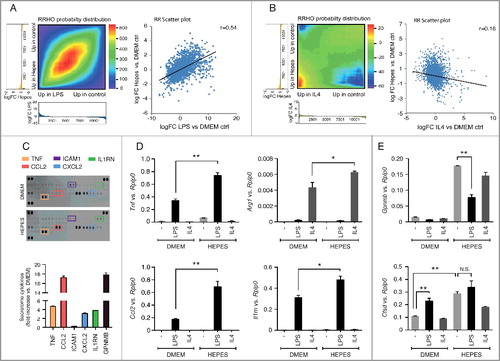
To explore the functional consequence of HEPES on cytokine and interleukin biology in more detail, we evaluated the cytokine/chemokine secretion profile using a cytokine array blot (C). This analysis supported an increased capacity of DMEM+H-grown RAW cells to produce and secrete a number of cytokines (C), such as TNF and CCL2. Of interest, both M1 and M2 stimuli have recently been linked to the induction of specific lysosomal gene programs in RAW macrophages [Citation46,Citation49]. This led us to hypothesize that HEPES-related lysosomal priming affects macrophage polarization in response to M1 or M2 stimuli. To this end, RAW cells were grown in the presence or absence of HEPES for 48 h, and pulsed with either LPS or IL4 for the last 24 h. HEPES potentiated the capacity of LPS to induce M1-specific markers, including Tnf, Ccl2, and Il1rn (D). Moreover, the presence of HEPES also enhanced the IL4 (M2 like) response, as shown by amplified transcript levels of the M2-specific marker Arg1 (D). Notably, Cstd expression was similarly upregulated in both HEPES and LPS-treated cells (E). The lack of a synergistic effect between HEPES and LPS implies that both stimuli converge on the same effector pathway. In line with this, LPS-mediated TLR signaling in RAW macrophages has recently been shown to drive nuclear import of TFEB and TFE3 [Citation46]. Finally, we observed a distinct pattern for Gpnmb transcript levels, which was selectively induced in DMEM+H-grown cells (E). Together, these data suggest that HEPES supplementation to culture media alters the RAW polarization response. Additionally, whereas HEPES and LPS both converge on MiT/TFE signaling, specific triggers may govern a tailored transcriptional outcome.
Discussion
In recent years, the lysosome has evolved from a static recycling center into a dynamic, transcriptionally regulated organelle integral to nutrient sensing [Citation12,Citation19]. This involves a highly integrated signaling nexus governed by MTORC1 and the MiT/TFE family members. Indeed, deregulated lysosomal function has now been implicated in a wide range of acquired disease states, including obesity, inflammation, aging, and cancer [Citation8-11]. This underscores the importance of using a well-defined set of in vitro cell culture conditions in order to accurately study cellular metabolism and disease pathogenesis. Our study defines HEPES, a chemical buffering agent that is broadly applied in culture media, as a potent inducer of transcriptional changes leading to lysosome biogenesis. The HEPES-dependent lysosomal stress signature is mechanistically coupled to activation of the MiT/TFE family members. Increased nuclear import drives a global network of lysosome-autophagic and innate host-immune genes in the monocytic RAW cell line. This reflects an adaptive metabolic response to cope with aberrant lysosomal pH and/or storage upon active HEPES ingestion.
Work in the 1980s first described a HEPES-driven vacuolation phenotype in cultured cells, although the underlying mechanism(s) remained elusive [Citation50,Citation51]. The MiT/TFE family members—TFEB, TFE3, and MITF—have recently been defined as “master regulators” of the lysosomal-autophagic transcriptional biology [Citation12,Citation14-16]. Here, we present several lines of evidence supporting a MiT/TFE dependency of the HEPES-induced lysosomal stress response. First, HEPES supplementation to cell culture media induced a dramatic nuclear translocation of MiT/TFE family members. Second, HEPES withdrawal from culture media led to MiT/TFE redistribution back to the cytosol. Third, siRNA-mediated MiT/TFE knockdown blunted lysosomal biogenesis and gene expression profiles in DMEM+H-grown cells. Fourth, inhibition of fluid-phase endocytosis largely prevented the HEPES-driven TFEB mobility shift, MiT/TFE nuclear translocation, and the associated increase in LTG signal. Fifth, a GSEA on RNA-seq datasets showed that direct TFEB and TFE3 target genes were overrepresented in the fraction of genes upregulated by HEPES.
The MiT/TFE members, in particular TFEB and TFE3, are key effectors in cellular adaptation to starvation or lysosomal stress [Citation14-16]. It is widely accepted that both stressors trigger MiT/TFE nuclear transport by virtue of their ability to suppress MTORC1 [Citation29-31]. The emerging concept of MTORC1 activation status as a gating factor in determining MiT/TFE localization has recently been questioned by Pastore et al [Citation46]. They have reported that TLR signaling in macrophages drives TFE3 nuclear import under conditions of sustained MTORC1 activity. Consistently, HEPES-dependent MiT/TFE nuclear redistribution was independent of changes in MTORC1 activity, as judged by the phosphorylation status of its downstream targets RPS6 and EIF4EBP1. Thus, MiT/TFE activation by HEPES appears to be mechanistically distinct from the response to starvation or MTORC1 inhibition. Reinforcing this view, LY2 prevented the ability of HEPES to drive MiT/TFE translocation, whereas the response to Torin1 was insensitive to PtdIns3K inhibition. We speculate that aberrant lysosomal pH and/or storage triggered by HEPES is sensed by a hitherto unknown signaling node (e.g. a lysosome-resident phosphatase or PRKC [Citation52,Citation53]) that converges on MiT/TFE localization.
Our data uncover an apparent nonlinearity between MTORC1 activation status and MiT/TFE subcellular distribution. Treating RAW macrophages with the PtdIns3K inhibitor LY2 led to a near-complete suppression of MTORC1 activity, but this was not accompanied by MiT/TFE nuclear relocalization. This observation is in contrast to a previous study by Martina et al [Citation30]. showing that LY2 triggers a TFEB mobility shift to a fast-migrating form and concomitant cytosol-to-nucleus shuttling in ARPE-19 cells. Importantly, experiments using the MTOR kinase inhibitor Torin1 verified that MTORC1-MiT/TFE regulation is intact in RAW cells. The inability of LY2 to prevent Torin1-mediated MiT/TFE redistribution to the nucleus suggests that their cytosolic retention in LY2-treated cells may still be MTORC1 dependent. This is based on the premise that LY2 impairs the activity of MTORC1 on only a subset of downstream targets, such as RPS6 and EIF4EBP1. Future studies will be required to determine whether MiT/TFE family members are in fact LY2-resistant MTORC1 substrates in RAW cells. Alternatively, MiT/TFE localization may be subject to cell type-specific regulatory mechanisms that act in parallel with MTOR.
We have previously reported that GPNMB is highly induced in RAW cells following exposure to chemical inhibitors of lysosome acidification (e.g., by targeting v-ATPase) and MTORC1, or physiological stressors such as palmitate [Citation33]. Here, we extend these observations by showing that GPNMB is similarly induced in response to HEPES and sucrose. However, it is intriguing to note that although numerous lysosomal-autophagic genes are highly upregulated by LPS, Gpnmb was not one of them. This implies that LPS-induced TLR activation drives only a specific subset of the MiT/TFE transcriptional network. In light of this, the data presented here exhibit parallels with the study by Pastore et al. [Citation46], delineating synergistic roles of TFEB and TFE3 in the regulation of innate host-immune genes in RAW macrophages [Citation46]. Our RNA-Seq analysis of DMEM+H-grown RAW cells confirmed a global induction of host-immune genes, supporting a functional role for the lysosome as a critical integrator of metabolic-inflammatory cross-talk in macrophages [Citation9,Citation33,Citation46,Citation48]. Defining how distinct stimuli such as lysosomal stress, starvation/MTORC1 inhibition, or TLR signaling inhibition, induce a tailored MiT/TFE transcriptional program requires further investigation.
By eliciting a MiT/TFE-driven feed-forward loop in lysosomal-autophagic biogenesis, HEPES could potentially affect the outcome of studies in diverse research disciplines. For example, numerous studies have demonstrated that autophagy induction counteracts the deposition of aggregate-prone proteins, such as mutant H (huntingtin), SNCA/α-synuclein, and the pathological PRNP (prion protein; PRNPSc) [Citation54,Citation55]. In fact, HEPES has recently been shown to interfere with the build-up of PRNPSc in cultured cells [Citation56]. Similarly, by virtue of its ability to induce endo-lysosomal biogenesis, HEPES may pose a confounding factor in cancer stem cell research by potentiating the WNT signaling pathway [Citation18,Citation57]. In addition, as shown here, the impact of HEPES is most penetrant in scavenging cell types such as macrophages, leading to altered host-immune responses and polarization state. Lastly, HEPES supplementation to culture media likely alters the outcome of high-throughput screenings and lysosomal storage disorder diagnostics via boosting the lysosomal machinery. It should however be noted that the confounding effects of HEPES depend on the cell type (e.g., the intrinsic rate of fluid-phase endocytosis) and duration of the incubation period.
In conclusion, our study calls for caution when utilizing zwitterionic buffering agents in culture media. We have shown here that HEPES addition to cell growth media affects core aspects of the lysosomal-autophagic machinery and inflammatory signaling. Given that the lysosome is at the very center of nutrient-sensing and stress adaptation, this has major implications for studying a wide range of metabolic processes, such as autophagy, immunology, cancer, and neurodegeneration.
Materials and methods
Cell culture and siRNAs
The RAW264.7 cell line (ATCC, TIB-71) was cultured in DMEM (Thermo Fisher Scientific, 31966), DMEM (32430; containing HEPES), RPMI (61870), or RPMI (22409; Dutch modification), supplemented with 10% fetal calf serum (Invitrogen, 10270106) and antibiotics (pen-strep) in a humidified incubator at 37°C and 5% CO2. Where indicated, culture-grade HEPES (Thermo Fisher Scientific, 15630) was added to DMEM. HEK293T (CRL-3216), HepG2 (HB-8065), 3T3-L1(CL-173), C2C12 (CRL-1772) and HeLa (CCL-2) cells (all from ATCC) were grown in DMEM (31966) or DMEM (32430); containing HEPES. For buffer comparison, PIPES disodium salt (Sigma, P3768) and MES (Sigma, M3671) were added to DMEM as indicated. For the siRNA experiments, RAW cells were seeded at a density of 3 × 10⁵ cells/ml 3 h prior to transfection. Cells were transfected with 2 siRNA sequences per gene target. The used siRNA sequences were as follows: Tfeb (QIAGEN: SI01444394, SI01444408), Tfe3 (SI01444415, SI05181435), Mitf (SI02687692, SI02709637), and control (CTRL) siRNA (SI03650318) at a final concentration of 50 nM according to manufacturer's instructions. Gene expression analysis was performed 48 h post transfection.
Cell viability assays
Cell viability was determined using the WST1 reagent (Sigma, 5015944001) according to the manufacturer's instructions. The absorbance at 450 nm was measured using an ELISA plate reader (Synergy BioTek). The propidium iodide (PI; Thermo Fisher Scientific, P1304MP) exclusion assay was performed as follows: RAW264.7 cells were gently scraped and washed in phosphate-buffered saline (PBS; Gibco, 70011044). A cell suspension (1 × 10⁶/100 µL) was incubated with 5 µL PI (10 µg/ml) for 2 min prior to flow cytometric analysis (FL2).
Western blot analysis and antibodies
Cell lysates were prepared in RIPA buffer (150 mM NaCl, 50 mM Tris-HCl, pH 7.4, 2 mM EDTA, 10 mM NaF, 1 mM Na3VO4, 1 mM PMSF (Sigma, P7626), 0.5% sodiumdeoxycholate 1% Triton X-100 (Sigma, X100), supplemented with protease (Sigma, 11697498001) and phosphatase (Sigma, 4906845001) inhibitors. Lysates were cleared by centrifugation at 4°C for 15 min at 12,000 x g and protein concentrations were determined using the BCA method (Thermo Fisher Scientific, 23225). Samples were boiled, separated by SDS-PAGE, and transferred to nitrocellulose. Membranes were saturated with 5% (w:v) bovine serum albumin (Sigma, A1906) in PBS-0.1% Tween-20 (Sigma, P1379) for 2 h at room temperature (RT), and probed overnight at 4°C with the following antibodies: GPNMB (R&D systems, AF2330), LC3B (Cell Signaling Technology, 4108), CTSD (house made), MITF (Exalpha Biologicals Inc, X1405M), TFEB (Bethyl Lab Inc, A303-673A), TUBA (α-tubulin; Cedarlane, CLT9002), LMNB1 (Lamin B; Santa Cruz Biotechnology, SC6216), total RPS6 (Cell Signaling, 2217S), phosphorylated RPS6 (Cell Signaling Technology, 4856S), total EIF4EBP (Cell Signaling Technology, 69445S), and phosphorylated EIF4EBP (Cell Signaling Technology, 94595). For detection, membranes were exposed to matching IRdye-conjugated antibodies (Westburg BV, 926–23313/-32214/-32210/-32211) and analyzed with the Odyssey V3.0 Infrared Imaging System (LI-COR Biosciences).
Immunofluorescence
RAW264.7 cells were cultured on glass coverslips in the presence of HEPES (25 mM), sucrose (80 mM, Sigma, S7903), or Torin1 (400 nM, Tocris, 4247) for 6 h. Cells were fixed in ice-cold methanol (Biosolve, 13680502) for 10 min at −20°C. Cells were then stained with primary abs for TFEB, MITF or TFE3, and detected with Alexa Fluor 488 targeting mouse or rabbit IgG (Invitrogen, A2102 and A21206 resp.). Representative images were captured with a Confocal SP5 LEICA (Leica Microsystem, USA) with a 63x objective, using an excitation wavelength of 488 nm. For LAMP1 staining, cells were fixed in 4% (w:v) paraformaldehyde in PBS (pH 7.4), for 30 min at RT. Primary antibodies against LAMP1 (Abcam, ab24170) were detected with Alexa Fluor 647 and visualized using an EVOS microscope (Thermo Fisher Scientific). To monitor fluid-phase endocytosis, RAW cells were cultured in serum-free DMEM for 4 h followed by LY294002 (50 μM; Sigma, L9908) treatment for 30 min. Thereafter, FITC-labeled dextran (Sigma, 46944) was added to the culture media (1 mg/ml) for a final 30 min. Cells were rinsed in ice-cold PBS and monitored using the EVOS microscope.
Real-time PCR
Total RNA was isolated using the NucleoSpin II extraction kit (Macherey Nagel, 740955-250). Equal amounts of total RNA were used to synthesize cDNA according to the manufacturer's method (Invitrogen, 18091200). Analysis of gene expression was performed with the iCycler MyiQTM system (Bio-Rad) with initial denaturation at 95°C for 10 min, followed by 40 PCR cycles, each consisting of 95°C for 15 sec, 60°C for 1 min, and 72°C for 1 min. mRNA expression was calculated using the ΔΔCt method, relative to Rplp0. Oligonucleotide sequences are available upon request.
RNA-seq analysis
RAW cells were cultured in DMEM in the presence of either HEPES (25 mM), IL4 (50 ng/ml; R&D systems, 404-ML-010), and LPS (50 ng/ml; Salmonella Minnesota R595; Enzo Life Sciences), for 24 h. RNA was isolated with the NucleoSpin II extraction kit, and was submitted for sequencing at the Genomics Core Facility at the Icahn Institute and Department of Genetics (http://icahn.mssm.edu/research/genomics/core-facility). cDNA libraries were prepared with the Illumina Ribo-Zero Gold rRNA (MRZG126) removal kit. Samples were run on Illumina HiSeq 2000 at a read-length of 100 nucleotides single end, and at a sequencing depth of ∼50 million reads per sample. Raw and processed data were returned and count files were generated by aligning to mouse genome mm10 (GRCm38.75) with STAR [Citation58]. Counting overlaps with exons were grouped at the gene level with featureCounts [Citation59]. A differential expression study was conducted with R package limma (Voom transformation) [Citation60]. Low count genes were removed in the limma analysis, genes were kept if they had at least 1 count per million in at least 3 samples. The cut-off value for differential expression was chosen at an adjusted p-value (Benjamini-Hochberg) of <0.05 unless otherwise stated.
In silico analysis
GSEA was performed using a desktop software application (v2.2.2) [Citation61] on a pre-ranked list of differentially expressed genes (based on the log-fold change of HEPES vs. DMEM Ctrl incubations) using custom gene sets for lysosomal-autophagic and host-immune response genes carrying either validated CLEAR-consensus elements [Citation12,Citation15] or E-box consensus motifs [Citation46]. Additional options selected included 1000 permutations and a weighted enrichment statistic. The Rank-rank hypergeometric overlap test was performed using software implemented on http://systems.crump.ucla.edu/rankrank/rankranksimple.php [Citation62]. From each set of treatments—HEPES, LPS, IL4—a pre-ranked list of genes was generated based on the log fold change differences in gene expression between the treated and nontreated condition. The following parameters were selected: step size of 100; Bejamini-Yekutieli p-value correction; and rank and metric scatter plot generation. Pathway enrichment analysis on differentially expressed genes was performed using ClueGo (v2.1.7) and CluePedia (v1.1.7) plug-ins in Cytoscape (v3.1.0) with the KEGG pathway database (10.04.2016 download) [Citation63-65]. The pathways with a Benjamin-Hochberg corrected p-value <0.005 are shown. The heatmap was generated using heatmap.2 function in gplots R package (http://CRAN.R-project.org/package=gplots).
Secretome analysis
RAW264.7 cells were cultured in 25 mM HEPES containing DMEM or in DMEM alone for 48h. Secreted cytokine levels blotted and analyzed using a Mouse Cytokine Array Panel A Kit (R&D Systems, ARY006) using the manufacturer's instructions.
Analysis of lysosomal parameters
RAW cells were rinsed 3 times and gently scraped in PBS. Following centrifugation and cell counting, equal cell suspensions were stained with 50 nM LysoTracker Green DND-26 (Thermo Fisher Scientific, L7526) for 10 min or exposed to 50 µg/ml DQ™ Green BSA (Thermo Fisher Scientific, D12050) for 3 h at 37°C, washed in PBS, and analyzed by flow cytometry (FACS Calibur, BD Biosciences) to evaluate lysosomal mass and proteolytic activity. Lysosomal acidification was assayed using 1 µM LysoSensor™ Green DND-189 (Thermo Fisher Scientific, L7535) for 30 min at 37°C, and lysosomal pH was assayed with LysoSensor™ Yellow/Blue DND-160 (Thermo Fisher Scientific, L7545) at 37°C for 1 h. RAW cells were analyzed directly or equilibrated in MES buffer (25 mM MES, 5 mM NaCl, 115 mM KCl, 1.2 mM MgSO4) supplemented with monensin (10 µM; Sigma, M5273) and nigericin (10 µM; Sigma, N7142); pH ranging from 4.0-6.0. Excitation and emission spectra (329 and 440; 384 and 540) were determined in a Perkin-Elmer LS55 spectrometer. The yellow:blue ratio emission was plotted against the pH calibration curve and pH values were calculated.
Lysosomal enzymatic activity
For GBA1-related glucosidase activity, 4-methylumbelliferyl (4-MU)-β-D-glucopyranoside (Sigma, M3633) was utilized as an artificial substrate at 37°C, in 150 mM citric acid-Na2HPO4 (pH 5.2) buffer supplemented with 0.2% sodium taurocholate (Sigma, T0557), 0.1% Triton X-100 and 0.1% BSA. The enzymatic reaction was stopped with NaOH-glycine (pH 10.6) and fluorescence of liberated 4-MU was determined with a fluorometer LS55 (Perkin Elmer) using λex 366 nm and λem 445 nm.
Activity-based probe analysis
ABP-MDW941/Inhibody Red [Citation34] was used (1 nM for 16 h; synthesized in reference [Citation34]) to label active endogenous GBA1 molecules in RAW cells. Images were taken with a confocal SP5 Leica with a 63x objective using an excitation wavelength of 561 nm. For cysteine cathepsin labeling, ABP DCG-04 [Citation35] was added (500 nM for 2 h; synthesized in reference [Citation35]) to cells. After rinsing in PBS, cell homogenates were prepared in KPi lysis buffer (25 mM K2HPO4/KH2PO4, pH 6.5, 0.1% [v:v] Triton X-100) supplemented with protease inhibitors. After protein separation with SDS-PAGE (10%), fluorescence was subsequently monitored in wet slab gels with a Typhoon Variable Mode Imager (Amersham Biosciences) using λex 488 nm and λem 520 nm (bandpass 40).
GPNMB ELISA
Secreted GPNMB levels in culture media were determined using a mouse GPNMB ELISA according to the instructions of the manufacturer (R&D systems, DY2330).
Transmission electron microscopy
RAW cells were maintained as described and fixed at RT by addition of Karnovsky fixative (2.5% glutaraldehyde, 2% formaldehyde solution in 0.2 M cacodylate buffer, pH 7.4) 1:1 to growth media for 10 min. This was replaced by fresh fixative for 2 h at RT. Thereafter, cells were post-fixed with 1% OsO4, 1.5% K3Fe(III)(CN)6 in 0.1 M cacodylate buffer, for 2 h at RT. Cells were then dehydrated and embedded in Epon epoxy resin (Polysciences, 02334–500). Ultrathin sections of 60 nm were contrasted with uranyl acetate and lead citrate using the AC20 (Leica) and studied with a Jeol 1010 electron microscope (Jeol Europe).
Statistics
Values are presented as mean ± SEM. Statistical significance was analyzed with a 2-tailed unpaired Student t test. Criterion for statistical significance was set on P < 0.05, unless stated otherwise.
Disclosure of potential conflicts of interest
No potential conflicts of interest were disclosed.
supp_data_1419118.zip
Download Zip (6 MB)Acknowledgments
We are grateful to all members of the Aerts laboratory for helpful and stimulating discussions, in particular Dr. Alfred J. Meijer (Dept. of Medical Biochemistry).
Additional information
Funding
Related Research Data
References
- De Duve C, Pressman BC, Gianetto R, et al. Tissue fractionation studies. 6. Intracellular distribution patterns of enzymes in rat-liver tissue. Biochem J. 1955 Aug;60(4):604–617. PubMed PMID: 13249955; PubMed Central PMCID: PMC1216159. doi:10.1042/bj0600604.
- Settembre C, Fraldi A, Medina DL, et al. Signals from the lysosome: a control centre for cellular clearance and energy metabolism. Nat Rev Mol Cell Biol. 2013 May;14(5):283–296. doi: 10.1038/nrm3565. PubMed PMID: 23609508; PubMed Central PMCID: PMC4387238.
- Bar-Peled L, Sabatini DM. Regulation of mTORC1 by amino acids. Trends Cell Biol. 2014 Jul;24(7):400–406. doi: 10.1016/j.tcb.2014.03.003. PubMed PMID: 24698685; PubMed Central PMCID: PMCPMC4074565.
- Meijer AJ, Codogno P. Autophagy: regulation and role in disease. Crit Rev Clin Lab Sci. 2009;46(4):210–240. doi: 10.1080/10408360903044068. PubMed PMID: 19552522.
- Aerts JM, Hollak C, Boot R, et al. Biochemistry of glycosphingolipid storage disorders: implications for therapeutic intervention. Philos Trans R Soc Lond B Biol Sci. 2003 May 29;358(1433):905–914. doi: 10.1098/rstb.2003.1273. PubMed PMID: 12803924; PubMed Central PMCID: PMC1693181.
- Platt FM. Sphingolipid lysosomal storage disorders. Nature. 2014 Jun 5;510(7503):68–75. doi: 10.1038/nature13476. PubMed PMID: 24899306.
- Parenti G, Andria G, Ballabio A. Lysosomal storage diseases: from pathophysiology to therapy. Annu Rev Med. 2015;66:471–486. doi: 10.1146/annurev-med-122313-085916. PubMed PMID: 25587658.
- Folick A, Oakley HD, Yu Y, et al. Aging. Lysosomal signaling molecules regulate longevity in Caenorhabditis elegans. Science. 2015 Jan 2;347(6217):83–86. doi: 10.1126/science.1258857. PubMed PMID: 25554789; PubMed Central PMCID: PMC4425353.
- Xu X, Grijalva A, Skowronski A, et al. Obesity activates a program of lysosomal-dependent lipid metabolism in adipose tissue macrophages independently of classic activation. Cell Metab. 2013 Dec 3;18(6):816–830. doi: 10.1016/j.cmet.2013.11.001. PubMed PMID: 24315368; PubMed Central PMCID: PMCPMC3939841.
- Bieghs V, Walenbergh SM, Hendrikx T, et al. Trapping of oxidized LDL in lysosomes of Kupffer cells is a trigger for hepatic inflammation. Liver Int. 2013 Aug;33(7):1056–1061. doi: 10.1111/liv.12170. PubMed PMID: 23617943; PubMed Central PMCID: PMC4040540.
- Perera RM, Stoykova S, Nicolay BN, et al. Transcriptional control of autophagy-lysosome function drives pancreatic cancer metabolism. Nature. 2015 Aug 20;524(7565):361–365. doi: 10.1038/nature14587. PubMed PMID: 26168401.
- Sardiello M, Palmieri M, di Ronza A, et al. A gene network regulating lysosomal biogenesis and function. Science. 2009 Jul 24;325(5939):473–477. doi: 10.1126/science.1174447. PubMed PMID: 19556463.
- Steingrimsson E, Copeland NG, Jenkins NA. Melanocytes and the microphthalmia transcription factor network. Annu Rev Genet. 2004;38:365–411. doi: 10.1146/annurev.genet.38.072902.092717. PubMed PMID: 15568981.
- Settembre C, Di Malta C, Polito VA, et al. TFEB links autophagy to lysosomal biogenesis. Science. 2011 Jun 17;332(6036):1429–1433. doi: 10.1126/science.1204592. PubMed PMID: 21617040; PubMed Central PMCID: PMCPMC3638014.
- Palmieri M, Impey S, Kang H, et al. Characterization of the CLEAR network reveals an integrated control of cellular clearance pathways. Hum Mol Genet. 2011 Oct 1;20(19):3852–3866. doi: 10.1093/hmg/ddr306. PubMed PMID: 21752829.
- Martina JA, Diab HI, Lishu L, et al. The nutrient-responsive transcription factor TFE3 promotes autophagy, lysosomal biogenesis, and clearance of cellular debris. Sci Signal. 2014 Jan 21;7(309):ra9. doi: 10.1126/scisignal.2004754. PubMed PMID: 24448649; PubMed Central PMCID: PMC4696865.
- Aksan I, Goding CR. Targeting the microphthalmia basic helix-loop-helix-leucine zipper transcription factor to a subset of E-box elements in vitro and in vivo. Mol Cell Biol. 1998 Dec;18(12):6930–6938. PubMed PMID: 9819381; PubMed Central PMCID: PMCPMC109276. doi:10.1128/MCB.18.12.6930.
- Ploper D, Taelman VF, Robert L, et al. MITF drives endolysosomal biogenesis and potentiates Wnt signaling in melanoma cells. Proc Natl Acad Sci U S A. 2015 Feb 3;112(5):E420–E429. doi: 10.1073/pnas.1424576112. PubMed PMID: 25605940; PubMed Central PMCID: PMC4321275.
- Sancak Y, Peterson TR, Shaul YD, et al. The Rag GTPases bind raptor and mediate amino acid signaling to mTORC1. Science. 2008 Jun 13;320(5882):1496–1501. doi: 10.1126/science.1157535. PubMed PMID: 18497260; PubMed Central PMCID: PMCPMC2475333.
- Sancak Y, Bar-Peled L, Zoncu R, et al. Ragulator-Rag complex targets mTORC1 to the lysosomal surface and is necessary for its activation by amino acids. Cell. 2010 Apr 16;141(2):290–303. doi: 10.1016/j.cell.2010.02.024. PubMed PMID: 20381137; PubMed Central PMCID: PMC3024592.
- Zoncu R, Bar-Peled L, Efeyan A, et al. mTORC1 senses lysosomal amino acids through an inside-out mechanism that requires the vacuolar H(+)-ATPase. Science. 2011 Nov 4;334(6056):678–683. doi: 10.1126/science.1207056. PubMed PMID: 22053050; PubMed Central PMCID: PMC3211112.
- Bar-Peled L, Schweitzer LD, Zoncu R, et al. Ragulator is a GEF for the rag GTPases that signal amino acid levels to mTORC1. Cell. 2012 Sep 14;150(6):1196–1208. doi: 10.1016/j.cell.2012.07.032. PubMed PMID: 22980980; PubMed Central PMCID: PMCPMC3517996.
- Sarbassov DD, Ali SM, Sabatini DM. Growing roles for the mTOR pathway. Curr Opin Cell Biol 2005 12/2005;17(6):596–603. doi: S0955-0674(05)00148-1 [pii];10.1016/j.ceb.2005.09.009 [doi].
- Wullschleger S, Loewith R, Hall MN. TOR signaling in growth and metabolism. Cell. 2006 2/10/2006;124(3):471–484. doi: S0092-8674(06)00108-5 [pii];10.1016/j.cell.2006.01.016 [doi].
- Laplante M, Sabatini DM. mTOR signaling in growth control and disease. Cell. 2012 Apr 13;149(2):274–293. doi: 10.1016/j.cell.2012.03.017. PubMed PMID: 22500797; PubMed Central PMCID: PMC3331679.
- Ganley IG, Lam du H, Wang J, et al. ULK1.ATG13.FIP200 complex mediates mTOR signaling and is essential for autophagy. J Biol Chem. 2009 May 1;284(18):12297–12305. doi: 10.1074/jbc.M900573200. PubMed PMID: 19258318; PubMed Central PMCID: PMCPMC2673298.
- Hosokawa N, Hara T, Kaizuka T, et al. Nutrient-dependent mTORC1 association with the ULK1-Atg13-FIP200 complex required for autophagy. Mol Biol Cell. 2009 Apr;20(7):1981–1991. doi: 10.1091/mbc.E08-12-1248. PubMed PMID: 19211835; PubMed Central PMCID: PMCPMC2663915.
- Jung CH, Jun CB, Ro SH, et al. ULK-Atg13-FIP200 complexes mediate mTOR signaling to the autophagy machinery. Mol Biol Cell. 2009 Apr;20(7):1992–2003. doi: 10.1091/mbc.E08-12-1249. PubMed PMID: 19225151; PubMed Central PMCID: PMCPMC2663920.
- Settembre C, Zoncu R, Medina DL, et al. A lysosome-to-nucleus signalling mechanism senses and regulates the lysosome via mTOR and TFEB. EMBO J. 2012 Mar 07;31(5):1095–1108. doi: 10.1038/emboj.2012.32. PubMed PMID: 22343943; PubMed Central PMCID: PMCPMC3298007.
- Martina JA, Chen Y, Gucek M, et al. MTORC1 functions as a transcriptional regulator of autophagy by preventing nuclear transport of TFEB. Autophagy. 2012 Jun;8(6):903–914. doi: 10.4161/auto.19653. PubMed PMID: 22576015; PubMed Central PMCID: PMCPMC3427256.
- Roczniak-Ferguson A, Petit CS, Froehlich F, et al. The transcription factor TFEB links mTORC1 signaling to transcriptional control of lysosome homeostasis. Sci Signal. 2012 Jun 12;5(228):ra42. doi: 10.1126/scisignal.2002790. PubMed PMID: 22692423; PubMed Central PMCID: PMC3437338.
- Martina JA, Puertollano R. Rag GTPases mediate amino acid-dependent recruitment of TFEB and MITF to lysosomes. J Cell Biol. 2013 Feb 18;200(4):475–491. doi: 10.1083/jcb.201209135. PubMed PMID: 23401004; PubMed Central PMCID: PMC3575543.
- Gabriel TL, Tol MJ, Ottenhof R, et al. Lysosomal stress in obese adipose tissue macrophages contributes to MITF-dependent Gpnmb induction. Diabetes. 2014 Oct;63(10):3310–3323. doi: 10.2337/db13-1720. PubMed PMID: 24789918.
- Witte MD, Kallemeijn WW, Aten J, et al. Ultrasensitive in situ visualization of active glucocerebrosidase molecules. Nat Chem Biol. 2010 Dec;6(12):907–913. doi: 10.1038/nchembio.466. PubMed PMID: 21079602.
- Lennon-Dumenil AM, Bakker AH, Maehr R, et al. Analysis of protease activity in live antigen-presenting cells shows regulation of the phagosomal proteolytic contents during dendritic cell activation. J Exp Med. 2002 Aug 19;196(4):529–540. PubMed PMID: 12186844; PubMed Central PMCID: PMCPMC2196045. doi:10.1084/jem.20020327.
- Voss EW Jr., Workman CJ, Mummert ME. Detection of protease activity using a fluorescence-enhancement globular substrate. Biotechniques. 1996 Feb;20(2):286–291. PubMed PMID: 8825159.
- Klionsky DJ, Abdelmohsen K, Abe A, et al. Guidelines for the use and interpretation of assays for monitoring autophagy (3rd edition). Autophagy. 2016;12(1):1–222. doi: 10.1080/15548627.2015.1100356. PubMed PMID: 26799652; PubMed Central PMCID: PMCPMC4835977.
- Cohn ZA, Ehrenreich BA. The uptake, storage, and intracellular hydrolysis of carbohydrates by macrophages. J Exp Med. 1969 Jan 01;129(1):201–225. PubMed PMID: 5782768; PubMed Central PMCID: PMCPMC2138593. doi:10.1084/jem.129.1.201.
- Karageorgos LE, Isaac EL, Brooks DA, et al. Lysosomal biogenesis in lysosomal storage disorders. Exp Cell Res. 1997 Jul 10;234(1):85–97. doi: 10.1006/excr.1997.3581. PubMed PMID: 9223373.
- Helip-Wooley A, Thoene JG. Sucrose-induced vacuolation results in increased expression of cholesterol biosynthesis and lysosomal genes. Exp Cell Res. 2004 Jan 01;292(1):89–100. PubMed PMID: 14720509. doi:10.1016/j.yexcr.2003.09.003.
- Araki N, Johnson MT, Swanson JA. A role for phosphoinositide 3-kinase in the completion of macropinocytosis and phagocytosis by macrophages. J Cell Biol. 1996 Dec;135(5):1249–1260. PubMed PMID: 8947549; PubMed Central PMCID: PMCPMC2121091. doi:10.1083/jcb.135.5.1249.
- Gekle M, Drumm K, Mildenberger S, et al. Inhibition of Na+-H+ exchange impairs receptor-mediated albumin endocytosis in renal proximal tubule-derived epithelial cells from opossum. J Physiol. 1999 Nov 01;520 Pt 3:709–721. PubMed PMID: 10545138; PubMed Central PMCID: PMCPMC2269612. doi:10.1111/j.1469-7793.1999.00709.x.
- Diwu Z, Chen CS, Zhang C, et al. A novel acidotropic pH indicator and its potential application in labeling acidic organelles of live cells. Chem Biol. 1999 Jul;6(7):411–418. PubMed PMID: 10381401. doi:10.1016/S1074-5521(99)80059-3.
- Amyere M, Payrastre B, Krause U, et al. Constitutive macropinocytosis in oncogene-transformed fibroblasts depends on sequential permanent activation of phosphoinositide 3-kinase and phospholipase C. Mol Biol Cell. 2000 Oct;11(10):3453–3467. PubMed PMID: 11029048; PubMed Central PMCID: PMCPMC15006. doi:10.1091/mbc.11.10.3453.
- Canton J, Schlam D, Breuer C, et al. Calcium-sensing receptors signal constitutive macropinocytosis and facilitate the uptake of NOD2 ligands in macrophages. Nat Commun. 2016;7:11284. doi: 10.1038/ncomms11284. PubMed PMID: 27050483; PubMed Central PMCID: PMCPMC4823870.
- Pastore N, Brady OA, Diab HI, et al. TFEB and TFE3 cooperate in the regulation of the innate immune response in activated macrophages. Autophagy. 2016 May 12: 0. doi: 10.1080/15548627.2016.1179405. PubMed PMID: 27171064.
- Huan C, Kelly ML, Steele R, et al. Transcription factors TFE3 and TFEB are critical for CD40 ligand expression and thymus-dependent humoral immunity. Nat Immunol. 2006 Oct;7(10):1082–1091. doi: 10.1038/ni1378. PubMed PMID: 16936731; PubMed Central PMCID: PMCPMC2386253.
- Visvikis O, Ihuegbu N, Labed SA, et al. Innate host defense requires TFEB-mediated transcription of cytoprotective and antimicrobial genes. Immunity. 2014 Jun 19;40(6):896–909. doi: 10.1016/j.immuni.2014.05.002. PubMed PMID: 24882217; PubMed Central PMCID: PMCPMC4104614.
- Brignull LM, Czimmerer Z, Saidi H, et al. Reprogramming of lysosomal gene expression by interleukin-4 and Stat6. BMC Genomics. 2013 Dec 05;14:853. doi: 10.1186/1471-2164-14-853. PubMed PMID: 24314139; PubMed Central PMCID: PMCPMC3880092.
- Ferguson WJ, Braunschweiger KI, Braunschweiger WR, et al. Hydrogen ion buffers for biological research. Anal Biochem. 1980 May 15;104(2):300–310. PubMed PMID: 7446957. doi:10.1016/0003-2697(80)90079-2.
- Poole CA, Reilly HC, Flint MH. The adverse effects of HEPES, TES, and BES zwitterion buffers on the ultrastructure of cultured chick embryo epiphyseal chondrocytes. In Vitro. 1982 Sep;18(9):755–65. PubMed PMID: 6293964. doi:10.1007/BF02796499.
- Medina DL, Di Paola S, Peluso I, et al. Lysosomal calcium signalling regulates autophagy through calcineurin and TFEB. Nat Cell Biol. 2015 Mar;17(3):288–299. doi: 10.1038/ncb3114. PubMed PMID: 25720963; PubMed Central PMCID: PMCPMC4801004.
- Li Y, Xu M, Ding X, et al. Protein kinase C controls lysosome biogenesis independently of mTORC1. Nat Cell Biol. 2016 Oct;18(10):1065–1077. doi: 10.1038/ncb3407. PubMed PMID: 27617930.
- Sarkar S, Davies JE, Huang Z, et al. Trehalose, a novel mTOR-independent autophagy enhancer, accelerates the clearance of mutant huntingtin and alpha-synuclein. J Biol Chem. 2007 Feb 23;282(8):5641–5652. doi: 10.1074/jbc.M609532200. PubMed PMID: 17182613.
- Aguib Y, Heiseke A, Gilch S, et al. Autophagy induction by trehalose counteracts cellular prion infection. Autophagy. 2009 Apr;5(3):361–369. PubMed PMID: 19182537. doi:10.4161/auto.5.3.7662.
- Delmouly K, Belondrade M, Casanova D, et al. HEPES inhibits the conversion of prion protein in cell culture. J Gen Virol. 2011 May;92(Pt 5):1244–1250. doi: 10.1099/vir.0.027334-0. PubMed PMID: 21289158.
- Dobrowolski R, Vick P, Ploper D, et al. Presenilin deficiency or lysosomal inhibition enhances Wnt signaling through relocalization of GSK3 to the late-endosomal compartment. Cell Rep. 2012 Nov 29;2(5):1316–1328. doi: 10.1016/j.celrep.2012.09.026. PubMed PMID: 23122960; PubMed Central PMCID: PMC3538832.
- Dobin A, Davis CA, Schlesinger F, et al. STAR: ultrafast universal RNA-seq aligner. Bioinformatics. 2013 Jan 1;29(1):15–21. doi: 10.1093/bioinformatics/bts635. PubMed PMID: 23104886; PubMed Central PMCID: PMCPMC3530905.
- Liao Y, Smyth GK, Shi W, et al. featureCounts: an efficient general purpose program for assigning sequence reads to genomic features. Bioinformatics. 2014 Apr 1;30(7):923–930. doi: 10.1093/bioinformatics/btt656. PubMed PMID: 24227677.
- Smyth GK. Linear models and empirical bayes methods for assessing differential expression in microarray experiments. Stat Appl Genet Mol Biol. 2004;3: Article3. doi: 10.2202/1544-6115.1027. PubMed PMID: 16646809.
- Subramanian A, Kuehn H, Gould J, et al. GSEA-P: a desktop application for Gene Set Enrichment Analysis. Bioinformatics. 2007 Dec 1;23(23):3251–3253. doi: 10.1093/bioinformatics/btm369. PubMed PMID: 17644558.
- Plaisier SB, Taschereau R, Wong JA, et al. Rank-rank hypergeometric overlap: identification of statistically significant overlap between gene-expression signatures. Nucleic Acids Res. 2010 Sep;38(17):e169. doi: 10.1093/nar/gkq636. PubMed PMID: 20660011; PubMed Central PMCID: PMCPMC2943622.
- Bindea G, Mlecnik B, Hackl H, et al. ClueGO: a Cytoscape plug-in to decipher functionally grouped gene ontology and pathway annotation networks. Bioinformatics. 2009 Apr 15;25(8):1091–1093. doi: 10.1093/bioinformatics/btp101. PubMed PMID: 19237447; PubMed Central PMCID: PMCPMC2666812.
- Bindea G, Galon J, Mlecnik B. CluePedia Cytoscape plugin: pathway insights using integrated experimental and in silico data. Bioinformatics. 2013 Mar 1;29(5):661–663. doi: 10.1093/bioinformatics/btt019. PubMed PMID: 23325622; PubMed Central PMCID: PMCPMC3582273.
- Shannon P, Markiel A, Ozier O, et al. Cytoscape: a software environment for integrated models of biomolecular interaction networks. Genome Res. 2003 Nov;13(11):2498–2504. doi: 10.1101/gr.1239303. PubMed PMID: 14597658; PubMed Central PMCID: PMCPMC403769.