
ABSTRACT
Allergic asthma is a common airway inflammatory disease in which B cells play important roles through IgE production and antigen presentation. SNP (single nucleotide polymorphism) analysis showed that Atg (autophagy-related) allele mutations are involved in asthma. It has been demonstrated that macroautophagy/autophagy is essential for B cell survival, plasma cell differentiation and immunological memory maintenance. However, whether B cell autophagy participates in asthma pathogenesis remains to be investigated. In this report, we found that autophagy was enhanced in pulmonary B cells from asthma-prone mice. Autophagy deficiency in B cells led to attenuated immunopathological symptoms in asthma-prone mice. Further investigation showed that IL4 (interleukin 4), a key effector Th2 cytokine in allergic asthma, was critical for autophagy induction in B cells both in vivo and in vitro, which further sustained B cell survival and enhanced antigen presentation by B cells. Moreover, IL4-induced autophagy depended on JAK signaling via an MTOR-independent, PtdIns3K-dependent pathway. Together, our data indicate that B cell autophagy aggravates experimental asthma through multiple mechanisms.
Abbreviations
| ACTB | = | actin, beta |
| AKT/PKB | = | thymoma viral proto-oncogene |
| ANXA5 | = | annexin A5 |
| APC | = | antigenpresenting cell |
| Atg | = | autophagy-related |
| Atg5-cKO | = | Atg5 conditional knockout |
| BALF | = | bronchoalveolar lavage fluid |
| BECN1 | = | Beclin 1, autophagy related |
| CFSE | = | carboxyfluorescein succinimidyl amino ester |
| CoIP | = | coimmunoprecipitation |
| CQ | = | chloroquine |
| CR2/CD21 | = | complement receptor 2 |
| EIF4EBP1 | = | eukaryotic translation initiation factor 4E binding protein 1 |
| ELISA | = | enzyme-linked immunosorbent assay |
| FCER2A/CD23 | = | Fc receptor, IgE, low affinity II, alpha polypeptide |
| HRP | = | horseradish peroxidase |
| HsIL4 | = | homo sapiens IL4 |
| H2/MHC-II | = | histocompatibility-2, MHC |
| IFNG | = | interferon gamma |
| IL4RA | = | interleukin 4 receptor, alpha |
| Ig | = | Immunoglobulin |
| IL | = | interleukin |
| JAK1 | = | Janus kinase 1 |
| JAK3 | = | Janus kinase 3 |
| LAP | = | LC3-associated phagocytosis |
| MACS | = | magnetic-activated cell separation |
| MAP1LC3B/LC3B | = | microtubule-associated protein 1 light chain 3 beta |
| MLN | = | mesenteric lymph node |
| MTOR | = | mechanistic target of rapamycin (serine/threonine kinase) |
| OT-II/Tg (TcraTcrb) 425Cbn | = | transgene insertion 425, Frank Carbone |
| OVAL/SERPINB14 | = | ovalbumin |
| PAS | = | periodic acid Schiff's staining |
| PBS | = | phosphate-buffered saline |
| PCR | = | polymerase chain reaction |
| PI | = | propidium iodide |
| PIK3C3 | = | phosphatidylinositol 3-kinase catalytic subunit type 3 |
| PIK3R4 | = | phosphoinositide-3-kinase regulatory subunit 4 |
| PtdIns3P | = | phosphatidylinositol-3-phosphate |
| PtdIns3K | = | class III phosphatidylinositol 3-kinase |
| PTPRC/B220 | = | protein tyrosine phosphatase, receptor type, C |
| ROS | = | reactive oxygen species |
| RPS6KB | = | ribosomal protein S6 kinase |
| siRNA | = | small interfering RNA |
| SNP | = | single nucleotide polymorphism |
| STAT6 | = | signal transducer and activator of transcription 6 |
| Th cell | = | T helper cell |
| ULK1 | = | unc-51 like kinase 1 |
| WT | = | wild-type |
| 3-MA | = | 3-methyladenine |
| 7AAD | = | 7-Amino-Actinomycin D |
Introduction
Asthma is a common chronic respiratory disease with significant morbidity and mortality around the world, which affects about 300 million people of all races and age groups [Citation1]. Emerging evidence has highlighted the importance of autophagy in asthma [Citation2-6]. Autophagy is an evolutionarily conserved cellular process for degrading unfolded or long-lived proteins, impaired cytoplasmic organelles, ROS (reactive oxygen species) and recycling amino acids in eukaryotic cells [Citation7]. Studies have showed that autophagy involves in embryo development, neural degeneration, tumor suppression, metabolism homeostasis and immune defense [Citation7]. SNP analysis shows that Atg5 or Atg7 allele mutations are associated with childhood asthma as well as adult asthma [Citation8]. More double-membrane autophagosomes are observed in epithelial cells of bronchial biopsy samples from asthma patients compared with those from healthy individuals, and the study has also shown that autophagy is induced by ROS in bronchial epithelial cells to sustain cell survival [Citation9]. A recent study also shows that dendritic-cell-specific deletion of Atg5 facilitates neutrophilic airway inflammation and hyper-reactivity [Citation10]. The above studies indicate that autophagy may participate in asthma pathogenesis.
Airway allergic inflammatory response plays a definitive role in the pathogenesis of asthma [Citation11], which involves enhanced pulmonary Th2 response (including increased Th2 cytokine production, such as IL4 and IL13) and a large number of different types of immune cells recruited into the lung of asthma patients, such as granulocytes, dendritic cells, macrophages, T cells and B cells [Citation12,Citation13]. Among those, B cells play essential roles in asthma pathogenesis [Citation14]. Activated B cells participate in asthma pathogenesis through producing antigen-specific antibody and processing and presenting antigen to T cells [Citation15]., [Citation16] Current studies have demonstrated that autophagy plays important roles in B cell biology. Miller B. and colleagues have reported that autophagy is required for the maintenance of B-1a cells and B cell development from pro- to pre-B cells [Citation17], but there is evidence that autophagy is dispensable for B cell development [Citation18]. Several studies have demonstrated that autophagy participates in the differentiation and survival of plasma cells [Citation18-21], and facilitates the maintenance of B cell immunological memory [Citation22]. Moreover, B cell autophagy is involved in regulating antigen presentation to certain types of antigen [Citation23,Citation24]. However, the role of B cell autophagy in asthma as well as the regulation of B cell autophagy in asthmatic allergic condition remains largely unclear.
In the study, we examined the function and regulation of B cell autophagy in asthma-prone mice. We found that autophagy was enhanced in pulmonary B cells of asthma-prone mice. Autophagy deletion in B cells attenuated the immunopathological symptoms of asthma-prone mice. Further investigation demonstrated that IL4 specifically induced autophagy in primary B cells, which sustained B cell survival and promoted B cell antigen presentation. Moreover, IL4-induced autophagy was mediated by JAK signaling via an MTOR-independent and PtdIns3K-dependent pathway. Overall, our study not only extends the knowledge of autophagy regulation in B cells, but also provides new insight in understanding the pathogenesis of asthma.
Results
Autophagy deficiency in B cells attenuates the immunopathological symptoms in asthma-prone mice
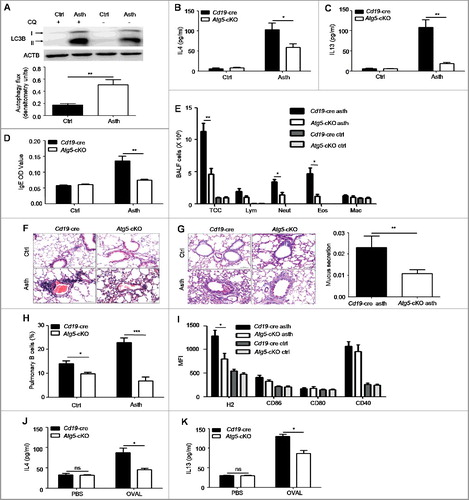
Asthma is a common chronic respiratory disease with significant morbidity and mortality [Citation1], but the pathogenesis of asthma has not been fully understood. A recent study has shown that autophagy is increased in bronchial epithelial cells of biopsy tissues from asthma patients [Citation9]. As autophagy is vital for B cell functions, we wondered whether B cell autophagy was involved in asthma. First, we isolated pulmonary B cells from asthma-prone mice and control mice, and assessed autophagy flux by immunoblotting analysis. It was found that autophagy flux was enhanced in pulmonary B cells of asthma-prone mice compared to control mice ((A)), which suggested that B cell autophagy might participate in the pathogenesis of asthma. To determine whether B cell autophagy participated in asthma in vivo, we bred mice with B cell-specific deletion of Atg5 (Atg5-cKO, Atg5 conditional knockout henceforth in the text) by crossing Cd19-cre mice with Atg5flox/flox mice. OVAL-sensitized asthma models were generated with Atg5-cKO mice and Cd19-cre mice by immunizing with OVAL in aluminum adjuvant on d 1 and d 14 intraperitoneally. On d 21 to 23, mice were challenged with atomized OVAL (Sigma, A5503; 2.5% w:v in PBS) for 30 min every day. Th2 cytokine production in BALF (bronchoalveolar lavage fluid), OVAL-specific IgE production in serum as well as inflammatory cells infiltration and mucus production in bronchi were monitored. Our data showed that IL4 and IL13 production in BALF and OVAL-specific IgE production in serum were notably increased in Cd19-cre asthma-prone mice, but these parameters were much lower in Atg5-cKO asthma-prone mice ((B–D)). Moreover, we found that inflammatory cells infiltration in BALF and pulmonary parenchyma ((E,F)) and mucus production in bronchi ((G)) were reduced in Atg5-cKO asthma-prone mice compared to Cd19-cre asthma-prone mice. The data indicated that autophagy deficiency in B cells attenuated the immunopathological symptoms of asthma.
Figure 1. Autophagy deficiency in B cells attenuates the immunopathological symptoms in the murine asthma model. (A) Pulmonary B cells were purified from control mice) and asthma-prone mice, and treated with or without CQ for 3 h. The accumulation of LC3B-II was measured by immunoblotting of whole cell lysates. Bar graph represents mean ± SEM of autophagy flux through measuring the difference of LC3B-II intensity in cells treated with and without CQ. Ctrl, control mice; Asth, asthma-prone mice. Experiments were performed using cells from a pool of 10 to 15 mice per group. **P < 0.01, determined by the Student t test. Data are representative of 3 independent experiments. (B to D) BALF (Bronchoalveolar lavage fluid) and serum were harvested from Cd19-cre asthma-prone mice or Atg5-cKO asthma-prone mice. The production of IL4 (B) and IL13 (C) in BALF and OVAL-specific IgE (D) in serum were measured by ELISA, n = 5 per group; *, P<0.05; **, P<0.01; calculated by the Student t test (B) or Mann-Whitney test (C and D). Data are representative of 3 independent experiments. (E) Quantification of inflammatory cell infiltration in BALF by flow cytometry. Data are presented as mean ± SEM. TCC, total cell number; Lym, lymphocytes; Neut, neutrophils; Eos, eosinophils; Mac, macrophages. n = 5 per group; *P < 0.05; **P < 0.01; determined by the Student t test. Data are representative of 3 independent experiments. (F) Representative images of hematoxylin- and eosin-stained lung tissue sections of Cd19-cre asthma-prone mice and Atg5-cKO asthma-prone mice (magnification × 200; scale bars: 50 μm). (G) Representative images of PAS-stained lung tissue sections of Cd19-cre asthma-prone mice and Atg5-cKO asthma-prone mice (maginification × 200; scale bars: 50 μm). Bar graph represents mean ± SEM of bronchi mucus production analyzed by ImageJ software, n = 5 per group; **, P<0.01; determined by the Mann-Whitney test. Data are representative of 3 independent experiments. (H and I) Flow cytometry analysis of the frequency (H) and phenotype (I) of pulmonary B cells from control mice or asthma-prone mice generated with Atg5-cKO mice or Cd19-cre mice. Pulmonary infiltrated lymphocytes were stained with CD19, H2, CD86, CD80 and CD40. Data are presented as mean ± SEM; *, P<0.05; ***, P<0.001; determined by the Student t test. Data are representative of 2 independent experiments. (J and K) Pulmonary CD4+ T cells of WT asthma-prone mice were cocultured with splenic B cells of Cd19-cre controls or of Atg5-cKO mice in the presence or absence of OVAL for 5 d. The amount of IL4 (J) or IL13 (K) in the supernatant was assessed by ELISA. Data are represented as mean ± SEM. Experiments were performed in triplicate using cells from a pool of 10 mice; *, P<0.05; ns, not statistically significant; determined by the Student t test. Data are representative of 3 independent experiments.
Next, we studied how B cell autophagy regulated the immunopathological symptoms of asthma. Previous studies have reported that autophagy regulates B cell development and plasma cell differentiation [Citation18-21]. We assessed B cell development in the bone marrow, B cell subsets in the spleen and the peritoneal cavity, and plasma cells number in the spleen and the MLN (mesenteric lymph node) from Atg5-cKO asthma-prone mice and Cd19-cre asthma-prone mice. Our data showed that there was no difference in the percentage of pro-B cells or pre-B cells in the bone marrow between Atg5-cKO asthma-prone mice and Cd19-cre asthma-prone mice (Figure S1(A)). Moreover, no difference was found in the percentages of mature B cells, transitional B cells (type 1 and 2), marginal zone B cells and follicular B cells in the spleen of Atg5-cKO asthma-prone mice and Cd19-cre asthma-prone mice (Figure S1(B,C)), which indicated that autophagy deficiency in CD19+ B cells did not affect B cell development in the bone marrow and B cell maturation in the spleen. Furthermore, we found that in the peritoneal cavity, the percentage of B1a cells decreased, but the percentages of B1b and B2 cells had no difference between Atg5-cKO asthma-prone mice and Cd19-cre asthma-prone mice (Figure S1(D)). We also found decreased numbers of plasma cells in the spleen and MLN in Atg5-cKO asthma-prone mice compared to Cd19-cre asthma-prone mice (Figure S1(E,F)), which was consistent with previous findings [Citation17,Citation18,Citation20]. Thus, the decreased plasma cells probably led to reduced serum IgE in Atg5-cKO asthma-prone mice compared to Cd19-cre asthma-prone mice.
As B cells act as antigen-presenting cells during immune response [Citation16], we wondered whether autophagy deficiency impaired B cell antigen presentation and followed Th2 response in asthma-prone mice. To test this hypothesis, we examined the percentage and phenotype of pulmonary B cells in Atg5-cKO asthma-prone mice and Cd19-cre asthma-prone mice. The data showed that the percentage of pulmonary B cells and expression levels of H2 (histocompatibility-2, MHC) on pulmonary B cells were reduced in Atg5-cKO asthma-prone mice compared to Cd19-cre asthma-prone mice ((H,I), Figure S2(A–F)), which suggested that autophagy deletion impaired the survival and antigen presentation of pulmonary B cell. Next, we cocultured pulmonary CD4+ T cells from WT (wild-type) asthma-prone mice with splenic B cells from Atg5-cKO mice or Cd19-cre mice in the presence or absence of OVAL protein for 5 d, the production of IL4 and IL13 in the supernatant was measured by ELISA. Atg5-cKO B cells showed decreased production of IL4 and IL13 in the supernatant ((J,K)), which suggested that autophagy deletion in B cells might attenuate T cell response. Overall, these data demonstrated that autophagy deficiency in B cells attenuated immunopathological symptoms in asthma.
IL4 induces autophagy flux in B cells
Autophagy of immune cells is regulated by cytokines [Citation25]. Recently, it has been reported that IL4 induces autophagy in activated CD4+ Th2 cells [Citation26], and IL13 induces autophagy in bronchial epithelial cells [Citation27]. To verify whether Th2 cytokines regulated B cell autophagy in asthma, we pretreated asthma-prone mice with JANEX-1, a specific JAK3 inhibitor, before atomized OVAL challenge to block signaling activated by Th2 cytokines. Then pulmonary B cells were isolated from asthma-prone mice pretreated with or without JANEX-1 and assessed for autophagy flux. It was found that JANEX-1 treatment reduced B cell autophagy flux induced by asthmatic allergic condition ((A)), which indicated that Th2 cytokines induced autophagy in pulmonary B cells of asthma-prone mice. Th2 cytokines IL4 and IL13 share IL4RA (IL4R in humans) and downstream signaling, and they have similar biological effects on cells [Citation28]. To verify the role of Th2 cytokines in B cell autophagy, murine splenic B cells were directly treated with murine IL4 or IL13 for different time intervals (1.5, 3, 6, 12 and 24 h) in vitro, and the accumulation of MAP1LC3B-II/LC3B-II was assessed by immunoblotting. The data showed that IL4, not IL13, effectively promoted the accumulation of LC3B-II in B cells ((B,C)), which suggested that IL4, instead of IL13, induced autophagy in B cells.
Figure 2. Autophagy is induced by IL4 in primary B cells. (A) WT asthma-prone mice were pretreated with the JAK3 inhibitor JANEX-1 before atomized OVAL challenge. Autophagy flux in isolated pulmonary B cells of asthma-prone mice was assessed as in (A). Ctrl, control mice; Asth, asthma-prone mice. Bar graph represents mean ± SEM of autophagy flux; *P < 0.05, determined by the Student t test. Data are representative of 3 independent experiments. (B and C) Murine splenic B cells were treated with murine IL4 (B) or IL13 (C) for different times (1.5, 3, 6, 12 and 24 h). The accumulation of LC3B-II was assessed by immunoblotting of whole cell lysates. Data are representative of 3 independent experiments. (D) Pulmonary CD4+ T cells of WT asthma-prone mice were cocultured with splenic B cells of WT control mice in the presence of OVAL and/or anti-IL4 (IL4 neutralizing antibody) according to experiment designs. Then cocultured B cells were purified, autophagy flux was assessed as in (A). B, B cells; T, CD4+ T cells. Bar graph represents mean ± SEM of autophagy flux; **P < 0.01, determined by ANOVA with the Tukey post hoc test. Data are representative of 3 independent experiments. (E to G) Murine splenic B cells were treated with IL4 in the presence or absence of anti-IL4 (IL4 neutralizing antibody) for 24 h (E); or treated with IL4 or/and 3-MA for 24 h (F); or treated with IL4 for 24 h, and then CQ for the last 6 h (G). Accumulation of LC3B-II was measured by immunoblotting of whole cell lysates, autophagy flux was measured as in (A). Bar graphs (mean ± SEM) in (E) and (F) represent ACTB-normalized LC3B-II density values. Bar graph in (G) represents mean ± SEM of autophagy flux; *P < 0.05, **P<0.01, determined by ANOVA with the Tukey post hoc test (E); *P<0.05, calculated by the Student t test (F and G). Data are representative of 3 independent experiments. (H) Murine splenic B cells were treated with IL4 for 24 h, and then CQ was added for the last 6 h, LC3B puncta were observed by confocal microscopy. Bar graph (mean ± SEM) represents the number of LC3B puncta per cell from analysis of 100 cells per condition. DAPI was used to denote the cell nucleus. Magnification × 600; scale bars: 5 μm. ***, P<0.001, determined by the Student t test. Data are representative of 3 independent experiments. (I) Murine splenic B cells were left untreated or treated with IL4 for 24 h, double-membrane autophagosomes were observed by transmission electron microscopy. Red arrows showed autophagosomes. Bar graph (mean ± SEM) represents the number of double-membrane autophagosomes per cell by counting 20 cells per condition; *, P<0.05, determined by the Mann-Whitney test. Data are representative of 2 independent experiments.
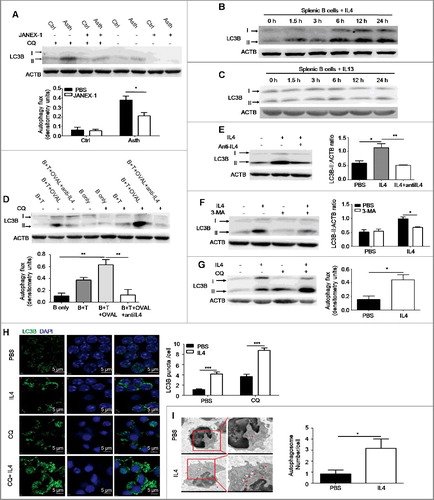
To determine whether endogenous IL4 induced autophagy flux in B cells, we cocultured splenic B cells from control mice with isolated pulmonary CD4+ T cells from asthma-prone mice with OVAL protein. The autophagy flux in B cells was significantly enhanced when cocultured with pulmonary CD4+ T cells in the presence of OVAL protein, an effect almost completely abolished by IL4 neutralizing antibody ((D)). These data suggested that endogenous IL4 was responsible for inducing B cell autophagy during experimental asthma.
In addition, IL4-induced accumulation of LC3B-II was reversed by IL4 neutralizing antibody ((E)) or the autophagy inhibitor 3-MA ((F)). Moreover, IL4 treatment was found to promote autophagy flux in splenic B cells ((G)). Furthermore, we observed autophagosome formation in IL4-treated murine splenic B cells as revealed by confocal microscopy ((H)) and transmission electron microscopy ((I)). Consistent with the immunoblotting analysis ((G)), IL4 facilitated the formation of LC3B puncta in B cells, which was enhanced by CQ (chloroquine) treatment ((H)). As expected, IL4 increased the number of autophagosomes in B cells ((I)).
Finally, we treated human primary B cells with HsIL4 (homo sapiens IL4) in the presence or absence of the JAK3 inhibitor JANEX-1. The result showed that HsIL4 induced autophagy flux in human B cells (Figure S3). Altogether, these data demonstrated the notion that IL4 induced autophagy in both human and murine primary B cells.
IL4-induced autophagy promotes survival and antigen presentation of B cells
Next, we investigated the effects of IL4-induced autophagy on primary B cells. Since IL4 has an antiapoptosis effect on B cells [Citation29], we treated murine splenic B cells with IL4 in the absence or presence of the autophagy inhibitor 3-MA, and examined B cell apoptosis. The results showed that IL4 markedly enhanced B cell survival, which was inhibited by 3-MA ((A)). To exclude the possible cytotoxicity of 3-MA, splenic B cells from Cd19-cre controls and Atg5-cKO mice were purified and treated with IL4 for 24 h, and cell apoptosis was detected. The data showed that Atg5 deficiency reversed the antiapoptosis effect of IL4 ((B)), which indicated that autophagy was essential for the IL4-induced antiapoptosis effect in B cells.
Figure 3. Autophagy participates in the IL4-induced antiapoptosis effect and the IL4-induced expression of H2 and CD86. (A) Murine splenic B cells were treated with IL4 in the presence or absence of 3-MA for 24 h, cell apoptosis was assessed by PI (propidium iodide) and ANXA5 staining via flow cytometry. Representative dot plots and bar graph (mean ± SEM) of the percentage of PI+ ANXA5+ B cells are showed. *, P<0.05; determined by the Mann-Whitney test. Data are representative of 3 independent experiments. (B) Splenic B cells of Cd19-cre mice and Atg5-cKO mice were treated with IL4 for 24 h, and cell apoptosis was assessed by flow cytometry. Representative dot plots and bar graph (mean ± SEM) of the percentage of PI+ ANXA5+ B cells are showed. *, P<0.05; ns, not statistically significant; determined by the Mann-Whitney test. Data are representative of 3 independent experiments. (C) Flow cytometry analysis of the phenotype of B cells after IL4 treatment for 24 h. Cells were stained with 7AAD, CD19, H2, CD86, CD80 and CD40. Representative histograms are shown. Data are representative of at least 3 independent experiments. (D to I) Quantification of H2 and CD86 on WT B cells after 3-MA treatment (D and E), or on Becn1+/− B cells and WT B cells (F and G), or on Atg5-cKO B cells and Cd19-cre B cells (H and I) in the presence or absence of IL4 for 24 h. Data are presented as mean ± SEM. *, P<0.05; **, P<0.01; calculated by the Mann-Whitney test (D, E, H and I) or the Student t test (F and G). Data are representative of 3 independent experiments, respectively. Cells were gated on 7AAD-negative cells to exclude dead cells in these experiments.
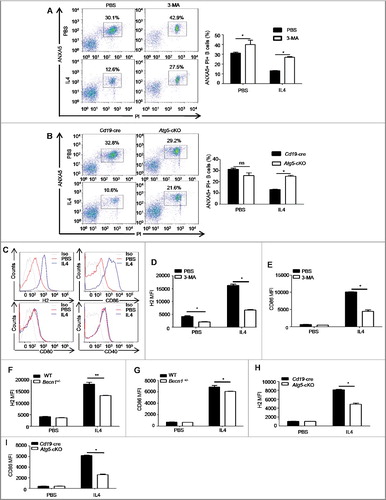
Our previous data showed that autophagy deficiency in B cells reduced H2 expression on pulmonary B cells of asthma-prone mice, also autophagy deletion in B cells might attenuate T cell response in vitro ((I–K)), these data suggested that autophagy probably regulated antigen presentation of B cells. To further confirm the role of autophagy in B cell antigen processing and presentation, we assessed the capacity of OVAL uptake and cytokine expression by Atg5-cKO B cells or Cd19-cre B cells in the presence or absence of IL4. The data showed that autophagy deletion and IL4 treatment did not affect OVAL uptake (Figure S4(A,B)) or cytokine expression (Figure S5(A–F)) by B cells. However, we found that IL4 facilitated the expression of H2 and CD86, but had little effect on the expression of CD80 and CD40 on murine primary B cells ((C)). Moreover, expression levels of H2 and CD86 induced by IL4 were reduced by autophagy inhibitor 3-MA treatment ((D,E)) and autophagy-related genes (Becn1 or Atg5) deletion ((F–I)). Together, these in vitro data demonstrated that IL4-induced autophagy enhanced the expression of H2 and CD86 but did not affect antigen uptake or cytokine secretion by B cells.
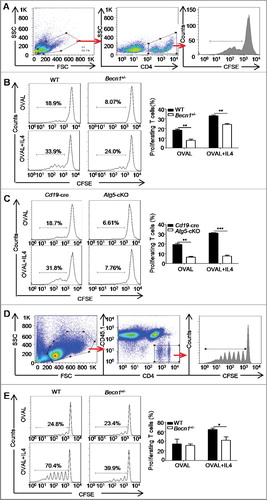
To directly determine the effect of IL4-induced autophagy on B cell antigen presentation, both Becn1+/- B cells and Atg5-cKO B cells were first incubated with OVAL protein, or the OVAL (323-339) peptide or the OVAL IC (OVAL immune complex) in the presence or absence of IL4 for 24 h and then cocultured with carboxyfluorescein succinimidyl amino ester (CFSE)-labeled OT-II (transgene insertion 425, Frank Carbone) CD4+ T cells for 72 h. Flow cytometry analysis showed that IL4-treated B cells exhibited enhanced capacity to promote T cell proliferation when compared to control B cells, which was reversed by autophagy deletion in B cells ((A–C), Figure S6(A–C)), which suggested that IL4-induced autophagy promoted the antigen presentation by B cells. To further confirm these findings in vivo, CFSE-labeled OT-II CD4+ T cells (PTPRCb/CD45.2+) were transferred into PTPRCa/CD45.1+ mice intravenously, then the recipient mice were immunized with OVAL-pulsed WT or Becn1+/- B cells treated with or without IL4, 72 h later, the proliferation of CFSE-labeled CD4+ T cells in axillary lymph nodes was measured by flow cytometry. The data showed that IL4-treated B cells had enhanced capacity to promote T cell proliferation, which was reversed by autophagy deletion ((D,E)). Furthermore, our data showed that anti-CD86 neutralizing antibody substantially attenuated antigen presentation by IL4-treated B cells. Interestingly, IL4 still promoted antigen presentation to T cell even under conditions that CD86 expression was decreased to a similar level in control B cells and IL4-treated B cells after neutralizing antibody treatment (Figure S7(A–C)), suggesting that IL4-induced autophagy enhanced antigen presentation at least partially depending on increased H2 and CD86 on B cells. Overall, these data indicated that IL4-induced autophagy enhanced B cell antigen presentation to antigen-specific CD4+ T cells.
Figure 4. Autophagy participates in the IL4-induced antigen presentation. (A to C) Splenic B cells from Becn1+/− mice and WT mice or from Atg5-cKO mice and Cd19-cre mice were treated with OVAL protein in the presence or absence of IL4, then cocultured with CFSE-labeled OT-II CD4+ T cells for 72 h. The proliferation of CD4+ T cells was measured by flow cytometry. Cell gating strategy is shown (A). Representative histograms and bar graphs (mean ± SEM) (B and C) represent the percentage of proliferating T cells. **, P<0.01; ***, P<0.001; determined by the Student t test. Data are representative of 3 independent experiments. (D and E) CFSE-labeled OT-II CD4+ T cells (PTPRCb/CD45.2+) were transferred into C57BL/6 congenic mice (PTPRCa/CD45.1+) via the tail vein intravenously; the recipient mice were immunized by OVAL-pulsed and/or IL4-treated B cells, and 72 h later, flow cytometry was performed to assess the proliferation of recruited CFSE-labeled OT-II CD4+ T cells in axillary lymph nodes. Cell gating strategy is shown (D). Representative histograms and bar graph (mean ± SEM) (E) represent the percentage of proliferating T cells. *, P<0.05; determined by the Student t test. Data are representative of 3 independent experiments.
IL4-induced autophagy is dependent on JAK signaling
We also studied how IL4 promoted autophagy in B cells. As we know, the binding of IL4 to the IL4-receptor complex activates JAK (Janus kinase; JAK1/3 herein) signaling, which is followed by several classical intracellular cascade pathways, such as the STAT6 pathway and the type I phosphoinositide 3-kinase-AKT pathway [Citation28]. To investigate whether JAK signaling was involved in IL4-induced autophagy, we treated murine splenic B cells with IL4 in the absence or presence of the JAK3 inhibitor JANEX-1 or the JAK1 inhibitor Juxolitinib. Immunoblotting analysis showed that IL4 effectively activated JAK3 and JAK1 signaling in B cells, both of which were inhibited by JANEX-1 or Juxolitinib, respectively ((A,B)). Furthermore, both JANEX-1 and Juxolitinib decreased IL4-induced autophagy flux in B cells ((C–F)). Correspondingly, JANEX-1 also inhibited IL4-induced autophagy flux in human primary B cells (Figure S3). Together, these results demonstrated that IL4-induced autophagy in B cells depended on the activation of the JAK signaling pathway.
Figure 5. JAK signaling is required for IL4-induced autophagy in B cells. (A and B) Murine splenic B cells were treated with IL4 for 15 min in the presence or absence of the JAK3 inhibitor JANEX-1 (A) or the JAK1 inhibitor JUXO (Juxolitinib) (B), respectively. The phosphorylation of JAK3 and JAK1 was detected by immunoblotting of whole cell lysates. Data are representative of 2 independent experiments. (C to F) Murine splenic B cells were treated with IL4 for 24 h in the presence or absence of JANEX-1 (C and E) or JUXO (D and F), respectively. CQ was added for the last 6 h. The accumulation of LC3B-II was measured by immunoblotting of whole cell lysates. Bar graphs (mean ± SEM) represent of the impact of JANEX-1 (E) and JUXO (F) on IL4-induced autophagy flux in B cells as assessed in (A). **, P<0.01; determined by the Student t test. Data are representative of 3 independent experiments.
IL4 promotes the formation and activation of the autophagy-specific PtdIns3K complex
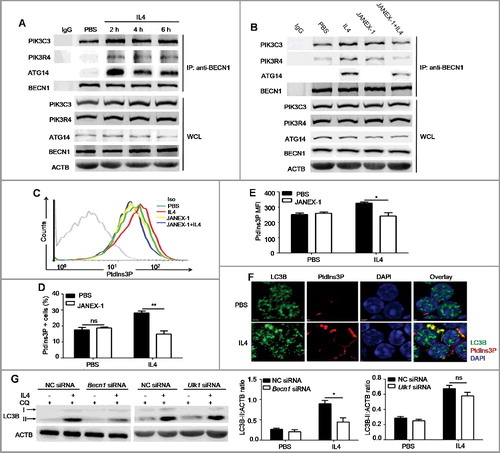
Autophagy is regulated by many molecules, such as ATG proteins and autophagy-related signaling pathways, such as MTOR signaling, and signaling by phosphoinositide- or phosphatidylinositol 3-kinases (including type I, II, III enzymes) [Citation30]. To further elucidate the mechanisms by which IL4-JAK cascade regulated autophagy, we examined the expression of several essential ATG proteins and the activation of signaling pathways in B cells after IL4 stimulation. We did not detect any changes in the expression of ATG5, BECN1 and PIK3C3 (Figure S8), but LC3B-I expression was increased ((B)). Notably, IL4 was found to activate the inhibitory pathways of autophagy including MTOR (EIF4EBP1 and RPS6KB), AKT and STAT6 signaling pathways (Figure S8). Previous studies have showed that the autophagy-specific PtdIns3K complex is essential for the initiation of autophagy because PtdIns3P, the only catalysis product of the kinase, is responsible for the recruitment of essential ATG proteins to the phagophore assembly sites [Citation31]. Thus, we hypothesized that IL4 might regulate the activation of the PtdIns3K complex at the initiative stages of autophagy. The autophagy-specific PtdIns3K complex is composed of the catalytic subunit PIK3C3, the regulative subunit PIK3R4, and the adaptor proteins BECN1 and ATG14. The catalytic activity of the complex is remarkably enhanced after PIK3R4 recruits PIK3C3 to cytoplasmic membrane structures through myristoylation [Citation31]. We performed CoIP assays and found that IL4 promoted the binding of BECN1 to ATG14, PIK3R4 and PIK3C3 in murine primary B cells ((A)), which was inhibited by JANEX-1 ((B)). We also found that IL4 promoted the binding of BECN1 to ATG14, PIK3R4 and PIK3C3 in human primary B cells (Figure S9). Next, we assessed the effect of IL4 on intracellular PtdIns3P production by flow cytometry and found that IL4 notably increased PtdIns3P expression in B cells ((C–E)). Furthermore, the accumulated intracellular PtdIns3P was colocalized with increased LC3B-positive puncta in IL4-treated B cells ((F)), indicating that the increased production of PtdIns3P participated in autophagosome formation. These data indicated that IL4 induced autophagy in B cells via a PtdIns3K-dependent pathway. It is well accepted that MTOR signaling plays an essential role in autophagy inhibition, the activation of MTOR inhibits autophagy mainly through keeping the ULK1 (unc-51 like kinase 1) complex in an inactive state [Citation32-34]. To further verify the role of MTOR and PtdIns3K in IL4-induced autophagy, murine primary B cells were silenced by Becn1 siRNA (small interfering RNA) or Ulk1 siRNA (Figure S10) prior to IL4 treatment. It was found that Becn1 silencing reduced IL4-induced autophagy but Ulk1 silencing had little inhibitory effect on IL4-induced autophagy ((G)). Therefore, these results suggested that IL4 induced autophagy via an MTOR-independent and PtdIns3K-dependent pathway.
Figure 6. IL4 promotes the formation and activation of the autophagy-specific PtdIns3K complex in murine primary B cells. (A) Murine splenic B cells were treated with IL4 for different times (2, 4 and 6 h). The binding of BECN1 to PIK3C3, ATG14 and PIK3R4 was analyzed by CoIP with anti-BECN1 antibody. WCL, whole cell lysates. Data are representative of 3 independent experiments. (B) Murine splenic B cells were treated with IL4 in the presence or absence of the JAK3 inhibitor JANEX-1 for 2 h. The binding of BECN1 to PIK3C3, ATG14 and PIK3R4 was analyzed by CoIP with anti-BECN1 antibody. WCL, whole cell lysates. Data are representative of 3 independent experiments. (C to E) Splenic B cells were treated with IL4 in the presence or absence of JANEX-1, intracellular accumulation of PtdIns3P was measured by flow cytometry (C). Bar graphs (mean ± SEM) represent the percentage of PtdIns3P+ B cells (D) and intracellular PtdIns3P MFI (mean fluorescence intensity) (E). Iso, isotype control antibody. *, P<0.05; **, P<0.01; ns, not statistically significant; determined by the Student t test. Data are representative of 3 independent experiments. (F) The location of cytoplasmic PtdIns3P and LC3B puncta in B cells after IL4 treatment was observed by confocal microscopy. DAPI was used to denote the cell nucleus. Data are representative of 2 independent experiments. (G) Becn1 silencing or Ulk1 silencing was performed in murine primary B cells, respectively, and NC (negative control) siRNA was used as control siRNA. Then B cells were treated with IL4 for 24 h, CQ was added for the last 3 h. The accumulation of LC3B-II was assessed by immunoblotting of whole cell lysates. Bar graphs (mean ± SEM) represent ACTB-normalized LC3B-II density values; *, P<0.05; ns, not statistically significant;determined by the Student t test. Data are representative of 2 independent experiments.
Discussion
In recent decades, genome-wide association studies have identified strong links of Atg5 and Atg7 allele polymorphisms in both childhood and adult asthma [Citation8,Citation35] and increased autophagosomes are observed in bronchial epithelial cells of asthma patients [Citation9]. Although it is known that during asthmatic development, a large number of B cells are recruited to pulmonary parenchyma and activated B cells participate in asthma pathogenesis mainly through antigen-specific antibody production and antigen presentation [Citation14-16], the role of B cell autophagy in asthma pathogenesis remains largely unclear. In this study, we find that autophagy is enhanced in pulmonary B cells of asthma-prone mice while B cell autophagy deficiency leads to attenuated immunopathological symptoms, which demonstrate that B cell autophagy participates in the pathogenesis of allergic asthma.
Previous studies have revealed that autophagy is important for B cell function [Citation17,Citation18]. In the study, elimination of autophagy in CD19-positive B cells did not impair B cell development in the bone marrow, and the proportions of splenic B cell subsets were also not changed in Atg5-cKO mice compared to Cd19-cre controls. Consistent with previous findings, the numbers of peritoneal B1a cells and plasma cells in the spleen and MLN were decreased in Atg5-cKO asthma-prone mice compared to Cd19-cre asthma-prone mice [Citation17,Citation18,Citation20]. Thus, it is plausible that decreased serum levels of IgE may be partially attributed to reduced number of plasma cells in Atg5-cKO asthma-prone mice. Our data also showed that autophagy deletion in B cells led to decreased number of pulmonary B cells and reduced expression of H2 on pulmonary B cells, which indicated that autophagy might promote the survival of pulmonary B cells and enhanced B cell antigen presentation in asthma. Overall, our in vivo data indicated that B cell autophagy participated in the pathogenesis of asthma through multiple mechanisms.
Previous studies have shown that ATG5-dependent LC3-associated phagocytosis (LAP) can promote the acidification of phagosomes and the killing of the ingested organisms and enhance intracellular antigen processing and presentation in macrophages [Citation36-39]. To determine whether LAP is involved in regulating B cell function, we treated murine peritoneal macrophages or splenic B cells with Alexa Fluor 594-labelled zymosan particles for different time intervals and examined the frequency of LAP in macrophages or B cells. Consistent with previous studies [Citation36,Citation39] zymosan particles triggered LAP in macrophages, but we did not detect any obvious LAP in zymosan particles-treated B cells (Figure S11(A,B)), suggesting that LAP may not be involved in B cell function.
Autophagy in immune cells is accurately modulated by various stimuli, such as stressful metabolic conditions [Citation31], pathogen-associated molecular patterns or cytokines [Citation25,Citation40]. Of these, cytokines are specially emphasized in autophagy regulation [Citation25]. Previous studies have shown that the Th1 cytokine IFNG induces autophagy in macrophages or tumor cells [Citation41,Citation42]. However, Th2 cytokines, such as IL4 and IL13, inhibit autophagy in macrophages under starvation or IFNG stimulation [Citation30]. Recent studies have demonstrated that IL4 stimulates autophagy in activated CD4+ Th2 cells and dendritic cells [Citation26,Citation43] and IL13 induces autophagy in bronchial epithelial cells [Citation27]. These literatures suggested that Th2 cytokines have paradox effects on autophagy induction in different cell-types. Our in vivo and in vitro experiments showed that IL4 specifically induced autophagy in primary B cells, but IL13 had little effect on B cell autophagy. It is still unknown why IL4 and IL13 have distinct effects on B cell autophagy. Previous studies have demonstrated that there are 2 types of functional IL4 receptor complexes: The type I IL4R complex (which is composed of IL4RA and IL2RG/CD132/γc chain [interleukin 2 receptor, gamma chain]) and the type II IL4R complex (which is composed of IL4RA and IL13RA1 [interleukin 13 receptor, alpha 1]) [Citation28]. IL4 binds to both type I and II IL4R complexes, while IL13 only binds to the type II IL4R complex [Citation28]. Our Q-PCR data showed that the expression of Il13ra1 was very low, but the expression of Il4ra was very high in murine primary B cells (data not shown), which helped to explain the different biological effects of IL13 and IL4 on B cells. On the other way, the type I IL4R complex mainly activates JAK1 and JAK3 signaling, but the type II IL4R complex mainly activates JAK1 and JAK2 signaling [Citation28]. Our data show that the JAK1/3 pathway is essential for autophagy induction, which suggests that the difference of activated downstream signaling may account for disparity in autophagy induction by IL4 and IL13. Taken together, the data in our study not only provided new insights in B cell autophagy regulation during allergic asthma, but also supported the notion that autophagy in immune cells is regulated by cytokines depending on cell types.
As a multifunctional cytokine, IL4 plays an essential role in the regulation of B cell functions [Citation44]. IL4 sustains the survival of resting as well as activated B cells [Citation29], increases the expression of H2 and FCER2A on B cells and enhances antibody class-switching to IgE and IgG1/4 [Citation44]. Our data showed that autophagy deletion in B cells not only decreased the antiapoptosis effect of IL4, but also attenuated the expression of H2 and CD86 as well as antigen presentation by IL4-treated B cells. These results indicate a novel role of IL4 in promoting autophagy induction and B cell function. Previous studies have demonstrated that autophagy promotes cell survival mainly through maintaining energy homeostasis and removing intracellular impaired proteins/ cytoplasmic organelles and ROS [Citation45]. The activation of the IL4R complex promotes the initiation of many anabolic processes [Citation28], during which a large amount of unfolded proteins, impaired mitochondria and ROS are produced. Accordingly, we speculated that IL4-induced autophagy maintained B cell survival through eliminating metabolic wastes during anabolic processes. Currently, it remains unclear how IL4-induced autophagy promotes the expression of H2 and CD86 on B cells. It is likely that IL4 activates several intracellular signaling cascades (such as MTOR, IRS1/2, and AKT) and initiates the transcription and translation of a spectrum of genes [Citation28], resulting in upregulated expression of H2 and CD86 in B cells. Because autophagy participates in intracellular traffic of vacuoles and protein [Citation46], enhanced autophagy by IL4 may promote the translocation of newly synthesized H2 and CD86 from the ER and/or Golgi apparatus to the membrane of B cells. Notably, previous studies have shown that autophagy boosts endogenous H2 antigen presentation, but has no effect on exogenous H2 antigen presentation in IL4-treated dendritic cells [Citation43], which is different from our observation in B cells. Thus, the differential impact of IL4-mediated autophagy on exogenous antigen presentation in dendritic cells and B cells warrants further investigation. Furthermore, previous studies have assumed that autophagy plays no role in B cell antigen presentation as they found that autophagy deletion did not impact germinal center formation after the immunization of thymus dependent antigen [Citation19,Citation22]. However, our data found that autophagy deficiency decreased the expression of H2 on pulmonary B cells of asthma-prone mice, and IL4-induced autophagy promoted the expression of H2 and CD86 on B cells in vitro. In addition, IL4-induced autophagy enhanced T cell proliferative response mediated by B cells, indicating that IL4-induced autophagy promoted B cell antigen presentation. Thus, the difference in experimental conditions and B cell subsets examined might be the 2 main causes for the inconsistency of current findings. Taken together, our data provide strong evidence that IL4 modulates B cell function through inducing autophagy.
Cytokines regulate autophagy through distinct mechanisms. The Th1 cytokine IFNG induces autophagy by promoting the expression of IRGM1 [Citation41]. Th2 cytokines, mainly IL4 and IL13, are reported to inhibit starvation- or IFNG- induced autophagy through the activation of AKT or STAT6 signaling [Citation30]. Interestingly, previous studies have revealed that IRS2 activation enhances autophagy via the activation of PIK3C3 and occurs despite proper activation of MTOR, AKT and RPS6KB/p70S6K, indicating the existence of MTOR-independent autophagy [Citation47]. Although our results on the mechanism of IL4-induced autophagy in B cells are consistent with the findings by Yamamoto et al [Citation47], we have provided new evidence that IL4 promoted the formation and activation of the ATG14-BECN1-PIK3R4-PIK3C3 complex that is essential for the nucleation, elongation and formation of autophagosomes [Citation31]. Notably, MTOR inhibits autophagy mainly through the deactivation of ULK1 via direct phosphorylation [Citation34]. Our data showed that Becn1 silencing inhibited IL4-induced autophagy, but Ulk1 silencing had little effect on IL4-induced autophagy in B cells. Together, these results confirmed that IL4 induced autophagy via an MTOR-independent, PtdIns3K-dependent pathway.
Overall, our data demonstrate that IL4 induces autophagy in B cells via an MTOR-independent and PtdIns3K-dependent pathway, which further exacerbates asthma pathogenesis through multiple mechanisms. The study not only extends the knowledge of autophagy regulation in B cells, but also provides a potential strategy to target B cell autophagy for clinical therapy of allergic diseases.
Materials and methods
Mice
C57BL/6 mice were purchased from Joint Ventures Sipper BK Experimental Animal, Shanghai. Becn1+/− mice, Cd19-cre mice, OT-II mice and PTPRCa/CD45.1+ mice were obtained from the Jackson Laboratory, USA. Atg5flox/flox mice were purchased from RBRC, Japan. All mice were generated as previously described [Citation48]. Mice were maintained in specific-pathogen free condition. All animal studies were performed with approvals from the Scientific Investigation Board of the Second Military Medical University, Shanghai, China. Mice were used at 6 to 8 wk of age. Age and gender were matched for all animal experiments.
OVAL-sensitized asthma model
Age-and gender-matched C57BL/6 mice were immunized with OVAL in aluminum adjuvant (ThermoFisher, 77161) on d 1 and d 14 intraperitoneally. On d 21 to 23, mice were challenged with atomized OVAL (Sigma, A5503; 2.5% w:v in PBS) for 30 min every day. On d 24, mice were sacrificed, serum, BALF, lung tissues, peritoneal lavage fluid, spleens, bone marrow tissues and mesenteric lymph nodes were collected.
To determine the role of Th2 cytokines on B cell autophagy in vivo, asthma-prone mice were injected intraperitoneally with JANEX-1 (MedChem Express, HY-15508; 50 μg/g/day) in PBS (phosphate-buffered saline; HyClone, SH30256.01B) on d 19 to 23. On d 21 to 23, mice were challenged with atomized OVAL (2.5% w:v in PBS) for 30 min every day. On d 24, mice were sacrificed and lung tissues were collected. Pulmonary B cells isolation and autophagy flux assessment were performed as described [Citation26].
Preparation of pulmonary B cells or CD4+ T cells
Lung leukocytes were isolated with collagenase IV (Gibco, 17104-019) dispersion and Percoll (G&E Healthcare, 17-0891-09) gradient centrifugation as described [Citation16]. Pulmonary CD4+ T cells or B cells were purified with anti-mouse CD4 microbeads (Miltenyi Biotech, 130-049-201) or biotin-conjugated anti-human/mouse PTPRC antibody (eBioscience, 13-0452-86) and anti-biotin microbeads (Miltenyi Biotech, 130-090-485) by MACS (magnetic-activated cell separation). For autophagy flux assessment, pulmonary B cells were treated with or without CQ (Sigma, C-6628) for 3 h before processing the immunoblotting.
Flow cytometry
For flow cytometry, the following monoclonal antibodies were obtained from BD Pharmingen: antibodies to ADGRE1 (T45-2342, 565410), CD4 (RM4-5), CD5 (53-7.3, 553022), CD19 (1D3, 561738), CD40 (3/23, 553790), PTPRC/CD45 (30-F11, 563890), PTPRCa/CD45.1 (A20, 553775), PTPRCb/CD45.2 (104, 560695), CD80 (16-10A1, 553769), CD86 (GL1, 558703), CR2 (7G6, 561769), FCER2A (B3B4, 561773), H2 (25-9-17, 553605), IgD (11-26c.2a, 558597), IgM (R6-60.2, 550881), ITGAM (M1/70, 562950), LY6G (1A8, 565369), PTPRC/CD45R (RA3-6B2, 553092), SDC1 (281-2, 553714), SIGLECF (E50-2440, E50-2440), SPN (S7, 561856), Vα2-TCR (B20.1, 562085). All mAbs for flow cytometry were diluted in 1:100. Purified anti-mouse CD16/32 (BD Pharmingen, 553141) was used to block FCGRs (Fc receptor, IgG) on cells and reduce nonspecific staining. Surface staining was performed as described previously [Citation48]. For intracellular PtdIns3P staining, cultured B cells were fixed with BD Fixation & Permeabilization solution (BD, 51–2090KZ) and stained cytoplasmic PtdIns3P according to the manufacturer's instructions (eChelon, Z-P003). For the antigen phagocytosis assay, OVAL-Tracy 652 conjugate was obtained from Sigma-Aldrich (09209), antigen phagocytosis was performed as described previously [Citation48]. 7AAD (7-amino-actinomycin D; BD, 556570) was added to samples before flow cytometery to exclude dead cells. The data were acquired on a LSR-II flow cytometer (Becton Dickinson, San Jose, CA, USA) and analyzed using BD FACSDiva software or FlowJo software.
Enzyme-linked immunosorbent assay (ELISA)
For ELISA assays, biotin-conjugated antibody of mouse IgE (13-5992), mouse IL4 platinum ELISA kit (BMS613) and mouse IL13 platinum ELISA kit (BMS6015) were purchased from e-Bioscience. OVAL-specific IgE in serum of asthma-prone mice were assessed as described previously [Citation49]. IL4 and IL13 were detected following the manufacturer's protocols.
H&E staining and PAS staining
The lungs from control mice or asthma-prone mice were fixed with cold 4% paraformaldehyde (Sigma-Aldrich, P6148) in PBS, pulmonary infiltration of inflammatory cells was detected by H&E (hematoxylin and eosin) staining, and mucus production in bronchi was assessed by PAS (periodic acid Schiff) staining as previously described [Citation16]. Mucus production on lung sections was quantified with ImageJ software.
Coculture of T cells and B cells in vitro
Pulmonary CD4+ T cells from WT asthma-prone mice were isolated with anti-mouse CD4 micro-beads (Miltenyi Biotech, 130-049-201) by MACS, splenic B cells from WT control mice were purified with Pan B cell isolation kit II (Miltenyi Biotech, 130-104-443) by MACS. Purified pulmonary CD4+ T cells and splenic B cells were cocultured in complete medium (RPMI 1640 [PAN F04-16500] plus 10% fetal bovine serum [Biowest, S1820-500], 1% antibiotic-antimycotic [Gibco, Anti-Anti, 100X], 2 mM L-glutamine [Sigma, G3126] and 50 μM β-mercaptoethanol [Gibco, 21985]) in the absence or presence of OVAL protein. 5 days later, supernatants were collected for ELISA assays. In some experiments, 2 to 3 d later, B cells were purified from cocultured B and T cells by MACS using anti-mouse CD4 micro-beads (Miltenyi Biotech, 130-049-201), and treated with CQ for 3 h. The accumulation of LC3B-II in B cells was measured by immunoblotting of whole cell lysates, and autophagy flux was assessed as previous described [Citation26].
Quantitative PCR analysis of mRNA expression
The mRNA in B cells was extracted and converted into cDNA with a Reverse Transcription Kit (TaKaRa, RR036A) following the manufacturer's protocol. Quantitative PCR was performed with SYBR solution purchased from TaKaRa (RR420A) following the manufacturer's protocol. The following primer pairs were purchased from Sangon Biotech and used for quantitative PCR: Il2:Forward:5’-GTGCTCCTTGTCAACAGCG-3’; Reverse:5’-GGGGAGTTTCAGGTTCCTGTA-3’; Il4:Forward:5’-CCCCAGCTAGTTGTCATCCTG-3’; Reverse:5’-CAAGTGATTTTTGTCGCATCCG-3’; Il6:Forward:5’-CTGCAAGAGACTTCCATCCAG-3’; Reverse:5’-AGTGGTATAGACAGGTCTGTTGG-3’; Il10:Forward:5’-GCTGGACAACATACTGCTAACC-3’; Reverse:5’-ATTTCCGATAAGGCTTGGCAA-3’; Il12b:Forward:5’-ATGGAGTCATAGGCTCTGGAAA-3’; Reverse:5’-CCGGAGTAATTTGGTGCTTCAC-3’; Ifng:Forward:5’-ATGAACGCTACACACTGCATC-3’; Reverse:5’-CCATCCTTTTGCCAGTTCCTC-3’; Becn1:Forward:5’-AGGCGAAACCAGGAGAGAC-3’; Reverse:5’-CCTCCCCGATCAGAGTGAA-3’; Ulk1:Forward:5’-AAGTTCGAGTTCTCTCGCAAG-3’; Reverse:5’-CGATGTTTTCGTGCTTTAGTTCC-3’; Actb:Forward:5’-GCCCTAGGCACCAGGGTGTGAT-3’; Reverse:5’-GGTGAGCAGCACAGGGTGCT-3’.The ΔΔCt method was used for data analysis.
Murine B cell culture and treatment
B cells were cultured with complete RPMI 1640 medium (plus 10% fetal bovine serum, 1% antibiotic-antimycotic, 2 mM L-glutamine, 50 μM β-mercaptoethanol) at 37°C with 5% CO2. Murine recombinant IL4 (R&D, P07750) or recombinant HsIL4 (R&D, 204-IL-010/CF) were used for cell stimulation. We did not stimulate primary B cells with BCR ligands or other receptor ligands before or simultaneously with IL4 treatment. The PtdIns3K inhibitor 3-MA (3-methyladenine; Sigma, M9281) or the lysosome inhibitor CQ was used as autophagy inhibitors in the study.
Isolation of human peripheral blood B cells
Peripheral blood of healthy donors was layered over a Ficoll gradient (G&E Healthcare, 17-1440-03) and centrifuged at 1000 g for 30 min. The mononuclear cells were then collected, and human primary B cells were purified with anti-human CD19 microbeads (Miltenyi Biotech, 130-050-301) by MACS following the manufacturer's protocol.
Confocal microscopy
B cells were fixed with cold 4% paraformaldehyde in PBS for 20 min at 4°C. After washing with 1 × PBS, B cells was adjusted to 1 × 10⁶ cells/ml in PBS and placed on glass slides. After blocking in 2% goat serum (Gibco, 16210064) for 1 h at room temperature, slides were incubated with primary antibodies diluted in blocking buffer overnight at 4°C. After washing with 1 × PBS, slides were incubated with Alexa Fluor 488-conjugated secondary antibodies (Life Technologies, A-11034) or Alexa Fluor 546-conjugated secondary antibodies (Life Technologies, A-11030) diluted in blocking buffer for 1 h. The slides were then washed and mounted. Images were taken on a Nikon Confocal microscope (A1R+, Japan).
To determine whether LAP occurred in B cells, murine peritoneal macrophages or splenic B cells were incubated with Alexa Fluor 594-labelled zymosan particles (Molecular Probes, Z23374) for different time intervals as previously described [Citation36], and then cells were fixed and stained with anti-LC3B (Abcam, ab51520) antibody. The colocalization of LC3B and zymosan particle-containing phagosomes was detected by confocal microscopy.
Transmission electron microscopy
B cells were washed with cold 1 × PBS and fixed with 2% paraformaldehyde in PBS, then treated with 1% OsO4 in PBS, washed in propylene oxide, and bedded in araldite resin (Sigma-Aldrich, A3183). Cutted ultrathin sections were collected on 300-mesh grids (Sigma, G4901), and stained with uranyl acetate and lead citrate. Finally, sections were viewed and imaged with a Hitachi transmission electron microscope system (H-7100FA, Tokyo, Japan).
B cell antigen presentation assay in vitro
For in vitro B cell antigen presentation assay, isolated murine splenic B cells were incubated with OVAL protein or OVAL (323-339) peptide (Sigma, O1641) or OVAL IC (OVAL immune complex, which was prepared with monoclonal anti-OVAL antibody [Sigma, SAB4200702] as described previously) in the presence or absence of IL4 for 24 h [Citation50]. Dead cells were removed by negative magnetic separation using ANXA5 staining (BD, 556570). Purified live B cells were either directly cocultured with CFSE (Invitrogen, C34554)-labeled OT-II CD4+ T cells or pretreated with anti-CD86 neutralizing antibody (R&D, MAB741-SP) for 1 h at 4°C before coculturing with CFSE-labeled OT-II CD4+ T cells in U-bottom 96-well plates (Thermo Scientific, 143761) for 72 h. The proliferation of T cells was measured by flow cytometry.
B cell antigen presentation assay in vivo
For in vivo B cell antigen presentation assay, purified CD4+ T cells from OT-II mice were labeled with 10 μM CFSE (Invitrogen, C34554), 3 × 10⁶ CFSE-labeled CD4+ T cells (PTPRCb/CD45.2+) were transferred into the recipient PTPRCa/CD45.1+ mice by intravenous injection. Then, the recipient mice were immunized with 3 × 10⁷ purified live B cells incubated with OVAL protein in the absence or presence of IL4. Three d later, axillary lymph nodes were collected and single cell suspensions were prepared. The proliferation of CFSE-labeled CD4+ T cells was measured by flow cytometry.
Immunoblotting and CoIP assay
Whole cell extracts were prepared with cell lysis buffer (Cell signaling technology, 9803S) supplemented with protease inhibitors PMSF (Phenylmethanesulfonyl fluoride; sigma, P7626) and Cocktail Set III (Calbiochem, 539134). Protein concentration in the extracts was measured using the Pierce BSA Protein Assay kit (Thermo pierce, 23227). Immunoblotting and CoIP assays were performed as previously described [Citation51]. Antibodies to MAP1LC3B/LC3B (ab51520, 1:3000 dilution) were obtained from Abcam. The following antibodies were purchased from Cell Signaling Technology: Antibodies to ATG5 (D5G3, 9980, 1:1000 dilution), BECN1 (D40C5, 3495, 1:1000 dilution), EIF4EBP1 (9452, 1:1000 dilution), JAK1 (6G4, 3331, 1:1000 dilution), JAK3 (D7B12, 8863S, 1:1000 dilution), phospho-EIF4EBP1 (Thr37/46, 236B4, 2855, 1:1000 dilution), phospho-JAK1 (Tyr1022/1023, 3331, 1:1000 dilution), phospho-JAK3 (Y980/981, D44E3, 5031S, 1:1000 dilution), phospho-RPS6KB (Thr389, 1A5, 9206, 1:1000 dilution), PIK3C3 (D9A5, 4263, 1:1000 dilution), RPS6KB (9202, 1:1000 dilution). Antibodies to ACTB (I-19, sc-1616, 1:500 dilution), phospho-STAT6 (sc11762, 1:1000 dilution), PIK3R4 (H-300, sc-292736, 1:500 dilution) and STAT6 (sc-981, 1:500 dilution) were obtained from Santa Cruz Biotechnology. HRP-linked antibody to goat IgG (Santa Cruz, sc-2020, 1:500 dilution), HRP-linked antibody to rabbit IgG (Cell Signaling Technology,7074S, 1:1000 dilution), and HRP-linked antibody to mouse IgG (Cell Signaling Technology, 7076P2, 1:1000 dilution) were used as secondary antibodies. Protein A/G plus-agarose (Santa Cruz Biotechnology, sc-2003), normal rabbit IgG (Santa Cruz Biotechnology, sc-2027), normal mouse IgG2a (Santa Cruz Biotechnology, sc-3878), and BECN1 (E8, Santa Cruz Biotechnology, sc-48341) were used in CoIP assays.
siRNA silencing
Murine Becn1 siRNA and Ulk1 siRNA were purchased from SyngenTech company. Lipofectamine RNAiMAX (Invitrogen, 13778-150) was used as the transfection reagent. siRNA silencing experiments were performed following the manufacturer's protocol, and the efficiency of gene silencing was validated by quantitative PCR. For immunoblotting assays, siRNA-transfected B cells were stimulated with IL4 for 12 h, and CQ was added for the last 3 h.
Statistics
Statistical analysis was performed using a Student t test, a Mann-Whitney test, or an ANOVA test with a Tukey post-hoc test via IBM SPSS Statistics version 21. A P value less than 0.05 was considered significant.
Disclosure of potential conflicts of interest
The authors declare that they have no competing financial interests.
Supplemental_figure_captions.doc
Download MS Word (56.5 KB)KAUP_A_1421884_suppl.zip
Download Zip (3.7 MB)Acknowledgements
We thank Dr. Hongwei Xu (Department of Immunology, Harbin Medical University) and Dr. Rui Li (NeuroInflammation unit, Montreal neurological institute, McGill University) for helpful discussion, and Dr. Yiqi Liu (Institute of Immunology, Zhejiang University School of Medicine) for his excellent technical help. This work is supported by the National Natural Science Foundation of China under grants 81522019, 31270966, 81471567; and the National Key Basic Research Program of China under grant 2013CB530502; and the National Key Research and Development Program of China under grant 2016YFA0501801; and the Public Welfare Technology Application Research Project of Zhejiang Province under grant 2013C33155.
Additional information
Funding
Related Research Data
References
- GINA. Global strategy for asthma Management and Prevention. Available from: http://ginasthmaorg/2016-gina-report-global-strategy-for-asthma-management-and-prevention/. 2016.
- Farooq MB, Walsh GM. Autophagy and asthma. Clin Exp Allergy: J British Soc Allergy Clin Immunol. 2016;46(1):7–9. doi:10.1111/cea.12633. PubMed PMID: 26767491.
- Jyothula SS, Eissa NT. Autophagy and role in asthma. Curr Opin Pulm Med. 2013;19(1):30–35. doi:10.1097/MCP.0b013e32835b1150. PubMed PMID: 23143196.
- Ban GY, Pham DL, Trinh TH, et al. Autophagy mechanisms in sputum and peripheral blood cells of patients with severe asthma: a new therapeutic target. Clin Exp Allergy: J British Soc Allergy Clin Immunol. 2016;46(1):48–59. doi:10.1111/cea.12585. PubMed PMID: 26112695.
- Zeki AA, Yeganeh B, Kenyon NJ, et al. Autophagy in airway diseases: a new frontier in human asthma? Allergy. 2016;71(1):5–14. doi:10.1111/all.12761. PubMed PMID: 26335713; PubMed Central PMCID: PMC4715640.
- Liu JN, Suh DH, Trinh HK, et al. The role of autophagy in allergic inflammation: a new target for severe asthma. Exp Mol Med. 2016;48(7):e243. doi:10.1038/emm.2016.38. PubMed PMID: 27364893; PubMed Central PMCID: PMC4973311.
- Rubinsztein DC, Codogno P, Levine B. Autophagy modulation as a potential therapeutic target for diverse diseases. Nature Rev Drug Dis. 2012;11(9):709–730. doi:10.1038/nrd3802. PubMed PMID: 22935804; PubMed Central PMCID: PMC3518431.
- Martin LJ, Gupta J, Jyothula SS, et al. Functional variant in the autophagy-related 5 gene promotor is associated with childhood asthma. PloS One. 2012;7(4):e33454. doi:10.1371/journal.pone.0033454. PubMed PMID: 22536318; PubMed Central PMCID: PMC3335039.
- Poon A, Eidelman D, Laprise C, et al. ATG5, autophagy and lung function in asthma. Autophagy. 2012;8(4):694–695. doi:10.4161/auto.19315. PubMed PMID: 22498476.
- Suzuki Y, Maazi H, Sankaranarayanan I, et al. Lack of autophagy induces steroid-resistant airway inflammation. J Allergy Clin Immunol. 2016;137(5):1382–1389 e9. doi: 10.1016/j.jaci.2015.09.033. PubMed PMID: 26589586; PubMed Central PMCID: PMC4860134.
- Hoffmann F, Ender F, Schmudde I, et al. Origin, localization, and immunoregulatory properties of pulmonary phagocytes in allergic asthma. Front Immunol. 2016;7:107. doi:10.3389/fimmu.2016.00107. PubMed PMID: 27047494; PubMed Central PMCID: PMC4803735.
- Steinke JW, Borish L. Th2 cytokines and asthma. Interleukin-4: its role in the pathogenesis of asthma, and targeting it for asthma treatment with interleukin-4 receptor antagonists. Resp Res. 2001;2(2):66–70. PubMed PMID: 11686867; PubMed Central PMCID: PMC59570.
- Eder W, Ege MJ, von Mutius E. The asthma epidemic. New England J Med. 2006;355(21):2226–2235. doi:10.1056/NEJMra054308. PubMed PMID: 17124020.
- Eibel H, Kraus H, Sic H, et al. B cell biology: an overview. Curr Allergy Asthma Rep. 2014;14(5):434. doi:10.1007/s11882-014-0434-8. PubMed PMID: 24633618.
- Matsushita K, Yoshimoto T. B cell-intrinsic MyD88 signaling is essential for IgE responses in lungs exposed to pollen allergens. J Immunol. 2014;193(12):5791–5800. doi:10.4049/jimmunol.1401768. PubMed PMID: 25367117.
- Lindell DM, Berlin AA, Schaller MA, et al. B cell antigen presentation promotes Th2 responses and immunopathology during chronic allergic lung disease. PloS One. 2008;3(9):e3129. doi:10.1371/journal.pone.0003129. PubMed PMID: 18769622; PubMed Central PMCID: PMC2518863.
- Miller BC, Zhao Z, Stephenson LM, et al. The autophagy gene ATG5 plays an essential role in B lymphocyte development. Autophagy. 2008;4(3):309–314. PubMed PMID: 18188005. doi:10.4161/auto.5474.
- Arnold J, Murera D, Arbogast F, et al. Autophagy is dispensable for B-cell development but essential for humoral autoimmune responses. Cell Death Differ. 2016;23(5):853–864. doi: 10.1038/cdd.2015.149. PubMed PMID: 26586568; PubMed Central PMCID: PMC4832104.
- Pengo N, Scolari M, Oliva L, et al. Plasma cells require autophagy for sustainable immunoglobulin production. Nature Immunol. 2013;14(3):298–305. doi:10.1038/ni.2524. PubMed PMID: 23354484.
- Conway KL, Kuballa P, Khor B, et al. ATG5 regulates plasma cell differentiation. Autophagy. 2013;9(4):528–537. doi:10.4161/auto.23484. PubMed PMID: 23327930; PubMed Central PMCID: PMC3627668.
- Pengo N, Cenci S. The role of autophagy in plasma cell ontogenesis. Autophagy. 2013;9(6):942–944. doi:10.4161/auto.24399. PubMed PMID: 23528926; PubMed Central PMCID: PMC3672309.
- Chen M, Hong MJ, Sun H, et al. Essential role for autophagy in the maintenance of immunological memory against influenza infection. Nature Med. 2014;20(5):503–510. doi:10.1038/nm.3521. PubMed PMID: 24747745; PubMed Central PMCID: PMC4066663.
- Paludan C, Schmid D, Landthaler M, et al. Endogenous MHC class II processing of a viral nuclear antigen after autophagy. Science. 2005;307(5709):593–596. doi:10.1126/science.1104904. PubMed PMID: 15591165.
- Ireland JM, Unanue ER. Autophagy in antigen-presenting cells results in presentation of citrullinated peptides to CD4 T cells. J Exp Med. 2011;208(13):2625–2632. doi: 10.1084/jem.20110640. PubMed PMID: 22162830; PubMed Central PMCID: PMC3244027.
- Harris J. Autophagy and cytokines. Cytokine. 2011;56(2):140–144. doi:10.1016/j.cyto.2011.08.022. PubMed PMID: 21889357.
- Botbol Y, Patel B, Macian F. Common gamma-chain cytokine signaling is required for macroautophagy induction during CD4+ T-cell activation. Autophagy. 2015;11(10):1864–1877. doi:10.1080/15548627.2015.1089374. PubMed PMID: 26391567; PubMed Central PMCID: PMC4824584.
- Dickinson JD, Alevy Y, Malvin NP, et al. IL13 activates autophagy to regulate secretion in airway epithelial cells. Autophagy. 2016;12(2):397–409. doi:10.1080/15548627.2015.1056967. PubMed PMID: 26062017; PubMed Central PMCID: PMC4835964.
- Chatila TA. Interleukin-4 receptor signaling pathways in asthma pathogenesis. Trends Mol Med. 2004;10(10):493–499. doi:10.1016/j.molmed.2004.08.004. PubMed PMID: 15464449.
- Wurster AL, Rodgers VL, White MF, et al. Interleukin-4-mediated protection of primary B cells from apoptosis through Stat6-dependent up-regulation of Bcl-xL. J Biol Chem. 2002;277(30):27169–27175. doi:10.1074/jbc.M201207200. PubMed PMID: 12023955.
- Harris J, De Haro SA, Master SS, et al. T helper 2 cytokines inhibit autophagic control of intracellular Mycobacterium tuberculosis. Immunity. 2007;27(3):505–517. doi:10.1016/j.immuni.2007.07.022. PubMed PMID: 17892853.
- Yuan HX, Russell RC, Guan KL. Regulation of PIK3C3/VPS34 complexes by MTOR in nutrient stress-induced autophagy. Autophagy. 2013;9(12):1983–1995. PubMed PMID: 24013218; PubMed Central PMCID: PMC4028342. doi:10.4161/auto.26058.
- Ganley IG, Lam du H, Wang J, et al. ATG13.FIP200 complex mediates mTOR signaling and is essential for autophagy. J Biol Chem. 2009;284(18):12297–12305. doi:10.1074/jbc.M900573200. PubMed PMID: 19258318; PubMed Central PMCID: PMC2673298.
- Hosokawa N, Hara T, Kaizuka T, et al. Nutrient-dependent mTORC1 association with the ULK1-Atg13-FIP200 complex required for autophagy. Mol Biol Cell. 2009;20(7):1981–1991. doi:10.1091/mbc.E08-12-1248. PubMed PMID: 19211835; PubMed Central PMCID: PMC2663915.
- Kim J, Kundu M, Viollet B, et al. AMPK and mTOR regulate autophagy through direct phosphorylation of Ulk1. Nature Cell Biol. 2011;13(2):132–141. doi:10.1038/ncb2152. PubMed PMID: 21258367; PubMed Central PMCID: PMC3987946.
- Pham DL, Kim SH, Losol P, et al. Association of autophagy related gene polymorphisms with neutrophilic airway inflammation in adult asthma. Korean J Intern Med. 2016;31(2):375–385. doi:10.3904/kjim.2014.390. PubMed PMID: 26701229; PubMed Central PMCID: PMC4773719.
- Sanjuan MA, Dillon CP, Tait SW, et al. Toll-like receptor signalling in macrophages links the autophagy pathway to phagocytosis. Nature. 2007;450(7173):1253–1257. doi:10.1038/nature06421. PubMed PMID: 18097414.
- Huang J, Canadien V, Lam GY, et al. Activation of antibacterial autophagy by NADPH oxidases. Proc Nat Acad Sci USA. 2009;106(15):6226–6231. doi:10.1073/pnas.0811045106. PubMed PMID: 19339495; PubMed Central PMCID: PMC2664152.
- Henault J, Martinez J, Riggs JM, et al. Noncanonical autophagy is required for type I interferon secretion in response to DNA-immune complexes. Immunity. 2012;37(6):986–997. doi:10.1016/j.immuni.2012.09.014. PubMed PMID: 23219390; PubMed Central PMCID: PMC3786711.
- Martinez J, Malireddi RK, Lu Q, et al. Molecular characterization of LC3-associated phagocytosis reveals distinct roles for Rubicon, NOX2 and autophagy proteins. Nature Cell Biol. 2015;17(7):893–906. doi:10.1038/ncb3192. PubMed PMID: 26098576; PubMed Central PMCID: PMC4612372.
- Tong Z, Jiang B, Zhang L, et al. HSF-1 is involved in attenuating the release of inflammatory cytokines induced by LPS through regulating autophagy. Shock. 2014;41(5):449–453. doi:10.1097/SHK.0000000000000118. PubMed PMID: 24430550.
- Dong H, Tian L, Li R, et al. IFNg-induced Irgm1 promotes tumorigenesis of melanoma via dual regulation of apoptosis and Bif-1-dependent autophagy. Oncogene. 2015;34(42):5363–5371. doi:10.1038/onc.2014.459. PubMed PMID: 25619828.
- Rovetta AI, Pena D, Hernandez Del Pino RE, et al. IFNG-mediated immune responses enhance autophagy against Mycobacterium tuberculosis antigens in patients with active tuberculosis. Autophagy. 2014;10(12):2109–2121. doi:10.4161/15548627.2014.981791. PubMed PMID: 25426782; PubMed Central PMCID: PMC4502660.
- Terawaki S, Camosseto V, Prete F, et al. RUN and FYVE domain-containing protein 4 enhances autophagy and lysosome tethering in response to Interleukin-4. J Cell Biol. 2015;210(7):1133–1152. doi:10.1083/jcb.201501059. PubMed PMID: 26416964; PubMed Central PMCID: PMC4586740.
- Paul WE. Interleukin-4: a prototypic immunoregulatory lymphokine. Blood. 1991;77(9):1859–1870. PubMed PMID: 2018830.
- White E, Mehnert JM, Chan CS. Autophagy, metabolism, and cancer. Clin Cancer Res: An Official J American Assoc Cancer Res. 2015;21(22):5037–5046. doi:10.1158/1078-0432.CCR-15-0490. PubMed PMID: 26567363; PubMed Central PMCID: PMC4646728.
- Stolz A, Ernst A, Dikic I. Cargo recognition and trafficking in selective autophagy. Nature Cell Biol. 2014;16(6):495–501. doi:10.1038/ncb2979. PubMed PMID: 24875736.
- Yamamoto A, Cremona ML, Rothman JE. Autophagy-mediated clearance of huntingtin aggregates triggered by the insulin-signaling pathway. J Cell Biol. 2006;172(5):719–731. doi:10.1083/jcb.200510065. PubMed PMID: 16505167; PubMed Central PMCID: PMC2063704.
- Ding Y, Guo Z, Liu Y, et al. The lectin Siglec-G inhibits dendritic cell cross-presentation by impairing MHC class I-peptide complex formation. Nature Immunol. 2016;17(10):1167–1175. doi:10.1038/ni.3535. PubMed PMID: 27548433.
- Tian J, Zhu T, Liu J, et al. Platelets promote allergic asthma through the expression of CD154. Cell Mol Immunol. 2015;12(6):700–707. doi:10.1038/cmi.2014.111. PubMed PMID: 25418472; PubMed Central PMCID: PMC4716619.
- Zhang Y, Liu S, Liu J, et al. Immune complex/Ig negatively regulate TLR4-triggered inflammatory response in macrophages through Fc gamma RIIb-dependent PGE2 production. J Immunol. 2009;182(1):554–562. PubMed PMID: 19109188. doi:10.4049/jimmunol.182.1.554.
- Chen W, Han C, Xie B, et al. Induction of Siglec-G by RNA viruses inhibits the innate immune response by promoting RIG-I degradation. Cell. 2013;152(3):467–478. doi:10.1016/j.cell.2013.01.011. PubMed PMID: 23374343.