
ABSTRACT
TFEB (transcription factor EB) is a master regulator of lysosomal biogenesis, function and autophagy. The transcriptional activity of TFEB is mainly controlled by its phosphorylation status mediated by the MTOR (mechanistic target of rapamycin [serine/threonine kinase]) complex 1 (MTORC1). At present, little is known whether other forms of posttranslational modifications (PTMs) such as acetylation also affects is transcriptional activity. In this study, we first observed that a well-established histone deacetylase inhibitor suberoylanilide hydroxamic acid (SAHA) activated lysosomal function in human cancer cells, a process independent of the MTORC1 pathway. Second, SAHA treatment activated TFEB transcriptional activity, as evidenced by increased TFEB luciferase activity and expression of its target genes. Third and more importantly, we observed the enhanced TFEB acetylation in SAHA-treated cells, with identification of 4 acetylation sites. Mutation of these 4 sites markedly diminished TFEB transcriptional activity and lysosomal function induced by SAHA. Finally, we found that TFEB acetylation was functionally implicated in SAHA-mediated autophagy and cell death in cancer cells. Taken together, our results demonstrate that TFEB acetylation is a novel form of PTMs in TFEB that plays an important role in determining its transcriptional activity, lysosomal function and autophagy in cancer cells.
Abbreviations: ACAT1: acetyl-coenzyme A acetyltransferase 1; AHA: L-azidohomoalanine; AO: acidic orange; ATG: autophagy related; CLEAR: Coordinated Lysosomal Expression and Regulation; CQ: chloroquine; CTSB: cathepsin B; HATs: histone acetyltransferases; HDACIs: HDACs inhibitors; HDACs: histone deacetylases; IP: immunoprecipitation; MEFs: mouse embryonic fibroblasts; MS: mass spectrometry; MTOR: mechanistic target of rapamycin (serine/threonine kinase); MTORC1: mechanistic target of rapamycin (serine/threonine kinase) complex 1; PTMs: posttranslational modifications; SAHA: suberoylanilidehydroxamic acid; TFEB: transcription factor EB
Introduction
The lysosome, a critical digestive organelle, is present in all eukaryotic cells with many important biological functions, including endocytosis, exocytosis, macropinocytosis, plasma membrane repair, defense against pathogens, cell death, signal transduction and autophagy [Citation1,Citation2]. The lysosome is characterized by its acidic lumenal pH which is generated by the action of the vacuolar-ATPase, a proton-pumping membrane protein complex [Citation3]. The lysosome contains more than 50 acid hydrolases, including proteases, peptidases, phosphatases, nucleases, glycosidases, sulfatases, and lipases designated for all types of macromolecules [Citation4].
In the course of autophagy, the lysosome plays an essential role in the degradation process whereby the contents in the autophagosomes are eventually degraded by the lysosome via the autophagosome-lysosome fusion [Citation5]. The molecular mechanisms in regulation of the lysosomal function in the course of autophagy have been extensively studied [Citation6,Citation7]. Among them, one important discovery is the identification of the Coordinated Lysosomal Expression and Regulation (CLEAR) gene network and its master gene transcription factor EB (TFEB) in lysosomal biogenesis [Citation8,Citation9]. Our previous work also demonstrates the inhibitory effect of mechanistic target of rapamycin (MTOR) complex 1 (MTORC1) on lysosomal function in the course of autophagy [Citation10]. In addition, the lysosome has been well established as a key organelle in controlling amino acid-mediated activation of MTORC1, as MTORC1 is recruited to the lysosomal membrane via a complex process involving multiple partners including RRAG GTPases, the Ragulator complex and the lysosomal vacuolar-type H+-translocating ATPase [Citation11,Citation12].
The major mechanism controlling TFEB activity is via its phosphorylation based on the fact that TFEB is phosphorylated by several important protein kinases, including MTORC1, MAPK1/ERK2 (mitogen-activated protein kinase 1) and PRKCB, as summarized previously [Citation7]. Among them, MTORC1 is thought to be a key negative regulator of TFEB via direct phosphorylation at both Ser142 and Ser211 [Citation13]. Such phosphorylation controls the cytoplasmic and nuclear localization of TFEB, as mutation of these 2 residues resulted in constitutive nuclear translocation of TFEB [Citation14]. Under starvation condition or upon MTORC1 inhibition, TFEB is activated and translocates into nuclei, leading to upregulation of an array of lysosome-related genes and promotion of lysosomal function [Citation15]. Two other kinases, ERK2 and PRKCB, have been also found to regulate TFEB [Citation16]. However, relatively little is known about other forms of post-translational modifications (PTMs) of TFEB.
Histone deacetylases (HDACs) are an important group of enzymes that control the acetylation level of their target proteins, opposite of the function of histone acetyltransferases (HATs) [Citation17,Citation18]. To date, numerous HDACs inhibitors (HDACIs) have been developed as cancer therapeutic agents, such as suberoylanilide hydroxamic acid (SAHA), trichostatin A and depsipeptide [Citation19,Citation20,Citation21]. Among them, SAHA (vorinostat), a pan HDACs inhibitor (for class I, II and IV), has already been approved by the FDA for treatment of advanced cutaneous T-cell-lymphoma [Citation20]. At present, there is strong evidence suggesting that histone deacetylases have important regulatory effects on autophagy, [Citation22,Citation23] and accordingly a number of HDACIs have been reported to induce autophagy [Citation24,Citation25]. In particular, HDACIs have been shown to regulate lysosomal function. For instance, trichostatin A, a pan-HDACs inhibitor, is able to reduce lysosomal pH and promotes lysosome-related apoptosis in head and neck squamous cell carcinoma cell line UT-SCC-77 [Citation26]. Moreover, several HDACIs like SAHA have been reported to improve lysosomal function in human lysosomal storage disorders, including restoration of the activity of lysosomal enzyme GBA/glucocerebrosidase in Gaucher disease [Citation27], and correction of cholesterol-storage defects in Niemann-Pick type C disease [Citation28,Citation29]. At present, the molecular mechanisms underlying the regulatory effect of HDACIs on the lysosomal function remain to be further investigated.
In this study, we aimed to investigate the importance of TFEB acetylation in control of TFEB transcriptional activity, and implications of such a mechanism in regulation of lysosomal function, autophagy and therapeutic effects of HDACIs in cancer. Our study thus identifies TFEB acetylation as a novel form of PTMs that plays a positive regulatory role in promoting lysosomal function and autophagy via upregulaton of its transcriptional activity.
Results
SAHA treatment activates lysosomal function
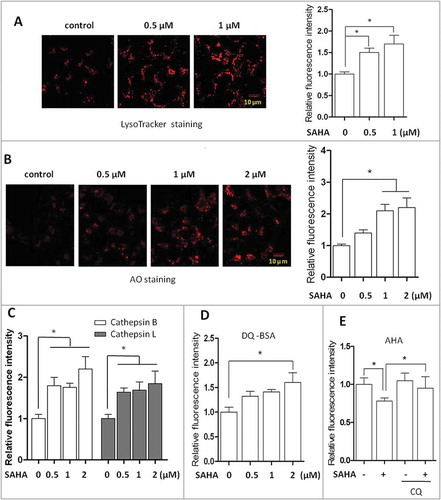
In this study, we first tested changes of lysosomal function in cancer cells treated with SAHA using an array of techniques. First, SAHA treatment significantly enhanced LysoTracker Red staining () and acidic orange (AO) staining () in human colon cancer cells HCT116 cells, indicating enhanced acidification of the lysosome (reduced pH) and/or possibly increased numbers of lysosomes. In addition, similar patterns were also observed in mouse embryonic fibroblasts (MEFs) treated with SAHA (Fig. S1A and S1B). Second, the enzyme activities of lysosomal CTSB (cathepsin B) and CTSL were measured. Dose-dependent increases of cell fluorescence intensity were found in cells treated with SAHA (). Third, we determined the lysosomal degradation activity using the following 2 approaches. First, we used DQ-Red-BSA, a fluorogenic substrate for lysosomal proteases, which yields red-fluorescent products upon hydrolysis [Citation30]. Here, we performed the DQ-BSA assay to determine the lysosomal degradation activity and found that SAHA treatment significantly increased the cells’ fluorescence intensity (), indicating that SAHA treatment promotes lysosomal proteolysis. Second, in addition, we performed a nonradioactive pulse-chase protocol using L-azidohomoalanine (AHA) labeling to quantify long-lived protein degradation during autophagy, a method that we have developed [Citation31,Citation32]. AHA is a surrogate for L-methionine and is incorporated into proteins during de novo protein synthesis. We first labeled cells with AHA and cells then underwent a ‘click’ reaction between the azide group of AHA and a fluorescently tagged alkyne probe. The degradation of AHA-containing proteins can then be detected and quantified by flow cytometry. As shown in , SAHA treatment decreased the fluorescence intensity while an autophagy inhibitor chloroquine (CQ) reversed the trend, indicating that SAHA enhances autophagic degradation via lysosomes.
Figure 1. SAHA treatment activates lysosomal function in human cancer cells. (A) Human colon cancer cells HCT116 were treated with SAHA at the indicated concentration for 12 h. Cells were then stained with LysoTracker Red DND-99 (50 nM) for 15 min. Fluorescence intensity of the treated cells was measured by confocal microscopy (left) and flow cytometry (right). Scale bar: 10 µm. (B) HCT116 cells were treated with SAHA for 12 h as indicated, followed by staining with 1 µM acridine orange (AO) for 30 min and analyzed by confocal microscopy (left) and flow cytometry (right). Scale bar: 10 µm. (C) HCT116 cells were treated with SAHA for 12 h as indicated. Cells were then loaded with Magic Red CTSB/Cathepsin B or CTSL/Cathepsin L reagents for 15 min and measured by flow cytometry. (D) HCT116 cells were first loaded with DQ Red BSA for 1 h and then treated with SAHA (1 µM) for 12 h and measured by flow cytometry. (E) HCT116 cells were first labeled with AHA (25 µM) for 16 h. After chasing out, cells were treated with SAHA (1 µM) in the presence or absence of CQ (25 µM) for 12 h and then harvested for ‘click reaction’. Cells fluorescence intensity was measured by flow cytometry. The numeric data in panels A to E are presented as mean ± SD from 3 independent experiments and statistical significance is indicated in the bar chart (*P < 0.05).
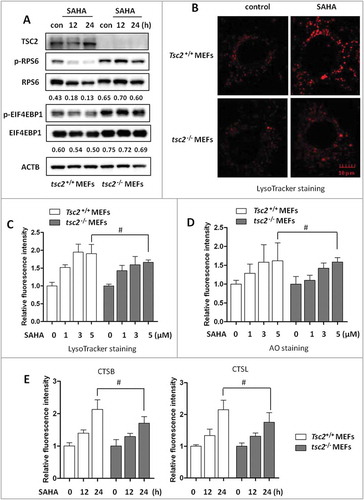
SAHA-mediated lysosomal activation is independent of MTORC1, ATG5 or ATG7
Since it is known that suppression of MTORC1 activates lysosomal function [Citation10,Citation13] and HDACIs are also known to inhibit MTORC1, [Citation24,Citation33] here we tested whether SAHA-mediated lysosomal activation is via suppression of MTORC1. We utilized the tsc2–/– MEFs in which MTORC1 is constitutively active, evidenced by higher levels of phospho-RPS6 (p-RPS6) and p-EIF4EBP1, as shown in [Citation34]. In tsc2–/- cells, lysosomal function is believed to be suppressed due to hyper-phosphorylation of TFEB mediated by active MTORC1 [Citation10,Citation13]. As shown in , SAHA treatment reduced the p-RPS6 and p-EIF4EBP1 level in Tsc2+/+ MEFs, but not in tsc2–/- MEFs, indicating that MTORC1 suppression by SAHA only occurs in Tsc2+/+ MEFs, but not in in tsc2–/- MEFs. Interestingly, when lysosomal function in both Tsc2+/+ and tsc2–/– MEFs by SAHA treatment was determined and compared, LysoTracker Red staining showed that tsc2–/– MEFs have a lower basal level of lysosomal acidification than Tsc2+/+ MEFs under confocal microscopy, but SAHA treatment led to similar increase of the fluorescence intensity (). Moreover, flow cytometry analysis of LysoTracker Red staining () and AO staining () showed that SAHA has similar effect on these parameters on tsc2–/– MEFs in comparison to Tsc2+/+ MEFs. Consistently, SAHA treatment also increased CTSB and CTSL enzyme activity in the tsc2–/– MEFs, similar to the changes in Tsc2+/+ MEFs (). The above data thus suggest that HDACIs-mediated lysosomal activation is independent of MTORC1 activity.
Figure 2. Activation of lysosomal function by SAHA is MTORC1-independent. (A) Tsc2+/+ and tsc2–/- MEFs were treated with 5 µM SAHA for 12 or 24 h as indicated and MTORC1 activity was analyzed by western blotting. (B) Tsc2+/+ and tsc2–/- MEFs were treated with SAHA for 12 h followed by LysoTracker Red staining and the fluorescence intensity was measured by confocal microscopy. Scale bar: 10 µm. (C) Tsc2+/+ and tsc2–/- MEFs were treated with SAHA for 12 h and then followed by LysoTracker Red staining and flow cytometry. (D) Tsc2+/+ and tsc2–/- MEFs were treated with different concentration of SAHA for 12 h as indicated, followed by staining with 1 µM acridine orange (AO) for 30 min and analyzed by flow cytometry. (E) Tsc2+/+ and tsc2–/- MEFs were treated with SAHA as indicated and then loaded with Magic Red CTSB or CTSL reagents for 15 min and measured by flow cytometry. The numeric data in panel C, D and E are presented as mean ± SD from 3 independent experiments and statistical significance is indicated in the bar chart (# P > 0.05).
Based on the knowledge that TFEB plays an important role in lysosomal biogenesis [Citation8,Citation9], here we measured and compared expression levels of those TFEB target genes in both Tsc2+/+ and tsc2–/- MEFs. As shown in Figure S2A, both cell types demonstrated similar degree of increase for the TFEB target genes tested, including Lamp1, Uvrag, Atp6v1a, Atp6v1b2, Atp6v0c, Atp6v0e, Vps18 and Sqstm1, which further supports the notion that SAHA-mediated transcriptional activation of these lysosome-related genes is MTORC1-independent.
On the other hand, it is known that cells deficient in either ATG5 or ATG7 are defective in autophagosome formation [Citation35,Citation36]. To understand the relationship between the autophagy machinery and lysosomal activation under SAHA treatment, we compared lysosomal function between Atg5+/+ and atg5–/- MEFs. As shown in Figure S2B, SAHA treatment led to similar increase of lysosomal acidification (measured by AO staining), CTSB and CTSL enzyme activation and lysosomal degradation (measured by DQ-BSA proteolysis) in atg5–/- MEFs in comparison to their WT counterparts, suggesting that lysosomal activation caused by SAHA does not depend on autophagosome formation. Moreover, we tested atg7–/- MEFs and found the same pattern of responses (Fig. S2C). All the above data indicate that the effect of SAHA on lysosomes is most probably independent of MTORC1, ATG5 or ATG7.
SAHA treatment increases TFEB transcriptional activity
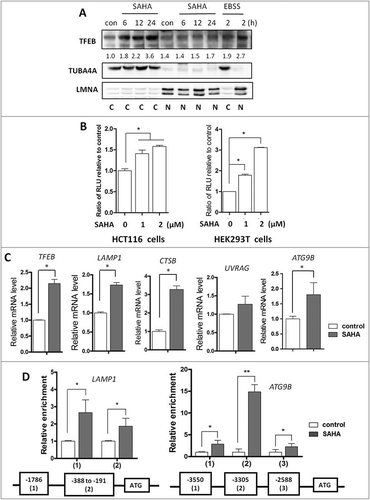
TFEB is thought to be the most important nuclear transcription factor for lysosomal function by driving expression of an array of lysosomal genes [Citation15]. Therefore, in this part of our study we measured the transcriptional activity of TFEB after SAHA treatment, including its nuclear translocation, its DNA binding, and its transcriptional expression of its target genes. First, nuclear localization of TFEB was determined after SAHA treatment. It was found that TFEB was mainly localized in the cytoplasm with only marginal increase in the nuclear fraction after SAHA treatment (). Second, to confirm the transcriptional activity of TFEB, a TFEB promoter-driven luciferase reporter construct was transfected into both HCT116 and HEK293T cells, followed by SAHA treatment for 12 h. As shown in , the relative luciferase activity of TFEB was significantly increased by SAHA. Finally, SAHA treatment significantly enhanced the expression of some TFEB target genes including TFEB, LAMP1, CTSB, UVRAG and ATG9B (). Consistently, TFEB knockdown impaired the upregulation of ATP6V1A and CTSB by SAHA (Fig. S3). To further confirm the transcriptional regulation of target genes by TFEB, we performed the CHIP assay to assess the binding of TFEB to the promoter of its target genes. As shown in , SAHA treatment significantly increased TFEB binding to the promoter of LAMP1 and ATG9B in HCT116 cells. Data from this part of our study thus suggest that SAHA is able to activate TFEB transcriptional activity.
Figure 3. SAHA treatment increases TFEB transcriptional activity. (A) HCT116 cells were treated with 1 µM SAHA as indicated. The cytosolic and nuclear fractions were then prepared for western blotting as indicated. Starvation by EBSS was used as positive control. TUBA4A and LMNA were used as quality control for the cytosolic and nuclear fractions, respectively. (B) HCT116 or HEK293T cells were transient transfected with the TFEB-luciferase reporter construct and then treated with SAHA (1 or 2 μM) for 12 h, respectively. The relative luciferase units (RLU) were then measured. (C) HCT116 cells were treated with SAHA (1 μM) for 12 h and cells were harvested for RNA extraction. Real-time PCR was performed to determine the mRNA level of TFEB target genes (TFEB, LAMP1, CTSB, UVRAG and ATG9B), and GAPDH was used as an endogenous control. (D) HCT116 cells were treated with SAHA 1 μM for 12 h. The cells were then harvested and the ChIP assay was performed to analyze the binding of TFEB to the promoter regions of its targets (LAMP1 and ATG9B). The putative sites were predicted by the conserved TFEB binding sites CACGTG. Numbers indicate the nucleotide position relative to the ATG site. The numeric data in panels (B, C and D) are presented as mean ± SD from 3 independent experiments and statistical significance is indicated in the bar charts (* P < 0.05, ** P < 0.01).
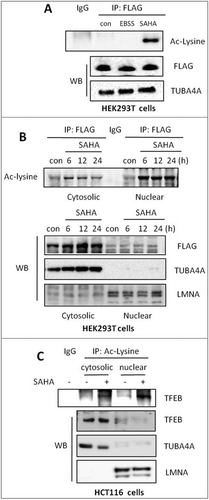
Accumulation of acetylated TFEB in the nuclei in SAHA-treated cells
Data from our study so far indicate that activation of TFEB and lysosomal function are independent of MTORC1-mediated TFEB phosphorylation. Such findings prompted us to search for other forms of PTMS in regulation of TFEB activity. HDACIs modulate the acetylation of non-histone proteins such as nuclear transcription factors TP53/TRP53/p53 and GATA1 (GATA binding protein 1) [Citation37]. Therefore, here we examined whether the increased transcriptional activity of TFEB by SAHA is associated with its acetylation status. The acetylation level of TFEB after SAHA treatment in HEK293T cells with Flag-TFEB overexpression was investigated after FLAG affinity isolation and followed by western blotting using an anti-Ac-lysine antibody. As shown in , a significant increase in TFEB acetylation was observed by SAHA treatment, but not in cells under EBSS starvation, which was known to enhance TFEB transcriptional activity and activate lysosomal function [Citation15]. Such observations thus suggest that TFEB acetylation is a specific event in cells treated with HDACIs. Next, we measured whether TFEB acetylation affects its nuclear translocation. Notably, in HEK293T cells (), SAHA treatment failed to cause a significant increase of the total TFEB nuclear translocation, consistent with the data shown earlier (). Interestingly, we detected relative high level of nuclear acetylated TFEB in cells treated with SAHA (), indicating the possibility that the acetylated TFEB is more likely to undergo nuclear translocation. A similar pattern was found in HCT116 cells treated with SAHA (). Taken together, our data reveal that TFEB acetylation is likely to play an important role in promoting its nuclear translocation and transcriptional activity.
Figure 4. SAHA treatment increases TFEB acetylation level. (A) HEK293T cells were transiently transfected with the pCMV-3 × Flag-TFEB and then treated with 2 μM SAHA for 12 h or starved in EBSS for 2 h. Cells were lysed and subjected to FLAG immunoprecipitation followed by immunoblotting for Ac-lysine. (B) HEK293T cells were transfected with pCMV-3 × Flag-TFEB as in (A) and then treated with 2 µM SAHA as indicated. Cytosolic and nuclear fractions were then prepared and subjected to FLAG immunoprecipitation. Imunoblotting of acetylated-lysine was performed. TUBA4A and LMNA were used as quality control for the cytosolic and nuclear fractions, respectively. (C) HCT116 cells were treated with SAHA (1 µM) for 12 h and then the cytosolic and nuclear fractions were prepared and subjected to Ac-lysine immunoprecipitation followed by immunoblotting for TFEB. TUBA4A and LMNA were used as quality control for the cytosolic and nuclear fractions, respectively.
ACAT1 and HDAC2 control TFEB acetylation and lysosomal function in cells treated with SAHA
To reveal the molecular mechanism controlling TFEB acetylation in SAHA-treated cells, we attempted to identify the histone acetyltransferases (HATs) and histone deacetylases (HDACs) involved. Here, an IP assay in combination with mass spectrometry (MS) was performed as described in Materials and Methods. As listed in Figure S4A, ACAT1 (acetyl-Coenzyme A acetyltransferase 1) and HDAC2 (histone deacetylase 2) were identified as the top candidates interacting with TFEB. To confirm this finding, we first used an affinity isolation assay for FLAG in SAHA-treated HEK293T cells with Flag-TFEB overexpression and then detected the level of ACAT1 or HDAC2. As shown in , SAHA treatment enhanced the interaction between ACAT1 and TFEB and reduced the interaction between HDAC2 and TFEB. To further confirm this mechanism, we performed knockdown experiments with ACAT1 or HDAC2 and then determined TFEB acetylation level in SAHA-treated cells. As expected, we found that knockdown of ACAT1 resulted in decreased TFEB acetylation by SAHA treatment in both HEK293T cells () and HCT116 cells (Fig. S4B). In contrast, knockdown of HDAC2 resulted in increased TFEB acetylation by SAHA treatment in both HEK293T cells () and HCT116 cells (Fig. S4C). These results demonstrate that ACAT1 and HDAC2 are closely implicated in control of TFEB acetylation.
Figure 5. ACAT1 and HDAC2 control TFEB acetylation in cells treated with SAHA. (A) HEK293T cells were transiently transfected with pCMV-3 × Flag-TFEB and then treated with 2 μM SAHA for 12 h. Cells were lysed and subjected to FLAG immunoprecipitation and immunoblotting for Ac-lysine, ACAT1 and HDAC2. (B) HEK293T cells were transiently transfected with pCMV-3 × Flag-TFEB, together with ACAT1-siRNA. After treatment with 2 μM SAHA for 12 h, cells were lysed and subjected to FLAG immunoprecipitation and immunoblotting for Ac-lysine. (C) HEK293T cells were transiently transfected with pCMV-3 × Flag-TFEB, together with HDAC2-siRNA. Similar analysis was then performed as in (B). (D) In vitro acetylation assay. Human recombinant TFEB was incubated with different doses of recombinant ACAT1 in the presence of 100 μM Ac-CoA for 1 h at 30°C. Western blotting was performed for Ac-lysine.
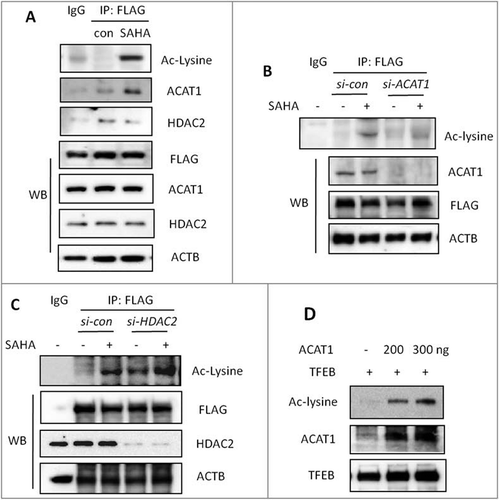
To further confirm the importance of ACAT1 and HDAC2 in mediating TFEB acetylation, we performed an in vitro acetylation assay. As shown in , the presence of ACAT1 increased the acetylation level of TFEB in a dose-dependent manner. Conversely, to confirm the effect of HDAC2 on TFEB acetylation, we performed a FLAG affinity-isolation assay in HEK293T cells with Flag-TFEB overexpression and treated with SAHA. As shown in Figure S4D, the addition of HDAC2 significantly reduced the acetylation level of the immunoprecipitated Flag-TFEB, demonstrating the importance of HDAC2 in control of TFEB acetylation.
Next, we further determined the role of ACAT1 and HDAC2 in changes of TFEB and lysosomal function caused by HDACIs. First, knockdown of ACAT1 or HDAC2 significantly reduced or increased the expression of TFEB-target genes in SAHA-treated cells, including TFEB, ATP6V1A, CTSB and UVRAG (Fig. S5A). Second, LysoTracker-Red staining showed a significant decrease of cell fluorescence intensity after ACAT1 knockdown in SAHA-treated cells while knockdown of HDAC2 caused a significant increase of fluorescence intensity in these cells (Fig. S5B).
Identification of the TFEB acetylation sites
LC-MS/MS-based proteomic analysis has been widely used to identify a large number of acetylated proteins [Citation38]. In this part of our study, we attempted to identify the acetylation sites on TFEB induced by HDACIs. To do this, ectopically expressed TFEB was purified from cells and then analyzed as described in Materials and Methods. Accordingly, we identified 4 high confidence acetyl-lysine-containing peptides VQSYLENPTSYHLQQSQHQK(Ac)VR (pep_score = 120.11, pep_expect = 1.5E-10), EYLSETYGNK(Ac)FAAHISPAQGSPKPPPAASPGVR (pep_score = 119.53, pep_expect = 1.5E-10), FAAHISPAQGSPK(Ac)PPPAASPGVR (pep_score = 77.87, pep_expect = 1.6E-6), EDEGPPGYPEPLAPGHGSPFPSLSK(Ac)K (pep_score = 84.0, pep_expect = 5.5E-7). They were mapped to regions containing K91, K103, K116 and K430 on human TFEB ( and Fig. S6, the detailed MS spectra are shown in Supplementary annotated MS data). Next, we set to examine the biological importance of these acetylation sites by creating the mutants. When we mutated each lysine (K) to arginine (R), each single mutation resulted in a weak reduction in TFEB acetylation (). More importantly, the combined mutations of all 4 sites (TFEB[4KR]) led to a more evident decrease in TFEB acetylation ().
Figure 6. TFEB acetylation regulates its transcriptional activity. (A) Identification of TFEB acetylation sites (K91) using mass spectrometry analysis. pCMV-3 × Flag-TFEB was overexpressed into HEK293T cells. After 24 h post-transfection, cells were treated with SAHA (2 μM) for 12 h. TFEB was purified by immunoprecipitation with an anti-FLAG antibody and then analyzed using LC-MS/MS. Fragment ions containing acetylated Lys are denoted by * in red. (B) HEK293T cells were transiently transfected with FLAG-tagged WT TFEB or the single K91R, K103R, K116R, K430R mutants (left panel), and the [4KR] mutant (right panel). After the FLAG affinity isolation, the basal Ac-lysine level was detected by immunoblotting. (C) HCT116 cells were transfected with WT TFEB or TFEB[4KR] and then treated with 1 µM SAHA for 12 h. The cytosolic and nuclear fractions were prepared and subjected to immunoblotting. TUBA4A and LMNA were used as quality controls for the cytosolic and nuclear fractions, respectively. (D) HCT116 cells were first cotransfected with the TFEB-luc reporter construct and WT TFEB or TFEB[4KR], the cells were then treated with SAHA (1 μM) for 12 h and the relative luciferase unit (RLU) was measured. (E) HCT116 cells were first transfected with WT TFEB or TFEB[4KR], then treated with SAHA (1 μM) for 12 h and subsequently cells were harvested for RNA extraction. Real-time PCR was performed to determine the mRNA level of LAMP1 and UVRAG. GAPDH was used as an endogenous control. In Panel D and E, data are presented as mean ± SD from 2 independent experiments. Statistical significance is indicated in the bar chart (* P < 0.05).
![Figure 6. TFEB acetylation regulates its transcriptional activity. (A) Identification of TFEB acetylation sites (K91) using mass spectrometry analysis. pCMV-3 × Flag-TFEB was overexpressed into HEK293T cells. After 24 h post-transfection, cells were treated with SAHA (2 μM) for 12 h. TFEB was purified by immunoprecipitation with an anti-FLAG antibody and then analyzed using LC-MS/MS. Fragment ions containing acetylated Lys are denoted by * in red. (B) HEK293T cells were transiently transfected with FLAG-tagged WT TFEB or the single K91R, K103R, K116R, K430R mutants (left panel), and the [4KR] mutant (right panel). After the FLAG affinity isolation, the basal Ac-lysine level was detected by immunoblotting. (C) HCT116 cells were transfected with WT TFEB or TFEB[4KR] and then treated with 1 µM SAHA for 12 h. The cytosolic and nuclear fractions were prepared and subjected to immunoblotting. TUBA4A and LMNA were used as quality controls for the cytosolic and nuclear fractions, respectively. (D) HCT116 cells were first cotransfected with the TFEB-luc reporter construct and WT TFEB or TFEB[4KR], the cells were then treated with SAHA (1 μM) for 12 h and the relative luciferase unit (RLU) was measured. (E) HCT116 cells were first transfected with WT TFEB or TFEB[4KR], then treated with SAHA (1 μM) for 12 h and subsequently cells were harvested for RNA extraction. Real-time PCR was performed to determine the mRNA level of LAMP1 and UVRAG. GAPDH was used as an endogenous control. In Panel D and E, data are presented as mean ± SD from 2 independent experiments. Statistical significance is indicated in the bar chart (* P < 0.05).](/cms/asset/972c3eb8-9ce1-4c75-8d9b-c87c0016dc24/kaup_a_1447290_f0006_c.jpg)
To further test the effect of TFEB acetylation on its transcriptional activity, we first determined the localization of the TFEB[4KR] mutant. We prepared cellular and nuclear fractions from HCT116 cells with overexpression or WT TFEB or the TFEB[4KR] mutant, and it is clear that the TFEB mutation resulted in a significant reduction of nuclear translocation of acetylated TFEB after SAHA treatment (). Next, the luciferase activity of the TFEB[4KR] mutant was measured. As shown in , there was a significant reduction in the luciferase activity of the mutant TFEB. Finally, we measured the mRNA level of 2 known TFEB target genes (LAMP1 and UVRAG) in SAHA-treated HCT116 cells. It was found that these 2 genes were significantly downregulated in cells with expression of the TFEB[4KR] mutant (). Taken together, our results suggest that TFEB acetylation is an important form of PTMs in determining its transcriptional activity.
TFEB acetylation plays an important role in lysosomal activation, autophagy and cell death induced by HDACIs
In this part of our study, we aimed to determine the functional importance of TFEB acetylation in regulation of lysosomal function and autophagy. As shown in , LysoTracker Red staining showed a significant decrease of cell fluorescence intensity in cells with expression of TFEB[4KR], indicating reduced acidification of lysosomes. In addition, cells with overexpression of the TFEB[4KR] mutant also showed reduced CTSB activity when compared with the cells with WT TFEB ().
Figure 7. TFEB acetylation is involved in lysosomal activation and autophagy in SAHA-treated cells. (A) HCT116 cells were first transfected with WT TFEB or TFEB[4KR] and then treated with SAHA (1 μM) for 12 h. Cells were then stained with LysoTracker Red DND-99 (50 nM) for 15 min. Fluorescence intensity of treated cells was measured by confocal microscopy. Scale bar: 10 µm. (B) As in (A), cells were loaded with Magic Red CTSB reagent for 15 min and measured by flow cytometry. Data are presented as mean ± SD from 3 independent experiments. Statistical significance is indicated in the bar chart (* P < 0.05). (C) As in (A), HCT116 cells were treated with SAHA in the presence of CQ (25 μM) and then cells were lysed for detection of LC3B and SQSTM1 using immunoblotting. TUBA4A was used as loading control. (D) HCT116 cells were first transfected with WT TFEB or the TFEB[4KR] mutant and then treated with SAHA (2 μM) for 24 h. Cell death was quantified using propidium iodide (PI) live exclusion staining. Statistical significance is indicated in the bar chart (*P < 0.05). (E) As in (D), HCT116 cells were treated with SAHA (2 μM) for 24 h and then cells were harvested detection of CASP3 and PARP by immunoblotting.
![Figure 7. TFEB acetylation is involved in lysosomal activation and autophagy in SAHA-treated cells. (A) HCT116 cells were first transfected with WT TFEB or TFEB[4KR] and then treated with SAHA (1 μM) for 12 h. Cells were then stained with LysoTracker Red DND-99 (50 nM) for 15 min. Fluorescence intensity of treated cells was measured by confocal microscopy. Scale bar: 10 µm. (B) As in (A), cells were loaded with Magic Red CTSB reagent for 15 min and measured by flow cytometry. Data are presented as mean ± SD from 3 independent experiments. Statistical significance is indicated in the bar chart (* P < 0.05). (C) As in (A), HCT116 cells were treated with SAHA in the presence of CQ (25 μM) and then cells were lysed for detection of LC3B and SQSTM1 using immunoblotting. TUBA4A was used as loading control. (D) HCT116 cells were first transfected with WT TFEB or the TFEB[4KR] mutant and then treated with SAHA (2 μM) for 24 h. Cell death was quantified using propidium iodide (PI) live exclusion staining. Statistical significance is indicated in the bar chart (*P < 0.05). (E) As in (D), HCT116 cells were treated with SAHA (2 μM) for 24 h and then cells were harvested detection of CASP3 and PARP by immunoblotting.](/cms/asset/113d7c8b-8609-450a-8531-8795a52593a5/kaup_a_1447290_f0007_c.jpg)
Next, we measured the effect of TFEB acetylation on autophagy. As shown in , under SAHA treatment and in the presence of a lysosomal inhibitor, CQ, HCT116 cells with the TFEB[4KR] mutant overexpression were found to have lower levels of LC3B-II (the autophagosome-associated form of LC3B) than cells with WT TFEB overexpression. Consistently, the reduction of the SQSTM1 level by SAHA in cells with TFEB[4KR] mutant overexpression was less evident than cells with WT TFEB overexpression. Moreover, we further analyzed the impact of TFEB acetylation on autophagic activity by comparing the level of autophagic protein degradation. As shown in Figure S7, cells with overexpression of the TFEB[4KR] mutant exhibited a significantly lower rate of protein degradation in comparison to cells with WT TFEB in response to SAHA treatment. Thus, our data indicate reduced autophagy flux level by the TFEB[4KR] mutant in response to SAHA.
Finally, the effect of TFEB acetylation on SAHA-caused cell death was also determined. As shown in , HCT116 cells with TFEB[4KR] mutant overexpression were more resistant to SAHA-induced cell death when compared with cells with WT TFEB overexpression. Similarly, there was a reduced level of CASP3 activation and PARP1 cleavage in HCT116 cells with overexpression of the TFEB[4KR] mutant (). Therefore, our data collectively demonstrate that TFEB acetylation status is an important factor in determining SAHA-mediated lysosomal function, autophagy, and cell death in cancer cells.
Discussion
At present, accumulating evidence shows that protein acetylation mediated by HATs and HDACs plays a critical role in autophagy regulation at multiple levels [Citation39]. In mammalian cells, ATG7 colocalizes with the acetyltransferase EP300 and is acetylated within the cytoplasm, and their physical interactions depends on nutrient availability [Citation40]. On the other hand, deacetylation of ATG7, as well as other ATG proteins (ATG5, MAP1LC3/LC3 and ATG12), is mediated by the NAD+-dependent deacetylase SIRT1, a relevant process in autophagic vesicle formation [Citation41]. Under serum deprivation, the activation of GSK3 activates acetyltransferase KAT5/TIP60, which in turn acetylates and activates the autophagy initiation kinase ULK1 [Citation42]. In response to oxidative stress or serum starvation, FOXO1 is acetylated by dissociation from SIRT2 (sirtuin 2), a NAD+-dependent histone deacetylase, and the acetylated FOXO1 bounds to ATG7, an E1-like protein, to influence the autophagic process [Citation43]. More recently, a set of studies have demonstrated the critical role of SIRT1 in starvation-mediated autophagy via direct interaction and deacetylation of some key autophagy effectors such as LC3 [Citation44,Citation45]. In this study, we provide clear evidence that TFEB acetylation is an important form of PTMs in control of its transcriptional activation, and subsequent lysosomal function and autophagy in human cancer cells treated with SAHA, a well-established HDACI that has been approved for clinical application in cancer therapy.
To date, the most important form of PTMs for TFEB is phosphorylation that leads to suppression of its transcriptional activity [Citation6,Citation7]. Among them, MTORC1 is thought to be a key negative regulator of TFEB via direct phosphorylation at both Ser142 and Ser211 [Citation13]. Such phosphorylation controls the cytoplasmic and nuclear localization of TFEB, as mutation of these 2 residues results in constitutive nuclear translocation of TFEB [Citation14]. In our study, we obtained several interesting findings. First, we observed lower level of basal lysosomal function in tsc2–/– MEFs as evidenced by weaker LysoTracker Red staining ( to 2B), indicating the possibility that the basal lysosome function is suppressed due to hyperphosphorylation of TFEB mediated by the constitutive activation of MTORC1. Such observation is in fact consistent with one of our reports in which MTORC1 negatively regulates lysosomal function in the course of autophagy Citation10. Second, MTORC1 is not directly involved in SAHA-mediated activation of TFEB transcriptional activity and lysosomal function, based on the observations that SAHA treatment activates TFEB-lysosome function in tsc2–/– MEFs in which MTORC1 is known to be constitutively active [Citation7] and SAHA failed to block MTORC1 activity (). Therefore, activation of the TFEB-lysosome function in tsc2–/– MEFs by SAHA indicates that such activation is independent of MTORC1-mediated TFEB phosphorylation. Third, no TFEB acetylation was detected in HEK293T cells, under EBSS starvation (). Therefore, it is believed that increased TFEB acetylation is a specific event following treatment with HDACIs such as SAHA, and it may be not applicable to TFEB activation and autophagy induced by starvation or MTORC1 inhibitors. Fourth, we found that in SAHA-treated cells, the majority of TFEB still remains in the cytosol and only a small portion of the total TFEB is found in the nuclei (). Intriguingly and importantly, the nuclear TFEB was highly acetylated comparing to the cytosolic counterpart (). Our data thus indicate the possibility that acetylated TFEB has a much higher capability of nuclear translocation and DNA binding. The exact mechanisms of this process remain to be further elucidated.
It remains controversial whether acetylation is able to promote or inhibit the transcriptional activity of a nuclear transcription factor. For instance, acetylation enhances the transcriptional activity of certain transcription factors such as TP53 [Citation30,Citation37]. In contrast, acetylation also inhibits the transcriptional activity of certain transcription factors such as FOXO1 [Citation46]. In our study, we provide convincing evidence that TFEB acetylation positively regulates its transcriptional activity, leading to promotion of lysosomal function and eventually autophagy, based on the following findings: (i) Acetylated TFEB accumulates in the nuclei in the cells treated with SAHA (), (ii) Enhanced TFEB acetylation is associated with increased transcriptional activity ( to E), (iii) Modulation of TFEB acetylation level by siRNA knockdown of ACAT1 and HDAC1 has a significant impact on its transcriptional activity (Fig. S5), and more importantly (iv) mutation of the 4 acetylation sites significantly impaired TFEB transcriptional activation, lysosomal function and eventually, autophagy in cells treated with SAHA ( and ). Intriguingly, during the course of our study, it has been reported that TFEB acetylation at K116 in fact has an inhibitory effect in microglia treated with HDACIs such as nicotinamide (NAM) or overexpression of an HDAC such as SIRT1 [Citation47]. Such a discrepancy could be caused by the different contexts in these 2 studies, including the cell type and the nature of stimuli used. Therefore, the exact function of TFEB acetylation in control of its transcriptional activity warrants further investigation.
It is well known that protein acetylation is controlled by both HATs and HDACs [Citation48]. In this study, we identified that both ACAT1 and HDAC2 are likely to be the main HAT and HDAC in control of the acetylation status of TFEB. SAHA is known to inhibit class I, II and IV HDACs [Citation49]. Therefore, it is reasonable to attribute its effect on HDAC2, a member of the class I HDAC. Our findings are largely consistent with a recent report in which TFEB directly binds to HDAC5 in skeletal muscle cells and such interaction is associated with reduced TFEB transcriptional activity [Citation50]. On the other hand, HDACIs enhance the interaction of HATs with their substrates [Citation51]. As shown in , SAHA treatment recruited more ACAT1 to TFEB and increased TFEB acetylation level. Therefore, our data demonstrate that HDACIs may increase the protein acetylation level via additional mechanisms such as the recruitment of HATs.
As stated earlier, the role of TFEB phosphorylation in control of its nuclear translocation and transcriptional activity has been well established [Citation6,Citation7]. Results from our study reveal acetylation as another important form of PTMs in control TFEB function. Based on the known relationship between phosphorylation and acetylation, it would be of interest to understand whether these 2 forms of PTMs of TFEB are functionally interlinked. On one hand, it appears that TFEB phosphorylation has no direct impact on its acetylation level, based on our findings that enhanced TFEB acetylation is only found in cells treated with HDACIs, but not in cells under EBSS starvation (). On the other hand, it is possible that the phosphorylation status of TFEB may contribute to the low basal acetylation level of TFEB in unstressed cells. This is based on the observations that the phosphorylated TFEB interacts with an important adaptor protein YWHAQ/14-3-3 (tyrosine 3-monooxygenase/tryptophan 5-monooxygenase activation protein theta) [Citation14,Citation52] (also based on affinity capture-MS analysis available at BioGRID (https://thebiogrid.org/113668/summary/homo-sapiens/tfeb.html). Moreover, protein YWHAQ interacts with several important members of the HDAC family [Citation53]. Therefore, we speculate that TFEB phosphorylation may help maintain a low level of TFEB acetylation via promotion of TFEB binding to HDACs such as HDAC5 and HDAC2 with the presence of adaptor proteins such as protein YWHAQ. More work is needed to confirm this phosphorylation-acetylation model in regulation of TFEB.
In summary, our study identifies acetylation as a novel form of PTMs of TFEB that plays an important role in regulating its transcriptional activity, lysosomal function and autophagy in cells treated by HDACIs. At present, a group of HDACIs, such as vorinostat, romidepsin, chidamide, panobinostat and belinostat, have been developed as cancer therapeutics and some of the compounds have already been approved by FDA for clinical application, especially for T cell lymphoma [Citation19,Citation20,Citation21]. Therefore, our study not only reveals novel insights into the molecular mechanisms controlling the function of TFEB, a master regulator of lysosomal function and autophagy, but also provides experimental evidence for developing more effective therapeutic strategies by regulating TFEB acetylation and TFEB-mediated lysosomal function and autophagy in cancers treated with HDACIs.
Materials and methods
Cell lines and cell culture
Wild-type Tsc2 and tsc2-knockout mouse fibroblasts (MEFs) were obtained from Dr. DJ Kwiatkowski (Brigham and Women’s Hospital, Harvard University; referred to as Tsc2+/+ and tsc2–/- MEFs hereafter) [Citation54].
Atg5+/+ and atg5–/- MEFs, Atg7+/+ and atg7–/- MEFs were kindly provided by Drs. N Mizushima and M Komatsu, respectively [Citation35,Citation55]. HCT116 and HEK293T cells were obtained from American Type Culture Collection (ATCC). All cell lines were maintained in DMEM (Sigma, D1152) containing 10% fetal bovine serum (HyClone, SV30160.03) in a 5% CO2 atmosphere at 37°C.
Reagents and antibodies
The chemicals used in our experiments were: SAHA (Sigma, SML0061), LysoTracker® Red DND-99 (Invitrogen, L7528), Magic RedTM Cathepsin B/CTSB, Magic RedTM Cathepsin L/CTSL and Acridine Orange Staining Solution (Immunochemistry Technologies, LLC, 937, 942 and 6130, respectively), DQTM Red BSA (Molecular Probes, D12051), Click-iT® AHA (L-azidohomoalanine) reagent (Invitrogen, C10289), Tris[(1-benzyl-1H-1,2,3-triazol-4-yl)methyl]amine (TBTA; Sigma, 678937), Tris(2-carboxyethyl) phosphine (TCEP; Sigma, C4706), CuSO4 (Sigma, 451657), TAMRA alkyne (Invitrogen, T10183), Dulbecco’s Modified Eagle’s Medium (DMEM containing 4500 mg/L D-glucose, without l-glutamine, sodium pyruvate, l-methionine, and L-cystine; Invitrogen, 21013), dialyzed fetal bovine serum (Invitrogen, 26400044), methanol (Sigma, 34860), 4% formaldehyde (Sigma, F8775) in PBS (1.54 mM potassium phosphate monobasic, 155.2 mM NaCl, 2.7 mM sodium phosphate dibasic, pH 7.2), 0.5% TritonTM X-100 (Sigma, T8787) in PBS, 3% bovine serum albumin (BSA; Sigma, A1933) in PBS (pH 7.4), 1% SDS (Sigma, L3771) in 50 mM Tris-HCl, pH 8.0 (Sigma, RES3098T-B7), and GIBCO® Earle’s Balanced Salt Solution (EBSS; Thermo Fisher Scientific 24010043). The antibodies used in our experiments included: TSC2 (Cell Signaling Technology, 4308), phospho-RPS6 (S235/236; Cell Signaling Technology, 2211), RPS6 (Cell Signaling Technology, 2217), phospho-EIF4EBP1 (T37/46; Cell Signaling Technology, 2855), EIF4EBP1 (Cell Signaling Technology, 9452), ACTB (Sigma, A5441), TUBA4A (Sigma, T6199), LMNA/lamin A/C (Cell Signaling Technology, 2032), TFEB (Bethyl Laboratories, A303-673A), FLAG (Sigma, F1804), acetylated-lysine (Cell Signaling Technology, 9441), ACAT1 (Santa Cruz Biotechnology, sc-161307), HDAC2 (Cell Signaling Technology, 2545), 14-3-3 (Cell Signaling Technology, 9638), TFEB recombinant protein (H00007942-P01), ACAT1 recombinant protein (NBP2-22664, Novus), HDAC2 recombinant protein (NBP1-72399, Novus), GFP (Cell Signaling Technology, 2555), MAP1LC3B/LC3B (Sigma, L7543), SQSTM1/p62 (Sigma, P0067), PARP (Cell Signaling Technology, 9542), CASP3 (Cell Signaling Technology, 9662), anti-FLAG®M2 Affinity Gel (Sigma, A2220), acetyl-lysine antibody conjugated agarose beads (PTM Biolabs, PTM-103).
LysoTracker red staining
The lysosomal acidity was estimated with LysoTracker Red [Citation10]. Cells cultured on coverglass slide chamber were first treated as designated, then incubated for 30 min with 50 nM LysoTracker® Red DND-99. The fluorescence intensity of different staining results was examined with a confocal microscope (Olympus Fluoview FV1000, Shinjuku-ku, Tokyo, Japan). Representative images were then selected and photographed.
Acidic orange (AO) staining
It has been established that AO accumulates in the acidic organelle such as lysosome [Citation56]. Cells were cultured on a coverglass slide chamber, followed by the designated treatments. After 30-min incubation with 1 µM AO, the lysosomal structures can be visualized with a confocal microscope (Olympus Fluoview FV1000). Representative images were selected and photographed.
Cathepsin activity assay
The lysosomal CTSB (cathepsin B) or CTSL (cathepsin L) enzymatic activity was detected with the Magic Red® reagents, using the method described previously, with modifications [Citation57,Citation58]. Cells in 24-well plates with designated treatment were incubated with Magic RedTM CTSB and CTSL reagents for 15 min. The fluorescence intensities of 10,000 cells of each sample were quantified with a BD FACS cytometer (BD Biosciences, San Jose, CA).
Proteolysis activity assay
DQTM-Red-BSA is a fluorogenic substrate for proteases, which yields red-fluorescent hydrolysis products [Citation30]. Proteolysis activity by lysosome was performed by DQTM Red BSA staining, as reported previously [Citation59]. MEFs were cultured on coverglass slide chambers and preloaded with DQ-BSA (10 μg/ml; Thermo Fisher Scientific, D12051) for 1 h. After 3 washes with PBS, the medium was changed to the designated treatments. Confocal microscopy (Olympus Fluoview FV1000) was used to detect the fluorescence intensity. The representative cells were selected and photographed.
Measurement of protein degradation using AHA labeling
A nonradioactive pulse-chase protocol using L-azidohomoalanine (AHA; Invitrogen, C10289) labeling was performed to quantify long-lived protein degradation during autophagy [Citation31,Citation32]. AHA is a surrogate for L-methionine and incorporated into proteins during de novo protein synthesis. Cells with approximately 70% to 80% confluency in a 6-well plate were washed with warm PBS and cultured in L-methionine-free DMEM for 30 min to deplete the intracellular methionine reserves. Following methionine depletion, the cells were labeled with AHA in 10% FBS DMEM (methionine-free; Thermo Fisher Scientific, 21013024) for 18 h. In this assay, dialyzed FBS was used to eliminate L-methionine from this other source. After labeling, the cells were washed with PBS and cultured in regular DMEM containing 10 × L-methionine (2 mM) for 2 h to chase out the short-lived proteins. At the indicated treatment, cells were harvested and fixed in 4% formaldehyde in PBS for 15 min at room temperature. After fixation, the cells were washed twice with 3% BSA in PBS and permeabilized with 0.5% TritonTM X-100 in PBS for 20 min at room temperature.
Cells then undergo a ‘click’ reaction between the azide group of AHA and a fluorescently tagged alkyne probe. The cells were washed by PBS and 3% BSA in PBS. For each reaction, TAMRA alkyne (10 µM), TCEP (1 mM, 100 × fresh stock in water), TBTA ligand (100 µM, 100 × stock in dimethyl sulfoxide), and CuSO4 (1 mM, 100 × stock in water) were added into the suspended cells. The samples were incubated at room temperature for 2 h, and then the reaction cocktail was removed and the cells were washed once with 3% BSA in PBS. The degradation of AHA-containing proteins could then be detected by flow cytometry.
Transient transfection and TFEB luciferase assay
The pCMV-3 × Flag-TFEB plasmid and TFEB luciferase construct were provided by Dr. A Ballabio [Citation15]. HEK293T or HCT116 cells were transfected with pCMV-3 × Flag-TFEB plasmid using Lipofectamine™ 3000 (Invitrogen, L3000015) for 24 h according to the manufacturer’s protocol and then followed by the designated treatments. For the luciferase assay, HCT116 cells were transiently transfected with the TFEB luciferase construct for 24 h, followed by designated treatments. The luciferase activity was measured using a Dual-Luciferase Reporter Assay System (Promega, E1960) based on the protocol provided by the manufacturer.
Cell fractions preparation
HCT116 and HEK293T cells were first treated with SAHA at different time points, the nuclear and cytosolic extracts were then prepared with NE-PER® nuclear and cytoplasmic extraction reagents (Pierce, 78833) according to the manufacturer’s protocol.
Small Interfering RNA (siRNA) and transient transfection
The siRNAs targeting ACAT1 (Santa Cruz Biotechnology, sc-96390) and HDAC2 (Santa Cruz Biotechnology, sc-29345) were transfected into HEK293T or HCT116 cells using Lipofectmine™ 3000 (Invitrogen, L3000015) according to the manufacturer’s protocol and then followed by SAHA treatment.
Reverse transcription and quantitative real-time PCR
RNA was extracted with the RNeasy kit (Qiagen, 217004). A reverse transcription reaction was performed using 1 μg of total RNA with a High Capacity cDNA Reverse Transcription kit (Applied Biosystems, 4368814). The mRNA expression levels were determined by real-time PCR using SoFast™ EvaGreen® Supermix (Bio-Rad, 172–5201) and a CFX96 Touch™ Real-Time PCR Detection System (Bio-Rad, CA, USA). GAPDH (glyceraldehyde-3-phosphate dehydrogenase) was used as an internal control of RNA integrity and the assay was always performed in triplicate. The primers used were based on previous reports, [Citation8,Citation60,Citation61] including human TFEB, ATG9B, LAMP1, UVRAG, CTSB, VPS11, SQSTM1, ATP6V1A, ATP6V1B2, ATP6VOC, ATP6VOE and GAPDH.
Western blotting
At the end of the designated treatments, cells were lysed in Laemmli SDS buffer (62.5 mM Tris, pH 6.8, 25% glycerol, 2% SDS, phosphatase inhibitor [Pierce, 78428], proteinase inhibitor cocktail [Roche Applied Science, 11836153001]). An equal amount of protein was resolved by SDS-PAGE and transferred onto a PVDF membrane. After blocking with 5% nonfat milk, the membrane was probed with designated primary and secondary antibodies, developed with the enhanced chemiluminescence method and visualized with Image Quant LAS 4000 system (GE Healthcare).
Chromatin immunoprecipitation (ChIP) assay
The ChIP assay was performed in HCT116 cells treated with SAHA using 2 μg of TFEB antibody (Abcam, ab2636) using the CHIP assay kit (Upstate-Millipore, 17–295). DNA was amplified with primers specific to human ATG9B and LAMP1. We designed these primers using online Primer3Plus and the details are provided as follows.
TFEB binding sites in the promoter region of ATG9B:
ACTGCTGGGACATCTGTCACGTG(-3550)AAGGGGTGGGTTGCCCCTCCA
AAGGTCAGAAGGTAAACACGTG(-3305)AACAAACGTCTCTGCATCGTAA
TTTCTTTTCCCCACAGTCACGTG(-2588)TACTTGGGGAAGAACTCCCCGG
TFEB binding sites in the promoter region of LAMP1:
CACGTGGGTCCAGGGTCACGTGCCGCTGCGGGTCACGTGCCGCTGCGGGTCACGTGTCGGCCTGCATCACGCGTGAGGGGGCGCGCGGTGCTGGAAGCTGCCGCACCTGCGGGGAGCCGAGCCGCCGGCGCTCGACGCGCGCGCTCTCGCGAGACCCGCGGGATCACGTGACGCCCGGGCGCGGCGCAGCTCACGTG (-388 to -191)
CAAAGGCTCAAGCCAGTCCACGTG(-1786)TCAGTCAATACTGCAAACTAT
Immunoprecipitation (IP)
The immunoprecipitation assay was performed based on previous reports with minor modifications [Citation62]. Briefly, the cells were lysed on ice for 30 min with the IP buffer (40 mM HEPES, pH 7.4, 120 mM NaCl, 2 mM EDTA, 0.3% CHAPS (Sigma, 10810118001), 10 mM pyrophosphate (Sigma, 221368), 10 mM glycerophosphate (Sigma, G9422), 50 mM NaF, phosphatase and protease inhibitor mixture). Cell lysates (1 μg protein) were incubated with anti-FLAG® M2 Affinity Gel or acetyl-lysine antibody conjugated agarose beads overnight with gentle rocking at 4°C. The immunoprecipitates were then washed 3 times in IP Buffer and the immunoprecipitated complexes were eluted by boiling for 5 min in sample buffer (Bio-Rad). Last, the eluted immunoprecipitated complexes were resolved on SDS-PAGE gel and transferred onto PVDF membranes (Bio-Rad, 1620177) for immunoblotting analysis.
In vitro acetylation and deacetylation assay
The acetylation reaction was performed based on a reported protocol with modifications [Citation42]. Briefly, in 30 μl of reaction mixture containing 20 mM Tris-HCl, pH 8.0, 20% glycerol, 100 mM KCl, 1 mM dithiothreitol (DTT), 0.1 mM EDTA, 2 μM SAHA, 1 mM PMSF, 100 μM acetyl-CoA (Sigma, A2056), 200 ng ACAT1 recombinant protein and 100 ng of TFEB recombinant protein were added and incubated at 30°C for 1 h. The reaction was stopped by the addition of 6 μl of 6x SDS sample buffer. The samples were subjected to SDS-PAGE and analyzed using immunoblotting.
For the deacetylation assay, HEK293T cells were transfected with pCMV-3xFlag-TFEB, and then treated with SAHA (2 μM) for 12 h before harvesting. The deacetylation reaction was performed in 50 μl of reaction mixture containing Tris-HCl (pH 8.8), 5% glycerol, 50 mM NaCl, 4 mM MgCl2, 1 mM DTT and 300 ng HDAC2 recombinant protein and Flag-TFEB immunoprecipitated by anti-FLAG M2 Affinity beads. During the incubation at 37°C for 0.5 h, the buffer was mixed once per 5 min and the reaction was stopped by addition of 10 μl of 6x SDS sample buffer. The samples were subjected to SDS-PAGE and analyzed by immunoblotting.
Mass spectrometric analysis
In this study, we used mass spectrometric (MS) analysis for 2 objectives. First, to determine the interaction proteins with TFEB in SAHA-treated cells, HEK293T cells with 3 × Flag-TFEB overexpression were treated with SAHA for 12 h and FLAG was immunoprecipitated. Immunoprecipitation of FLAG from cell lysates were performed as described [Citation63]. Immunoprecipitates were washed with lysis buffer and resolved on a 7% SDS-PAGE gel. And gel slices from SDS-PAGE separation of cell lysates were subjected to in-gel tryptic digestion. The resulting peptides were analyzed by LC-MS/MS (TripleTOF 5600 system, SCIEX, Foster City CA, USA) to identify the TFEB-interacting proteins/peptides. ProteinPilot™ 4.5 (SCIEX) was applied to protein identification using the SwissProt database.64 Second, to identify the acetylation sites in TFEB, HEK293T cells with 3 × Flag-TFEB overexpression were treated with SAHA for 12 h and FLAG was immunoprecipitated. The proteomic sample preparation was performed as described previously [Citation65]. In brief, after cells were treated as designated, the protein samples were separated by SDS-PAGE and the interested bands were trypsin digested. The peptides were analyzed with an LC-MS/MS system which comprised a Dionex Ultimate 3000 RSLC nano LC system (Thermo Fisher, Waltham, MA, USA) coupled to a Q-Exactive mass spectrometer (Thermo Fisher, Waltham, MA, USA). The UniProt human database was used for data searches using an in-house Mascot server (version 2.4.1, Matrix Science, Boston, MA). Shortlisted acetylated peptides were further confirmed by manual inspection of MS/MS spectra to identify the exact acetylation sites.
Construction of lysine mutation of TFEB
TFEB lysine (K)-to-arginine (R) mutation constructs were generated with a site-directed mutagenesis kit (Agilent Technologies, 200518). A wild-type TFEB expression vector was used as the mutagenesis template. TFEB was mutated at Lys91, Lys103, Lys116 and Lys430, separately or in combination.
Detection of viable and dead cells
Several methods were used to detect cell death quantitatively and qualitatively, which are (i) morphological changes under phase-contrast microscopy, (ii) propidium iodide (PI) live cell uptake assay coupled with flow cytometry and (iii) western blotting for PARP and CASP3 cleavage. For PI staining, the medium in each well was collected and cells were harvested with trypsin after treatments. Then, cell pellets obtained were resuspended in 1 × phosphate-buffered saline (1st Base, BUF-2041) containing PI (Sigma, P4170) at a final concentration of 5 μg/ml and incubated for 10 min at 37°C. Ten thousand cells from each sample were analyzed with a FACSCalibur flow cytometry system (BD Bioscience, San Jose, CA) using the CellQuest software.
Statistical analysis
All western blotting and image data presented are representatives from at least 3 independent experiments. The numeric data are presented as means ± S.D. from 3 independent experiments and analyzed using the Student t test.
Disclosure of potential conflicts of interest
None of the authors have declared any potential conflicts of interest.
Supplemental Material
Download Zip (22.6 MB)Acknowledgements
The authors thank Drs. N Mizushima (University of Tokyo), M Komatsu (Niigata University), (T Yoshimori (Osaka University), DJ Kwiatkowski (Brigham and Women’s Hospital, Harvard University) and A Ballabio (TIGEM, Italy) for providing the indicated reagents. This work was supported by research grants from NMRC (NMRC-CIRG/1373/2013, NMRC-CIRG/1430/2015) to Han-Ming Shen and Science Technology Department of Zhejiang Province (2015C33173) to X Sun and Zhejiang Provincial Natural Science Foundation of China (LR18H160002) to J Zhang.
Supplemental data
Supplemental data for this article can be accessed at https://doi.org/10.1080/15548627.2018.1447290.
Additional information
Funding
Related Research Data
References
- Saftig P, Klumperman J. Lysosome biogenesis and lysosomal membrane proteins: trafficking meets function. Nat Rev Mol Cell Biol. 2009;10(9):623–635. doi:nrm2745 [pii] 10.1038/nrm2745 [doi]. PubMed PMID: 19672277; eng. doi:10.1038/nrm2745.
- Luzio JP, Pryor PR, Bright NA. Lysosomes: fusion and function. Nat Rev Mol Cell Biol. 2007;8(8):622–632. doi:nrm2217 [pii] 10.1038/nrm2217 [doi]. PubMed PMID: 17637737; eng. doi:10.1038/nrm2217.
- Mindell JA. Lysosomal acidification mechanisms. Annu Rev Physiol. 2012;74:69–86. doi:10.1146/annurev-physiol-012110-142317. PubMed PMID: 22335796. doi:10.1146/annurev-physiol-012110-142317.
- Lubke T, Lobel P, Sleat DE. Proteomics of the lysosome. Biochim Biophys Acta. 2009;1793(4):625–635. doi:S0167-4889(08)00344-3 [pii] 10.1016/j.bbamcr.2008.09.018 [doi]. PubMed PMID: 18977398; PubMed Central PMCID: PMC2684028. eng. doi:10.1016/j.bbamcr.2008.09.018.
- Eskelinen EL, Saftig P. Autophagy: a lysosomal degradation pathway with a central role in health and disease. Biochim Biophys Acta. 2009;1793(4):664–673. doi: S0167-4889(08)00263-2 [pii]10.1016/j.bbamcr.2008.07.014 [doi]. PubMed PMID: 18706940; eng. doi:10.1016/j.bbamcr.2008.07.014.
- Settembre C, Fraldi A, Medina DL, Ballabio A Signals from the lysosome: a control centre for cellular clearance and energy metabolism. Nat Rev Mol Cell Biol. 2013;14(5):283–296. doi:10.1038/nrm3565. PubMed PMID: 23609508; eng. doi:10.1038/nrm3565.
- Shen HM, Mizushima N. At the end of the autophagic road: an emerging understanding of lysosomal functions in autophagy. Trends Biochem Sci. 2014;39(2):61–71. doi:10.1016/j.tibs.2013.12.001. PubMed PMID: 24369758; eng. doi:10.1016/j.tibs.2013.12.001.
- Sardiello M, Palmieri M, di Ronza A, Medina DL, Valenza M, Gennarino VA, Di Malta C, Donaudy F, Embrione V, Polishchuk RS, et al. A gene network regulating lysosomal biogenesis and function. Science. 2009;325(5939):473–477. doi:1174447 [pii] 10.1126/science.1174447 [doi]. PubMed PMID: 19556463; eng.
- Settembre C, Ballabio A. TFEB regulates autophagy: an integrated coordination of cellular degradation and recycling processes. Autophagy. 2011;7(11):1379–1381. doi:10.4161/auto.7.11.17166. PubMed PMID: 21785263; eng. doi:10.4161/auto.7.11.17166.
- Zhou J, Tan SH, Nicolas V, Bauvy C, Yang N-D, Zhang J, Xue Y, Codogno P, Shen H-M Activation of lysosomal function in the course of autophagy via mTORC1 suppression and autophagosome-lysosome fusion. Cell Res. 2013;23(4):508–523. doi:10.1038/cr.2013.11. PubMed PMID: 23337583; Eng. doi:10.1038/cr.2013.11.
- Efeyan A, Sabatini DM. Nutrients and growth factors in mTORC1 activation. Biochem Soc Trans. 2013;41(4):902–905. doi:10.1042/bst20130063. PubMed PMID: 23863153; eng. doi:10.1042/BST20130063.
- Bar-Peled L, Sabatini DM. Regulation of mTORC1 by amino acids. Trends Cell Biol. 2014;24(7):400–406. doi:10.1016/j.tcb.2014.03.003. PubMed PMID: 24698685; PubMed Central PMCID: PMCPmc4074565. eng. doi:10.1016/j.tcb.2014.03.003.
- Settembre C, Zoncu R, Medina DL, Vetrini F, Erdin S, Erdin S, Huynh T, Ferron M, Karsenty G, Vellard MC, Facchinetti V, Sabatini DM, Ballabio A A lysosome-to-nucleus signalling mechanism senses and regulates the lysosome via mTOR and TFEB. Embo j. 2012;31(5):1095–1108. doi:10.1038/emboj.2012.32. PubMed PMID: 22343943; PubMed Central PMCID: PMCPmc3298007. eng. doi:10.1038/emboj.2012.32.
- Martina JA, Chen Y, Gucek M, Puertollano R MTORC1 functions as a transcriptional regulator of autophagy by preventing nuclear transport of TFEB. Autophagy. 2012;8(6):903–914. doi:10.4161/auto.19653. PubMed PMID: 22576015; PubMed Central PMCID: PMC3427256. doi:10.4161/auto.19653.
- Settembre C, Di Malta C, Polito VA, Arencibia MG, Vetrini F, Erdin S, Erdin SU, Huynh T, Medina D, Colella P, Sardiello M, Rubinsztein DC, Ballabio A TFEB links autophagy to lysosomal biogenesis. Science. 2011;332(6036):1429–1433. doi:10.1126/science.1204592. PubMed PMID: 21617040; eng. doi:10.1126/science.1204592.
- Ferron M, Settembre C, Shimazu J, Lacombe J, Kato S, Rawlings DJ, Ballabio A, Karsenty G A RANKL-PKCbeta-TFEB signaling cascade is necessary for lysosomal biogenesis in osteoclasts. Genes Dev. 2013;27(8):955–969. doi:10.1101/gad.213827.113. PubMed PMID: 23599343; PubMed Central PMCID: PMCPMC3650231. eng. doi:10.1101/gad.213827.113.
- Falkenberg KJ, Johnstone RW. Histone deacetylases and their inhibitors in cancer, neurological diseases and immune disorders. Nat Rev Drug Discov. 2014;13(9):673–691. doi:10.1038/nrd4360. PubMed PMID: 25131830; eng. doi:10.1038/nrd4360.
- You L, Nie J, Sun WJ, Zheng Z-Q, Yang X-J Lysine acetylation: enzymes, bromodomains and links to different diseases. Essays Biochem. 2012;52:1–12. doi:10.1042/bse0520001. PubMed PMID: 22708559; eng. doi:10.1042/bse0520001.
- Zhang J, Zhong Q. Histone deacetylase inhibitors and cell death. Cell Mol Life Sci. 2014;71(20):3885–3901. doi:10.1007/s00018-014-1656-6. PubMed PMID: 24898083; eng. doi:10.1007/s00018-014-1656-6.
- West AC, Johnstone RW. New and emerging HDAC inhibitors for cancer treatment. J Clin Invest. 2014;124(1):30–39. doi:10.1172/jci69738. PubMed PMID: 24382387; PubMed Central PMCID: PMCPmc3871231. eng. doi:10.1172/JCI69738.
- Li Z, Zhu WG. Targeting histone deacetylases for cancer therapy: from molecular mechanisms to clinical implications. Int J Biol Sci. 2014;10(7):757–770. doi:10.7150/ijbs.9067. PubMed PMID: 25013383; PubMed Central PMCID: PMCPmc4081609. eng. doi:10.7150/ijbs.9067.
- Fullgrabe J, Heldring N, Hermanson O, Joseph B Cracking the survival code: autophagy-related histone modifications. Autophagy. 2014;10(4):556–561. doi:10.4161/auto.27280. PubMed PMID: 24429873; PubMed Central PMCID: PMCPMC4091144. doi:10.4161/auto.27280.
- Lee JY, Koga H, Kawaguchi Y, Tang W, Wong E, Gao Y-S, Pandey UB, Kaushik S, Tresse E, Lu J, Taylor Jul, Cuervo AM, Yao T-P HDAC6 controls autophagosome maturation essential for ubiquitin-selective quality-control autophagy. Embo J. 2010;29(5):969–980. doi:10.1038/emboj.2009.405. PubMed PMID: 20075865; PubMed Central PMCID: PMC2837169. eng. doi:10.1038/emboj.2009.405.
- Zhang J, Ng S, Wang J, Zhou J, Tan S-H, Yang N, Lin Q, Xia D, Shen H-M Histone deacetylase inhibitors induce autophagy through FOXO1-dependent pathways. Autophagy. 2015;11(4):629–642. doi:10.1080/15548627.2015.1023981. PubMed PMID: 25919885; eng. doi:10.1080/15548627.2015.1023981.
- Torgersen ML, Engedal N, Boe SO, Hokland P, Simonsen A Targeting autophagy potentiates the apoptotic effect of histone deacetylase inhibitors in t(8;21) AML cells. Blood. 2013;122(14):2467–2476. doi:10.1182/blood-2013-05-500629. PubMed PMID: 23970379. doi:10.1182/blood-2013-05-500629.
- Eriksson I, Joosten M, Roberg K, Öllinger K The histone deacetylase inhibitor trichostatin A reduces lysosomal pH and enhances cisplatin-induced apoptosis. Exp Cell Res. 2013;319(1):12–20. doi:10.1016/j.yexcr.2012.10.004. PubMed PMID: 23063877; eng. doi:10.1016/j.yexcr.2012.10.004.
- Lu J, Yang C, Chen M, Ye DY, Lonser RR, Brady RO, Zhuang Z Histone deacetylase inhibitors prevent the degradation and restore the activity of glucocerebrosidase in Gaucher disease. Proc Natl Acad Sci U S A. 2011;108(52):21200–21205. doi:10.1073/pnas.1119181109. PubMed PMID: 22160715; PubMed Central PMCID: PMCPmc3248545. eng. doi:10.1073/pnas.1119181109.
- Lee JH, Budanov AV, Karin M. Sestrins orchestrate cellular metabolism to attenuate aging. Cell Metab. 2013;18(6):792–801. doi:10.1016/j.cmet.2013.08.018. PubMed PMID: 24055102; PubMed Central PMCID: PMC3858445. doi:10.1016/j.cmet.2013.08.018.
- Helquist P, Maxfield FR, Wiech NL, Wiest O Treatment of Niemann–pick type C disease by histone deacetylase inhibitors. Neurotherapeutics: The J Am Soc Experim NeuroTherap. 2013;10(4):688–697. doi:10.1007/s13311-013-0217-2. PubMed PMID: 24048860; PubMed Central PMCID: PMCPmc3805865. eng. doi:10.1007/s13311-013-0217-2.
- Yang ND, Tan SH, Ng S, Shi Y, Zhou J, Tan KSW, Wong W-SF, Shen H-M Artesunate induces cell death in human cancer cells via enhancing lysosomal function and lysosomal degradation of ferritin. J Biol Chem. 2014;289(48):33425–33441. doi:10.1074/jbc.M114.564567. PubMed PMID: 25305013; PubMed Central PMCID: PMCPMC4246098. eng. doi:10.1074/jbc.M114.564567.
- Zhang J, Wang J, Ng S, Lin Q, Shen H-M Development of a novel method for quantification of autophagic protein degradation by AHA labeling. Autophagy. 2014;10(5):901–912. doi:10.4161/auto.28267. PubMed PMID: 24675368. doi:10.4161/auto.28267.
- Wang J, Zhang J, Lee YM, Ng S, Shi Y, Hua Z-C, Lin Q, Shen H-M Nonradioactive quantification of autophagic protein degradation with L-azidohomoalanine labeling. Nat Protoc. 2017;12(2):279–288. doi:10.1038/nprot.2016.160. PubMed PMID: 28079880; eng. doi:10.1038/nprot.2016.160.
- Liu YL, Yang PM, Shun CT, Wu M-S, Weng J-R, Chen C-C Autophagy potentiates the anti-cancer effects of the histone deacetylase inhibitors in hepatocellular carcinoma. Autophagy. 2010;6(8):1057–1065. PubMed PMID: 20962572; eng. doi:10.4161/auto.6.8.13365.
- Kwiatkowski DJ Rhebbing up mTOR: new insights on TSC1 and TSC2, and the pathogenesis of tuberous sclerosis. Cancer Biol Ther. 2003;2(5):471–476. PubMed PMID: 14614311. doi:10.4161/cbt.2.5.446.
- Komatsu M, Waguri S, Ueno T, Iwata J, Murata S, Tanida I, Ezaki J, Mizushima N, Ohsumi Y, Uchiyama Y, Kominami E, Tanaka K, Chiba T Impairment of starvation-induced and constitutive autophagy in Atg7-deficient mice. J Cell Biol. 2005;169(3):425–434. doi:jcb.200412022 [pii]10.1083/jcb.200412022 [doi]. PubMed PMID: 15866887; PubMed Central PMCID: PMC2171928. eng. doi:10.1083/jcb.200412022.
- Mizushima N, Yamamoto A, Hatano M, Kobayashi Y, Kabeya Y, Suzuki K, Tokuhisa T, OhsumiY, Yoshimori T Dissection of autophagosome formation using Apg5-deficient mouse embryonic stem cells. J Cell Biol. 2001;152(4):657–668. PubMed PMID: 11266458; PubMed Central PMCID: PMC2195787. eng. doi:10.1083/jcb.152.4.657.
- Pécuchet N, Cluzeau T, Thibault C, Mounier N, Vignot S. Histone deacetylase inhibitors: highlight on epigenetic regulation. Bull Cancer. 2010;97(8):917–935. doi:10.1684/bdc.2010.1121. PubMed PMID: 20483706.
- Zhao S, Xu W, Jiang W, Yu W, Lin Y, Zhang T, Yao J, Zhou L, Zeng Y, Li H, Li Y, Shi J, An W, Hancock SM, He F, Qin L, Chin J, Yang P, Chen X, Lei Q, Xiong Y, Guan K-L Regulation of cellular metabolism by protein lysine acetylation. Science. 2010;327(5968):1000–1004. doi:10.1126/science.1179689. PubMed PMID: 20167786; PubMed Central PMCID: PMCPMC3232675. doi:10.1126/science.1179689.
- Xie Y, Kang R, Sun X, Zhong M, Huang J, Klionsky DJ, Tang D Posttranslational modification of autophagy-related proteins in macroautophagy. Autophagy. 2015;11(1):28–45. doi:10.4161/15548627.2014.984267. PubMed PMID: 25484070. doi:10.4161/15548627.2014.984267.
- Lee IH, Finkel T. Regulation of autophagy by the p300 acetyltransferase. J Biol Chem. 2009;284(10):6322–6328. doi:10.1074/jbc.M807135200. PubMed PMID: 19124466. doi:10.1074/jbc.M807135200.
- Lee IH, Cao L, Mostoslavsky R, Lombard DB, Liu J, Bruns NE, Tsokos M, Alt FW, Finkel T A role for the NAD-dependent deacetylase Sirt1 in the regulation of autophagy. Proc Natl Acad Sci U S A. 2008;105(9):3374–3379. doi:10.1073/pnas.0712145105. PubMed PMID: 18296641; PubMed Central PMCID: PMC2265142. eng. doi:10.1073/pnas.0712145105.
- Lin SY, Li TY, Liu Q, Zhang C, Li X, Chen Y, Zhang S-M, Lian G, Liu Q, Ruan K, Wang Z, Zhang C-S, Chien K-Y, Wu J, Li Q, Han J, Lin S-C GSK3-TIP60-ULK1 signaling pathway links growth factor deprivation to autophagy. Science. 2012;336(6080):477–481. doi:10.1126/science.1217032. PubMed PMID: 22539723. doi:10.1126/science.1217032.
- Zhao Y, Yang J, Liao W, Liu X, Zhang H, Wang S, Wang D, Feng J, Yu L, Zhu W-G Cytosolic FoxO1 is essential for the induction of autophagy and tumour suppressor activity. Nat Cell Biol. 2010;12(7):665–675. doi:ncb2069 [pii] 10.1038/ncb2069 [doi]. PubMed PMID: 20543840; eng. doi:10.1038/ncb2069.
- Chang C, Su H, Zhang D, Wang Y, Shen Q, Liu B, Huang R, Zhou T, Peng C, Wong C, Shen H-M, Lippincott-Schwartz J, Liu W AMPK-Dependent Phosphorylation of GAPDH Triggers Sirt1 Activation and Is Necessary for Autophagy upon Glucose Starvation. Mol Cell. 2015;60(6):930–940. doi: 10.1016/j.molcel.2015.10.037. PubMed PMID: 26626483; eng. doi:10.1016/j.molcel.2015.10.037.
- Huan R, Xu Y, Wan W, Shou X, Qian J, You Z, Liu B, Chang C, Zhou T, Lippincott-Schwartz J, Liu W Deacetylation of nuclear LC3 drives autophagy initiation under starvation. Mol Cell. 2015;57(3):456–466. doi:10.1016/j.molcel.2014.12.013. PubMed PMID: 25601754. doi:10.1016/j.molcel.2014.12.013.
- Matsuzaki H, Daitoku H, Hatta M, Aoyama H, Yoshimochi K, Fukamizu A Acetylation of Foxo1 alters its DNA-binding ability and sensitivity to phosphorylation. Proc Natl Acad Sci U S A. 2005;102(32):11278–11283. doi:10.1073/pnas.0502738102. PubMed PMID: 16076959; PubMed Central PMCID: PMC1183558. doi:10.1073/pnas.0502738102.
- Bao J, Zheng L, Zhang Q, Li X, Zhang X, Li Z, Bai X, Zhang Z, Huo W, Zhao X, Shang S, Wang Q, Zhang C, Ji J Deacetylation of TFEB promotes fibrillar Abeta degradation by upregulating lysosomal biogenesis in microglia. Protein Cell. 2016;7(6):417–433. doi:10.1007/s13238-016-0269-2. PubMed PMID: 27209302; PubMed Central PMCID: PMCPMC4887328. doi:10.1007/s13238-016-0269-2.
- Verdin E, Ott M. 50 years of protein acetylation: from gene regulation to epigenetics, metabolism and beyond. Nat Rev Mol Cell Biol. 2015;16(4):258–264. doi:10.1038/nrm3931. PubMed PMID: 25549891. doi:10.1038/nrm3931.
- Peixoto P, Lansiaux A. Histone-deacetylases inhibitors: from TSA to SAHA. Bull Cancer. 2006;93(1):27–36. PubMed PMID: 16455503.
- Du Bois P, Pablo Tortola C, Lodka D, Kny M, Schmidt F, Song K, Schmidt S, Bassel-Duby R, Olson EN, Fielitz J Angiotensin II induces skeletal muscle atrophy by activating TFEB-mediated MuRF1 expression. Circ Res. 2015;117(5):424–436. doi:10.1161/circresaha.114.305393. PubMed PMID: 26137861; PubMed Central PMCID: PMCPMC4537692. eng. doi:10.1161/CIRCRESAHA.114.305393.
- Yang Y, Zhao Y, Liao W, Yang J, Wu L, Zheng Z, Yu Y, Zhou W, Li L, Feng J, Wang H, Zhu W-G Acetylation of FoxO1 activates Bim expression to induce apoptosis in response to histone deacetylase inhibitor depsipeptide treatment. Neoplasia. 2009;11(4):313–IN1. PubMed PMID: 19308286; PubMed Central PMCID: PMC2657887. doi:10.1593/neo.81358.
- Roczniak-Ferguson A, Petit CS, Froehlich F, Qian S, Ky J, Angarola B, Walther TC, Ferguson SM The transcription factor TFEB links mTORC1 signaling to transcriptional control of Lysosome Homeostasis. Sci Signal. 2012, 2012;5(228):ra42–ra42. doi: 10.1126/scisignal.2002790. doi:10.1126/scisignal.2002790.
- Healy S, Khan DH, Davie JR. Gene expression regulation through 14-3-3 interactions with histones and HDACs. Discov Med. 2011;11(59):349–58. PubMed PMID: 21524388; eng.
- Zhang H, Cicchetti G, Onda H, Koon HB, Asrican K, Bajraszewski N, Vazquez F, Carpenter CL, Kwiatkowski DJ Loss of Tsc1/Tsc2 activates mTOR and disrupts PI3K-Akt signaling through downregulation of PDGFR [Research Support, Non-U.S. Gov’t Research Support, U.S. Gov’t, P.H.S.]. J Clin Invest. 2003;112(8):1223–1233. doi:10.1172/JCI17222. PubMed PMID: 14561707; PubMed Central PMCID: PMC213485. eng. doi:10.1172/JCI200317222.
- Kuma A, Hatano M, Matsui M, Yamamoto A, Nakaya H, Yoshimori T, Ohsumi Y, Tokuhisa T, Mizushima N The role of autophagy during the early neonatal starvation period. Nature. 2004;432(7020):1032–1036. PubMed PMID: 15525940. doi:10.1038/nature03029.
- Traganos F, Darzynkiewicz Z. Lysosomal proton pump activity: supravital cell staining with acridine orange differentiates leukocyte subpopulations. Methods Cell Biol. 1994;41:185–94. PubMed PMID: 7532261. doi:10.1016/S0091-679X(08)61717-3. PMID:7532261
- Ni HM, Bockus A, Wozniak AL, Jones K, Weinman S, Yin X-M, Ding W-X Dissecting the dynamic turnover of GFP-LC3 in the autolysosome. Autophagy. 2011;7(2):188–204. doi:14181 [pii]. PubMed PMID: 21107021; PubMed Central PMCID: PMC3039769. eng. doi:10.4161/auto.7.2.14181.
- Zhou J, Tan SH, Nicolas V, Bauvy C, Yang N-D, Zhang J, Xue Y, Codogno P, Shen H-M Activation of lysosomal function in the course of autophagy via mTORC1 suppression and autophagosome-lysosome fusion [Research Support, Non-U.S. Gov’t]. Cell research. 2013;23(4):508–523. doi:10.1038/cr.2013.11. PubMed PMID: 23337583; PubMed Central PMCID: PMC3616426. eng. doi:10.1038/cr.2013.11.
- Ha SD, Ham B, Mogridge J, Saftig P, Lin S, Kim SO Cathepsin B-mediated autophagy flux facilitates the anthrax toxin receptor 2-mediated delivery of anthrax lethal factor into the cytoplasm [Research Support, Non-U.S. Gov’t]. J Biol Chem. 2010;285(3):2120–2129. doi: 10.1074/jbc.M109.065813. PubMed PMID: 19858192; PubMed Central PMCID: PMC2804368. eng. doi:10.1074/jbc.M109.065813.
- Chen CC, Jeon SM, Bhaskar PT, Nogueira V, Sundararajan D, Tonic I, Park Y, Hay N FoxOs inhibit mTORC1 and activate Akt by inducing the expression of Sestrin3 and Rictor. Dev Cell. 2010;18(4):592–604. doi:S1534-5807(10)00146-2 [pii] 10.1016/j.devcel.2010.03.008 [doi]. PubMed PMID: 20412774; eng. doi:10.1016/j.devcel.2010.03.008.
- Zhao J, Brault JJ, Schild A, Cao P, Sandri M, Schiaffino S, Lecker SH, Goldberg AL FoxO3 coordinately activates protein degradation by the autophagic/lysosomal and proteasomal pathways in atrophying muscle cells. Cell Metab. 2007;6(6):472–483. doi:10.1016/j.cmet.2007.11.004. PubMed PMID: 18054316; eng. doi:10.1016/j.cmet.2007.11.004.
- Tan SH, Shui G, Zhou J, Li JJ, Bay B-H, Wenk MR, Shen H-M Induction of autophagy by palmitic acid via protein kinase c-mediated signaling pathway independent of mTOR (Mammalian Target of Rapamycin). J Biol Chem. 2012;287(18):14364–14376. doi:10.1074/jbc.M111.294157. PubMed PMID: 22408252; PubMed Central PMCID: PMC3340233. eng. doi:10.1074/jbc.M111.294157.
- Yang Y, Rao R, Shen J, Tang Y, Fiskus W, Nechtman J, Atadja P, Bhalla K Role of acetylation and extracellular location of heat shock protein 90alpha in tumor cell invasion. Cancer Res. 2008;68(12):4833–4842. doi:10.1158/0008-5472.CAN-08-0644. PubMed PMID: 18559531; PubMed Central PMCID: PMC2665713. doi:10.1158/0008-5472.CAN-08-0644.
- Wang J, Zhang CJ, Chia WN, Loh CCY, Li Z, Lee YM, He Y, Yuan L-X, Lim TK, Liu M, Liew CX, Lee YQ, Zhang J, Lu N, Lim CT, Hua Z-C, Liu B, Shen H-M, Tan KSW, Lin Q Haem-activated promiscuous targeting of artemisinin in Plasmodium falciparum. Nat Commun. 2015;6:10111. doi:10.1038/ncomms10111. PubMed PMID: 26694030; eng. doi:10.1038/ncomms10111. PMID:26694030
- Park JE, Tan HS, Datta A, Lai RC, Zhang H, Meng W, Lim S, Sze SK Hypoxic tumor cell modulates its microenvironment to enhance angiogenic and metastatic potential by secretion of proteins and exosomes. Mol Cell Proteom. 2010;9(6):1085–1099. doi:10.1074/mcp.M900381-MCP200. PubMed PMID: 20124223; PubMed Central PMCID: PMCPMC2877972. (If: 7.3). doi:10.1074/mcp.M900381-MCP200.