
ABSTRACT
Defects in basal autophagy limit the nutrient supply from recycling of intracellular constituents. Despite our understanding of the prosurvival role of macroautophagy/autophagy, how nutrient deprivation, caused by compromised autophagy, affects oncogenic KRAS-driven tumor progression is poorly understood. Here, we demonstrate that conditional impairment of the autophagy gene Atg5 (atg5-KO) extends the survival of KRASG12V-driven tumor-bearing mice by 38%. atg5-KO tumors spread more slowly during late tumorigenesis, despite a faster onset. atg5-KO tumor cells displayed reduced mitochondrial function and increased mitochondrial fragmentation. Metabolite profiles indicated a deficiency in the nonessential amino acid asparagine despite a compensatory overexpression of ASNS (asparagine synthetase), key enzyme for de novo asparagine synthesis. Inhibition of either autophagy or ASNS reduced KRASG12V-driven tumor cell proliferation, migration, and invasion, which was rescued by asparagine supplementation or knockdown of MFF (mitochondrial fission factor). Finally, these observations were reflected in human cancer-derived data, linking ASNS overexpression with poor clinical outcome in multiple cancers. Together, our data document a widespread yet specific asparagine homeostasis control by autophagy and ASNS, highlighting the previously unrecognized role of autophagy in suppressing the metabolic barriers of low asparagine and excessive mitochondrial fragmentation to permit malignant KRAS-driven tumor progression.
Introduction
Oncogenic RAS mutations are found in approximately 30% of cancers, and lead to poor prognosis. The RAS type GTPase family oncoproteins (HRAS, NRAS, and KRAS) are considered “undruggable,” causing a shortage of therapeutic options. Therefore, a potential treatment approach for RAS-associated cancers is to target their metabolic vulnerabilities. One such metabolic vulnerability is that many KRAS-driven tumors become dependent on autophagy for survivalCitation1. Autophagy is a normal catabolic process, which safeguards quality control in organelles by removing and recycling protein aggregates to maintain cell and tissue homeostasis. However, there is no consensus on the role of autophagy in cancer. For instance, in RAS-induced pancreatic tumors, disruption of macroautophagy/autophagy, by knockout of the essential autophagy related genes Atg5 or Atg7, accelerates the emergence of pre-malignant lesionsCitation2,Citation3. By contrast, in PyMT oncogene-driven mammary tumors, disruption of autophagy by Rb1cc1/Fip200 (RB1-induced coiled-coil 1) ablation, suppresses tumorigenesisCitation4. Furthermore, a recent study shows that autophagy is dispensable for KRAS-driven tumor cell proliferation in vitro or tumorigenesis in vivo, in a xenograft studyCitation5. Therefore, the role of autophagy in cancer is complex, and likely depends on the context, type, and stage of tumors.
Given the complex role of autophagy, it is debatable whether there is a unifying molecular mechanism to resolve the role of autophagy in cancer progression. Various mechanistic pathways have been proposed for both the pro- and anti-cancer functions of autophagy. For instance, autophagy is required for anti-cancer immunosurveillance, which prevents tumorigenesisCitation6. In contrast, autophagy promotes tumorigenesis by recycling proteins, thereby meeting the high metabolic demands of rapidly dividing cancer cellsCitation7,Citation8. Other pro-tumorigenic consequences of autophagy include promoting the secretion of pro-invasive cytokines, such as TGFB1 (transforming growth factor, beta 1), and inducing the epithelial-to-mesenchymal transition (EMT)Citation8. Recent reports have shown that AHR (aryl-hydrocarbon receptor) negatively regulates autophagy and EMT in lung cancerCitation9, whereas the E3 ubiquitin ligase MARCH5 (membrane-associated ring finger [C3HC4] 5) promotes autophagy, migration and invasion in ovarian cancer cellsCitation10. One plausible explanation is that autophagy modulates several targets, which act in mutual opposition to regulate tumor initiation, progression, and invasion. Thus, autophagy inhibition could result in different outcomes depending on the timing, duration, or method of inhibition during tumorigenesis. Further insight into the mechanisms linking autophagy and cancer is required to clarify elements that influence cancer progression.
The objective of this study was to identify the molecular mechanisms underlying the intricate connection of autophagy with cancer. Accordingly, we examined the impact of autophagy loss in a well-characterized salivary duct carcinoma (SDC) mouse model driven by oncogenic KRASGCitation12V combined with Atg5 knockout (atg5-KO). These highly aggressive tumors show similarity to ductal carcinoma of the breast and may serve as a model for tumors of ductal origin. We found that blocking autophagy promotes early tumorigenesis but slows tumor growth, leading to extended survival, and indicating that the timing of autophagy disruption is important for its effects. Using this model, we characterized the autophagic regulation of oncogenic KRAS-driven metabolic reprogramming. By studying the intracellular level of asparagine, a nonessential amino acid, and mitochondrial integrity in atg5-KO tumor cells, we found that autophagy is essntial for oncogenic KRAS to reprogram and rewire cellular metabolism, especially mitochondrial function and amino acid profiling. Of note, low asparagine or excessive mitochondrial fission decreased KRASGCitation12V-driven tumor cell motility and invasion. The mechanistic link between impaired autophagy with attenuated cell migration was validated by the supplementation of asparagine or knockdown of MFF (mitochondrial fission factor). The critical tumor-promoting role of asparagine is further supported by the overexpression of ASNS (asparagine synthetase), key enzyme for de novo asparagine biosynthesis, is associated with poor clinical outcomes in multiple human cancers. Collectively, our findings show that autophagy has a dual role in experimental KRAS-mediated tumorigenesis, with an overall pro-cancer effect. Furthermore, a pathway connecting autophagy, asparagine, and mitochondrial integrity is critical for oncogenic KRAS-transformed tumor cell migration and invasion, providing mechanistic insights into the role of autophagy in tumor progression.
Results
Autophagy deficiency extends survival in an experimental KRASGCitation12V tumor model
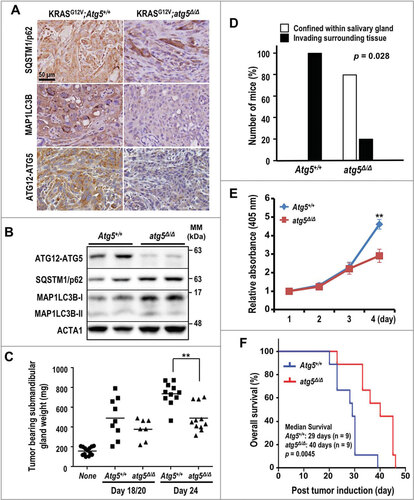
Earlier studies established a mouse tumor model with inducible salivary ductal cell-specific activation of oncogenic KRASGCitation12V to recapitulate the local invasion and sarcomatoid manifestation of human SDCCitation11. To test the role of autophagy in the various stages of SDC development, we crossed the KRASGCitation12V SDC miceCitation11 with a mouse model for conditional genetic disruption of the essential autophagy protein ATG5 (Atg5flox/flox)Citation12,Citation13. ATG5 is required for the formation of autophagosomesCitation12,Citation14. The simultaneous Ela-CreERT-dependent induction of KRASGCitation12V and ablation of Atg5 in the salivary ductal cells of KRASGCitation12V;atg5∆/∆ mice was achieved through tamoxifen-inducible Cre-Lox recombination. Deletion of Atg5 did not block the formation of SDC in KRASGCitation12V;atg5∆/∆ animals. Immunohistochemistry (IHC) analysis revealed low levels of both ATG5 and MAP1LC3B/LC3B (microtubule-associated protein 1 light chain 3 beta) (), and western analyses showed low ATG5, moderately elevated SQSTM1/p62 (sequestosome 1) levels, and a higher LC3B-I:II ratio indicating that autophagy was impaired in SDC of KRASGCitation12V;atg5∆/∆ mice (). At d 24 after administration of tamoxifen, the average weight of KRASGCitation12V;Atg5+/+ tumor-bearing submandibular glands was significantly higher than that of the KRASGCitation12V;atg5∆/∆ tumor-bearing glands (). Accordingly, d 24 tumors from KRASGCitation12V;atg5∆/∆ mice often exhibited areas of normal tissue admixed with tumor tissues, whereas the KRASGCitation12V;Atg5+/+ tumors had fewer normal tissue regions (Fig. S1A-D). Furthermore, although the KRASGCitation12V;atg5∆/∆ tumors were often confined within the submandibular glands, the KRASGCitation12V;Atg5+/+ tumors diffusely infiltrated the interlobular and peri-salivary gland soft tissue (, S1E and S1F). The growth rate of primary tumor cells from the KRASGCitation12V;Atg5+/+ mice was significantly higher than that from the KRASGCitation12V;atg5∆/∆ mice (). Lastly, Kaplan-Meier survival curves showed that genetic disruption of Atg5 in the KRASGCitation12V-driven SDC mouse model extended the post-induction median survival by 38%, compared with KRASGCitation12V;Atg5+/+ mice (, p = 0.0045). In summary, ablation of Atg5 did not block the formation of KRASGCitation12V-driven SDC tumors, but loss of autophagy reduced the tumor burden and prolonged survival.
Figure 1. Enhanced survival of autophagy-deficient KRASGCitation12V;atg5∆/∆ mice. (A) Representative IHC of SQSTM1, LC3B and ATG12–ATG5 in SDC tumors from KRASGCitation12V;Atg5+/+ and KRASGCitation12V;atg5∆/∆ mice (d 15). The SDC tumors from KRASGCitation12V;atg5∆/∆ mice (d 15) show the loss of ATG12–ATG5 and LC3B staining in tumor cells. Scale bar: 50 µm. (B) Western analyses of lysate of SDC tumors recovered from KRASGCitation12V;Atg5+/+ and KRASGCitation12V;atg5∆/∆ mice with the indicated antibodies. (C) Increased tumor burden in KRASGCitation12V;Atg5+/+ mice. Submandibular glands from KRASGCitation12V;Atg5+/+ and KRASGCitation12V;atg5∆/∆ mice were harvested at d 18 and 20 (d 18/20 combined group), and d 24 post-tamoxifen and wet weights were recorded. Submandibular glands from untreated littermates serve as controls and are designated as “none”. p = 0.0045 between KRASGCitation12V;Atg5+/+ and KRASGCitation12V;atg5∆/∆ cohorts at d 24 (n ≥ 7). (D) Extra-salivary-gland invasion in the KRASGCitation12V;Atg5+/+ cohort at d 20 (p = 0.028, n = 5). (E) Autophagy promotes cell growth in vitro. In vitro cell growth analysis was performed by seeding KRASGCitation12V;Atg5+/+ and KRASGCitation12V;atg5∆/∆ primary tumor cells at low density and measuring viability every 24 h for 4 consecutive d by ACP analysis. **: p < 0.01. (F) The Kaplan-Meier survival curves for KRASGCitation12V;Atg5+/+ and KRASGCitation12V;atg5∆/∆ mice after tumor induction by tamoxifen (n = 9 for each cohort). p = 0.0045 (log-rank test)
Nonequivalent roles of autophagy during oncogenic KRAS-driven tumor initiation and tumor progression
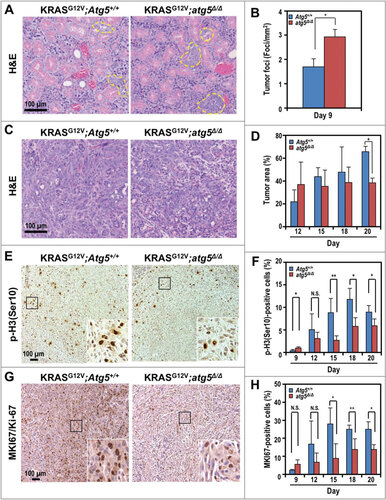
To gain insight into the complex role of autophagy during tumor development, we performed histological analysis of submandibular glands at multiple time points, generally from d 9 to d 20 at 3-d intervals post tamoxifen treatments. Humane endpoints were typically reached in tumor-bearing mice d 20 after tumor induction, and euthanasia ensued. Similar to staging of human salivary gland cancers (https://www.cancer.org/cancer/salivary-gland-cancer/detection-diagnosis-staging/staging.html), time points were chosen based on the size of the tumor. We observed more hyperplastic tumor foci in the KRASGCitation12V;atg5∆/∆ mice, as early as at 9 d after tumor induction, compared with KRASGCitation12V;Atg5+/+ mice ( and ). By d 12, we observed high variability in the mean tumor burden (tumor-to-gland area ratio) with a trend toward an increase in the KRASGCitation12V;atg5∆/∆ mice; however, tumor burden in KRASGCitation12V;Atg5+/+ mice caught up at later time points ( and ). To reconcile the increased tumor focus formation with the increased overall survival of the KRASGCitation12V;atg5∆/∆ mice, we measured proliferation using antibodies for phospho-Histone H3 (Ser10), which labels cells in the mitotic (M) phase, and MKI67/Ki-67, which labels proliferative cells. In contrast to the increased tumor initiation, there were fewer M-phase and proliferating cells in the Atg5-deficient mice at d 15 to 20 after tamoxifen administration, compared with the autophagy-competent controls (-H and S2). Furthermore, the number of phospho-H3(Ser10)-positive proliferating cells in tumors of the SDC-Atg5+/+ mice increased from d 9 to d 18, and was sustained until d 20 (). Also, the number of proliferating cells was consistently higher in KRASGCitation12V;Atg5+/+ tumors than in tumors of KRASGCitation12V;atg5∆/∆ littermates at d 15 through d 20 time points (). Lastly, tumors from KRASGCitation12V;Atg5+/+ mice invaded the interlobular septal stroma (Fig. S3), which was rare in tumors from KRASGCitation12V;atg5∆/∆ littermates. Therefore, although the loss of ATG5-regulated autophagy accelerated oncogenic transformation at the onset of KRASGCitation12V activation, as evidenced by an initial increase in tumor foci, loss of autophagy also blocked progression of the tumor foci to sarcomatoid tumors. This reduced rate of progression may account for the survival advantage of KRASGCitation12V;atg5∆/∆ tumor-bearing mice ().
Figure 2. Accelerated tumor initiation and delayed progression of SDCs in KRASGCitation12V;atg5∆/∆ mice. (A) Representative histological analyses (hematoxylin and eosin, or H&E staining) of submandibular glands at d 9 post tumor induction. Yellow dotted line: tumor foci. (B) Quantification of tumor foci number on d 9. (C) Representative histological analyses (H&E staining) of submandibular glands at d 12 post tumor induction. At d 12, the Atg5+/+ mice showed diffuse spindle tumor cells infiltrating the peri-acinar tissue, while in the atg5∆/∆ mice, the tumor cells formed nodules with less microinvation. (D) Quantification of percentage of tumor area on d 12, 15, 18 and 20. (E and G) Representative IHC of proliferation markers, phospho-histone H3 (Ser10) (p-H3(Ser10); E) and MKI67 (G) in d 20 SDCs from KRASGCitation12V;Atg5+/+ and KRASGCitation12V;atg5∆/∆ mice. Expanded view of the boxed area was shown on bottom right corner of each image. (F and H) Quantification of p-H3(Ser10) (F) and MKI67/Ki-67 (H) stained cells relative to the total cell number at d 9, 12, 15, 18, and 20. Representative IHCs shown in Fig. S2. Three random low-power fields were quantified from each mouse. Data are shown as mean ± S.D.; n ≥ 4. *: p < 0.05; **: p < 0.01; N.S.: not significant (Student t test, 2-tailed, unpaired). Scale bar: 100 μm
Autophagy disruption impairs mitochondrial bioenergetics in tumor cells
Multiple primary tumor cells were isolated from both genotypes to perform molecular analyses. The ex vivo morphology was similar between primary atg5-KO and Atg5-WT tumor cells and autophagy deficiency in atg5-KO cells is supported by western analyses showing reduced ATG5, elevation in SQSTM1 level, and reduced LC3B-I to LC3B-II conversion (Fig. S4A-D). Next, we determined whether loss of autophagy impairs oncogenic KRAS-mediated metabolic reprogramming by systematically comparing the molecular circuitry governing the bioenergetic state ex vivo. Compromised autophagy reduced the basal respiration and diminished the spare respiratory capacity, as measured by the oxygen consumption rate (OCR) assay (), suggesting that ATG5 loss impairs oxidative metabolism and reduces mitochondrial function. However, the rate of glycolysis and glycolytic capacity, reflected by the extracellular acidification rate (ECAR), were similar between tumor cells from both genotypes (). As expected, reduced oxidative respiration, without a compensatory increase in glycolytic rate, lowered ATP production (). These results are consistent with a model wherein the reduced cell proliferation rate () and suppressed OCR and ATP production ( and ) reduce the tumor burden, and extend the survival of autophagy-impaired SDC tumor-bearing mice ().
Figure 3. KRASGCitation12V;atg5∆/∆ tumor cells exhibit a lower oxygen consumption rate. (A and B) Oxygen consumption rate (OCR) (A) and extracellular acidification rate (ECAR) (B) were measured in KRASGCitation12V;Atg5+/+ (WT1, WT2; colored blue) and KRASGCitation12V;atg5∆/∆ (KO1, KO2; colored red) cells isolated from 2 individual mice of each genotype. Data are shown as the mean ± S.D.; n = 3. (C) Levels of ATP were measured in KRASGCitation12V;Atg5+/+ and KRASGCitation12V;atg5∆/∆ cells. The ATP levels were normalized to cell number. Data are shown as mean ± S.D.; n = 3. (D) Decreased intracellular reactive oxygen species (ROS) levels in KRASGCitation12V;atg5∆/∆ cells were measured by staining for oxidized dichlorofluorescein (DCF) and analyzed by flow cytometry. A representative flow cytometry plot of the DCF fluorescence intensity is shown. (E) Quantification of oxidized DCF fluorescent intensity. The intensity of DCF, oxidized from nonfluorescent DCFDA, was analyzed by flow cytometry. Relative oxidized DCF levels are calculated from mean DCF intensity of 2 independently isolated KRASGCitation12V;Atg5+/+ or KRASGCitation12V;atg5∆/∆ cells, respectively. Data are shown as the mean ± S.D.; n = 3. (F) ROS levels in KRASGCitation12V;Atg5+/+ and KRASGCitation12V;atg5∆/∆ cells treated with N-acetyl cysteine (NAC), a ROS scavenger. SDC primary cells were treated with the indicated concentrations of NAC for 24 h prior to ROS detection by DCFDA staining. Relative oxidized DCF intensity was calculated by normalizing to unstained controls (set as 1). Data are shown as mean ± S.D.; n = 3. (G and H) Autophagy-compromised KRASGCitation12V;atg5∆/∆ cells exhibit excessive fragmentation of the mitochondria. KRASGCitation12V;atg5∆/∆ (G) and KRASGCitation12V;Atg5+/+ (H) primary tumor cells were infected with lentiviral particles that express COX4I1-DsRed for visualizing mitochondria. The cells were seeded on collagen I-coated coverslips and fixed with 4% paraformaldehyde for imaging. SDC tumor cells from 2 mice of each genotypes were examined. Zoomed view of the boxed area was shown on the right bottom of each image. Scale bar: 10 µm. (I) Autophagy-compromised KRASGCitation12V;atg5∆/∆ cells exhibit decreased mitochondrial membrane potential. Mitochondrial membrane potential was measured by 3,3’-dihexyloxacarbocyanine iodide (DiOC6) staining and analyzed by flow cytometry. Relative DiOC6 intensity was calculated by setting the mean DiOC6 fluorescence intensity of KRASGCitation12V;atg5∆/∆ cells as 1. Data are shown as mean ± S.D.; n = 3. *: p < 0.05; ***: p < 0.001 (Student t test, 2-tailed, unpaired)
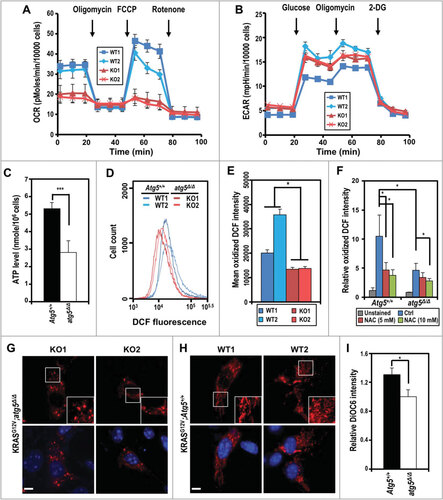
Consistent with reduced OCR, the reactive oxygen species (ROS) level, measured as the fluorescence intensity of oxidized dichlorofluorescein (DCF), was lower in atg5-KO tumor cells, ( and ). Although treatment with the ROS scavenger N-acetyl-L-cysteine (NAC, 5 mM) reduced the oxidized DCF levels in Atg5-WT cells, NAC (even at 10 mM) was marginally effective in suppressing ROS production in atg5-KO tumor cells (). To determine the role of autophagy in regulating mitochondrial dynamics, we used fluorescence imaging to examine the morphological features of cellular mitochondria in isolated tumor cells tagged with the DsRed-labeled mitochondrial matrix marker COX4I1 (cytochrome c oxidase subunit 4I1). In agreement with the reduced OCR and ROS production observed in isolated atg5-KO tumor cells, more over-fragmented mitochondria with smaller networks were noted (), compared with the Atg5-WT tumor cells (). This finding was further corroborated by the observation of a lower mitochondrial membrane potential, as measured by 3,3’-dihexyloxacarbocyanine iodide (DiOC6) fluorescence, in KRASGCitation12V;atg5∆/∆ tumor cells (). Together, we conclude that the excessive mitochondrial fragmentation may account for attenuated mitochondrial output in KRASGCitation12V;atg5∆/∆ tumor cells.
Autophagy disruption impairs mitochondrial dynamics in tumor cells
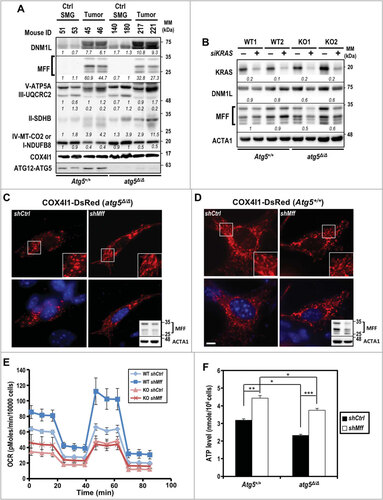
Mitochondrial architecture is crucial for cell viability, proliferation, senescence, and signaling. Because overexpression of MFF and/or DNM1L (dynamin 1-like) promotes mitochondrial fission and fragmentationCitation15,Citation16, which is likely exacerbated by compromised autophagy, we examined the expressions of selected mitochondrial fission and electron transport complex proteins in tumors from both KRASGCitation12V;Atg5+/+ and KRASGCitation12V;atg5∆/∆ mice and compared with non-tumorous tissues. Notably, proteins from mitochondrial complexes II and V, as well as DNM1L, were higher in atg5-KO tumors than from Atg5-WT tumors (). Gene silencing of oncogenic Kras by siKras was performed to validate the effect of KRAS on increased DNM1L and MFF protein levels in cultured tumor cells. As shown in , knockdown of KRAS decreased DNM1L and MFF protein levels in atg5-KO tumor cells exclusively despite efficient knockdown of KRAS in Atg5-WT cells. It is possible that autophagy and oncogenic KRAS are redundant in regulating DNM1L and MFF abundance. We then hypothesized that decreasing the drive toward fission would revert the mitochondrial fragmentation phenotype of the atg5-KO tumor cells, to mimic the elongated mitochondria observed in Atg5-WT tumor cells. To test this hypothesis, we transduced both Atg5-WT and atg5-KO tumor cells, respectively, with lenti-shCtrl or -shMff ( and ). In primary shCtrl cells tagged with COX4I1-DsRed, the KRASGCitation12V;atg5∆/∆ mitochondria were shorter and smaller than KRASGCitation12V;Atg5+/+ mitochondria ( and ). However, after silencing of Mff by shMff, the mitochondria were elongated and tubular-like, indicating decreased mitochondrial fission in the atg5-KO, but not the Atg5-WT tumor cells (). Even though fragmented mitochondria phenotype was partially reversed by silencing Mff in the KRASGCitation12V;atg5∆/∆ cells, there were increases in both basal and ATP-linked respiration in shMff transduced cells when OCRs were measured (). Consistently, a significant increase in ATP production was detected in MFF-knockdown cells of both genotypes ().
Figure 4. Impaired mitochondrial dynamics in autophagy-compromised tumor cells. (A) Increased abundance of mitochondrial fission-related proteins, DNM1L and MFF, in KRAS-transformed tumors. Equal amounts of total tissue lysates prepared from control and tumor-induced mice (d 24) of both genotypes were subjected to western blot analyses as indicated. Levels of 5 oxidative phosphorylation enzyme complexes subunits including NDUFB8 (complex I), SDHB (complex II), UQCRC2 (complex III), MT-CO2 (complex IV) and ATP5A (complex V) were detected with total OXPOHS rodent WB antibody cocktail. Mitochondrial complex IV is shown as a loading control. A representative western blot of 2 mice per group is shown. Relative abundance of each protein is calculated by designating the level in control mouse (ID 51) as 1 after normalization with COX4I1 and shown in italics. Multiple bands in MFF western blot represent splice variants of MFFCitation58. (B) Knockdown of KRAS decreases MFF and DNM1L levels in KRASGCitation12V;atg5∆/∆ cells. Primary tumor cells were transfected with siRNA against human KRAS at 48 h prior to analyses. Relative fold change (siKRAS over Control) of each sample is calculated by designating the densitometry tracing value in the control as 1 after normalization with ACTA1, as shown in italics. (C and D) Knockdown of MFF reverts the fragmented mitochondrial phenotype notably in KRASGCitation12V;atg5∆/∆ (C) compared to KRASGCitation12V;Atg5+/+ (D) cells. Knockdown of MFF is shown by western blot analysis (upper panel, lower-right inset) with ACTA1 serving as a loading control (lower panel, lower-right inset). Multiple bands of MFF are likely due to alternative splicing. Scale bar: 10 µm. (E) Oxygen consumption rate (OCR) was measured in control (shCtrl) and Mff-KD (shMff) KRASGCitation12V;Atg5+/+ (WT) and KRASGCitation12V;atg5∆/∆ (KO) cells. Data are shown as the mean ± S.D.; n = 3. (F) Levels of ATP were measured in control and Mff-KD KRASGCitation12V;Atg5+/+ and KRASGCitation12V;atg5∆/∆ cells. The ATP levels were normalized to cell number. Data are shown as mean ± S.D.; n = 3. *: p < 0.05; **: p < 0.01; ***: p < 0.001 (Student t test, 2-tailed, unpaired)
Next, we confirmed the differential sensitivity of KRASGCitation12V;Atg5+/+ and KRASGCitation12V;atg5∆/∆ cells to the metabolic stress of nutrient starvation. As expected, atg5-KO cells exhibited greater sensitivity to deprivation of both glucose (Fig. S5A, upper panel) and glutamine (Fig. S5A, lower panel) than Atg5-WT cells. However, autophagy deficiency did not correlate with level of senescence markers CDKN2A/p16 (cyclin-dependent kinase inhibitor 2A) and CDKN1A/p21 (cyclin-dependent kinase inhibitor 1A), nor did it affect SNAI1/SNAIL (snail family zinc finger 1) and/or SNAI2/SLUG (snail family zinc finger 2) transcription factors in both control and serum starvation conditions (Fig. S5B). Likewise, autophagy deficiency also did not affect the populations of necrotic and apoptotic cells, as measured by flow cytometry using ANXA5/annexin V (annexin A5) and propidium iodide (PI) (Fig. S5C and S5D). Altogether, our data suggest that impaired autophagy dysregulates mitochondrial dynamics and promotes the accumulation of over-fragmented and malfunctioning mitochondria. These results, combined with the reduced OCR observed in KRASGCitation12V;atg5∆/∆ cells (), support a model wherein autophagy is critical for accelerated tumor progression when tumor cells encounter metabolic stress, under circumstances when nutrient demands exceed the local supply.
Autophagy differentially regulates oncogenic KRAS-rewired cellular metabolism
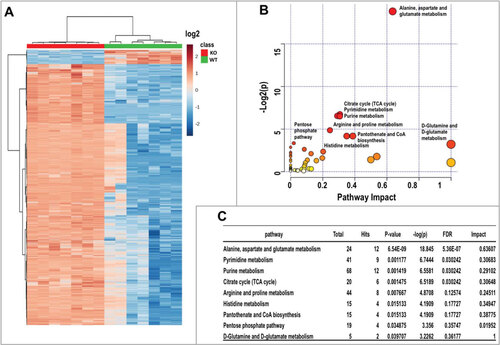
Oncogenic KRAS can reprogram glucose and glutamine metabolismCitation17,Citation18, whilst autophagy is a critical regulator of cellular metabolism and intracellular nutrient homeostasisCitation19. To address the global impact of impaired autophagy on cellular metabolism in atg5-KO tumor cells, we performed a quantitative metabolomic comparison between tumor cells derived from Atg5-WT and atg5-KO tumors. We identified 9966 features from negative mode liquid chromatography–mass spectrometry analysis and top 4000 features with statistical significance were shown in . Both Heatmap and Metabolic impact analyses segregated the samples by compound, tightly grouping the replicates (). Among them, 92 differentially expressed metabolites were selected and subjected to pathway analysis based on KEGG pathway maps (Release 82.1)Citation20. The analyses of metabolic impact and pathway enrichment showed that amino acids, pyrimidine and purine metabolism, and citrate cycle were the most affected metabolic pathways by compromised autophagy (; false discovery rate < 0.05). Of note, the finding that citric acid cycle metabolites are one of the most altered metabolic pathways is consistent with our mitochondrial functional assays (). As many amino acid metabolic pathways were significantly altered (), we quantified intracellular amino acids and found a decrease in the concentrations of 12 amino acids, including essential and nonessential amino acids, in autophagy-deficient tumor cells (; Fig. S6A). In contrast, there was a significant increase in intracellular glutamine (; Fig. S6A), but not glucose level (Fig. S6B) in atg5-KO tumor cells. We next tested whether a specific amino acid insufficiency, resulting from impaired autophagy, is associated with reduced cell proliferation ().
Table 1. Relative intracellular concentration of amino acids from KRASGCitation12V;Atg5+/+ and KRASGCitation12V;atg5∆/∆ SDC tumor cells
Figure 5. Metabolomics analysis of KRASGCitation12V;Atg5+/+ and KRASGCitation12V;atg5∆/∆ SDC cells. (A) Clustering analysis and Heatmap of metabolites from both KRASGCitation12V;Atg5+/+ and KRASGCitation12V;atg5∆/∆ SDC cells. Seven replicates were included in each group. Data is shown in log2 scale. (B) Overview of pathway analysis. Scatter plot represents p-value and pathway impact from pathway topology analysis of the differentially expressed metabolites from KRASGCitation12V;Atg5+/+ and KRASGCitation12V;atg5∆/∆ SDC cells. The color and size of each node is based on its p-value and pathway impact value, respectively. Pathways with statistical significance (p < 0.05) are shown in red. (C) The numerical details of results from the pathway analysis shown in (B). The cut-off p-value is set at p < 0.05. FDR; false discovery rate
Among all amino acids that were significantly decreased in atg5-KO tumor cells, aspartate and asparagine, 2 nonessential amino acids, caught our attention. This is because asparagine is synthesized de novo from aspartate by ASNS, whose upregulation is associated with the proliferation, migration, and tumorigenicity of cancer cellsCitation21. Although asparagine supplementation enhanced tumor cell proliferation independent of autophagy competency (Fig. S6C, left panel), the effects on atg5-KO tumor cells appeared to be more pronounced (Fig. S6C, right panel). To further consolidate the role of asparagine in growth of autophagy-deficient tumor cells, we examined the expression of asparagine-producing enzyme ASNS under metabolic stress. ASNS gain of function was confirmed by subjecting cells to glutamine deprivation (from 5 mM in control full medium to 0.5 mM), which is a major metabolic stress (Fig. S6D, left panel). Notably, the abundance of Asns mRNA (in full medium) was higher in atg5-KO cells than in Atg5-WT cells (Fig. S6D), suggesting an autophagy deficiency-upregulated Asns expression, perhaps through a compensatory mechanism, in response to asparagine deficiency. Indeed, supplementation with asparagine reduced the Asns mRNA level only in atg5-KO tumor cells, close to the level seen in Atg5-WT tumor cells (Fig. S6D, right panel). Importantly, these findings suggest a link between autophagy and oncogenic KRAS-driven metabolic reprogramming.
Asparagine promotes cell motility in atg5-KO tumor cells
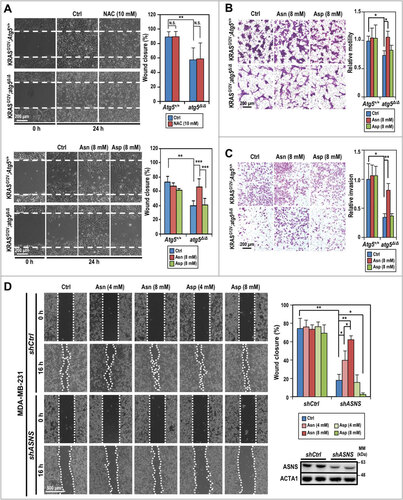
Cell motility is a high energy-demanding process. Since shMff boosted ATP production in SDC cells (), we compared motility between shMff- and shCtrl-transduced Atg5-WT and atg5-KO tumor cells by scratch assay and found reduced motility, which was reversed by Mff-silencing in atg5-KO tumor cells (Fig. S7A). Based on the reduced motility and decreased intracellular asparagine () in atg5-KO tumor cells, we then postulated that defective autophagy suppresses tumor cell motility, at least in part, by reducing the availability of asparagine generated through autophagic recycling. To test this hypothesis, we systematically compared the response of Atg5-WT and atg5-KO tumor cells to supplementation of asparagine/aspartate or NAC using the in vitro wound scratch assay (), cell migration assay (), and cell invasion assay (). The results confirmed that depletion of ATG5 suppresses cell motility, migration, and invasion, respectively, independent of the effect on cell proliferation. Furthermore, we ruled out the involvement of ROS in promoting SDC cell motility, as supplementation with the ROS scavenger NAC (10 mM) did not affect the motility of tumor cells from either genotype (, top panel). Instead, supplementation with asparagine, but not aspartate, reverted the migration of atg5-KO cells in an in vitro wound scratch assay to a level similar to Atg5-WT cells (, bottom panel). Lastly, we extended our observation to MDA-MB-231 breast cancer cells, which carry KRAS mutation as well. Similar to our results with SDC tumor cells, knockdown of ATG5 in KRAS-mutated MDA-MB-231 cells compromised motility in the in vitro wound closure assay (Fig. S7B). Likewise, knockdown of ASNS reduced cell motility, which was salvaged by supplementation with exogenous asparagine, but not aspartate, in both autophagy-competent MDA-MB-231 () and Atg5-WT SDC cells (Fig. S7C). However, no difference in wound closure was detected comparing control and Asns-silenced atg5-KO SDC cells (Fig. S7C). The lack of effect by aspartate might reflect the poor cellular uptake (-D). These results suggest that the higher autophagy-competent tumor cell motility rate, compared to corresponding autophagy-compromised cells, is likely due to greater asparagine availability. Furthermore, impaired mitochondrial dynamics and the reduced cell motility were correlated in KRASGCitation12V;atg5∆/∆ cells, since silencing Mff reverted the in vitro scratch wound assay (Fig. S7A).
Figure 6. Compromised autophagy decreases tumor cell invasion. (A) Asparagine promotes KRASGCitation12V;atg5∆/∆ cell motility as shown by in vitro scratch assays. Live cell images were taken right after the “scratches” were created (0 h) and at 24 h post-treatment (or not) of NAC (10 mM, upper left panels), and asparagine/aspartate (8 mM, lower left panels). Quantification of percent wound closure (right panels) was conducted by measuring the decrease in the denuded area at 24 h (n = 3). (B) Asparagine promotes KRASGCitation12V;atg5∆/∆ cell migration as shown by transwell migration assays. Standard transwell migration assays with a full media supplemented with Asn (8 mM), Asp (8 mM) or without (Ctrl) were perfomed. Following 24 h incubation, the cells on the other side of the membrane were fixed with ice cold methanol and stained with crystal violet. Representative images (left panel) and quantification (right panel) are shown (n = 3). (C) Autophagy is required for SDC cell invasion. In the invasion assay, KRASGCitation12V;Atg5+/+ and KRASGCitation12V;atg5∆/∆ tumor cells were grown as in (B) and quantified for Matrigel invasion using collagen I as a chemoattractant. Representative images (left panel) and quantification (right panel) are shown (n = 3). (D) Knockdown of ASNS reduces MDA-MB-231 cell motility while supplementation of asparagine reverses the ASNS-KD effect. MDA-MB-231 cells (shCtrl or shASNS) were incubated in full media or full media supplemented with the indicated concentrations of asparagine or aspartate after the wounds were created. Representative images taken at 0 and 16 h post-wounding are shown (left panel). Quantification of wound closure (%) is shown (upper right panel). Western analysis confirmed knockdown of ASNS by shASNS (lower right panel). ACTA1 serves as a loading control. *: p < 0.05; **: p < 0.01; ***: p < 0.001, N.S.: not significant (Student t test, 2-tailed, unpaired)
ASNS overexpression is associated with poor prognosis
In order to further extend our understanding of asparagine or ASNS in stress response and homeostasis control in human cancers, we determined ASNS representations and clinical implications. First, we cross-referenced the ASNS expression pattern in multiple human cancers using a collection of publicly available datasets. Elevated ASNS expression in primary tumors, relative to normal tissues, was consistently detected across human cancer types, including breast cancer, in The Cancer Genome Atlas (TCGA) Pan-Cancer RNA-seq datasetCitation22 (). We next compared the ASNS expression levels across various breast cancer subtypes (triple negative [TNBC], ERBB2/HER2+ [erb-b2 receptor tyrosine kinase 2] and others), with that of normal breast tissues in the TCGA breast cancer (BRCA) cohort, based on samples’ IHC information. Notably, the TNBC samples showed the highest ASNS expression level (3.3-fold increase over normal) compared with the 1.67- and 1.47-fold increase observed in the ERBB2+ subtype and others, respectively (). We then validated the observation, using another breast cancer meta-analysis dataset from The Netherlands Cancer Institute (NKICitation23). The ASNS expression levels of 4 Pam50 subtypes (determined by Affymetrix expression arrays, including basal, HER2-like, luminal A, and luminal B) were compared to the expression levels in the normal-like subtype. Again, the basal type, which largely overlaps with TNBC, displayed the highest ASNS expression (1.61-fold increase compared with the 1.29-, 0.97-, and 1.27-fold increase over normal observed for HER2-like, luminal A, and luminal B, respectively) ().
Figure 7. Association of ASNS expression with clinical prognosis. (A) ASNS is overexpressed in human cancers. Red dots in standard boxplots indicate the average expression values. Fold change (FC) of normalized expression values and the number (N) of samples are labeled at the bottom. P-values between groups were determined using Welch’s t test. ***: p < 0.001; BLCA, bladder urothelial carcinoma; BRCA, breast invasive carcinoma; CHOL, cholangiocarcinoma; COAD, colon adenocarcinoma; HNSC, head and neck squamous cell carcinoma; KICH, kidney chromophobe; KIRC, kidney renal clear cell carcinoma; KIRP, kidney renal papillary cell carcinoma; LIHC, liver hepatocellular carcinoma; LUAD, lung adenocarcinoma; LUSC, lung squamous cell carcinoma; PRAD, prostate adenocarcinoma; READ, rectal adenocarcinoma; UCEC, uterine corpus endometrial carcinoma. (B) ASNS is overexpressed in tumor samples of all breast cancer subtypes, compared to normal breast tissues, in the TCGA dataset. Triple-negative breast cancer (TNBC), HER2+ and other subtypes were determined by immunohistochemistry. (C) ASNS expression levels across Pam50 breast cancer subtypes (basal, HER2-like [HER2], luminal A [LumA], and luminal B [LumB]) compared with normal-like subtype using the Netherlands Cancer Institute (NKI) breast cancer dataset. n.s., not significant. (D) Elevated ASNS expression in breast-to-brain metastatic samples, compared with normal breast tissues, in an NCBI-GEO dataset (GSE52604). (E, F and G) Kaplan-Meier analyses of the distal metastasis-free survival of 3 breast cancer cohorts, based on ASNS expression (GSE25066, GSE17705, and GSE12276). The analyses employ the log-rank minimum p-value approach to identify the optimal cut-point for grouping patients. A gray dotted line shows the 5-y mark. The p-value for log-rank test is shown
![Figure 7. Association of ASNS expression with clinical prognosis. (A) ASNS is overexpressed in human cancers. Red dots in standard boxplots indicate the average expression values. Fold change (FC) of normalized expression values and the number (N) of samples are labeled at the bottom. P-values between groups were determined using Welch’s t test. ***: p < 0.001; BLCA, bladder urothelial carcinoma; BRCA, breast invasive carcinoma; CHOL, cholangiocarcinoma; COAD, colon adenocarcinoma; HNSC, head and neck squamous cell carcinoma; KICH, kidney chromophobe; KIRC, kidney renal clear cell carcinoma; KIRP, kidney renal papillary cell carcinoma; LIHC, liver hepatocellular carcinoma; LUAD, lung adenocarcinoma; LUSC, lung squamous cell carcinoma; PRAD, prostate adenocarcinoma; READ, rectal adenocarcinoma; UCEC, uterine corpus endometrial carcinoma. (B) ASNS is overexpressed in tumor samples of all breast cancer subtypes, compared to normal breast tissues, in the TCGA dataset. Triple-negative breast cancer (TNBC), HER2+ and other subtypes were determined by immunohistochemistry. (C) ASNS expression levels across Pam50 breast cancer subtypes (basal, HER2-like [HER2], luminal A [LumA], and luminal B [LumB]) compared with normal-like subtype using the Netherlands Cancer Institute (NKI) breast cancer dataset. n.s., not significant. (D) Elevated ASNS expression in breast-to-brain metastatic samples, compared with normal breast tissues, in an NCBI-GEO dataset (GSE52604). (E, F and G) Kaplan-Meier analyses of the distal metastasis-free survival of 3 breast cancer cohorts, based on ASNS expression (GSE25066, GSE17705, and GSE12276). The analyses employ the log-rank minimum p-value approach to identify the optimal cut-point for grouping patients. A gray dotted line shows the 5-y mark. The p-value for log-rank test is shown](/cms/asset/3d6320b3-f1f7-4b57-8984-ebd7cb0cdcd2/kaup_a_1450708_f0007_oc.jpg)
Active tumor cell migration is a prerequisite for invasion and metastasis. Because our observation suggested that extracellular asparagine supplementation rescues motility in autophagy-compromised and/or ASNS-KD SDC tumor cells (-C and S7C), as well as in ASNS-KD MDA-MB-231 cells (), we probed the correlation of ASNS expression with breast cancer brain metastasis. As expected, ASNS expression levels in breast-to-brain metastatic samples showed an average of 2.24-fold increase compared with normal breast tissues, using a National Center for Biotechnology Information-Gene Expression Omnibus (NCBI-GEO) dataset (GSE52604Citation24) (). Finally, we evaluated the correlation between ASNS expression levels and the breast cancer metastasis outcomes using 3 different NCBI-GEO datasets (GSE25066Citation25, GSE17705Citation26, and GSE12276Citation27). Kaplan-Meier analyses revealed that the high ASNS expression was significantly associated with worse distal metastasis-free survival outcome compared with the low expression group (Log-rank p-value < 0.01 for all 3 datasets; -G). In addition to breast cancer, elevated expression of ASNS was significantly associated with poor overall survival in multiple human cancers (Fig. S8). To link expression level between ATG5 and ASNS, TCGA datasets were analyzed and there is a positive correlation between the expression of these 2 genes in both breast cancer and head and neck cancer datasets (Fig. S9A and S9B). Further, we examined the same sets of distal metastasis-free survival of breast cancer cohorts (-G) and likewise found positive correlation between ATG5 and ASNS expression (Fig. S9C). Altogether, our data support a model wherein compromised autophagy leads to compensatory increase in Asns expression, which produces some asparagine, however, insufficient to offset the loss in asparagine output from autophagic recycling, in order to meet the metabolic demands of tumor growth. Together, we conclude that the combined asparagine deficiency and excessive mitochondrial fragmentation reduce proliferation, migration and invasion of autophagy-impaired tumor cells, conferring a survival advantage on tumor-bearing KRASGCitation12V;atg5∆/∆ mice ().
Discussion
Our study revealed a widespread yet specific homeostatic control of asparagine availability to promote tumor cell motility and the ability of activated autophagy to shift mitochondrial constraints, suggesting that autophagy may have a direct relevance to the oncogenic KRAS-mediated metabolic reprogramming. The importance of autophagy in cancer, whether autophagy promotes or inhibits cancer, depends on the timing and contextCitation28,Citation29. Insight into the mechanisms linking autophagy to tumor progression is needed to resolve such a complex role of autophagy in cancer. We investigated the biological outcome and key metabolic events that autophagy regulates in transgenic mice expressing conditionally-activated oncogenic KRAS with concomitant ablation of Atg5. These autophagy-deficient mice undergo rapid onset of ductal hyperplasia and dysplasia; however, which persists and progresses into invasive SDC at a reduced rate. An overall extended survival of KRASGCitation12V;atg5∆/∆ tumor-bearing transgenic mice, compared to KRASGCitation12V;Atg5+/+ mice, was demonstrated. Our study further identified impaired asparagine availability and mitochondrial integrity as important metabolic barriers to autophagy-compromised, KRAS-transformed tumor cell migration and invasion. These results support a model wherein autophagy fuels cellular metabolism by maintaining mitochondrial dynamics and providing asparagine to reinforce tumor cell migration and promote invasion, thereby accelerating the progression of KRASGCitation12V-transformed tumors (Fig. S10).
We found that disruption of autophagy promotes excessive mitochondrial fission phenotype and slows tumor cell migration in SDC. Mitochondrial fission proteins play essential roles in mitochondrial functionCitation30 and KRAS-driven tumorigenesisCitation31–Citation33. It is possible that the excessive mitochondrial fragmentation in the atg5-KO tumors causes the observed decrease in oxidative phosphorylation and ATP production, thereby impairing ATP-dependent tumor cell migration. Conceivably, the compromised autophagy failed to remove fissed mitochondria, exacerbating mitochondrial over-fission phenotype. Furthermore, this phenotype may result from nutrient depletion-associated kinase activation. AMPK (AMP-activated protein kinase)Citation34,Citation35 and MAPKCitation31,Citation32 phosphorylate the mitochondrial fission proteins MFF and DNM1L, respectively, to regulate mitochondrial dynamics and, in the case of DNM1L, promote RAS-induced tumor growth and/or tumorigenesisCitation31–Citation33. Our report on the partial alleviation of excessive mitochondrial fragmentations and increased ATP production by shMff in atg5-KO tumor cells supports a multifactorial nature of autophagy and mitochondrial dynamics. Perhaps most importantly, the observation that excessive mitochondrial fission interfered with atg5-KO, but not Atg5-WT, tumor cell migration assigns a key role of mitochondrial equilibrium in the regulation of cell metabolism and migration in the context of stress from the absence of autophagy.
In our oncogenic KRAS model, tumor cells’ demand for asparagine for both anabolic process and tumor cell migration, together with our systematic analyses on the overexpression of ASNS across multiple different cancer types and impact on clinical outcome, argue that increased asparagine availability by autophagy or ASNS overexpression escalates tumor progression. Autophagy-mediated degradation of intracellular components provides tumor cells with recycled nutrients, including amino acidsCitation36,Citation37, and rapidly dividing tumor cells are thought to be “addicted” to autophagy to meet their anabolic needsCitation38,Citation39. Moreover, activated KRAS increases protein scavenging via macropinocytosisCitation40,Citation41 or macropinocytosis-associated autophagyCitation42 to supply nutrients. We have previously shown that, compared to Atg5-WT mouse embryonic fibroblasts (MEFs), atg5-KO MEFs have lower levels of intracellular nonessential amino acids, including asparagineCitation43. In this study, we found that autophagy disruption slowed KRAS-driven tumor cell migration, at least in part, by limiting asparagine availability despite a compensatory increased Asns expression (Fig. S6D). In contrast, the glutamine level increased in these tumor cells with compromised autophagy (; Fig. S6A), further attesting the critical role for asparagine in supporting tumor progressionCitation44,Citation45. Consistent with our findings, asparagine is one of 4 amino acids significantly decreased in the tumor core regions of xenografted human melanomaCitation46 and among the most strongly depleted metabolites in human pancreatic tumorsCitation41. In line with our data, other studies have shown that asparagine levels regulate other amino acids homeostasisCitation47,Citation48, a mechanism that likely helps tumor cells in meeting the anabolic demand. The requirement of millimolar range of asparagine to rescue the phenotype of compromised autophagy or ASNS-knockdown suggests the inefficiency of asparagine transport across cell membrane and/or the importance of asparagine compartmentalization. The latter possibility is supported by the lack of clinical efficacy of asparagine-depleting asparaginase therapy in treatment of cancers expressing high levels of ASNSCitation49.
Conceptually, our results are consistent with the observations that asparagine serves as a cellular sensor of reduced TCA cycle intermediates or nitrogen availabilityCitation45,Citation50 to coordinate protein and nucleotide synthesisCitation47. Although whether there is a direct functional dependence between endogenous asparagine level and mitochondria dynamics remains unclear and warrants further studies, our findings provide a mechanistic explanation for the broader notion that autophagy promotes oncogenic RAS-driven invasion and complement other alternatives that autophagy enables focal adhesion disassembly in motile cells or provides secreted factors, such as IL6 in a context-dependent mannerCitation51. Finally, the availability of asparagine in tumor cells is tightly co-regulated by the combined actions of degradative and recycling functions of autophagy and elevated ASNS expression; whether these 2 biological processes are co-regulated is yet to be determined. However, positive correlation between expression of ATG5 and ASNS were found in selected cancers (Fig. S9). Interestingly, The Human Protein Atlas (v18; www.proteinatlas.org) analyzed the proteome of 17 major cancer types and high expressions of ATG5 and ASNS, respectively, were both unfavorably associated with survival rate of patients with renal and liver cancer, as demonstrated by Kaplan-Meier plots. Amino acid starvation is known to induce autophagy while ASNS is activated by ATF4 (activating transcription factor 4) following amino acid deprivationCitation48. To meet the demand from the highly proliferative cancer cells, it is perhaps not surprising to find upregulations and unfavorable associations with certain types of human cancer for both. ASNS was likely compensatorily elevated due to amino acid depletion in our autophagy-compromised SDC tumor cells, however, its increased expression might not have been sufficient to offset declined intracellular asparagine as a result of autophagy deficiency. Consequently, the overall survival was lower in mice bearing autophagy compromised SDC tumor even when ASNS was upregulated in tumors. These results implicate asparagine availability as a common metabolic vulnerability in multiple cancers and propose that ASNS inhibition, combined with autophagy suppression, such as by chloroquineCitation52, and/or other therapies, may represent a personalized strategy for managing ASNS-overexpressing tumors. In summary, our findings reveal that low asparagine and excessive mitochondrial fragmentation represent previously unrecognized metabolic barriers against malignant KRAS-driven tumor invasion potential in the context of compromised autophagy. The association between the ASNS overexpression and the poor clinical outcomes of multiple cancers suggests that the potential of limiting asparagine availability, including by autophagy inhibitors, should be further tested for impeding tumor cell migration and progression.
Materials and Methods
Mouse breeding
Animal care and experimental procedures were conducted in accordance with the guidelines and regulations of the Institutional Animal Care and Use Committee at City of Hope. The Institutional Animal Care and Use Committee at City of Hope approved all animal experiments. All mouse colonies were maintained in pathogen-free barrier facilities. LGL-KRASGCitation12V and Ela-CreERT transgenic mice were described previouslyCitation11. LGL-KRASGCitation12V mice, Ela-CreERT mice, and Atg5flox/flox miceCitation13 were crossed to derive Ela-CreERT;LGL-KRASGCitation12V;Atg5flox/flox (KRASGCitation12V;Atg5flox/flox), Ela-CreERT;LGL-KRASGCitation12V;Atg5flox/+ (KRASGCitation12V;Atg5flox/+), and Ela-CreERT;LGL-KRASGCitation12V;Atg5+/+ (KRASGCitation12V;Atg5+/+) mice. Mice at 8- to 10-wk of age were gavaged with tamoxifen (3 mg/40 g body weight) (MilliporeSigma, T5648) or vehicle daily for 5 consecutive d. Genotyping was conducted as we described previouslyCitation11,Citation13.
Tissue preparation and characterization
Salivary glands were harvested at the indicated time after the first day of tamoxifen feeding. Tumor masses were excised en bloc with adjacent tissues. Tissue samples were fixed in 10% neutral-buffered formalin (MilliporeSigma, HT501128) for 48 h. Tissue embedding, sectioning, and staining with modified Mayer’s hematoxylin (American MasterTech, HXMMHGAL) and eosin Y stain (American MasterTech, STE0157) were performed in the City of Hope Pathology Core. Briefly, after deparaffinization and rehydration, the sections were stained with modified Mayer’s hematoxylin for 4 min, rinsed in tap water; and destained with 0.3% acid alcohol. After rinsing in tap water, sections were stained with eosin Y for 2 min, followed by dehydration, clearing, and mounting.
Immunohistochemistry and quantification
Immunohistochemistry (IHC) was performed using Citrate-based Antigen Unmasking Solution (Vector Laboratories, H-3300), Vectastain Elite ABC-HRP Kit (Vector Laboratories, PK-6100), Avidin/Biotin Blocking Kit (Vector Laboratories, SP-2001), and ImmPACT DAB Peroxidase (HRP) Substrate Kit (Vector Laboratories, SK-4105) according to the manufacturer’s protocols. Briefly, the paraffin sections were deparaffinized and hydrated through xylenes and graded alcohol solutions. The tissue slides were pressure-cooked in citrate-based unmasking solution for 30 min and washed in phosphate-buffered saline (PBS; 137 mM NaCl, 2.7 mM KCl, 10 mM Na2HPO4, 1.8 mM KH2PO4, pH 7.4) for 5 min, followed by quenching of endogenous peroxidase activity in H2O2 (0.3%; MilliporeSigma, H1009) for 30 min. The slides were then blocked for 20 min with a mixture of Avidin D solution and diluted normal blocking serum, which was prepared from the species in which the secondary antibody is made. The slides were then incubated with a mixture of primary antibody and biotin solution for 30 min and washed in buffer 3 times. The slides were incubated in the Vector biotinylated secondary antibody for 30 min, washed for 5 min, and then incubated in Vectastain Elite ABC Reagent for 30 min. After being washed for 5 min, the slides were processed with the DAB Substrate Kit. The slides were counter-stained with hematoxylin, dehydrated, and mounted. The cells that stained positive by IHC in 3 non-overlapping 5 X or 10 X fields were counted with Image-Pro Premier 9.0 (Media Cybernetics) and slides from at least 4 mice were included in each group.
Primary tumor cell isolation
Isolation and culture of primary tumor cells was conducted as previously describedCitation53. In brief, d 23 and d 24 tumors were minced into small pieces and digested for up to 60 min at 37ºC in digestion medium containing collagenase (1 mg/ml; MilliporeSigma, C6885), hyaluronidase (100 units/ml; MilliporeSigma, H3506), DNase I (50 μg/ml; MilliporeSigma, D4527), bovine serum albumin (1 mg/ml; MilliporeSigma, A2153), HEPES (pH 7.3, 20 mM; Corning, 25-060-CI) in Dulbecco’s Modified Eagle’s Medium/Ham’s F-12 50/50 Mix (Corning, 16-405-CV). The suspension of digested tumor cells was passed through a 100 μm sieve to remove the remaining tissue chunks. The red blood cells were lysed by incubating cell suspensions in 1X red blood cell lysis buffer (155 mM NH4Cl, 12 mM NaHCO3, 0.1 mM EDTA, pH 7.3) for 3 min on ice. The resulting cells were plated on collagen I-coated dishes (Corning, 354450), and maintained in a medium consisting of Dulbecco’s Modified Eagle’s Medium (Corning, 10-013-CV) with fetal bovine serum (10%; Thermo Fisher Scientific, 10437028), L-glutamine (5 mM; Thermo Fisher Scientific, A2916801), hydrocortisone (400 ng/ml; MilliporeSigma, H0888), insulin (5 μg/ml; Thermo Fisher Scientific, 12585014), EGF (20 ng/ml; Thermo Fisher Scientific, PHG0311), HEPES (15 mM; Thermo Fisher Scientific, 15630080) and antibiotic-antimycotic (1X; Thermo Fisher Scientific, 15240112). After 1 to 2 wk of incubation, colonies of the GFP-negative tumor cells were manually picked and transfer to new cell culture dishes.
Antibodies and reagents
The primary antibodies used were: rabbit polyclonal anti-MKI67/Ki67 antibody (abcam, ab15580), rabbit polyclonal anti-pan-KRT/cytokeratin antibody (abcam, ab9377), mouse monoclonal anti-COX4I1/COX IV antibody (abcam, ab14744), rabbit polyclonal anti-SNAI1/SNAIL + SNAI2/SLUG antibody (abcam, ab180714), rabbit polyclonal anti-phospho-H3F3/histone H3 (Ser10) antibody (MilliporeSigma, 06–570), mouse monoclonal anti-actin antibody (MilliporeSigma, MAB1501R), rabbit anti-CDKN2A/p16 antibody (Santa Cruz Biotechnology, sc-1207) and anti-CDKN1A/p21 antibody (Santa Cruz Biotechnology, sc-6246), rabbit anti-SQSTM1/p62 antibody (Proteintech Group, 18420-1-AP), rabbit anti-ASNS antibody (Proteintech Group, 14681-1-AP), rabbit anti-MFF antibody (Proteintech Group, 17090-1-AP), mitoprofile total OXPOHS rodent WB antibody cocktail (abcam, ab110413), rabbit anti-DLP1 antibody (BD Biosciences, BD 611112), mouse anti-human KRAS antibody (Bio-Rad, MCA3223Z), rabbit anti-ATG5 antibody (Novus Biologicals, NB110-53818), and rabbit anti-LC3B antibody (Novus Biologicals, NB100-2220).
N-acetyl-L-cysteine (A7250), L-asparagine (A4159), and aspartic acid (A8959) were from MilliporeSigma. siRNA against human KRAS was obtained from MilliporeSigma (SASI_Hs02_00361210) and siRNA against mouse Asns was from Santa Cruz Biotechnology (Santa Cruz Biotechnology, sc-60213). Transfections of siRNA were performed with Lipofectamine RNAiMAX transfection reagent (ThermoFisher Scientific, 13778150), according to the manufacturer’s instructions.
RNA extraction and qRT-PCR
Total RNA was prepared from primary tumor cells with RNeasy Mini Kit (Qiagen, 74104), following the manufacturer’s instructions. The concentration and purity of RNA were measured by NanoDrop spectrophotometry (NanoDrop Technologies). Real-time reverse-transcription PCR (qRT-PCR) was conducted as we described previouslyCitation13. The sequence of the primers used for qPCR: Atg5 forward primer 5’-CAGAAGGTTATGAGACAAGAAGATG-3’, reverse primer 5’-TGGATGGACAGTGTAGAAGGTC-3’; Asns forward primer 5’-GCAGTGTCTGAGTGCCATGAA-3’, reverse primer 5’-TCTTATCGGCTGCATTCCAAAC-3’; Rn18s rRNA forward primer 5’-CGGCGACGACCCATTCGAAC-3’, reverse primer 5’-GAATCGAACCCTGATTCCCCGTC-3’.
Western blot analyses
Whole tissue lysates were prepared using cOmplete Protease Inhibitor Cocktail (MilliporeSigma, 4693116001) supplemented lysis buffer from Qproteome Mammalian Protein Prep Kit (Qiagen, 37901), according to the protocol from the manufacturer. Whole cell lysates were prepared by directly lysing cells in 1x Laemmli buffer (45 mM Tris-HCl, pH 6.8, 10% glycerol, 1% SDS, 50 mM DTT, 0.01% bromophenol blue) with protease inhibitor. Equal amounts of total protein were subjected to SDS-PAGE and immunoblotted with primary antibodies of interest followed by horseradish peroxidase conjugated secondary antibody following manufacturer’s instruction. After chemiluminescent reaction, blots were visualized with a ChemiDoc Touch Imaging System (Bio-Rad). The signal intensities of the captured images were analyzed with Image Lab Software (Bio-Rad, version 5.2.1). Results of western analyses shown are representatives of at least 3 independent experiments.
Measurement of intact cellular respiration and glycolytic function
Mitochondrial OCR and ECAR were measured by the Agilent Seahorse XF24 Extracellular Flux Analyzer using Seahorse XF24 FluxPaks (Agilent, 100850-001) according to the manufacturer’s instructions. Briefly, 1 × 10Citation5 cells were seeded in collagen I-coated XF24 cell culture microplates overnight. On the next day, the cells were washed and incubated with Seahorse XF base medium (Agilent, 102353-100) supplemented with glucose (25 mM; MilliporeSigma, G7021) and sodium pyruvate (1 mM; Thermo Fisher Scientific, 11360070), pH 7.4. OCR was assayed by sequential injections of oligomycin A (1 μM; MilliporeSigma, 75351), FCCP (0.5 μM; MilliporeSigma, C2920) and rotenone (2.5 μM; MilliporeSigma, R8875). ECAR was assayed by sequential addition of glucose (10 mM), oligomycin (1 μM), and 2-deoxyglucose (2-DG, 100 mM; MilliporeSigma, D6134). After the measurements, the cells were trypsinized, and the cell numbers were counted for normalization. The data are presented as mean ± S.D..
NAC treatment and intracellular ROS measurement
ROS measurement was performed using the cell-permeant reagent 2’,7’-dichlorofluorescin diacetate (DCFDA; MilliporeSigma, D6883), as described previouslyCitation54. Briefly, the cells were stained with DCFDA (1 μM) for 30 min and the resulting DCF was analyzed by flow cytometry with a maximum emission ~ 530 nm (Beckman Coulter Gallios or Accuri C6 flow cytometer). For NAC treatment, the cells were seeded at 50% confluence in 12-well plates and incubated with full media supplemented with NAC (5 mM or 10 mM) for 24 h before DCFDA staining.
ATP assay
The cellular ATP level was measured using the ENLITEN ATP Assay System (Promega, FF2000) following the manufacturer’s manual. In brief, the cells were grown to sub-confluence and harvested in ice-cold PBS by scraping. ATP was extracted by adding 5% trichloroacetic acid (TCA; J.T. Baker, 0414-04) and then the reaction was neutralized with Tris-acetate-EDTA buffer (100 mM Tris, 2mM EDTA, pH 7.75). The extracts were further diluted 1:100, and an equal volume of rL/L reagent was added to measure the luminescence using a TD-20e luminometer (Turner Biosystem). An ATP standard curve was generated according to the manufacturer’s instructions. The ATP levels were normalized to the cell number.
Mitochondrial membrane potential
The cells were stained with 3,3’-dihexyloxacarbocyanine iodide (DiOC6, 10 nM; MilliporeSigma, 318426) for 30 min at room temperature and the fluorescence intensity was analyzed by flow cytometry using an Accuri C6 flow cytometer (BD Biosciences).
Cell migration assay
The in vitro wound healing assay was performed as describedCitation55. Briefly, the cells were grown to confluence in 35 mm dishes and the cell monolayer was scratched in a straight line with a p200 pipet tip. The images were acquired with a phase-contrast microscope at the time of scraping (0 h) and again after 24 h of incubation. The rate of cell migration was calculated as a percentage of wound closure using Image-Pro Premier software. All experiments were repeated 3 times.
Transwell migration assay
The Transwell migration assay was performed in triplicate using Transwell-permeable support inserts with 8 µm pores (Corning, 3464). Both sides of the insert membrane were pre-coated with collagen I (ThermoFisher, A1048301) before cell seeding. The cells (1 × 10Citation5) were seeded in the upper chamber in full media. Full media, supplemented with collagen I (40 μg/ml) as a chemoattractant, was placed in the lower well. After 24 h of incubation, the cells in the upper chamber were removed using a cotton swab, and the migrated cells from the underside of the membrane were fixed with ice-cold methanol and stained with crystal violet (Aqua Solutions, C8126). The cell numbers from 5 random fields from each experimental group were counted.
Invasion assay
Cell invasion was determined using BioCoat Matrigel invasion chambers (Corning, 354480). Briefly, the cells (1 × 10Citation5) were seeded in the upper chamber in full media after the chambers were rehydrated. The lower chamber was filled with full media supplemented with collagen I (40 μg/ml). After 24 h of incubation, the cells that invaded through the Matrigel-coated membrane were stained with crystal violet and counted.
Nutrient depletion and cell viability
The acid phosphatase (ACP) assay was used to measure cell viability, as described previouslyCitation13. Briefly, 5 × 10Citation3 cells/well were seeded into 96-well plates and incubated in the presence of different concentrations of glucose or glutamine for 48 h. The cells were then washed with PBS and incubated with p-nitrophenyl phosphate disodium hexahydrate (5 mM; MilliporeSigma, N4645) in 100 μl of sodium acetate (0.1 M; Fisher Chemical, S210-500) and Triton X-100 (0.1%; Fisher Bioreagents, BP151-100), pH 5.0, for 30 min at 37°C. The reaction was stopped with the addition of NaOH (10 μl, 1 N; Fisher Chemical, S318-500) and absorbance was measured at 405 nm using a microplate reader.
Cell proliferation assay
Cells were seeded into 24-well plates at 2 × 10Citation4 cells per well. Asparagine was added during cell seeding if required. Cell viability was measured every 24 h to monitor cell growth by using the ACP assay. Experiments were repeated 3 times.
Apoptosis assay
Apoptosis was analyzed by ANXA5/annexin V-propidium iodide (PI) staining (BD Pharmingen, 556547) following the manufacturer’s instructions. In brief, Atg5-WT and atg5-KO cells were trypsinized and diluted to 1 × 10Citation6 cells/ml. The cells (100 μl) were incubated with ANXA5 and PI at room temperature in the dark for 15 min and analyzed with an Accuri C6 flow cytometer.
Metabolite extraction and mass spectrometry
Atg5-WT and atg5-KO cells were allowed to grow to 70% confluence and harvested in ice-cold PBS by scraping. The cell pellets were then snap frozen in liquid nitrogen and stored at -80°C. Seven biological replicates, consisting of 1 × 10Citation7 cells, were included in each group. The metabolite extraction, mass spectrometry analysis, and data analysis were carried out at the Center for Metabolomics and Mass Spectrometry at The Scripps Research Institute. In brief, metabolite extraction was done by adding 80% methanol (400 µl) to each cell pellet, vortexed, and placed in liquid nitrogen for 10 min. The samples were then allowed to thaw and sonicated for 10 min. The freeze/thaw cycle was repeated 3 times before centrifuging the samples at 16,000 xg for 10 min. The supernatant was harvested and evaporated to dryness in a SpeedVac at room temperature. The samples were reconstituted in 50% methanol (100 μl), sonicated for 15 min, and then transferred to autosampler vials with inert inserts.
The negative mode analysis was performed on a 6538 Q-TOF mass spectrometer (Agilent) coupled with an 1100 series HPLC system (Agilent). Samples (8 μl) were injected to a phenomenex Luna-NH2 2.1 × 150 mm column at a flow rate of 200 μl/min. The scan range was set as m/z = 70–1100. The mobile phase was composed of A = water:acetonitrile 95:5 (v/v), ammonium acetate (20 mM), ammonium hydroxide (40 mM) and mobile phase B = 95% acetonitrile. Gradient was T0 = 0:100, T5 = 0:100, T45 = 100:0, and T60 = off with a 10 min re-equilibration time.
For the amino acid profile, an 1100 series HPLC system (Agilent) was coupled to a 6490 triple quadrupole mass spectrometer (Agilent), operated in multiple reaction monitoring mode. The samples (10 µl) were injected into an amino acid column 2.1 × 100 mm (Imtakt) with a flow rate of 300 µl/min. The mobile phase was composed of A = acetonitrile/tetrahydrofuran/25 mM ammonium formate/formic acid at 9:75:16:0.3 (v/v/v/v) and B = acetonitrile, ammonium formate (100 mM) at 20:80 (v/v). The gradient was T0 = 100:0, T12 = 100:0, T15 = 0:100, and T25 = off with a 5-min re-equilibration time.
Bioinformatics
The analyses of ASNS gene expression pattern presented here are in part based upon dataset downloaded from the TCGA Research Network (http://cancergenome.nih.gov/). It includes TCGA Pan-Cancer RNA-seq expression data (level 3 data using Illumina HiSeq platform from February 2015)Citation22, NKI breast cancer data (Affymetrix Human Genome HG U133A arrays)Citation23 and NCBI-GEO dataset GSE52604 (Agilent Whole Human Genome Microarray 4 × 44K G4112F)Citation24. TCGA cancer types having no more than 5 samples of normal tissues were excluded from the analysis. Log2 transformed expression values were used for plotting and statistical analysis. Standard box plots were used to visualize the expression distribution and differences among different sample types. Statistical significance of the expression differences between groups was determined using Welch’s t test. Differences in overall survival between “high” and “low” expression groups (defined by the optimal cut-point derived using the log-rank minimum p-value approach)Citation56 were compared by Kaplan-Meier curves using the Survival package in R software. Three different datasets were used for Distal metastasis-free survival (DMFS) analyses. The first dataset (GSE25066Citation25) recruited a neoadjuvant cohort of 508 HER2-negative breast cancer cases treated with chemotherapy pre-operatively and endocrine therapy if ER-positive. The second dataset (GSE17705Citation26) recruited 298 ER-positive breast cancer patients uniformly treated with tamoxifen for 5 y. The third dataset (GSE12276Citation27) collected 204 primary tumors from breast cancer patients with known distal site(s) of relapse. Clinical and expression data for survival analysis were downloaded from January 2016. Patients having both clinical information and expression data were included in this study. TCGA breast cancer and head and neck cancer datasets were used for Pearson correlation analysis. Pearson’s R-squared and p-value were calculated using Graphpad Prism 7.
Statistical analysis
All results are given as the mean ± S.D. of at least 3 independent experiments. The Student t test and one-way analysis of variance (ANOVA) were used to ascertain statistical significance. Statistical significance was set as p < 0.05, 2-tailed. The log-rank test for survival analysis was done using GraphPad Prism 7. The comparative and statistical analyses of metabolites were performed using the XCMS software package (http://XCMSOnline.scripps.edu/) and unpaired parametric t test (Welch’s t test). Analysis of the untargeted metabolomics data was first done with MetaboAnalyst 3.0 web server (http://www.metaboanalyst.ca;57) using unequal variance t test, followed by Mummichog program (version v1.0.9) with the following parameters: p-value cutoff = 0.05, network model = Mus musculus BioCyc 17.0, analytical mode of mass spec = negative. Putative metabolites were then run through MetaboAnalyst 3.0 using a hypergeometric test for overrepresentation analysis and relative-betweenness centrality for pathway topology analysis based on the KEGG database (Release 82.1).
Abbreviations
| ACTA1 | = | actin, alpha 1 |
| AHR | = | aryl-hydrocarbon receptor |
| ASNS | = | asparagine synthetase |
| ATF4 | = | activating transcription factor 4 |
| ATG5 | = | autophagy-related 5 |
| ATG7 | = | autophagy-related 7 |
| COX4I1 | = | cytochrome c oxidase subunit 4I1 |
| DCF | = | dichlorofluorescein |
| DiOC6 | = | 3,3’-dihexyloxacarbocyanine iodide |
| DMFS | = | distal metastasis-free survival |
| DNM1L | = | dynamin 1-like |
| ECAR | = | extracellular acidification rate |
| EMT | = | epithelial-to-mesenchymal transition |
| ERBB2/HER2 | = | erb-b2 receptor tyrosine kinase 2 |
| HRAS | = | harvey rat sarcoma virus oncogene |
| IL6 | = | interleukin 6 |
| KD | = | knockdown |
| KO | = | knockout |
| KRAS | = | kirsten rat sarcoma viral oncogene homolog |
| MAP1LC3B/LC3B | = | microtubule-associated protein 1 light chain 3 beta |
| MAPK | = | mitogen-activated protein kinase |
| MFF | = | mitochondrial fission factor |
| MKI67 | = | antigen identified by monoclonal antibody Ki 67 |
| NAC | = | N-acetyl-L-cysteine |
| NCBI-GEO | = | National Center for Biotechnology Information-Gene Expression Omnibus |
| NKI | = | Netherlands Cancer Institute |
| OCR | = | oxygen consumption rate |
| PI | = | propidium iodide |
| PyMT | = | polyoma middle T antigen |
| RB1CC1/FIP200 | = | RB1 inducible coiled-coil 1 |
| ROS | = | reactive oxygen species |
| SDC | = | salivary duct carcinoma |
| SNAI1/SNAIL | = | snail family zinc finger 1 |
| SNAI2/SLUG | = | snail family zinc finger 2 |
| SQSTM1/p62 | = | sequestosome 1 |
| TGFB1 | = | transforming growth factor, beta 1 |
| TNBC | = | triple negative breast cancer |
| WT | = | wild type |
Disclosure of potential conflicts of interest
The authors declare no competing financial interests.
Supplemental Material
Download MS Word (5 MB)supp-data-1450708.docx
Download MS Word (5.2 MB)Acknowledgements
We thank members of Dr. Ann’s laboratory for helpful discussions on the manuscript. We thank Drs. Craig D. Logsdon and Zobeida Cruz-Monserrate (UT MD Anderson Cancer Center) for the oncogenic KRAS mouse model. This work was supported in part by funds from the National Institutes of Health R01DE10742, R21DE023298 and R01DE026304 (to D.K.A.), R01DE023534 (to K.H.L. and D.K.A.) and P30CA033572 (supporting research work carried out in Core Facilities). We also thank Dr. Nancy Linford for editing.
Supplemental data
Supplemental data for this article can be accessed at: https://doi.org/10.1080/15548627.2018.1450708
Related Research Data
References
- Yang S, Wang X, Contino G, Liesa M, Sahin E, Ying H, Bause A, Li Y, Stommel JM, Dell’Antonio G, et al. Pancreatic cancers require autophagy for tumor growth. Genes Dev. 2011 Apr 1;25(7):717–729. doi: 10.1101/gad.2016111 gad.2016111 [pii]. PubMed PMID: 21406549; eng.
- Rosenfeldt MT, O’Prey J, Morton JP, Nixon C, MacKay G, Mrowinska A, Au A, Rai TS, Zheng L, Ridgway R, et al. p53 status determines the role of autophagy in pancreatic tumour development. Nature. 2013 Dec 12;504(7479):296–300. doi: 10.1038/nature12865 nature12865 [pii]. PubMed PMID: 24305049; eng.
- Yang A, Rajesh Kumar NV, Wang X, Yabuuchi S, Alexander BM, Chu GC, Von Hoff DD, Maitra A, Kimmelman AC. Autophagy is critical for pancreatic tumor growth and progression in tumors with p53 alterations. Cancer Discov. 2014 Aug;4(8):905–913. doi: 10.1158/2159-8290.CD-14-0362 [doi] 2159–8290.CD-14-0362 [pii]. PubMed PMID: 24875860; PubMed Central PMCID: PMCPMC4125497. eng.
- Wei H, Wei S, Gan B, Peng X, Zou W, Guan J-L. Suppression of autophagy by FIP200 deletion inhibits mammary tumorigenesis. Genes Dev. 2011 Jul 15;25(14):1510–1527. doi: 10.1101/gad.2051011 25/14/1510 [pii]. PubMed PMID: 21764854; eng.
- Eng CH, Wang Z, Tkach D, Toral-Barza L, Ugwonali S, Liu S, Fitzgerald SL, George E, Frias E, Cochran N, et al. Macroautophagy is dispensable for growth of KRAS mutant tumors and chloroquine efficacy. Proc Nat Acad Sci USA. 2016 Jan 5;113(1):182–187. doi: 10.1073/pnas.1515617113 1515617113 [pii]. PubMed PMID: 26677873; eng.
- Galluzzi L, Pietrocola F, Bravo-San Pedro JM, Amaravadi RK, Baehrecke EH, Cecconi F, Codogno P, Debnath J, Gewirtz DA, Karantza V, et al. Autophagy in malignant transformation and cancer progression. EMBO J. 2015 Apr 1;34(7):856–880. doi: 10.15252/embj.201490784 embj.201490784 [pii]. PubMed PMID: 25712477; eng.
- Guo JY, Xia B, White E. Autophagy-mediated tumor promotion. Cell. 2013 Dec 5;155(6):1216–1219. doi: 10.1016/j.cell.2013.11.019 S0092-8674(13)01468-2 [pii]. PubMed PMID: 24315093; eng.
- Kenific CM, Debnath J. Cellular and metabolic functions for autophagy in cancer cells. Trends Cell Biol. 2015 Jan;25(1):37–45. doi: 10.1016/j.tcb.2014.09.001 S0962-8924(14)00158-5 [pii]. PubMed PMID: 25278333; eng.
- Tsai C-H, Li C-H, Cheng Y-W, Lee C-C, Liao P-L, Lin C-H, Huang S-H, Kang J-J. The inhibition of lung cancer cell migration by AhR-regulated autophagy. Sci Rep. 2017 Feb 14;7:41927. doi: 10.1038/srep41927 [doi] srep41927 [pii]. PubMed PMID: 28195146; PubMed Central PMCID: PMCPMC5307309. eng.
- Hu J, Meng Y, Zhang Z, Yan Q, Jiang X, Lv Z, Hu L. MARCH5 RNA promotes autophagy, migration, and invasion of ovarian cancer cells. Autophagy. 2017 Feb;13(2):333–344. doi: 10.1080/15548627.2016.1256520 [doi]. PubMed PMID: 27875077; PubMed Central PMCID: PMCPMC5324849. eng.
- Fu Y, Cruz-Monserrate Z, Helen Lin H, Chung Y, Ji B, Lin S-M, Vonderfecht S, Logsdon CD, Li C-F, Ann DK. Ductal activation of oncogenic KRAS alone induces sarcomatoid phenotype. Sci Rep. 2015;5:13347. doi: 10.1038/srep13347 srep13347 [pii]. PubMed PMID: 26289340; PubMed Central PMCID: PMCPMC4642517. eng. PMID:26289340
- Hara T, Nakamura K, Matsui M, Yamamoto A, Nakahara Y, Suzuki-Migishima R, Yokoyama M, Mishima K, Saito I, Okano H, et al. Suppression of basal autophagy in neural cells causes neurodegenerative disease in mice. Nature. 2006 Jun 15;441(7095):885–889. doi: nature04724 [pii] 10.1038/nature04724. PubMed PMID: 16625204; eng.
- Lin HH, Lin S-M, Chung Y, Vonderfecht S, Camden JM, Flodby P, Borok Z, Limesand KH, Mizushima N, Ann DK. Dynamic involvement of ATG5 in cellular stress responses. Cell Death Dis. 2014;5:e1478. doi: 10.1038/cddis.2014.428 cddis2014428 [pii]. PubMed PMID: 25341032; eng. PMID:25341032
- Mizushima N, Komatsu M. Autophagy: renovation of cells and tissues. Cell. 2011 Nov 11;147(4):728–741. doi: 10.1016/j.cell.2011.10.026 S0092-8674(11)01276-1 [pii]. PubMed PMID: 22078875; eng.
- Otera H, Wang C, Cleland MM, Setoguchi K, Yokota S, Youle RJ, Mihara K. Mff is an essential factor for mitochondrial recruitment of Drp1 during mitochondrial fission in mammalian cells. J Cell Biol. 2010 Dec 13;191(6):1141–1158. doi: 10.1083/jcb.201007152 [doi] jcb.201007152 [pii]. PubMed PMID: 21149567; PubMed Central PMCID: PMCPMC3002033. eng.
- Zhang Z, Liu L, Wu S, Xing D. Drp1, Mff, Fis1, and MiD51 are coordinated to mediate mitochondrial fission during UV irradiation-induced apoptosis. FASEB J. 2016 Jan;30(1):466–476. doi: 10.1096/fj.15-274258 [doi] fj.15-274258 [pii]. PubMed PMID: 26432782; eng.
- Son J, Lyssiotis CA, Ying H, Wang X, Hua S, Ligorio M, Perera RM, Ferrone CR, Mullarky E, Shyh-Chang N, et al. Glutamine supports pancreatic cancer growth through a KRAS-regulated metabolic pathway. Nature. 2013 Apr 4;496(7443):101–105. doi: 10.1038/nature12040 nature12040 [pii]. PubMed PMID: 23535601; eng.
- Ying H, Kimmelman AC, Lyssiotis CA, Hua S, Chu GC, Fletcher-Sananikone E, Locasale JW, Son J, Zhang H, Coloff JL, et al. Oncogenic Kras maintains pancreatic tumors through regulation of anabolic glucose metabolism. Cell. 2012 Apr 27;149(3):656–670. doi: 10.1016/j.cell.2012.01.058 S0092-8674(12)00352-2 [pii]. PubMed PMID: 22541435; eng.
- Mizushima N. Autophagy: process and function. Genes Dev. 2007 Nov 15;21(22):2861–2873. doi: 21/22/2861 [pii] 10.1101/gad.1599207 [doi]. PubMed PMID: 18006683; eng.
- Kanehisa M, Goto S, Sato Y, Kawashima M, Furumichi M, Tanabe M. Data, information, knowledge and principle: back to metabolism in KEGG. Nucleic Acids Res. 2014 Jan;42(Database issue):D199-D205. doi: 10.1093/nar/gkt1076 [doi] gkt1076 [pii]. PubMed PMID: 24214961; PubMed Central PMCID: PMCPMC3965122. eng.
- Zhang B, Dong L-W, Tan Y-X, Zhang J, Pan Y-F, Yang C, Li M-H, Ding Z-W, Liu L-J, Jiang T-Y, et al. Asparagine synthetase is an independent predictor of surgical survival and a potential therapeutic target in hepatocellular carcinoma. Brit J Cancer. 2013 Jul 9;109(1):14–23. doi: 10.1038/bjc.2013.293. PubMed PMID: 23764751; PubMed Central PMCID: PMCPMC3708586.
- The Cancer Genome Atlas Research Network, Weinstein JN, Collisson EA, Mills GB, Shaw KR, Ozenberger BA, Ellrott K, Shmulevich I, Sander C, Stuart JM. The Cancer Genome Atlas Pan-Cancer analysis project. Nature Genet. 2013 Oct;45(10):1113–20. doi: 10.1038/ng.2764 [doi] ng.2764 [pii]. PubMed PMID: 24071849; PubMed Central PMCID: PMCPMC3919969. eng.
- van Vliet MH, Reyal F, Horlings HM, van de Vijver MJ, Reinders MJ, Wessels LF. Pooling breast cancer datasets has a synergetic effect on classification performance and improves signature stability. BMC Genom. 2008 Aug 06;9:375. doi: 10.1186/1471-2164-9-375 [doi] 1471-2164-9-375 [pii]. PubMed PMID: 18684329; PubMed Central PMCID: PMCPMC2527336. eng.
- Salhia B, Kiefer J, Ross JTD, Metapally R, Martinez RA, Johnson KN, DiPerna DM, Paquette KM, Jung S, Nasser S, et al. Integrated genomic and epigenomic analysis of breast cancer brain metastasis. PLoS One. 2014;9(1):e85448. doi: 10.1371/journal.pone.0085448 [doi] PONE-D-13-28131 [pii]. PubMed PMID: 24489661; PubMed Central PMCID: PMCPMC3906004. eng. PMID:24489661
- Hatzis C. A genomic predictor of response and survival following taxane-anthracycline chemotherapy for invasive breast cancer. JAMA. 2011 May 11;305(18):1873–81. doi: 10.1001/jama.2011.593 [doi] 305/18/1873 [pii]. PubMed PMID: 21558518; eng.
- Symmans WF, Hatzis C, Sotiriou C, Andre F, Peintinger F, Regitnig P, Daxenbichler G, Desmedt C, Domont J, Marth C, et al. Genomic index of sensitivity to endocrine therapy for breast cancer. J Clin Oncol: Off J Am Soc Clin Oncol. 2010 Sep 20;28(27):4111–4119. doi: 10.1200/JCO.2010.28.4273 [doi]. PubMed PMID: 20697068; PubMed Central PMCID: PMCPMC2953969. eng.
- Bos PD, Zhang XH-F, Nadal C, Shu W, Gomis RR, Nguyen DX, Minn AJ, van de Vijver MJ, Gerald WL, Foekens JA, et al. Genes that mediate breast cancer metastasis to the brain. Nature. 2009 Jun 18;459(7249):1005–1009. doi: 10.1038/nature08021 [doi] nature08021 [pii]. PubMed PMID: 19421193; PubMed Central PMCID: PMCPMC2698953. eng.
- Amaravadi R, Kimmelman AC, White E. Recent insights into the function of autophagy in cancer. Genes Dev. 2016 Sep 01;30(17):1913–1930. doi: 10.1101/gad.287524.116 [doi] 30/17/1913 [pii]. PubMed PMID: 27664235; PubMed Central PMCID: PMCPMC5066235. eng.
- Liu J, Debnath J. The evolving, multifaceted roles of autophagy in cancer. Adv Cancer Res. 2016;130:1–53. doi: 10.1016/bs.acr.2016.01.005 [doi] S0065-230X(16)30005-7 [pii]. PubMed PMID: 27037750; eng. PMID:27037750
- Mishra P, Chan DC. Metabolic regulation of mitochondrial dynamics. J Cell Biol. 2016 Feb 15;212(4):379–387. doi: 10.1083/jcb.201511036 [doi] jcb.201511036 [pii]. PubMed PMID: 26858267; PubMed Central PMCID: PMCPMC4754720. eng.
- Kashatus JA, Nascimento A, Myers LJ, Sher A, Byrne FL, Hoehn KL, Counter CM, Kashatus DF. Erk2 phosphorylation of Drp1 promotes mitochondrial fission and MAPK-driven tumor growth. Mol Cell. 2015 Feb 5;57(3):537–551. doi: 10.1016/j.molcel.2015.01.002 S1097-2765(15)00003-9 [pii]. PubMed PMID: 25658205; eng.
- Serasinghe MN, Wieder SY, Renault TT, Elkholi R, Asciolla JJ, Yao JL, Jabado O, Hoehn K, Kageyama Y, Sesaki H, et al. Mitochondrial division is requisite to RAS-induced transformation and targeted by oncogenic MAPK pathway inhibitors. Mol Cell. 2015 Feb 5;57(3):521–536. doi: 10.1016/j.molcel.2015.01.003 S1097-2765(15)00004-0 [pii]. PubMed PMID: 25658204; eng.
- Weinberg F, Hamanaka R, Wheaton WW, Weinberg S, Joseph J, Lopez M, Kalyanaraman B, Mutlu GM, Budinger GRS, Chandel NS. Mitochondrial metabolism and ROS generation are essential for Kras-mediated tumorigenicity. Proc Nat Acad Sci USA. 2010 May 11;107(19):8788–8793. doi: 10.1073/pnas.1003428107 1003428107 [pii]. PubMed PMID: 20421486; eng.
- Ducommun S, Deak M, Sumpton D, Ford RJ, Núñez Galindo A, Kussmann M, Viollet B, Steinberg GR, Foretz M, Dayon LC, et al. Motif affinity and mass spectrometry proteomic approach for the discovery of cellular AMPK targets: identification of mitochondrial fission factor as a new AMPK substrate. Cell Signal. 2015 May;27(5):978–988. doi: 10.1016/j.cellsig.2015.02.008 [doi] S0898-6568(15)00042-X [pii]. PubMed PMID: 25683918; eng.
- Toyama EQ, Herzig S, Courchet J, Lewis TL, Loson OC, Hellberg K, Young NP, Chen H, Polleux F, Chan DC, et al. Metabolism. AMP-activated protein kinase mediates mitochondrial fission in response to energy stress. Science. 2016 Jan 15;351(6270):275–281. doi: 10.1126/science.aab4138 [doi] 351/6270/275 [pii]. PubMed PMID: 26816379; PubMed Central PMCID: PMCPMC4852862. eng.
- Cheong H, Lu C, Lindsten T, Thompson CB. Therapeutic targets in cancer cell metabolism and autophagy. Nat Biotechnol. 2012 Jul;30(7):671–678. doi: 10.1038/nbt.2285 nbt.2285 [pii]. PubMed PMID: 22781696; eng.
- Shintani T. Autophagy in health and disease: a double-edged sword. Science. 2004 Nov 5;306(5698):990–995. doi: 306/5698/990 [pii] 10.1126/science.1099993. PubMed PMID: 15528435; eng.
- Mancias JD, Kimmelman AC. Targeting autophagy addiction in cancer. Oncotarget. 2011 Dec;2(12):1302–6. doi: 10.18632/oncotarget.384. PubMed PMID: 22185891; PubMed Central PMCID: PMCPMC3282086.
- White E. The role for autophagy in cancer. J Clin Invest. 2015 Jan;125(1):42–46. doi: 10.1172/JCI73941. PubMed PMID: 25654549; PubMed Central PMCID: PMCPMC4382247.
- Commisso C, Davidson SM, Soydaner-Azeloglu RG, Parker SJ, Kamphorst JJ, Hackett S, Grabocka E, Nofal M, Drebin JA, Thompson CB, et al. Macropinocytosis of protein is an amino acid supply route in Ras-transformed cells. Nature. 2013 May 30;497(7451):633–637. doi: 10.1038/nature12138 nature12138 [pii]. PubMed PMID: 23665962; eng.
- Kamphorst JJ, Nofal M, Commisso C, Hackett SR, Lu W, Grabocka E, Vander Heiden MG, Miller G, Drebin JA, Bar-Sagi D, et al. Human pancreatic cancer tumors are nutrient poor and tumor cells actively scavenge extracellular protein. Cancer Res. 2015 Feb 1;75(3):544–553. doi: 10.1158/0008-5472.CAN-14-2211 75/3/544 [pii]. PubMed PMID: 25644265; eng.
- Seo J-W, Choi J, Lee S-Y, Sung S, Yoo HJ, Kang M-J, Cheong H, Son J. Autophagy is required for PDAC glutamine metabolism. Sci Rep. 2016 Nov 28;6:37594. doi: 10.1038/srep37594 [doi] srep37594 [pii]. PubMed PMID: 27892481; PubMed Central PMCID: PMCPMC5124864. eng.
- Lin T-C, Chen Y-R, Kensicki E, Li AY-J, Kong M, Li Y, Mohney RP, Shen H-M, Stiles B, Mizushima N, et al. Autophagy: resetting glutamine-dependent metabolism and oxygen consumption. Autophagy. 2012 Oct;8(10):1477–1493. doi: 10.4161/auto.21228 21228 [pii]. PubMed PMID: 22906967; eng.
- Richards NGJ, Kilberg MS. Asparagine synthetase chemotherapy. Annu Rev Biochem. 2006;75:629–654. doi: 10.1146/annurev.biochem.75.103004.142520. PubMed PMID: 16756505; eng.
- Zhang J, Fan J, Venneti S, Cross JR, Takagi T, Bhinder B, Djaballah H, Kanai M, Cheng EH, Judkins AR, et al. Asparagine plays a critical role in regulating cellular adaptation to glutamine depletion. Mol Cell. 2014 Oct 23;56(2):205–218. doi: 10.1016/j.molcel.2014.08.018 S1097-2765(14)00673-X [pii]. PubMed PMID: 25242145; eng.
- Pan M, Reid MA, Lowman X, Kulkarni RP, Tran TQ, Liu X, Yang Y, Hernandez-Davies JE, Rosales KK, Li H, et al. Regional glutamine deficiency in tumours promotes dedifferentiation through inhibition of histone demethylation. Nat Cell Biol. 2016 Oct;18( 10):1090–1101. doi: . PubMed PMID: 27617932.
- Krall AS, Xu S, Graeber TG, Braas D, Christofk HR. Asparagine promotes cancer cell proliferation through use as an amino acid exchange factor. Nat Commun. 2016;7:11457. doi: 10.1038/ncomms11457 ncomms11457 [pii]. PubMed PMID: 27126896; eng. PMID:27126896
- Ye J, Kumanova M, Hart LS, Sloane K, Zhang H, De Panis DN, Bobrovnikova-Marjon E, Diehl JL, Ron D, Koumenis C. The GCN2-ATF4 pathway is critical for tumour cell survival and proliferation in response to nutrient deprivation. EMBO J. 2010 Jun 16;29(12):2082–2096. doi: 10.1038/emboj.2010.81 [doi] emboj201081 [pii]. PubMed PMID: 20473272; PubMed Central PMCID: PMCPMC2892366. eng.
- Lorenzi PL, Llamas J, Gunsior M, Ozbun L, Reinhold WC, Varma S, Ji H, Kim H, Hutchinson AA, Kohn EC, et al. Asparagine synthetase is a predictive biomarker of L-asparaginase activity in ovarian cancer cell lines. Mol Cancer Ther. 2008 Oct;7(10):3123–3128. doi: 10.1158/1535-7163.MCT-08-0589 [doi] 7/10/3123 [pii]. PubMed PMID: 18852115; PubMed Central PMCID: PMCPMC4123961. eng.
- Hettmer S, Schinzel AC, Tchessalova D, Schneider M, Parker CL, Bronson RT, Richards NG, Hahn WC, Wagers AJ. Functional genomic screening reveals asparagine dependence as a metabolic vulnerability in sarcoma. Elife. 2015;4:e09436. doi: 10.7554/eLife.09436 e09436 [pii]. PubMed PMID: 26499495; eng. PMID:26499495
- Lock R, Kenific CM, Leidal AM, Salas E, Debnath J. Autophagy-dependent production of secreted factors facilitates oncogenic RAS-driven invasion. Cancer Discov. 2014 Apr;4(4):466–479. doi: .CD-13-0841 2159–8290.CD-13-0841 [pii]. PubMed PMID: 24513958; eng.
- Qu X, Sheng J, Shen L, Su J, Xu Y, Xie Q, Wu Y, Zhang X, Sun L. Autophagy inhibitor chloroquine increases sensitivity to cisplatin in QBC939 cholangiocarcinoma cells by mitochondrial ROS. Plos One. 2017 Mar 16;12(3):e0173712. doi: ARTN e0173712 10.1371/journal.pone.0173712. PubMed PMID: WOS:000396318300065; English.
- Warner KA, Adams A, Bernardi L, Nor C, Finkel KA, Zhang Z, McLean SA, Helman J, Wolf GT, Divi V, et al. Characterization of tumorigenic cell lines from the recurrence and lymph node metastasis of a human salivary mucoepidermoid carcinoma. Oral Oncol. 2013 Nov;49(11):1059–1066. doi: 10.1016/j.oraloncology.2013.08.004. PubMed PMID: 24035723; PubMed Central PMCID: PMCPMC3821871. eng.
- Cheng C-T, Kuo C-Y, Ouyang C, Li C-F, Chung Y, Chan DC, Kung H-J, Ann DK. Metabolic stress-induced phosphorylation of KAP1 Ser473 blocks mitochondrial fusion in breast cancer cells. Cancer Res. 2016 Sep 1;76(17):5006–5018. doi: 10.1158/0008-5472.CAN-15-2921 0008–5472.CAN-15-2921 [pii]. PubMed PMID: 27364555; eng.
- Liang C-C, Park AY, Guan J-L. In vitro scratch assay: a convenient and inexpensive method for analysis of cell migration in vitro. Nat Protoc. 2007;2(2):329–333. doi: nprot.2007.30 [pii] .30. PubMed PMID: 17406593; eng.
- Mizuno H, Kitada K, Nakai K, Sarai A. PrognoScan: a new database for meta-analysis of the prognostic value of genes. BMC Med Genom. 2009 Apr 24;2:18. doi: 10.1186/1755-8794-2-18 [doi] 1755-8794-2-18 [pii]. PubMed PMID: 19393097; PubMed Central PMCID: PMCPMC2689870. eng.
- Xia J, Sinelnikov IV, Han B, Wishart DS. MetaboAnalyst 3.0–making metabolomics more meaningful. Nucleic Acids Res. 2015 Jul 01;43(W1):W251-W257. doi: 10.1093/nar/gkv380 [doi] gkv380 [pii]. PubMed PMID: 25897128; PubMed Central PMCID: PMCPMC4489235. eng.
- Gandre-Babbe S, van der Bliek AM. The novel tail-anchored membrane protein Mff controls mitochondrial and peroxisomal fission in mammalian cells. Mol Biol Cell. 2008 Jun;19( 6):2402–2412. doi: 10.1091/mbc.E07-12-1287. PubMed PMID: WOS:000259155200006; English.