
ABSTRACT
In most cases, macroautophagy/autophagy serves to alleviate cellular stress and acts in a pro-survival manner. However, the effects of autophagy are highly contextual, and autophagic cell death (ACD) is emerging as an alternative paradigm of (stress- and drug-induced) cell demise. AT 101 ([-]-gossypol), a natural compound from cotton seeds, induces ACD in glioma cells as confirmed here by CRISPR/Cas9 knockout of ATG5 that partially, but significantly rescued cell survival following AT 101 treatment. Global proteomic analysis of AT 101-treated U87MG and U343 glioma cells revealed a robust decrease in mitochondrial protein clusters, whereas HMOX1 (heme oxygenase 1) was strongly upregulated. AT 101 rapidly triggered mitochondrial membrane depolarization, engulfment of mitochondria within autophagosomes and a significant reduction of mitochondrial mass and proteins that did not depend on the presence of BAX and BAK1. Conversely, AT 101-induced reduction of mitochondrial mass could be reversed by inhibiting autophagy with wortmannin, bafilomycin A1 and chloroquine. Silencing of HMOX1 and the mitophagy receptors BNIP3 (BCL2 interacting protein 3) and BNIP3L (BCL2 interacting protein 3 like) significantly attenuated AT 101-dependent mitophagy and cell death. Collectively, these data suggest that early mitochondrial dysfunction and HMOX1 overactivation synergize to trigger lethal mitophagy, which contributes to the cell killing effects of AT 101 in glioma cells.
Abbreviations: ACD, autophagic cell death; ACN, acetonitrile; AT 101, (-)-gossypol; BAF, bafilomycin A1; BAK1, BCL2-antagonist/killer 1; BAX, BCL2-associated X protein; BH3, BCL2 homology region 3; BNIP3, BCL2 interacting protein 3; BNIP3L, BCL2 interacting protein 3 like; BP, Biological Process; CCCP, carbonyl cyanide m-chlorophenyl hydrazone; CC, Cellular Component; Con, control; CQ, chloroquine; CRISPR, clustered regularly interspaced short palindromic repeats; DMEM, Dulbecco’s Modified Eagle Medium; DTT, 1,4-dithiothreitol; EM, electron microscopy; ER, endoplasmatic reticulum; FACS, fluorescence-activated cell sorting; FBS, fetal bovine serum; FCCP, carbonyl cyanide 4-(trifluoromethoxy)phenylhydrazone; GO, Gene Ontology; HAcO, acetic acid; HMOX1, heme oxygenase 1; DKO, double knockout; LC-MS/MS, liquid chromatography coupled to tandem mass spectrometry; LPL, lipoprotein lipase, MEFs, mouse embryonic fibroblasts; mPTP, mitochondrial permeability transition pore; MTG, MitoTracker Green FM; mt-mKeima, mito-mKeima; MT-ND1, mitochondrially encoded NADH:ubiquinone oxidoreductase core subunit 1; PBS, phosphate-buffered saline; PE, phosphatidylethanolamine; PI, propidium iodide; PRKN, parkin RBR E3 ubiquitin protein ligase; SDS, sodium dodecyl sulfate; SQSTM1/p62, sequestome 1; STS, staurosporine; sgRNA, single guide RNA; SILAC, stable isotope labeling with amino acids in cell culture; TFA, trifluoroacetic acid, TMRM, tetramethylrhodamine methyl ester perchlorate; WM, wortmannin; WT, wild-type
Introduction
It is widely acknowledged that in the majority of cases, autophagy acts as a suppressor of cell death. Key physiological functions of autophagy are to provide metabolic precursors and to maintain energy homeostasis under conditions of starvation, and to alleviate cellular stress by removing damaged proteins and organelles [Citation1,Citation2]. Therefore, autophagy is rightfully acknowledged as a pro-survival stress response. However, the extent and duration of autophagy induction appears to be critical for cellular life and death decisions, and cytotoxic functions of autophagy have also been reported. A more complex interplay of autophagy with cell survival is increasingly substantiated by experimental evidence supporting the notion that the effect of autophagy on cell death is intimately correlated with the respective cellular context [Citation1–Citation3].
According to the criteria defined by the leading experts in the field of cell death research, autophagic cell death (ACD) represents a type of cell death that is mediated by autophagy and can be suppressed by specific inhibition of the autophagic pathway [Citation4]. ACD was initially described in models of developmental cell death in less complex organisms [Citation5–Citation7], e.g. in insect development that is associated with an autophagic form of cell death including the formation of a large number of autophagosomes and cellular self-cannibalization [Citation8,Citation9]. More recently, in the fungal aging model Podospora anserina it was demonstrated that under low stress autophagy acts as a pro-survival or ‘longevity assurance pathway’ allowing the fungus to reach a long lifespan [Citation10–Citation12]. However, after passing threshold levels of stress (e.g., oxidative stress, protein stress) autophagy turns to a pro-death pathway leading to ACD and a shortened lifespan [Citation13,Citation14].
In line with these observations from less complex systems, there is increasing evidence for a pro-death function of autophagy in response to a variety of anticancer drugs and other pharmacological substances, in particular in cancer cells with a high resistance to apoptosis where ACD may act as a backup cell death program [Citation3,Citation15]. Of note, glioma cells appear to be particularly vulnerable to ACD [Citation15]. It has been previously shown that Δ9-tetrahydrocannabinol triggers autophagy-mediated glioma cell death by stimulation of ER stress [Citation16]. Shchors and coworkers recently demonstrated that the combination of the Food and Drug Administration-approved drugs imipramine hydrochloride and ticlopidine hydrochloride triggers ACD in glioma cells via synergistic cAMP elevation [Citation17]. Furthermore, autophagy can promote cell death by its interplay with other cell death modalities such as apoptosis, necrosis and autosis, the latter of which is a unique type of ACD [Citation18–Citation20].
We have previously shown that the natural compound AT 101 ([-]-gossypol) elicits a non-apoptotic, autophagy-mediated cell death in glioma cells [Citation21]. In this study, we also observed that AT 101-induced glioma cell death is accompanied by an early fragmentation of mitochondria in the absence of effector caspase activation and prominent CYCS/cytochrome c release. To scrutinize the hypothesis that mitochondrial events may be key mechanisms underlying ACD in the absence of apoptosis, we analyzed global proteomic changes and several parameters of mitochondrial function and mitophagy upon treatment with AT 101. These included changes in mitochondrial membrane potential and mitochondrial mass, as well as the degradation of mitochondrial proteins. Here we demonstrate that AT 101 induces overactivation of HMOX1 and the mitophagy receptors BNIP3 and BNIP3L, which is accompanied with early mitochondrial dysfunction and a robust depletion of mitochondrial mass/proteins. The induction of excessive mitophagy leads to a mitophagyic type of cell death in glioma cells, which appears to be not the major contributor of AT 101-induced cytotoxicity, but significantly promotes its cell killing effect.
Results
Global proteomic analysis after AT 101 treatment of U343 and U87MG glioma cells
AT 101 induces different forms of cell death depending on the cellular context [Citation22]. In glioma cells, AT 101 has been described to trigger an autophagic type of cell death, but the exact molecular events leading to AT 101-induced cell demise remained largely unidentified [Citation21,Citation23]. To further investigate the underlying mechanisms of AT 101-induced cell death in glioma cells, a global proteomic analysis of U87MG and U343 cells upon treatment with AT 101 was performed ()). U87MG cells were labelled by using stable isotope labelling with amino acids in cell culture (SILAC) with heavy and light isotopes of L-arginine and L-lysine and differentially treated with AT 101 or DMSO for 48 h. The proteomic analysis was carried out in duplicates with reverse SILAC labels. Because U343 cells did not allow sufficient levels of SILAC-labelling, we analyzed these cells by label-free quantification using triplicate samples. Proteins were reduced, alkylated, digested with lysine and trypsin, and separated into 12 fractions by strong cation exchange chromatography. The fractions were analyzed by liquid chromatography coupled to tandem mass spectrometry (LC-MS/MS) and combined for the analysis in MaxQuant.
Figure 1. Proteomic analysis of AT 101-treated U87MG and U343 glioma cells. (A) Overview of the experimental procedure. See materials and methods for a detailed description. (B) Volcano-Plot showing the protein ratios (in log2) as a function of the -log p-value of label-free quantification proteomic-data from U343 human glioma cells treated with AT 101 (15 µM) or DMSO for 48 h. A total of 4185 proteins were detected, and of those, 279 were significantly (p < 0.05) downregulated (red dots) and 354 upregulated (green dots) and display a log2-expression-difference of at least 0.2. Unregulated proteins are displayed as gray dots. Bioinformatic cluster analyses revealed that the depicted Gene Ontology (GO) terms for Cellular Component are strongly enriched for mitochondrial-related processes (purple dots). (C) Bar chart showing the number of up- or downregulated proteins that cluster for selected Gene Ontology (GO) terms for Cellular Component (CC) and Biological Process (BP) of U343 cells with a log p-value of p < 10−3. (D) Vulcano plot showing the protein ratios in log2 as a function of the log intensity of SILAC proteomic data from U87MG human glioma cells treated with AT 101 (15 µM) or DMSO for 48 h. A total of 1452 proteins were detected, and of those, 56 (red dots) and 44 (green dots) displayed a log2-difference of ± 1 or greater. Unregulated proteins are displayed as gray dots. Bioinformatic cluster analyses revealed that 16 of 56 (28.6%) of the downregulated proteins cluster for mitochondrial-related CC-GO-terms (purple dots). (E) Bar chart showing the number of up- or downregulated proteins that cluster for selected Gene Ontology (GO) terms for Cellular Component (CC) and Biological Process (BP) of U87MG cells with a p-value of p < 10−3.
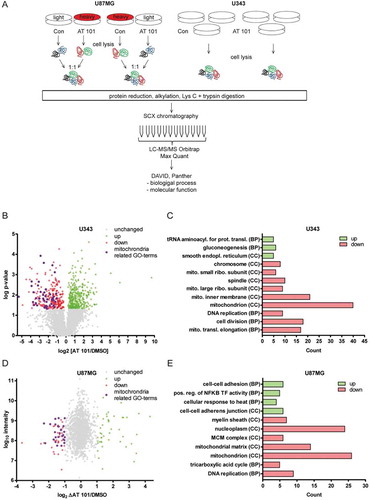
In U343 cells, a total number of 4185 proteins were detected and 624 displayed a log2-expression-difference of at least 0.2 upon treatment with AT 101. Of these, 354 proteins were significantly up-, and 279 proteins were significantly downregulated, the latter including 14.7% mitochondrial-related proteins ()). Furthermore, 3 of the top 10 downregulated proteins (30%) and 5 of the top 20 downregulated proteins (25%) were mitochondria-related (Table S1A). To understand the biological relevance of the differentially regulated proteins, the Gene Ontology (GO) terms of the bioinformatics analysis tools DAVID and PANTHER were used to cluster the identified proteins according to the biological and molecular processes. ) shows a selection of increased and downregulated GO terms for Cellular Component (CC) or Biological Process (BP). The bars display the number of up- and downregulated proteins in U343 cells clustered for the respective GO term.
Upregulated proteins cluster for the GO terms tRNA aminoacylation for mRNA translation, gluconeogenesis and smooth endoplasmic reticulum (ER). The GO terms with abundantly downregulated proteins include mitochondrion, mitochondrial inner membrane, cell division and mitochondrial translation elongation. To analyze the identified proteins of SILAC-labelled U87MG cells, the duplicates were combined. The log2 of the fold changes of the quotient AT 101/control was plotted against the log10 of the protein intensity ()). A total of 1452 proteins were detected in U87MG cells. Of those 56 were upregulated and 44 were downregulated and displayed a log2-difference of ≤-1 and ≥ 1, respectively. Bioinformatic cluster analysis revealed that 16 of 56 (28.6%) of the downregulated proteins cluster for mitochondrial-related CC-GO-terms ()). In detail, 5 of the top 10 downregulated proteins (50%) and 8 of the top 20 downregulated proteins (40%) are mitochondria related (Table S1B). A selection of enriched and downregulated GO terms for CC and BP are shown in ). Enriched GO terms for upregulated proteins are cell-cell adhesion, positive regulation of NFKB transcription factor activity and cell-cell adherens junction. GO terms with abundantly downregulated proteins include mitochondrion, mitochondrial matrix, nucleoplasm and DNA replication. In summary, we used 2 different labelling approaches that yielded a striking and robust AT 101-induced decrease in mitochondrial protein clusters in 2 independent cell lines.
AT 101 induces mitophagy in human glioma cells
To confirm that AT 101 induces autophagy in the human glioma cell lines U343 and MZ-54, MAP1LC3B conversion of the cytosolic MAP1LC3B-I form into the faster migrating, MAP1LC3B isoform phosphatidylethanolamine (PE)-conjugated MAP1LC3B-II form was analyzed by western blot [Citation24]. The conversion of MAP1LC3B generally correlates with the number of autophagosomes within a cell and can be increased due to either induction or late stage inhibition of autophagy. Treatment with AT 101 led to a strong increase of MAP1LC3B-II in U343 () and MZ-54 cells (). Combined treatment with AT 101 and the lysosomal vacuolar-type H+-ATPase inhibitor bafilomycin A1 (late stage inhibition of autophagy) further increased the amount of MAP1LC3B-II after 24 h in U343 cells and after 6 h in MZ-54 cells, indicating that AT 101 enhanced the autophagic flux (). This could be confirmed by electron microscopy (EM) revealing formation of initiation membranes and phagophores ()) after AT 101 treatment. Consistent with the abundance decrease of mitochondrial proteins detected, the EM analysis revealed a structure with the size and appearance of a mitochondrion surrounded by a double-membrane structure (), compatible with engulfment of single mitochondria into a phagophore and mitophagy induction induced by AT 101.
Figure 2. Effect of AT 101 on the induction of mitophagy in human glioma cells. (A, B) Immunoblotting analysis of MAP1LC3B expression in human glioma cell lines treated with AT 101 (15 µM), bafilomycin A1 (BAF; 10 nM) or DMSO (Con). Bafilomycin A1 was added 4 h before harvest. The time points in brackets refer to the time point when the sample was harvested. (C) Electron microscopy analyses of U343 glioma cells display mitochondria (Mt) with normal morphology, especially with regular cristae structures under control conditions (I)(scale bar: 10 µm; original magnification 20,500x). Upon AT 101 treatment, one could observe the induction of autophagy indicated by the formation of phagophores (PG), autolysosomes (arrowheads) and the engulfment of mitochondria (asterisk) with altered cristae structure (II)(scale bar: 2 µm; original magnification 20,500x). (III)(scale bar: 2 µm; original magnification 60,000x) and (IV)(scale bar: 4 µm; original magnification 105,000x) represent higher magnifications of (II): arrow in (III) points to a mitochondrion that is surrounded by a double membrane thereby indicating its engulfment as a sign of mitophagy; (IV) represents the lower right phagophore in (II). (V)(scale bar: 2 µm; original magnification 160,000x): initiation membranes (arrow) of phagophores are depicted.
AT 101 treatment triggers early mitochondrial depolarization and a delayed decrease of mitochondrial protein levels
In previous studies, we could show that AT 101 triggers mitochondrial dysfunction and fragmentation, which are known to be prerequisites for mitophagy [Citation21]. To further investigate mitochondrial engagement in cell death, we first analyzed whether AT 101 treatment leads to mitochondrial depolarization. Therefore, we used 3 human glioma cell lines as well as wild-type and apoptosis-deficient bax bak1 double-knockout (DKO) mouse embryonic fibroblasts (MEFs) and quantified the decrease in tetramethylrhodamine methyl ester (TMRM)-positive cells upon AT 101 treatment using flow cytometry. The gate was set to 95–100% positive in DMSO-treated control cells. Breakdown of the mitochondrial membrane potential typically occurs when the uncoupled proton flux over the inner mitochondrial membrane reaches a certain threshold and the membrane potential is unsustainable (e.g., due to treatment with uncouplers such as carbonyl cyanide m-chlorophenyl hydrazone [CCCP] and carbonyl cyanide 4-[trifluoromethoxy]phenylhydrazone [FCCP]) [Citation25]. Treatment with AT 101 for 6 h to 48 h led to a significant mitochondrial depolarization in the glioma cell lines MZ-54, U343 and U87MG () and in wild-type and bax bak1 DKO MEF cells (). Importantly, this depolarization significantly precedes AT 101-induced cell death that occurs at a much later time point of 48–72 h in glioma cells [Citation21] (see also ). In analogy, treatment with the uncoupler FCCP also significantly decreased the mitochondrial membrane potential of these cell lines (Fig. S1A-D). These results are in line with our recent observation that AT 101 treatment triggers a significant decrease of mitochondrial respiration, which is accompanied with an opening of the mitochondrial permeability transition pore (mPTP) [Citation23]. Consistent with these findings, treatment with AT 101 led to a reduction of mitochondrial proteins VDAC1 (voltage dependent anion channel 1), TOMM20 (translocase of outer mitochondrial membrane 20), HSPD1 (heat shock protein family D [Hsp60] member 1) and COX4I1 (cytochrome c oxidase subunit 4I1) ().
Figure 3. Effect of AT 101 on mitochondrial depolarization and mitochondrial protein expression. Cells were exposed to AT 101 (15 µM) or DMSO (Con). (A-C) Quantification of TMRM-positive cells by flow cytometric analysis of the human glioma cell lines MZ-54 (A), U343 (B) and U87MG (C) and MEF WT versus MEF bax bak1 DKO cells (D). The percentage of TMRM-positive cells is equivalent to the amount of cells with an intact mitochondrial membrane potential. The threshold for TMRM-positive cells was set according to the control. Experiments were repeated 3 times. Data are mean + SEM from n = 9–12 samples (10,000 cells measured in each sample, 3–4 samples per experiment). (E-G) Immunoblotting analysis of mitochondrial protein expression in wild-type (WT) and bax bak1 DKO MEF cells (E), U343 cells (F) and U87MG cells (G). Quantification of the protein level normalized to the loading control (100%) was performed for U343 and U87MG cells. Experiments were repeated 3–5 times. (H) Monitoring mitophagy by immunoblotting analysis of P. anserina Sod3H26L::Gfp cultures exposed to AT 101 (200 µM) or DMSO (con) for 24 h and quantification of ‘free GFP’ protein level normalized to the Coomassie Brilliant Blue-stained gel. Protein level in DMSO cultures were set to 1. Data are mean + SEM from n = 6 cultures. (I) Immunoblotting analysis of expression of mitochondrial proteins in P. anserina wild type and quantification of protein level normalized to the Coomassie Brilliant Blue-stained gel. Protein level in DMSO cultures were set to 1. Data are mean + SEM from n = 6 cultures.
Figure 4. Effects of CRISPR/Cas9 knockout (KO) on the expression of mitochondrial proteins and cell death upon AT 101 treatment. (A) Immunoblotting analysis of ATG5 expression in MZ-54 ATG5 KO cells and U343 ATG5 KO cells compared to control. (B) Immunoblotting analysis of MAP1LC3B expression in MZ-54 ATG5 KO cells compared to control treated with AT 101 (15 µM), bafilomycin A1 (BAF; 10 nM) or DMSO (Con). Bafilomycin A1 was added 4 h before harvest. (C) Immunoblotting analysis of mitochondrial protein expression in MZ-54 ATG5 KO cells compared to control treated with AT 101 (15 µM) or DMSO (Con). The mean protein expression was quantified and normalized to the loading control (100%). Experiments were repeated 3–5 times. (D-H) Cell death was quantified by flow cytometric analysis of ANXA5/annexin binding and PI uptake after treatment with AT 101 (15 µM), staurosporine (STS; 1 µM, 24 h; 3 µM, 6 h) or DMSO (Con). Measurements were performed with U343 cells (D, F), MZ-54 cells (E, G) and MEF WT versus MEF bax bak1 DKO cells (H). Cell death includes ANXA5/annexin-positive only and PI-positive only as well as double-positive cells. Experiments were repeated at least 3 times. Data are mean + SEM from n = 9–12 samples (10,000 cells measured in each sample, 3–4 samples per experiment).
Additionally, we analyzed the mitochondrial degradation upon AT 101 treatment in the fungal aging model P. anserina. In this model organism, as in the cell lines, AT 101 treatment was previously shown to trigger a decrease of mitochondrial respiration and membrane potential [Citation23]. To analyze the mitochondrial degradation by mitophagy we used an established and recently adjusted biochemical assay [Citation10,Citation13]. In this assay, the vacuolar degradation of the mitochondrial PaSOD3H26L::GFP fusion reporter protein is examined. If mitophagy is induced, the SOD3 part of the fusion reporter protein is degraded, while the GFP part (‘free GFP’) remains stable in the vacuole and can be quantified by western blot analysis. Treatment of PaSod3H26L::Gfp strains with AT 101 led to a significant increase of the ‘free GFP’ amount implicating an increase in mitophagic flux ()). In line with the increase of mitophagic flux, we found in P. anserina wild-type strains a reduced amount of different mitochondrial proteins. In particular, the amount of PaSOD3, PaPRX, PaPORIN and PaATP5 were significantly reduced after AT 101 treatment ()).
CRISPR/Cas9 knockout of ATG5 partially rescues glioma cells from AT 101-induced cell death
In order to further investigate the role of mitophagy and autophagy in AT 101-induced cell death, we generated clustered regularly interspaced short palindromic repeats (CRISPR)/Cas9 knockouts of ATG5 in MZ-54 and U343 cells (). Because ATG5 is essential for the conjugation of MAP1LC3B to PE, knockout of ATG5 completely inhibited the conversion of MAP1LC3B-I to MAP1LC3B-II upon treatment with AT 101 and bafilomycin A1 compared to the control (). Furthermore, depletion of ATG5 significantly antagonized the reduction of mitochondrial proteins upon treatment with AT 101 (). To investigate whether ATG5 knockout is able to rescue cells from AT 101-induced cell death, flow cytometric analysis was performed with APC ANXA5/annexin V, which mostly stains early apoptotic cells, and propidium iodide (PI), which stains the dead cell population. Indeed, depletion of ATG5 significantly reduced the amount of total cell death in U343 and MZ-54 cells subjected to treatment with AT 101 (). However, it is worth mentioning that also other cell death mechanisms seem to be involved, as we could only detect a partial rescue upon autophagy inhibition. In contrast, there was no discernible effect of ATG5 depletion on total cell death induced by the common apoptosis inducer staurosporine (STS) (). Next, we investigated if AT 101-induced cell death is dependent on BAX and BAK1. Similar to a previously observed increased response to irradiation [Citation26], bax bak1 DKO MEFs died even earlier from AT 101 treatment compared to wild-type MEFs (). In contrast, knockout of bax and bak1 almost completely inhibited STS-induced apoptotic cell death ().
Genetic and pharmacological autophagy inhibition attenuates AT 101- induced mitophagy
To test the hypothesis that inhibition of autophagy prevents AT 101-induced mitochondrial depletion, we used 3 different assays to determine the mitophagic flux upon AT 101 treatment in combination with autophagy inhibitors. The uptake of MitoTracker dyes has been described to be partly dependent on mitochondrial membrane potential [Citation27], possibly limiting the suitability of these compounds to measure mitophagy. Therefore, we first compared the decreases in TMRM and MitoTracker Green FM (MTG) intensities upon treatment with FCCP and AT 101 in U87MG cells (Fig. S2).
TMRM measurements were performed as described for . For MTG measurements, the gate was set to 0% – 5% MTG-negative cells in DMSO-treated controls and cells were subsequently gated MTG positive and MTG negative according to the control, with MTG-negative cells being defined as cells with a decrease in mitochondrial mass. Treatment with FCCP led to a massive mitochondrial depolarization after 2, 4 and 6 h, whereas the amount of MTG-negative cells did not increase during this time period (Fig. S2A, B), indicating that the analysis of depolarization and mitophagy changes can be uncoupled by this approach. This lack of mitophagy induction observed after FCCP treatment likely reflects the low or absent PRKN (PRKN RBR E3 ubiquitin protein ligase) levels routinely observed in malignant gliomas [Citation28,Citation29]. AT 101 induced a decrease of > 80% in the TMRM signal after 6 h, whereas the amount of MTG-negative cells only increased up to 30% within 6 h of treatment (Fig S2C, D).
To ensure that the observed decrease of MTG intensity upon AT 101 exposure reflects mitophagy, we used 3 different autophagy inhibitors to block mitophagy. To this end, we treated the cells with a combination of AT 101 and the late stage autophagy inhibitors bafilomycin A1 and chloroquine, which both inhibit lysosomal acidification and fusion of autophagosomes with lysosomes. In addition, we also used wortmannin that suppresses autophagy at the stage of autophagosome formation via inhibition of class III phosphatidylinositol 3-kinase PIK3C3/VPS34 [Citation30]. Exposure of U87MG cells to AT 101 resulted in a strong accumulation of MTG-negative cells (up to 50%) that was significantly antagonized by wortmannin, and even stronger by bafilomycin A1 and chloroquine (). Furthermore, wild-type MZ-54 cells exhibited a significantly stronger increase of MTG-negative cells upon treatment with AT 101 compared to ATG5 KO MZ-54 cells (), further supporting our hypothesis that the AT 101-induced decrease in mitochondrial mass is caused by enhanced mitophagy.
Figure 5. Mitophagy induced by AT 101 is blocked by autophagy inhibition. (A, B) Quantification of MTG-negative cells by flow cytometric analysis (A) and exemplary measurements of MTG intensity by flow cytometry (B). U87MG cells were treated with AT 101 (15 µM) alone or in combination with bafilomycin A1 (BAF; 10 nM), wortmannin (WM; 100 nM) and chloroquine (CQ; 20 µM). Wortmannin was added to the cells 48 h before harvest and all other treatments were performed for 24 h. (C, D) AT 101 (15 µM) and/or bafilomycin A1 (BAF; 10 nM) was applied to the MZ-54 control and ATG5 KO cells for 24 h. The threshold for MTG-positive cells was set according to the control. DMSO was used as control (Con). Experiments A-D were repeated 3 times. Data are mean + SEM from n = 9–12 samples (5000–10,000 cells measured in each sample, 3–4 samples per experiment). (E-G) U87MG and MZ-54 cells stably expressing mito-mKeima were exposed to AT 101 (15 µM) in the presence or absence of bafilomycin A1 (BAF; 100 nM) or to DMSO (Con) for 6 h and subjected to flow cytometric analysis. (E) Representative experiment of U87MG cells. (F, G) Quantification of the changes in the mean value of the 561 nm:488 nm ratio, which corresponds to the pH where mKeima is located, normalized to control. Data represent mean + SEM of 3 replicates with 10,000 cells measured in each sample. (H, I) The glioma cell lines MZ-54 and MZ-54 ATG5 KO2 (H), U87 and U343 (I) were treated with 15 µM AT 101 for 30 h followed by q-RT-PCR in order to assess the mitochondrial mass determined as the ratio between the DNA levels of the mitochondrial gene MT-ND1 and the nuclear gene LPL. Experiments were repeated 3–4 times with 3 technical replicates. Data are mean + SEM from n = 3–4 samples.
To confirm our results, we next investigated AT 101-induced mitophagy with the mito-mKeima (mt-mKeima) assay. Thereto, U87MG cells and MZ-54 cells stably expressing mt-mKeima were analyzed by flow cytometry. As the excitation wavelength of mKeima is dependent on the pH, the ratio changes of mKeima excited with 561 nm (pH 4) and 488 nm (pH 7) can be used to measure the uptake of mitochondria into lysosomes. Exposure to AT 101 for 6 h resulted in a significant increase of the 561 nm:488 nm ratio in U87MG () and MZ-54 cells (). In contrast, concurrent treatment with AT 101 and bafilomycin A1 significantly decreased the 561 nm:488 nm ratio changes compared to AT 101 treatment alone. These data indicate that mitophagy is a direct and early event triggered by AT 101. A comparatively modest increase in the 561 nm:488 nm ratio could also be observed after treatment of MZ-54 cells with FCCP (Fig. S2E), suggesting that PRKN may not play a major role in AT 101-induced mitophagy.
In addition, we determined the induction of mitophagy by measuring the mitochondrial DNA level of MT-ND1 (mitochondrially encoded NADH:ubiquinone oxidoreductase core subunit 1) normalized to the nuclear DNA level of LPL (lipoprotein lipase), as this ratio reflects the concentration of mitochondria per cell [Citation31]. Indeed, the ratio of mitochondrial to nuclear DNA was significantly decreased upon treatment with AT 101 in MZ-54 cells, whereas the mitochondrial mass of MZ-54-derived ATG5 KO cells remained unchanged upon treatment with AT 101. These results are consistent with the role of AT 101 in promoting mitophagy (). Treatment with AT 101 also led to a strong reduction of the mitochondrial mass of U87 and U343 glioma cell lines, respectively ().
Effects of BNIP3 and BNIP3L depletion on mitophagy and cell death
A number of different mitophagy regulators have been described in mammals including PINK1 (PTEN induced putative kinase 1)-PRKN, BNIP3, BNIP3L and FUNDC1 (FUN14 domain containing 1) [Citation32–Citation34]. However, the PRKN expression levels in malignant gliomas are very low or even absent [Citation28]. Therefore, we investigated the mRNA expression of BNIP3 and BNIP3L. Both proteins are atypical BH3-only members of the BCL2 family and localize to mitochondria. In addition, BNIP3 and BNIP3L have been described to participate in hypoxia-induced mitophagy [Citation35–Citation37] and cell death [Citation36,Citation38]. The mRNA levels of BNIP3 and BNIP3L were strongly upregulated upon treatment with AT 101 in U87MG, MZ-54 and U343 cells (). These data are consistent with another study showing upregulation of BNIP3 upon AT 101 treatment [Citation39]. We also investigated the expression of the selective cargo receptor SQSTM1/p62 (sequestome 1), which has been described to participate in the PINK1-PRKN mitophagy pathway [Citation33]. Proteomic analysis of U87MG and U343 cells revealed a significant upregulation of SQSTM1/p62 in both cell lines upon AT 101 exposure for 48 h (Table S1C, D). The mRNA expression level of SQSTM1/p62 was significantly increased in MZ-54 cells and U343 cells, but not in U87MG cells ().
Figure 6. Investigation of mitophagy receptors. (A-C) Expression levels of BNIP3, BNIP3L and SQSTM1/p62 mRNA normalized to TBP. MZ-54, U343 and U87MG cells were treated with AT 101 (15 µM) for 6, 16 and 24 h or with DMSO for 24 h (Con). Experiments were repeated 3 times with 3 technical replicates. Data are mean + SEM from n = 3 samples. (D-F) Immunoblot analysis of BNIP3L, SQSTM1/p62 and BNIP3 protein expression in MZ-54 (D), U87MG (E) and U343 cells (F) upon AT 101 (15 µM) exposure for 6, 16, and 24 h or DMSO (Con) for 24 h. (G, H) Immunoblot analysis of U87MG cells treated with AT 101 (15 µM) for 16 h in the presence of siRNA against BNIP3 (siBNIP3 #1 or siBNIP3 #2; 10 nM, 25 nM, 50 nM) (G) and BNIP3L (siBNIP3L #1 or siBNIP3L#2; 10 nM, 25 nM, 50 nM) (H) or universal negative control (siCon). (I, K) Quantification of MTG-negative U87MG cells upon exposure to AT 101 for 24 h and siRNA against BNIP3 (siBNIP3 #1 or siBNIP3 #2; 25 nM) or BNIP3L (siBNIP3L #1 or siBNIP3L #2; 25 nM) (I) or a combination of BNIP3 and BNIP3L (siBNIP3 #1 and siBNIP3L #1 or siBNIP3 #2 and siBNIP3L #2; 25 nM each) (K) or universal negative control (siCon). (J, L) Cell death of U87MG cells was quantified by flow cytometric analysis of ANXA5/annexin binding and PI uptake after treatment with AT 101 (15 µM) for 48 h in the presence of siRNA against BNIP3 (siBNIP3 #1 or siBNIP3 #2; 25 nM) or BNIP3L (siBNIP3L #1 or siBNIP3L #2; 25 nM) (J) or a combination of BNIP3 and BNIP3L (siBNIP3 #1 and siBNIP3L #1 or siBNIP3 #2 and siBNIP3L #2; 25nM each) (L) or universal negative control (siCon). (M) Exemplary measurement of MTG intensity by flow cytometry. An amount of 25 nM siRNA was used for all experiments. Measurements were performed at least in triplicate. Data are mean + SEM from n = 9–12 samples (5000 – 10,000 cells measured in each sample, 3–4 samples per experiment).
In line with the above data, we could also observe a strong upregulation of BNIP3L protein level upon 16 h and 24 h treatment with AT 101 (). However, an elevated protein expression of BNIP3 could only be observed in U87MG cells, as BNIP3 levels were not detectable by western blot in the other cell lines (). The protein expression of SQSTM1/p62 was not visibly influenced by AT 101 treatment up to 24 h, suggesting that the increase in SQSTM1/p62 protein expression was counterbalanced by degradation of SQSTM1/p62 at this time point (.
To further investigate the role of BNIP3 and BNIP3L in mitophagy and cell death, siRNA-mediated knockdowns were performed in U87MG cells (). MTG measurements of U87MG cells treated with AT 101 in combination with siRNA against BNIP3 and BNIP3L or siRNA negative control revealed a significant increase of MTG-negative cells upon treatment with AT 101 after 24 h, which was attenuated by depletion of both BNIP3 and BNIP3L (). Given that BNIP3 and BNIP3L might have some overlapping functions as mitophagy receptors [Citation40], we knocked down both proteins simultaneously in order to further inhibit mitophagy. Indeed, the BNIP3 BNIP3L double knockdown significantly prevented AT 101-induced accumulation of MTG-negative cells, indicating that both receptors might be involved in AT 101-induced mitophagy ().
In addition, we found that cell death induced by AT 101 was significantly diminished by knockdown of BNIP3L with 2 different siRNAs (). Significantly attenuated cell death was also observed following BNIP3 depletion with one of the siRNAs, whereas the other siRNA elevated basal cell death in the absence of AT 101, indicating possible off-target effects (). The BNIP3 BNIP3L double knockdown decreased cell death to a similar extent as the BNIP3L knockdown alone (), suggesting a more important function of BNIP3L compared to BNIP3.
Depletion of HMOX1 alleviates AT 101-induced mitophagy and death
Besides the plethora of downregulated mitochondrial proteins, our global proteomic analysis revealed a number of upregulated stress-responsive proteins including BAG3 (BCL2 associated athanogene 3), HSPA1A (heat shock protein family A [Hsp70] member 1A), APP (amyloid beta precursor protein) and CLU (clusterin). Further analysis showed that HMOX1 was also significantly induced in both investigated cell lines (U87MG, U343) (Table S1D). HMOX1 is an inducible enzyme that catalyzes the degradation of pro-oxidant heme into equimolar quantities of carbon monoxide, biliverdin and iron. It is induced by diverse stress stimuli and is mostly associated with beneficial effects in many cellular contexts due to modulation of anti-inflammatory, anti-oxidant and anti-apoptotic processes. Besides the function as a catalytic enzyme, HMOX1 has been described to play a role in mitochondrial biogenesis as well as mitophagy, thereby strongly affecting the pool of mitochondria within the cells [Citation41,Citation42].
Immunoblotting analysis confirmed that HMOX1 protein expression was strongly increased upon exposure to AT 101 (). Based on these findings, we hypothesized that upregulated expression of HMOX1 might affect the mitochondrial mass in glioma cells. To test this, we depleted HMOX1 using siRNAs ()). Knockdown of HMOX1 with siRNA completely prevented the increase of HMOX1 protein levels upon AT 101 exposure (). Furthermore, we could show that upregulated HMOX1 was functionally related to the induction of mitophagy, as knockdown of HMOX1 with 2 different siRNAs partially prevented the AT 101-induced decrease of mitochondrial mass in U87MG cells ().
Figure 7. HMOX1 triggers mitophagy, which is accompanied with increased cell death. (A) Immunoblotting analysis of HMOX1 expression in U87MG cells treated with AT 101 (15 µM) compared to control (Con). (B) Immunoblotting analysis of HMOX1 expression in U87MG cells treated with 2 different siRNAs against HMOX1 (siHMOX1 #1 and siHMOX1 #2; 10 nM, 25 nM, 50 nM) compared to siRNA universal negative control (siCon). (C) Immunoblotting analysis of HMOX1 expression in U87MG cells treated with AT 101 (15 µM) and/or siRNA against HMOX1 (siHMOX1 #1; 25 nM) compared to mock transfection and siRNA universal negative control (siCon). (D) Quantification of MTG-negative U87MG cells by flow cytometric analysis upon treatment with AT 101 (15 µM, 24 h) in the presence of 2 different siRNAs against HMOX1 (siHMOX1 #1 and siHMOX1 #2; 10 nM) compared to siRNA universal negative control (siCon). (E-G) Quantification of PI-positive cells of the cell lines MZ-54 (E), U343 (F) and U87MG (G) treated with 15 µM AT 101 or 500 nM RSL3 in the presence or absence of 5 µM ferrostatin-1. Cell death was assessed after 48 h (MZ-54, U343) or 72 h (U87MG) by PI and Hoechst-stained nuclei using fluorescence microscopy. Mean and SEM of 5–7 independent experiments performed in triplicate are shown. (H) Quantification of cell death by flow cytometric analysis of ANXA5/annexin binding and PI uptake after treatment with AT 101 (15 µM, 24 h) in the presence of 2 different siRNAs against HMOX1 (siHMOX1 #1 and siHMOX1 #2; 10 nM) or siRNA universal negative control (siCon). MTG and cell death measurements were repeated at least 3 times. Data are mean + SEM from n = 9–12 samples (10,000 cells measured in each sample, 3–4 samples per experiment).
Next, we analyzed whether HMOX1 induction also affects cell death. A previous study described that overexpressed HMOX1 promotes ferroptotic cell death in HT-1080 fibrosarcoma cells [Citation43]. To rule out that AT 101 induces a ferroptotic cell death in glioma cells, they were exposed either to AT 101 or to the ferroptosis inducer RSL3 in the presence or absence of the ferroptosis inhibitor ferrostatin-1. Ferrostatin-1 completely abrogated cell death in RSL3-treated cells, but not in AT 101-treated cells (). In addition, we investigated whether HMOX1 depletion is able to rescue the cells from AT 101-triggered cell death. Indeed, knockdown of HMOX1 with siRNA significantly alleviated cell death after AT 101 treatment, suggesting that upregulation of HMOX1 by AT 101 was involved in overactivation of mitophagy and concomitant cell demise ().
Discussion
In this study, we follow up on our previous studies demonstrating that AT 101, a natural polyphenolic compound from cotton seeds, triggers an autophagy-dependent type of cell death associated with mitochondrial fragmentation and dysfunction in glioma cells [Citation21]. Here, we used a CRISPR/Cas9-based approach to generate new genetic models of autophagy deficiency. To this end, the core autophagy gene ATG5 was inactivated in the 2 glioma cell lines MZ-54 and U343, leading to a significant reduction of AT 101-induced cell death in both cases. AT 101 induced an early mitochondrial depolarization that noticeably preceded cell death in glioma cells, and there was no major difference in the kinetics of this depolarization in bax bak1 DKO MEF cells compared to wild-type cells, indicating that it occurs independently of the mitochondrial pathway of apoptosis. In line with these findings, only the minority of putative BH3 mimetics such as ABT737, ABT-263 and ABT-199 appear to act as bona fide, selective inhibitors of BCL2, BCL2L1 (BCL2 like 1) and BCL2L2 (BCL2 like 2), and alternative mechanisms seem to predominate in cell killing induced by several of these compounds, including AT 101 [Citation44].
Interestingly, we recently demonstrated that AT 101 impairs mitochondrial respiration in bax bak1 DKO MEF cells, in glioma cells and in the aging model P. anserina that lacks expression of endogenous BCL2 proteins [Citation23]. In this study, we also provided evidence that PPID/CYPD (peptidylprolyl isomerase D)-mediated opening of the mPTP is required for AT 101-induced mitochondrial dysfunction, autophagy and cell death, supporting the hypothesis that mitochondrial permeability transition, but not the BAX- and BAK1-dependent apoptosis pathway, plays a predominant role in cell killing by AT 101.
In line with these observations, we provide novel evidence that AT 101 induces mitophagy and thereby a robust decrease of mitochondrial mass. Our global proteomic analysis of U87MG and U343 glioma cells indicated a prominent decrease in mitochondrial protein pools, which could be confirmed by western blot analysis of mitochondrial markers including VDAC1, COX4I1, TOMM20 and HSPD1. Knockout of ATG5 in MZ-54 cells was able to prevent the decrease of mitochondrial protein markers. Consistently, studies with P. anserina confirmed the induction of mitophagy and the resulting decrease of mitochondrial proteins. Additionally, FACS analysis of U87MG and MZ-54 cells stably expressing mt-mKeima demonstrated an increase of mitophagy upon AT 101 treatment that was completely abrogated by autophagy inhibition with bafilomycin A1. Furthermore, we observed a decrease of MTG intensity after treatment with AT 101 that could significantly be rescued with wortmannin, bafilomycin A1 and chloroquine, indicating ongoing mitophagy. Despite the fact that mitophagy can also occur through alternative autophagy pathways independent of ATG5 [Citation45,Citation46], the decrease of MTG intensity was also attenuated in ATG5-depleted MZ-54 cells, demonstrating that 1) ATG5 is involved in mitophagy in these cells, and 2) that the block in AT 101-induced mitophagy is associated with reduced induction of cell death. Collectively, our observations suggest that a lethal form of mitophagy contributes to the cellular demise of glioma cells treated with AT 101.
Our data also demonstrate that AT 101-triggered mitophagy is accompanied with strongly increased expression of the mitophagy receptors BNIP3 and BNIP3L. Depletion of BNIP3 and BNIP3L was able to reduce AT 101-induced mitophagy and cell death. While BNIP3 was previously implicated in triggering an autophagic type of cell death in malignant glioma cells upon treatment with ceramide and arsenic trioxide [Citation47,Citation48], our new data suggest a predominant function of BNIP3L in AT 101-triggered cell death. The mechanism for how BNIP3 and BNIP3L exert cell death is still unclear, but their function as proapoptotic BH3-only proteins does not appear to be the major pathway of cell death induction [Citation36]. Instead, BNIP3 and BNIP3L can cause an opening of the mPTP, which is accompanied by a loss of mitochondrial membrane potential [Citation36,Citation49,Citation50]. Therefore, BNIP3 and BNIP3L may be directly involved in the BAX- and BAK1-independent AT 101-induced mitochondrial dysfunction observed in this study.
In this context it is worth mentioning that our previous work demonstrated that the mPTP inhibitor olexosime is able to reduce mitochondrial depolarization and cell death induced by AT 101 [Citation23]. It was proposed that the opposing effects of pro-survival and pro-death autophagy may be caused by the extent and duration of autophagy, indicating a threshold effect of autophagy as also observed for other stress responses such as the ER stress response and the TP53 (tumor protein p53) pathway [Citation51]. However, a number of studies suggest that the selective removal of autophagy substrates may provide an alternative scenario in promoting cell death, e.g., the degradation of the ROS scavenger CAT (catalase) [Citation52,Citation53]. In line with this notion, our novel findings underscore the hypothesis that similar to nonspecific bulk autophagy, selective mitophagy, which typically acts in a cytoprotective manner, may reach a certain threshold level at which it will turn into a death-promoting process.
In analogy to our findings on AT 101, cell death caused by lethal mitophagy was previously reported to be induced by the orphan nuclear receptor NR4A1/TR3 [Citation54], C-18 ceramide [Citation55] and by selenite in glioma cells [Citation56,Citation57]. Our proteomic analysis of U87MG and U343 cells revealed that HMOX1 is upregulated in both cell lines upon treatment with AT 101. HMOX1 is an inducible enzyme that catalyzes the degradation of pro-oxidant heme, but is also involved in mitochondrial biogenesis and mitophagy [Citation41,Citation42]. Overexpression of HMOX1 was able to promote mitochondrial biogenesis in cardiac myocytes caused by upregulation of NFE2L2 (nuclear factor, erythroid 2 like 2), PPARGC1A (PPARG coactivator 1 alpha) and TFAM (transcription factor A, mitochondrial) protein levels and an increased expression of the mitochondrial fusion mediators upon treatment with doxorubicin [Citation41]. However, the regulation of autophagy and especially mitophagy by HMOX1 has also been described by several studies. Thereby, HMOX1 can exert either cytoprotective or cytotoxic functions of autophagy induction [Citation42].
HMOX1-dependent upregulation of autophagy was able to protect hepatocytes from cell death in mice with infection-induced sepsis [Citation58]. A mitophagy-inducing function of HMOX1 is supported by data from conditional cardiomyocyte-specific KO animals that display disturbed mitochondrial quality control and increased tissue damage after exposure to oxidative stress [Citation59]. On the contrary, in a model of neurodegeneration, HMOX1 overexpression activates mitophagy, resulting in the accumulation of iron-laden cytoplasmic inclusions and increased neuronal cell death [Citation60]. Bansal and coworkers determined that mitochondria-targeted HMOX1 induces oxidative stress and mitochondrial dysfunction in macrophages, which results in the induction of autophagy [Citation61]. In our experimental paradigm, siRNA-mediated depletion of HMOX1 led to significantly diminished AT 101-induced mitophagy and a concomitant alleviation of cell death, clearly demonstrating that HMOX1 overactivation is mechanistically linked to the killing effects of AT 101.
Despite our experimental evidence for a death-promoting function of BNIP3, BNIP3L and HMOX1, their depletion only led to a partial rescue of cell viability, indicating the presence of additional key players involved in AT 101-triggered, non-apoptotic cell death that still need to be elucidated. Our recent findings showing impaired mitochondrial respiration and mPTP opening after AT 101 treatment suggest mitochondrial dysfunction to be a key driver of AT 101-induced cell demise. When autophagy/mitophagy are blocked, e.g. by genetic depletion of ATG5, BNIP3, BNIP3L or pharmacological inhibitors, AT 101-induced cell death is partially inhibited, but cells will ultimately surrender to the severe accumulation of mitochondrial damage and likely undergo an mPTP-induced cell death [Citation23]. This type of non-apoptotic cell death may involve the participation of additional death effectors such as stress kinases, AIFM/apoptosis-inducing factor [Citation62,Citation63] and non-caspase proteases such as calpains [Citation64,Citation65] and cathepsins [Citation66]. Although the mechanisms of non-apoptotic cell death induced by AT 101 are currently not completely understood, it is worth mentioning that all 3 investigated glioma cell lines lack detectable expression of RIPK3 (receptor interacting serine/threonine kinase 3; data not shown), which is critical for necroptotic cell death [Citation67–Citation69]. Furthermore, we found that ferroptosis is not involved in AT 101-induced glioma cell death. Based on these findings and considerations, we suggest that AT 101 triggers an autophagic/mitophagic type of cell death with necrotic features in glioma cells.
In conclusion, we propose that AT 101 treatment leads to impaired mitochondrial respiration, mPTP opening [Citation23], mitochondrial dysfunction and a severe accumulation of damaged mitochondria that are subsequently degraded via mitophagy. In parallel, AT 101 stimulates induction of BNIP3 and BNIP3L as well as HMOX1 that further amplify mitophagy and partially contribute to AT 101’s toxicity. Based on these observations, we propose that in glioma cells, HMOX1 induction and mitochondrial dysfunction synergize to promote excessive mitophagy and cellular demise induced by AT 101, a compound that is clinically developed for cancer treatment.
Materials and methods
Cell culture and reagents
DMEM GlutaMAX (10,566,016), SILAC DMEM (A33822), penicillin/streptomycin (15,140,122), L-glutamine (25,030,081), fetal bovine serum (FBS; 10,270,106), dialyzed FBS (26,400,044), phosphate buffered saline (PBS) (14,190,094) and trypsin-EDTA (25,200,056) were purchased from Gibco® (Life Technologies). L-arginine 13C6, 15N4 (NC0332135) and L-lysine 13C6, 15N2 (NC0353871) were purchased from Cambridge Isotope laboratories and standard L-arginine (A5006) and L-lysine (L5501) from Sigma-Aldrich. The human glioma cell lines MZ-54 (isolated from a recurrent grade IV glioblastoma [Citation70]), U87MG (ATCC, HTC-14) and U343 (GOS-3; DSMZ, ACC 408) were cultured in DMEM, high glucose, glutaMAX, 10% fetal bovine serum and 100 U/mL penicillin-streptomycin. MEF bax bak1 DKO cells were generated by the lab of Stanley Korsmeyer [Citation71]. MEF wild-type and MEF bax bak1 DKO cells were grown in DMEM, 10% FBS, 100 U/mL penicillin-streptomycin and 2 mM glutamine. The cells were kept at 37°C and 5% CO2. Cultures were tested monthly for mycoplasma contamination. For SILAC labelling, cells were cultured in medium consisting of SILAC DMEM, 10% dialyzed FBS, 100 U/mL penicillin-streptomycin, 2 mM L-glutamine, 21 mg/ml arginine and 36.5 mg/ml lysine. L-arginine 13C6, 15N4 and L-lysine 13C6, 15N2. isotopes were used for the ‘heavy’ labelled SILAC medium (K8R10), natural isotopes of L-arginine and L-lysine for the ‘light’-labelled medium (K0R0). Cells were incubated with AT 101 (Tocris, 3367), FCCP (Abcam Biochemicals, ab120081), bafilomycin A1 (LC Laboratories, B-1018), wortmannin (Sigma-Aldrich, W1628), chloroquine diphosphate salt (Sigma-Aldrich, C6628), staurosporine (Enzo Life Sciences, ALX-380–014), ferrostatin-1 (Sigma-Aldrich, SML0583), RSL3 (kindly provided by B. Stockwell, Columbia University, New York, NY, USA) or DMSO (Carl Roth, A994.1) as indicated.
P. anserina strains and cultivation
In studies with the P. anserina, wild-type strain ‘s’ [Citation72] and the previously generated strains PaSod3H26L::Gfp [Citation13] were used. All transgenic strains are in the genetic background of the wild-type strain ‘s’. Strains were grown on standard cornmeal agar (BMM) at 27°C under constant light [Citation73]. For spore germination, standard cornmeal agar with 60 mM ammonium acetate (Merck, 1116.1000) was used and incubated at 27°C in the dark for 2 days. All strains used in this study were derived from monokaryotic ascospores [Citation73].
Sample preparation for proteomic analysis
U87MG and U343 were analyzed in technical duplicates and triplicates using SILAC- and label-free-based quantification, respectively. For SILAC labelling, U87MG cells were cultured in lysine- and arginine-free DMEM (high-glucose, glutaMAX; Thermo Fisher Scientific, 10,566,016) supplemented with 10% dialyzed FBS and antibiotics as well as with 146 mg/ml light (K0; Sigma-Aldrich, L8662) or heavy lysine (K8; Euriso-Top, CNLM-291-H-1) and 84 mg/ml light (R0; Sigma-Aldrich, A8094) or heavy (R10; Euriso-Top, CNLM/539-H-0) arginine. Cells were treated with AT 101 or DMSO as control for 48 h.
After treatment, cells were harvested and washed twice with chilled PBS. Cells were lysed with lysis buffer (8 M urea [Sigma-Aldrich, U5378], 75 mM NaCl [Sigma-Aldrich, 31,434], 50 mM Tris [Sigma-Aldrich, T1503], pH 8.2, one tablet of protease inhibitors cocktail [Sigma-Aldrich, P834099], 1 mM sodium fluoride [Fluka, 71,519], 1 mM sodium β-glycerophosphate [Cayman Chemical, 13,408–09-8], 1 mM sodium orthovanadate [Sigma-Aldrich, 450,243-50G], 10 mM sodium pyrophosphate [Sigma-Aldrich, S6422-100G], 1 mM phenylmethylsulfonyl fluoride [Sigma-Aldrich, P7626]) and lysates were sonicated 3 times for 60 sec with an output of 15%. Samples were centrifuged for 10 min at 15,000 x g to pellet cell debris. Supernatant was transferred into a new tube and protein concentration was determined using a Pierce BCA protein assay kit (Thermo Fisher Scientific, 23,225) according to the manufacturer’s manual.
Differentially AT 101-treated and SILAC-labelled U87MG cells were mixed at equal ratio based on protein concentration. DTT (1,4-dithiothreitol; AppliChem, 28,194,437) was added to a final concentration of 5 mM and the samples were incubated for 25 min at 56°C, followed by the addition of iodoacetamide (Sigma-Aldrich, I1149) to 14 mM final concentration and a further incubation for 30 min at room temperature in the dark. Unreacted iodoacetamide was quenched by addition of DTT to an additional 5 mM and incubating for 15 min at room temperature in the dark. Samples were diluted 1:5 in 25 mM Tris-HCl (Sigma-Aldrich, T1530), pH 8.2, and CaCl2 (Sigma-Aldrich, C3306) was added to a final concentration of 1 mM. Proteins were digested by adding trypsin (Promega, V511A) 1:250 (enzyme:substrate) and incubated at 37°C overnight. Digestion was stopped by acidification with trifluoroacetic acid (TFA; Carl Roth, 6957) to 0.4% and samples were centrifuged at 2300 x g for 10 min at room temperature. Supernatant was transferred to new tubes.
Reverse-phase Sep-Pak tC18 cartridges with 500 mg sorbent (Waters, WAT036790) were used to desalt the protein samples, which were connected to a vacuum manifold. Cartridges were washed with 9 ml acetonitrile (ACN, Carl Roth, 36,201) and 3 ml 50% ACN-0.5% acetic acid (HAcO, Carl Roth, 6957), followed by the equilibration with 9 ml of 0.1% TFA. Samples were loaded on the cartridges and washed with 9 ml of 0.1% TFA. TFA was removed by washing with 900 µl 0.5% HAcO and peptides were eluted with 5 ml of 50% ACN-0.5% HAcO. Eluates were frozen with liquid N2 and lyophilized.
Peptides were resuspended in 400 µL 7 mM KH2PO4, pH 2.65, 30% ACN and loaded on a HPLC system with a PolySULFOETHYL A™ column (5 μm, 200Å, 200 mm x 9.4 mm, PolyLC Inc) and 12 4-min fractions were collected. The gradient used for the separation is described by Villén & Gygi, 2008 [Citation74]. Fractions were frozen in liquid N2 and volume was reduced by 30% with a lyophilizer. Reverse-phase Sep-Pak tC18 cartridges with 100 mg sorbent (Waters, WAT036955), connected to a vacuum manifold were used to desalt peptides. Cartridges were washed with 3 ml ACN and 3 ml 50% ACN-0.5% HAcO and equilibrated with 3 ml of 0.1% TFA. TFA was added to the samples to a final concentration of 0.1%, loaded onto the cartridges and washed and desalted with 3 ml of 0.1% TFA. Cartridges are washed with 250 µl 0.5% HAcO and peptides were eluted with 1 ml of 50% ACN-0.5% HAcO. Peptides were dried by vacuum centrifugation (Concentrator 5301, Eppendorf, Wesseling-Berzdorf, Germany).
Using an EASY-nLC II (Thermo Fisher Scientific, Dreieich, Germany), peptides were loaded onto 75 µm x 15 cm fused silica capillaries (New Objective, Woburn, MA, USA) packed with C18AQ resin (Reprosil-Pur 120, 3 µm, Dr. Maisch HPLC, Ammerbuch-Entringen, Germany). Peptide mixtures were separated using a gradient of 5% – 33% ACN in 0.5% HAcO over 90 min and detected on an Orbitrap Elite mass spectrometer (Thermo Fisher Scientific, Dreieich, Germany). MS data were processed and analyzed using MaxQuant and Perseus. For U87MG, log2 of fold change of the quotient AT 101-DMSO was calculated and −1 and 1 was set as cut-off. In the analysis of U343, only proteins with one complete triplet (either control or AT 101) and a significant change between control and AT 101 (p < 0.05) were included. DAVID 6.7 (Database for Annotation, Visualization and Integrated Discovery) and PANTHER 9.0 (Protein Analysis through Evolutionary Relationships) were used for gene ontology analysis and functional classifications.
Generation of CRISPR/Cas9 knockouts and transfection
The guide RNAs for ATG5 knockouts were separately cloned into the SpCas9(BB)-2A-GFP (PX458) vector from Feng Zhang (Addgene, 48,138) [Citation75]. The vector encodes the Cas9 endonuclease, which binds to a single guide RNA (sgRNA) including 20 nucleotides complementary to the target locus in the genome. For Cas9 endonuclease from Streptococcus pyogenes, the target locus needs to precede a 5ʹNGG protospacer adjacent motif [Citation75]. Lipofectamine 3000 (Thermo Fisher Scientific, L3000008) was used to transfect a combination of 2 different guide RNA plasmids into U343 and MZ-54 cells (DNA:Lipofectamine 3000 ratio 1:2 for U343 and 1:1.5 for MZ-54 cells) according to the manufacturer’s instructions. For U343 ATG5 KO 1 and MZ-54 ATG5 KO 2 the sgRNAs CACCGAAGATGTGCTTCGAGATGTG and CACCGCCTCTAATGCTACCACTCAG were used, and for MZ-54 KO 1 the sgRNAs CACCGTCAGGATGAGATAACTGAAA and CACCGCCTCTAATGCTACCACTCAG were used. The sgRNA sequences were generated with the online tool Benchling and already contain the cloning sites for BbsI. The base G was added 5ʹ if the sgRNA started with another base.
After 72 h, the GFP-positive cells were sorted into a 24-well plate with a FACS Aria II cell sorter (BD Biosciences, Heidelberg, Germany). Cells were incubated in conditioned medium containing 50% sterile filtered medium from cultured cells and 50% fresh medium for 72 h. Next, the cells were separated by single cell dilution into 96-well plates and colonies were expanded. Single cell clones with ATG5 KO were detected by PCR and western blot. For depletion of BNIP3, BNIP3L and HMOX1 2 different siRNAs were used (SASI_Hs01_00035065 [HMOX1 KD 1] and SASI_Hs01_00035067 [HMOX1 KD 2], SASI-Hs01_00131554 [BNIP3 KD 1] and SASI-Hs01_00131555 [BNIP3 KD 2], SASI-Hs01_00030000 [BNIP3L KD 1] and SASI-Hs01_00030001 [BNIP3L KD 2], Sigma-Aldrich). Cells were transfected at 60% confluency using the siRNA against HMOX1, BNIP3, BNIP3L or siRNA Universal Negative Control (Sigma-Aldrich, SIC001) and Lipofectamine 2000 (Thermo Fisher Scientific, 11,668,027) according to the manufacturer’s instructions. Treatments were performed 24–48 h after transfection.
Mt-mkeima transduction
Mt-mKeima (gift from Richard Youle; Addgene, 72,342) was cloned into a pHAGE IRES Puro vector [Citation76]. Lentiviral particles were produced by transfection of HEK293T cells and collected over 48 h. U87MG and MZ-54 cells were transduced with 0.45-µm filtered, virus-containing supernatant (1:10) in presence of 8 µg/ml polybrene (EMD Millipore, TR-1003) and selected with 1 µg/ml puromycin (Sigma-Aldrich, P8833) for 12 days.
Western blot analysis
150,000–180,000 cells were seeded in 6-well plates and cell lysis was performed with 2xSDS lysis buffer (137 mM Tris-HCl [Sigma-Aldrich, T1503] pH 6.8, 4% SDS [Serva Electrophoresis, 151–21-3], 20% glycerol [AppliChem 56–81-5], 1 mM protease inhibitor cocktail [Sigma-Aldrich, P8340], 1 mM PhosSTOP [Roche Diagnostics, 04 906 837 001]). Cell membranes were destroyed by ultrasonic beats (3x10 times) and the protein amount of whole cell lysates was determined with a Pierce BCA protein assay kit (Thermo Fisher Scientific, 23,225). For SDS PAGE, 30–60 µg proteins with 5X SDS loading buffer (250 mM Tris-HCl, pH 6.8, 10% SDS, 30% glycerol, 0.02% bromophenol blue [Sigma-Aldrich, B8026], 5% 2-mercaptoethanol [Sigma-Aldrich, M6250]) were heated for 5 min at 95°C and separated on a 10–15% SDS gel (85V for 30 min, then 135V). Proteins were blotted semi-dry (15V, 35 min) onto a nitrocellulose membrane (Neolab, 260,201,396).
For MAP1LC3B and BNIP3 detection, the membranes were blocked with 5% milk (Carl Roth, T145.2) in TBS (150 mM NaCl, 50 mM Tris, pH 7.5) + 0.05% Tween (AppliChem, A13890500) (TBST). All other membranes were blocked with 5% BSA (AppliChem, A1391.0500) in TBST for 1 h at room temperature and incubated with primary antibodies overnight at 4°C (all antibodies were diluted with 5% BSA in TBST): TOMM20 (translocase of outer mitochondrial membrane 20; 1:500; Santa Cruz Biotechnology, sc-11,415), VDAC1 (voltage dependent anion channel 1; 1:1000; Abcam Biochemicals, ab15895), HSPD1 (heat shock protein family D [Hsp60] member 1; 1:1000; Cell Signaling Techlonogy, 12,165), ATG5 (autophagy related 5; 1:1000; Cell Signaling Techlonogy, 2630s), MAP1LC3B (microtubule associated protein 1 light chain 3 beta; 1:1000; Thermo Fisher Scientific, PA1-16,930), COX4I1 (cytochrome c oxidase subunit 4I1; 1:1000; Cell Signaling Technology, 4850), BNIP3 (BCL2 interacting protein 3; 1:250; Abcam, ab10433), BNIP3L (BCL2 interacting protein 3 like; 1:1000; Cell Signaling Techlonogy, 12,396), SQSTM1/p62 (sequestosome 1; 1:1000; BD Biosciences, 610,833), TUBA4A (tubulin alpha 4a; 1:5000; Sigma-Aldrich, T6199) and GAPDH (glyceraldehyde-3-phosphate dehydrogenase; 1:10,000; Merck Millipore, CB1001). Secondary antibodies (goat anti-mouse, 926–32,210 or 926–68,070 and goat anti-rabbit, 926–32,211 or 926–68,071, all from Li-COR Biotech) were applied 1:10,000 for 1 h at room temperature. Antibodies were detected with a LI-COR Odyssey reader (LI-COR Biosciences, Bad Homburg, Germany).
Protein isolation and western blot analysis of P. anserina protein extracts were performed as previously published [Citation73]. Primary antibodies were raised against PaPRX specific synthetic peptide ([Ac]-LHESSPGNKVNLADC-[NH2], New England Peptide) corresponding to amino acids 43–56 (dilution: 1:2000), a PaATP5 specific synthetic peptide ([Ac]-CKLAKMNKLLTDTL-[OH], New England Peptide) corresponding to amino acids 213–225 (dilution: 1:2000) and the PaPORIN full-length protein (New England Peptide, dilution 1:5000). A polyclonal rat SOD2/MnSOD antibody (Biomal Stressgen, SOD-111: dilution: 1:2000) was used to detect P. anserina PaSOD3 (mitochondrial superoxide dismutase) and a monoclonal GFP antibody (dilution: 1:10,000; Sigma-Aldrich, G6795) was used to detect ´free GFP´.
Subsequently, secondary antibodies with the infrared dye IR Dye 800 (dilution: 1:15,000; Li-COR Biosciences, 926–68,021) or IR Dye 680 LT (dilution: 1:20,000; Li-COR Biosciences, 926–68,021) were used. For detection and densitometric quantification the ‘Odyssey Infrared Imaging System’ (Li-COR Biosciences, Bad Homburg, Germany) was used.
Flow cytometry
Tetramethylrhodamine methyl ester (TMRM; ex/em maxima ~ 553/576; Life Technologies, T668) is a cationic fluorescent dye that enables the quantification of mitochondrial membrane potential and therefore the detection of depolarized and damaged mitochondria. The fluorophore MitoTracker Green FM (MTG; ex/em maxima ~ 490/516; Life Technologies, M7514) was used to detect the mitochondrial mass, in order to monitor mitochondrial degradation. Double staining with APC ANXA5/annexin V (ex/em maxima 650/660; BD Pharmingen, 550,475) and propidium iodide (PI; ex/em maxima ~ 535/617 nm; Sigma-Aldrich, P4864) was performed to quantify cell death. For FACS measurements, 15,000 – 30,000 cells were seeded into 24-well plates. MEF cells and glioma cells were stained with 100 nM and 50 nM TMRM, respectively. For all cell lines, an amount of 25 nM MTG was sufficient for proper staining. The fluorophores were added into the cell medium for 30 min before harvesting. Cell pellets were resuspended in 50 µl PBS before measurement. For APC ANXA5/annexin V (ex/em maxima 650/660)-PI measurements, the cell pellets were resuspended in 50 µl FACS buffer (10 mM HEPES [AppliChem, 7365–45-9], 140 mM NaCl [Sigma-Aldrich, 31,434], 5 mM CaCl2 [Sigma-Aldrich, C3306], pH 7.4) with 0.8 µl APC ANXA5/annexin V and 0.8 µg/mL PI. Measurements were performed either with a FACS Accuri or FACS Canto II cytometer (BD Biosciences, Heidelberg, Germany).
For the mt-mKeima assay, 100,000 cells stably expressing mKeima were seeded into 12-well plates one day before the measurement. The cells were treated 6 h, trypsinized, washed once in medium and resuspended in 1 ml chilled PBS. The cell suspensions were held on ice and measured with a BD LSRFortessa (BD Biosciences, Heidelberg, Germany) equipped with 405-, 488-, 561- and 640-nm lasers. Events were preselected for viable, single cell populations, which show excitation at 405 and emission at 610/620 nm. Fluorescent cells (10,000 per sample) were collected and analyzed for dual-excitation at 488 (pH 7) and 561 (pH 4) nm with 582/515 and 610/620 nm emission filters, respectively. By analysis of the 561 nm:488 nm ratio, the percentage of lysosomal mt-mKeima can be calculated [Citation77]. Data processing was done with FlowJo (v10, Tree Star).
Electron microscopy
Treated cells were harvested using accutase (Sigma-Aldrich, A6964), washed with PBS, pelleted by centrifugation at 179 x g for 5 min and fixed for 45 min in 2.5% (v:v) glutaraldehyde (Carl Roth, 3778.1) buffered in cacodylate (pH 7.4) prior to recurrent centrifugation. The resulting cell pellet was embedded in 1% osmium tetroxide (Carl Roth, 8371.3) and dehydrated in a graded ethanol (Carl Roth, K928.2) series, which was intermingled by an incubation step with uranyl acetate (Serva, 77,870.01; between the 50% and 90% ethanol step) and finally, rinsed in propylene oxide (Sigma-Aldrich, 110,205). After embedding the pellets in epoxy resin (Sigma Aldrich, 45,359-1EA-F), which polymerized for 16 h at 60°C, semithin sections (0.5 µm) were cut using an ultramicrotome (Leica Ultracut UCT, Deerfield, IL, USA) with a diamond knife. Sections were stained with toluidine blue (Merck, 1,159,300,025), placed on glass slides, and examined by light microscopy to select appropriate areas for ultrathin preparation. Ultrathin sections (50–70 nm) were cut using an ultramicrotome. Afterwards, sections were mounted on copper grids and contrasted with uranyl acetate for 2–3 h at 42°C and lead citrate for 20 min at room temperature. These samples were analyzed and digitally documented using a FEI Tecnai G2 Spirit Biotwin TEM (Hillsboro, OR, USA) at an operating voltage of 120 kV.
Assessment of ferroptotic cell death
The glioma cell lines U343, U87MG and MZ-54 were seeded at 5000–7000 cells per 96-well. After 24 h, cells were pre-treated with ferrostatin-1 (Sigma-Aldrich, SML0583) for 1 h prior to treatment with AT 101 or RSL3 (RSL3 was kindly provided by B. Stockwell, Columbia University, New York, NY, USA) for 48 or 72 h. Cell death was assessed by PI and Hoechst staining (1 µg/mL of PI; Sigma-Aldrich, SML0583; and 10 µg/mL of Hoechst33342; Thermo Fisher Scientific, 62,249) followed by fluorescence microscopy using ImageXpress Micro XLS system (Molecular, Devices, CA, USA).
Determination of gene expression by quantitative real-time polymerase chain reaction (qPCR)
For the isolation of total RNA the QIAshredder (Qiagen, 79,656) and RNeasy Mini Kit from Qiagen (Qiagen, 74,106) were used according to the manufacturer’s instructions. CDNA was synthesized by using 2 µg of the corresponding RNA, Superscript III reverse transcriptase (Thermo Fisher, 18,080,044) and random primers in a total volume of 20 µL according to the manufacturer’s protocol, and cDNA was diluted with 180 µL DEPC-H2O afterwards. For qPCR 5 µL cDNA, 1 μl 1xTaqMan Gene Expression Assay primer and 10 μl 1x FastStart Universal Probe Master-mix (Roche, 04913957001) were used. The samples were normalized to the amplification value of the reference gene TBP (TATA-box binding protein). The following FAM (FAM-dye-labeled)-MGB (minor-grove-binding) primers were used: Hs00427620_m1 (TBP), Hs00969291_m1 (BNIP3), Hs00188949_m1 (BNIP3L) and Hs00177654_m1 (SQSTM1/p62) (Thermo Fisher Scientific). Relative expression levels of the target genes were calculated by using the comparative CT method [Citation78].
Determination of the mitochondrial mass by qrt-pcr
In order to determine the mitochondrial DNA mass of glioma cell lines upon treatment with AT 101, we quantified the mitochondrial-encoded gene MT-ND1 (mitochondrially encoded NADH:ubiquinone oxidoreductase core subunit 1) relative to the nuclear-encoded gene LPL (lipoprotein lipase). The ratio of mitochondrial DNA to nuclear DNA reflects the tissue concentration of mitochondria per cell [Citation31] and can therefore be used to assess the mitochondrial mass. Human glioma cell lines MZ-54, MZ-54 ATG5 KO2, U343 and U87 were treated with 15 µM AT 101 for 30 h. Total DNA was isolated by using the QIAamp DNA Mini Kit (Qiagen, 51,304) according to the manufacturer’s instructions. For quantification of mitochondrial and nuclear DNA levels, SYBR-Green based quantitative real-time PCR was performed using the SYBR™ Green PCR Master Mix (Thermo Fisher Scientific, 4,309,155) and the QuantStudio 7 Flex Real-Time PCR System (Applied Biosystems, Thermo Fisher Scientific, Darmstadt, Germany). Total DNA (12 ng) were used per sample and the qRT-PCR was initiated with 2 min at 50°C, followed by 10 min at 95°C. This was followed by 40 cycles of 15 sec at 95°C and 1 min at 60°C. Analysis of the melting curves served as control for the specificity of the amplified products. Relative DNA levels of the mitochondrial gene MT-ND1 were calculated compared to the nuclear gene LPL by using the 2−ΔΔCT-method [Citation79]. The resulting mitochondrial mass of AT 101-treated glioma cell lines was normalized to the mitochondrial mass of untreated cells of the same cell line. At least 3 independent experiments in technical triplicates were performed for each gene. All primers were purchased from Eurofins (Hamburg, Germany) and were as follows: MT-ND1 (mitochondrial target gene), Forward: CCCTAAAACCCGCCACATCT, Reverse: GAGCGATGGTGAGAGCTAAGGT; LPL (nuclear target gene), Forward: ATGAGAGTTGGGTGCCAAAAC, Reverse: AGTCCACCACAATGACATTGGA.
Statistical analysis
Statistical analysis was done using GraphPad Prism 7 (GraphPad Software, La Jolla CA, USA). A Shapiro Wilk normality test was performed to determine if a data set is well-modeled by a normal distribution. In case of normally distributed data, a one-way or two-way ANOVA was used to analyze differences between treatments. For non-normally distributed data, the non-parametric Mann-Whitney U-test or Kruskal-Wallis test was performed. The minimum level of statistical significance was set at P ≤ 0.05. P ≤ 0.05: *, P ≤ 0.01: **, P ≤ 0.001: ***, n.s. not significant. Significances are depicted between control and treatments or as indicated.
Supplemental Material
Download Zip (1.3 MB)Disclosure statement
No potential conflict of interest was reported by the authors.
Supplementary material
Supplemental data for this article can be accessed here.
Additional information
Funding
Related Research Data
References
- Mariño G, Niso-Santano M, Baehrecke EH, et al. Self-consumption: the interplay of autophagy and apoptosis. Nat Rev Mol Cell Biol. 2014;15:81–94.
- Galluzzi L, Bravo-San Pedro JM, Levine B, et al. Pharmacological modulation of autophagy: therapeutic potential and persisting obstacles. Nat Rev Drug Discov. 2017;16:487–511.
- Fulda S, Kögel D. Cell death by autophagy: emerging molecular mechanisms and implications for cancer therapy. Oncogene. 2015;34:5105–5113.
- Galluzzi L, Bravo-San Pedro JM, Vitale I, et al. Essential versus accessory aspects of cell death: recommendations of the NCCD 2015. Cell Death Differ. 2015;22:58–73.
- Cecconi F, Levine B. The role of autophagy in mammalian development: cell makeover rather than cell death. Dev Cell. 2008;15:344–357.
- Levine B, Klionsky DJ. Development by self-digestion: molecular mechanisms and biological functions of autophagy. Dev Cell. 2004;6:463–477.
- Swart C, Du Toit A, Loos B. Autophagy and the invisible line between life and death. Eur J Cell Biol. 2016;95:598–610.
- Baehrecke EH. Autophagic programmed cell death in Drosophila. Cell Death Differ. 2003;10:940–945.
- Berry DL, Baehrecke EH. Growth arrest and autophagy are required for salivary gland cell degradation in Drosophila. Cell. 2007;131:1137–1148.
- Knuppertz L, Hamann A, Pampaloni F, et al. Identification of autophagy as a longevity-assurance mechanism in the aging model Podospora anserina. Autophagy. 2014;10:822–834.
- Knuppertz L, Osiewacz HD. Autophagy compensates impaired energy metabolism in CLPXP-deficient Podospora anserina strains and extends healthspan. Aging Cell. 2017;16:704–715.
- Warnsmann V, Osiewacz HD. Curcumin treatment affects mitochondrial respiration, induces autophagy and increases lifespan of the fungal aging model Podospora anserina. Endocytobiosis Cell. 2016;27:20–26.
- Knuppertz L, Warnsmann V, Hamann A, et al. Stress-dependent opposing roles for mitophagy in aging of the ascomycete Podospora anserina. Autophagy. 2017;13:1037–1052.
- Kramer P, Jung AT, Hamann A, et al. Cyclophilin D is involved in the regulation of autophagy and affects the lifespan of P. anserina in response to mitochondrial oxidative stress. Front Genet. 2016;7:165.
- Kogel D, Fulda S, Mittelbronn M. Therapeutic exploitation of apoptosis and autophagy for glioblastoma. ACAMC. 2010;10:438–449.
- Salazar M, Carracedo A, Salanueva ÍJ, et al. Cannabinoid action induces autophagy-mediated cell death through stimulation of ER stress in human glioma cells. J Clin Invest. 2009;119:1359–1372.
- Shchors K, Massaras A, Hanahan D. Dual targeting of the autophagic regulatory circuitry in gliomas with repurposed drugs elicits cell-lethal autophagy and therapeutic benefit. Cancer Cell. 2015;28:456–471.
- Young MM, Takahashi Y, Khan O, et al. Autophagosomal membrane serves as platform for intracellular death-inducing signaling complex (iDISC)-mediated caspase-8 activation and apoptosis. J Biol Chem. 2012;287:12455–12468.
- Bonapace L, Bornhauser BC, Schmitz M, et al. Induction of autophagy-dependent necroptosis is required for childhood acute lymphoblastic leukemia cells to overcome glucocorticoid resistance. J Clin Invest. 2010;120:1310–1323.
- Liu Y, Levine B. Autosis and autophagic cell death: the dark side of autophagy. Cell Death Differ. 2015;22:367–376.
- Voss V, Senft C, Lang V, et al. The pan-Bcl-2 inhibitor (-)-gossypol triggers autophagic cell death in malignant glioma. Molecular Cancer Research: MCR. 2010;8:1002–1016.
- Antonietti P, Gessler F, Düssmann H, et al. AT-101 simultaneously triggers apoptosis and a cytoprotective type of autophagy irrespective of expression levels and the subcellular localization of Bcl-xL and Bcl-2 in MCF7 cells. Biochim Biophys Acta. 2016;1863:499–509.
- Warnsmann V, Meyer N, Hamann A, et al. A novel role of the mitochondrial permeability transition pore in (-)-gossypol-induced mitochondrial dysfunction. Mech Ageing Dev. 2017. DOI:10.1016/j.mad.2017.06.004.
- Mizushima N, Yoshimori T, Levine B. Methods in mammalian autophagy research. Cell. 2010;140:313–326.
- Allen GFG, Toth R, James J, et al. Loss of iron triggers PINK1/Parkin-independent mitophagy. EMBO Rep. 2013;14:1127–1135.
- Moretti L, Attia A, Kim KW, et al. Crosstalk between Bak/Bax and mTOR signaling regulates radiation-induced autophagy. Autophagy. 2007;3:142–144.
- Xiao B, Deng X, Zhou W, et al. Flow cytometry-based assessment of mitophagy using mitoTracker. Front Cell Neurosci. 2016;10:76.
- Yeo CWS, Ng FSL, Chai C, et al. Parkin pathway activation mitigates glioma cell proliferation and predicts patient survival. Cancer Res. 2012;72:2543–2553.
- Lin D-C, Xu L, Chen Y, et al. Genomic and functional analysis of the E3 ligase PARK2 in glioma. Cancer Res. 2015;75:1815–1827.
- Y-P Y, L-F H, H-F Z, et al. Application and interpretation of current autophagy inhibitors and activators. Acta Pharmacol Sin. 2013;34:625–635.
- Bogacka I, Xie H, Bray GA, et al. Pioglitazone induces mitochondrial biogenesis in human subcutaneous adipose tissue in vivo. Diabetes. 2005;54:1392–1399.
- Liu L, Sakakibara K, Chen Q, et al. Receptor-mediated mitophagy in yeast and mammalian systems. Cell Res. 2014;24:787–795.
- Youle RJ, Narendra DP. Mechanisms of mitophagy. Nat Rev Mol Cell Biol. 2011;12:9–14.
- Ashrafi G, Schwarz TL. The pathways of mitophagy for quality control and clearance of mitochondria. Cell Death Differ. 2013;20:31–42.
- Chourasia AH, Boland ML, Macleod KF. Mitophagy and cancer. Cancer & Metabolism. 2015;3:4.
- Zhang J, Ney PA. Role of BNIP3 and NIX in cell death, autophagy, and mitophagy. Cell Death Differ. 2009;16:939–946.
- Zhang H, Bosch-Marce M, Shimoda LA, et al. Mitochondrial autophagy is an HIF-1-dependent adaptive metabolic response to hypoxia. J Biol Chem. 2008;283:10892–10903.
- Ney PA. Mitochondrial autophagy: origins, significance, and role of BNIP3 and NIX. Biochim Biophys Acta. 2015;1853:2775–2783.
- Kaza N, Kohli L, Graham CD, et al. BNIP3 regulates AT101 (-)-gossypol induced death in malignant peripheral nerve sheath tumor cells. PloS One. 2014;9:e96733.
- Novak I, Dikic I. Autophagy receptors in developmental clearance of mitochondria. Autophagy. 2014;7:301–303.
- Hull TD, Boddu R, Guo L, et al. Heme oxygenase-1 regulates mitochondrial quality control in the heart. JCI Insight. 2016;1:e85817.
- Constantin M, Choi AJS, Cloonan SM, et al. Therapeutic potential of heme oxygenase-1/carbon monoxide in lung disease. Int J Hypertens. 2012;2012:859235.
- Kwon M-Y, Park E, Lee S-J, et al. Heme oxygenase-1 accelerates erastin-induced ferroptotic cell death. Oncotarget. 2015;6:24393–24403.
- Soderquist RS, Eastman A. BCL2 inhibitors as anticancer drugs: a plethora of misleading BH3 mimetics. Mol Cancer Ther. 2016;15:2011–2017.
- Hirota Y, Yamashita S-I, Kurihara Y, et al. Mitophagy is primarily due to alternative autophagy and requires the MAPK1 and MAPK14 signaling pathways. Autophagy. 2015;11:332–343.
- Honda S, Arakawa S, Nishida Y, et al. Ulk1-mediated Atg5-independent macroautophagy mediates elimination of mitochondria from embryonic reticulocytes. Nat Commun. 2014;5:4004.
- Daido S, Kanzawa T, Yamamoto A, et al. Pivotal role of the cell death factor BNIP3 in ceramide-induced autophagic cell death in malignant glioma cells. Cancer Res. 2004;64:4286–4293.
- Kanzawa T, Zhang L, Xiao L, et al. Arsenic trioxide induces autophagic cell death in malignant glioma cells by upregulation of mitochondrial cell death protein BNIP3. Oncogene. 2005;24:980–991.
- Vande Velde C, Cizeau J, Dubik D, et al. BNIP3 and genetic control of necrosis-like cell death through the mitochondrial permeability transition pore. Mol Cell Biol. 2000;20:5454–5468.
- Imazu T, Shimizu S, Tagami S, et al. Bcl-2/E1B 19 kDa-interacting protein 3-like protein (Bnip3L) interacts with bcl-2/Bcl-xL and induces apoptosis by altering mitochondrial membrane permeability. Oncogene. 1999;18:4523–4529.
- Muñoz-Pinedo C, Martin SJ. Autosis: a new addition to the cell death tower of babel. Cell Death Dis. 2014;5:e1319.
- Yu L, Wan F, Dutta S, et al. Autophagic programmed cell death by selective catalase degradation. Proc Natl Acad Sci U S A. 2006;103:4952–4957.
- Ginet V, Puyal J, Rummel C, et al. A critical role of autophagy in antileukemia/lymphoma effects of APO866, an inhibitor of NAD biosynthesis. Autophagy. 2014;10:603–617.
- Wang W-J, Wang Y, Chen H-Z, et al. Orphan nuclear receptor TR3 acts in autophagic cell death via mitochondrial signaling pathway. Nat Chem Biol. 2014;10:133–140.
- Sentelle RD, Senkal CE, Jiang W, et al. Ceramide targets autophagosomes to mitochondria and induces lethal mitophagy. Nat Chem Biol. 2012;8:831–838.
- Kim EH, Choi KS. A critical role of superoxide anion in selenite-induced mitophagic cell death. Autophagy. 2008;4:76–78.
- Kim EH, Sohn S, Kwon HJ, et al. Sodium selenite induces superoxide-mediated mitochondrial damage and subsequent autophagic cell death in malignant glioma cells. Cancer Res. 2007;67:6314–6324.
- Carchman EH, Rao J, Loughran PA, et al. Heme oxygenase-1-mediated autophagy protects against hepatocyte cell death and hepatic injury from infection/sepsis in mice. Hepatology (Baltimore, Md.). 2011;53:2053–2062.
- Suliman HB, Keenan JE, Piantadosi CA. Mitochondrial quality-control dysregulation in conditional HO-1(-/-) mice. JCI Insight. 2017;2:e89676.
- Zukor H, Song W, Liberman A, et al. HO-1-mediated macroautophagy: a mechanism for unregulated iron deposition in aging and degenerating neural tissues. J Neurochem. 2009;109:776–791.
- Bansal S, Biswas G, Avadhani NG. Mitochondria-targeted heme oxygenase-1 induces oxidative stress and mitochondrial dysfunction in macrophages, kidney fibroblasts and in chronic alcohol hepatotoxicity. Redox Biol. 2014;2:273–283.
- Cande C. Apoptosis-inducing factor (AIF): key to the conserved caspase-independent pathways of cell death? J Cell Sci. 2002;115:4727–4734.
- Susin SA, Lorenzo HK, Zamzami N, et al. Molecular characterization of mitochondrial apoptosis-inducing factor. Nature. 1999;397:441–446.
- Smith MA, Schnellmann RG. Calpains, mitochondria, and apoptosis. Cardiovasc Res. 2012;96:32–37.
- Polster BM, Basañez G, Etxebarria A, et al. Calpain I induces cleavage and release of apoptosis-inducing factor from isolated mitochondria. J Biol Chem. 2005;280:6447–6454.
- Mrschtik M, Ryan KM. Lysosomal proteins in cell death and autophagy. FEBS J. 2015;282:1858–1870.
- Cho YS, Challa S, Moquin D, et al. Phosphorylation-driven assembly of the RIP1-RIP3 complex regulates programmed necrosis and virus-induced inflammation. Cell. 2009;137:1112–1123.
- Moriwaki K, Chan FK-M. RIP3: A molecular switch for necrosis and inflammation. Genes Dev. 2013;27:1640–1649.
- Zhang D-W, Shao J, Lin J, et al. RIP3, an energy metabolism regulator that switches TNF-induced cell death from apoptosis to necrosis. Science (New York, N.Y.). 2009;325:332–336.
- Hetschko H, Voss V, Seifert V, et al. Upregulation of DR5 by proteasome inhibitors potently sensitizes glioma cells to TRAIL-induced apoptosis. FEBS J. 2008;275:1925–1936.
- Wei MC, Zong WX, Cheng EH, et al. Proapoptotic BAX and BAK: a requisite gateway to mitochondrial dysfunction and death. Science (New York, N.Y.). 2001;292:727–730.
- Rizet G. Impossibility of obtaining uninterrupted and unlimited multiplication of the ascomycete Podospora anserina. C R Hebd Seances Acad Sci. 1953;237:838–840.
- Osiewacz HD, Hamann A, Zintel S. Assessing organismal aging in the filamentous fungus Podospora anserina. Methods Mol Biol (Clifton, N.J.). 2013;965:439–462.
- Villén J, Gygi SP. The SCX/IMAC enrichment approach for global phosphorylation analysis by mass spectrometry. Nat Protoc. 2008;3:1630–1638.
- Ran FA, Hsu PD, Wright J, et al. Genome engineering using the CRISPR-Cas9 system. Nat Protoc. 2013;8:2281–2308.
- Katayama H, Kogure T, Mizushima N, et al. A sensitive and quantitative technique for detecting autophagic events based on lysosomal delivery. Chem Biol. 2011;18:1042–1052.
- Lazarou M, Sliter DA, Kane LA, et al. The ubiquitin kinase PINK1 recruits autophagy receptors to induce mitophagy. Nature. 2015;524:309–314.
- Schmittgen TD, Livak KJ. Analyzing real-time PCR data by the comparative CT method. Nat Protoc. 2008;3:1101–1108.
- Livak KJ, Schmittgen TD. Analysis of relative gene expression data using real-time quantitative PCR and the 2(-Delta Delta C(T)) Method. Methods (San Diego, Calif.). 2001;25:402–408.