
ABSTRACT
PTEN plays an important role in tumor suppression, and PTEN family members are involved in multiple biological processes in various subcellular locations. Here we report that PTENα, the first identified PTEN isoform, regulates mitophagy through promotion of PARK2 recruitment to damaged mitochondria. We show that PTENα-deficient mice exhibit accumulation of cardiac mitochondria with structural and functional abnormalities, and PTENα-deficient mouse hearts are more susceptible to injury induced by isoprenaline and ischemia-reperfusion. Mitochondrial clearance by mitophagy is also impaired in PTENα-deficient cardiomyocytes. In addition, we found PTENα physically interacts with the E3 ubiquitin ligase PRKN, which is an important mediator of mitophagy. PTENα binds PRKN through the membrane binding helix in its N-terminus, and promotes PRKN mitochondrial translocation through enhancing PRKN self-association in a phosphatase-independent manner. Loss of PTENα compromises mitochondrial translocation of PRKN and resultant mitophagy following mitochondrial depolarization. We propose that PTENα functions as a mitochondrial quality controller that maintains mitochondrial function and cardiac homeostasis.
Abbreviations: BECN1 beclin 1; CCCP carbonyl cyanide m-chlorophenylhydrazone; FBXO7 F-box protein 7; FS fraction shortening; HSPA1L heat shock protein family A (Hsp70) member 1 like; HW: BW heart weight:body weight ratio; I-R ischemia-reperfusion; ISO isoprenaline; MAP1LC3/LC3 microtubule associated protein 1 light chain 3; MBH membrane binding helix; MFN1 mitofusin 1; MFN2 mitofusin 2; Nam nicotinamide; TMRM tetramethylrhodamine ethyl ester; WGA wheat germ agglutinin
Introduction
PTEN is a tumor suppressor and functions in multiple biological processes, such as cell proliferation, cell cycle checkpoint control and DNA replication [Citation1–Citation5]. PTEN is essential for embryonic development, and disruption of PTEN results in neurological defects, metabolic disorders and cardiac dysfunction [Citation3,Citation6,Citation7]. PTENα is an isoform of PTEN that is expressed through alternative translation. It is initiated at a CUG codon upstream of and in-frame with the canonical PTEN coding region. This CUG start codon generates a longer form of PTEN with an elongated N-terminal region containing an additional 173 (Homo sapiens) or 169 (Mus musculus) amino acids [Citation8–Citation10]. Bioinformatics analysis has demonstrated that this extended N-terminus has a large, intrinsically disordered region which is rich in charged residues [Citation11], and there is a secretion signal and a re-entry sequence located in the N-terminus of PTENα that enables the protein to be secreted from one cell to an adjacent cell [Citation9].
Damaged mitochondria produce excessive reactive oxygen species, causing DNA damage, lipid and protein oxidation, and ultimately cell death. A series of well-coordinated quality control processes have thus evolved to maintain normal mitochondrial activity. Mitochondria continuously undergo fission and fusion to control mitochondrial structure and meet energy demands in response to environmental changes [Citation12]. Damaged mitochondrial proteins are renovated by mitochondrial biogenesis [Citation13]. However, when mitochondrial biogenesis and dynamic control are insufficient for mitochondrial rescue, mitophagy is activated, whereupon the organelle is engulfed by a phagophore – the precursor to an autophagosome – and subsequently delivered to a lysosome for degradation [Citation14].
PRKN (parkin RBR E3 ubiquitin protein ligase) is a cytosolic E3 ubiquitin ligase, and exhibits low activity under normal conditions, but is selectively recruited to dysfunctional mitochondria with decreased membrane potential [Citation15]. PINK1 (PTEN induced putative kinase 1) is a mitochondrial serine/threonine protein kinase, which is selectively stabilized on depolarized mitochondria to promote mitochondrial translocation and activation of PRKN [Citation16,Citation17]. In mammalian cells, the best understood type of mitophagy is PINK1-PRKN -dependent mitophagy. Following mitochondrial depolarization, PRKN is recruited onto mitochondria, and PINK1 then phosphorylates both PRKN and ubiquitin at Ser65 to fully activate PRKN [Citation18–Citation22]. Upon activation, PRKN adds ubiquitin chains on several mitochondrial outer membrane proteins, which serve as signals for mitochondrial clearance. Ubiquitin-binding receptors, such as SQSTM1/p62 (sequestosome 1) then recruit ubiquitinated cargo into phagophores by binding MAP1LC3/LC3 (microtubule associated protein 1 light chain 3) [Citation23–Citation25].
In this study, we demonstrate PTENα is necessary for mitophagy and mitochondrial integrity. Depletion of PTENα leads to accumulation of abnormal mitochondria in the mouse heart, and these mice are more susceptible to isoprenaline- or ischemia-reperfusion-induced damage. We show that PTENα forms a complex with PRKN and PINK1 and promotes PRKN translocation onto depolarized mitochondria. Disruption of PTENα impairs PRKN-mediated mitophagy in HeLa cells and mouse cardiomyocytes.
Results
Distribution and targeted deletion of PTENα
Tissue expression of PTENα was first analyzed in wild-type mice by immunoprecipitation with a PTENα antibody which was generated in our laboratory [Citation8]. PTENα was found in the brain, spleen, thymus, heart, liver, stomach and pancreas, but not in the kidney (). Subcellular localization of PTENα was then evaluated in heart and liver. PTEN resided predominantly in the cytoplasm, while PTENα localized in the mitochondria as well as the cytoplasm. Cardiomyocytes have abundant mitochondria, and PTENα showed greater mitochondrial localization in heart tissue than in the liver (). We therefore focused on heart tissue for subsequent investigation. Generation of ptenα-specific knockout mice was described in our recent previous study [Citation26]. We verified deletion of PTENα through immunoblotting with commercial PTEN antibody in cardiac tissue. As expected, PTENα was completely deleted in homozygous ptenαm/m mice, whereas expression of canonical PTEN was unaffected. Phosphorylation of AKT1 at Ser473 was consistently comparable in Ptenα+/+ and ptenαm/m mice ().
Figure 1. Confirmation of PTENα deletion in mouse heart. (a) Tissue distribution of PTENα. Analysis of PTENα by immunoprecipitation with PTENα N- terminus-specific antibody (α-N) in various tissue homogenates from 2-months-old wild-type C57BL/6 mice. *, another isoform of PTEN. (b) Subcellular localization of PTENα in mouse liver and heart. C, cytosolic fraction; M, mitochondrial fraction. GAPDH is a cytosolic marker; CYCS is a mitochondrial marker. (c-d) Immunoblot analysis of PTENα, PTEN, AKT1 and p-AKT1 Ser473 in cardiac homogenates. Left ventricles were dissected from 3-months-old mice, and homogenates were immunoblotted with the indicated antibodies. ACTB was used as a loading control. Expression of PTEN, AKT1, and p-AKT1 Ser473 was quantified with ImageJ (n = 3). Data are presented as mean ± SEM; n.s., not significant, p > 0.05 (two-tailed paired Student’s t-test).
PTENα ablation aggravates isoprenaline-induced hypertrophy and I-R-induced cardiac injury
We first assessed cardiac function under basal conditions and under stress. There were no significant differences in left ventricular contractility in Ptenα+/+ and ptenαm/m mice at 3 – 4 months of age as reflected by comparable left ventricular fraction shortening (FS) (). The heart weight:body weight (HW:BW) ratio () and mRNA levels of Nppa (natriuretic peptide type A) and Nppb (natriuretic peptide type B) () were also comparable in Ptenα+/+ and ptenαm/m mice, suggesting that spontaneous cardiac dysfunction does not occur in ptenαm/m mice. Isoprenaline (ISO) is a nonselective β adreno receptor agonist, which is well-established as a stress inducer that gives rise to pathological cardiac hypertrophy [Citation27]. We thus used this agent to evaluate the effects of PTENα ablation under stress. Seven days of intraperitoneal injection of ISO successfully induced cardiac hypertrophy in both Ptenα+/+ and ptenαm/m mice. However, ptenαm/m hearts exhibited much more severe hypertrophy, as reflected by a higher HW:BW ratio (), decreased fraction shortening () and increased Nppa mRNA levels (), as well as greater cardiomyocyte cross sectional area illustrated by wheat germ agglutinin (WGA) staining (). In addition, interstitial fibrosis evaluated with Masson’s trichrome staining further confirmed that PTENα ablation aggravated the severity of ISO-induced hypertrophy ().
Figure 2. PTENα ablation aggravates ISO-induced hypertrophy. (a) Fractional shortening (FS) in 3-months-old mice (n = 8). Data are presented as mean ± SEM; n.s., not significant, p > 0.05; versus wild-type littermates (two-tailed paired Student’s t-test) (for raw data see Table S1). (b) Gravimetric analysis of heart weight: body weight ratio (HW: BW) of 3-months-old mice (n = 8). Data are presented as mean ± SEM; n.s., not significant, p > 0.05; versus wild-type littermates (two-tailed unpaired Student’s t-test). (c) mRNA levels of Nppa and Nppb measured with real-time PCR in 3-months-old Ptenα+/+and ptenαm/m mouse hearts (n = 4). Data are presented as mean ± SEM; n.s., not significant, p > 0.05; versus wild-type littermates (two-tailed unpaired Student’s t-test). (d) Gravimetric analysis of heart weight: body weight ratio (HW:BW) for saline- or ISO-treated Ptenα+/+and ptenαm/m mice (n = 4). Data are presented as mean ± SEM; ***p < 0.001 comparing Ptenα+/+, ptenαm/m ISO groups, analyzed by two-way ANOVA followed by Bonferroni’s multiple comparisons test. ANOVA F1, 12 = 27.6. (e) Fractional shortening (FS) in saline- or ISO-treated Ptenα+/+ and ptenαm/m mice (n = 4). Data are presented as mean ± SEM; ***p < 0.001 comparing Ptenα+/+, ptenαm/m ISO groups, analyzed with two-way ANOVA followed by Bonferroni’s multiple comparisons test. ANOVA F1, 12 = 9.18. (f) mRNA levels of Nppa measured with real-time PCR in saline- or ISO-treated Ptenα+/+ and ptenαm/m mouse hearts (n = 4). Actb was used as a loading control. Data are presented as mean ± SEM; ***p < 0.001 comparing Ptenα+/+, ptenαm/m groups, analyzed with two-way ANOVA followed by Bonferroni’s multiple comparisons test. ANOVA F1, 20 = 26.3. (g) (Left panel) Representative wheat-germ agglutinin (WGA) images from ventricular sections of saline- or ISO-treated Ptenα+/+ and ptenαm/m mouse hearts. Magnification: 40x; scale bars: 10 μm. (Right panel) Gravimetric analysis of area of cardiomyocytes, at least 40 cells from 6 fields for each genotype (n = 4). Data are presented as mean ± SEM; ***p < 0.001 comparing Ptenα+/+, ptenαm/m ISO groups, analyzed with two-way ANOVA followed by Bonferroni’s multiple comparisons test. ANOVA F1, 12 = 16.75. (h) Increased cardiac fibrosis highlighted with Masson’s trichrome staining in the ptenαm/m heart following ISO treatment. Magnification: 20x; scale bars: 20 μm. (i) TTC staining in I-R hearts. For I-R stress, hearts were subjected to 30 min of ischemia followed by 30 min of reperfusion. After I-R treatment, the heart was harvested and rinsed with saline. The tissue pieces were stained with 1% w:v TTC at 37 ºC for 30 min, followed by fixation in 4% formaldehyde overnight. The infarcted (white) area was analyzed with ImageJ software as a percentage of total area (n = 3). Data are presented as mean ± SEM; **, p < 0.01; versus wild-type littermates (two-tailed paired Student’s t-test). (j) Fluorescence microscopy of ∆ψm as shown by TMRM. Isolated Ptenα+/+ and ptenαm/m mice (3-months old) hearts were Langendorff-perfused with Tyrode’s solution. For I-R stress, hearts were subjected to 30 min of ischemia followed by 30 min of reperfusion. Magnification: 20x; scale bars: 50 μm. +/+, Ptenα+/+; m/m, ptenαm/m; I-R, ischemia-reperfusion. Statistical analysis of percentage of TMRM-negative area was calculated from 30 fields of 3 mice from each group. ***p < 0.001 comparing Ptenα+/+, ptenαm/m groups (p = 0.0008), analyzed with two-way ANOVA followed by Bonferroni’s multiple comparisons test. ANOVA F1, 60 = 16.6. I-R, ischemia-reperfusion.
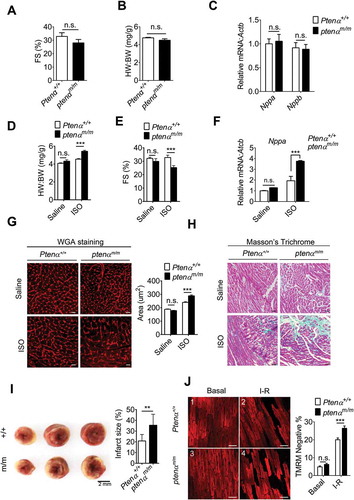
We next investigated the role of PTENα in cardiac ischemia-reperfusion (I-R) injury with Langendorff perfused hearts. Cardiac infarction size was analyzed with TTC staining after I-R stimulation, and ptenα knockout mice appeared to have more necrotic tissue on serial cardiac cross-sections (, left). Quantification showed the area of infarction in PTENα-deficient hearts was larger than that in wild-type hearts (, right). Mitochondrial membrane potential was next examined using the mitochondrial electrochemical potential (∆Ψm)-sensitive dye tetramethylrhodamine ethyl ester (TMRM) in Langendorff perfused hearts. Under basal conditions, both Ptenα+/+ and ptenαm/m mice showed normal ∆Ψm, indicated by the extensive TMRM fluorescence in cardiomyocytes (, panel 3 vs. 1). However, after stimulation with I-R, ptenαm/m hearts displayed a higher percentage of cells with decreased ∆Ψm as compared with Ptenα+/+ hearts (, panel 4 vs. 2 and 3(g)), indicating ptenαm/m hearts are more susceptible to I-R induced-damage.
These data indicate that although ptenαm/m mice did not develop spontaneous cardiac dysfunction, their susceptibility to ISO-induced hypertrophy and I-R-induced cardiac injury was increased.
Abnormal mitochondria accumulate in PTENα-deficient cardiomyocytes
Cellular respiration was analyzed in isolated primary fibroblasts with a Seahorse extracellular flux analyzer, and oxygen consumption rates were measured at regular intervals under addition of compounds to test mitochondrial activity. Both basal and maximal respiration were decreased in ptenαm/m fibroblasts compared to control cells (), indicative of decreased mitochondrial respiration after PTENα ablation. There was also a 48% decrease in ATP levels in left ventricular (LV) samples from ptenαm/m mice () consistent with decreased mitochondrial respiration.
Figure 3. PTENα-deficient mice developed cardiac mitochondrial dysfunction. (a) Mitochondrial stress tests were performed using the Seahorse XF24 Extracellular Flux Analyzer. Primary MEFs cells were seeded at a density of 4 × 10⁴ cells/well. Oligomycin A (1 µM), 1 μM FCCP, and 0.5 μM antimycin A-rotenone were injected from the reagent ports automatically into the wells at the times indicated. (b) Basal and maximum respiration (n = 3). Data are presented as mean ± SEM; *, p < 0.05; ***, p < 0.001; versus control cells (two-tailed paired Student’s t-test). (c) ATP content in cardiac homogenates of 4-months-old mice (n = 4). Homogenate (10 µl) from the left ventricle was suspended in 90 μl of reconstituted reagent and luminescence was recorded immediately. Data are presented as mean ± SEM; ***p < 0.001 versus wild-type littermates (two-tailed paired Student’s t-test). (d) Representative transmission electron microscopy images of 4-months-old mice. Magnification: left panel, 10,000x; Right panel, 20000x. Cardiac muscle (1 mm × 3 mm) was dissected from the left ventricle and fixed with 2.5% glutaraldehyde in 0.1 M Sorenson’s buffer (pH 7.2). m, mitochondrion. Mitochondrial area (e) mitochondrial content (f) and abnormal mitochondria (g) were analyzed in at least 100 mitochondria from 6 fields (10,000x) for each genotype (n = 3) in (D). Data are presented as mean ± SEM, n.s., not significant, p > 0.05; ***p < 0.001 versus wild type (two-tailed unpaired Student’s t-test for E) and two-tailed paired Student’s t-test for F). (h) Mitochondrial DNA copy number assessed by real-time PCR in 3-months-old mice (Ptenα+/+, n = 9; ptenαm/m, n = 7). DNA was extracted from left ventricles and amplified using specific primers for a nuclear gene (H19, encoding a long non-coding RNA) and a mitochondrial gene (mt-Cytb/cytochrome b). Data are presented as mean ± SEM; ***p < 0.001 versus wild type (two-tailed paired Student’s t-test).
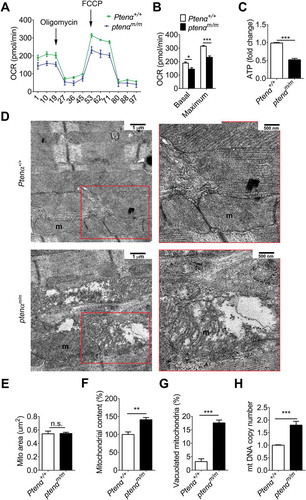
Ultrastructural changes in mitochondria were evaluated using transmission electron microscopy. Gross abnormalities in mitochondrial structure were not observed in 2-months-old ptenαm/m mice (Figure S1A, left panel), however, there was a significant increase in the number of abnormal mitochondria in PTENα-deficient cardiomyocytes from mice of 4 months of age ( and S1A, right panel). Analysis of these data showed that mitochondrial size was comparable (), but the percentage of abnormal mitochondria and mitochondrial content were significantly increased in ptenαm/m mouse hearts (). At higher magnification, we found that the cristae in these abnormal mitochondria were disorganized and partially lost (Figure S1B, representative mitochondrion is outlined in white; black arrow indicates breakage of cristae). Mitochondrial content was also assessed with mitochondrial DNA copy number, and surprisingly we found mitochondrial DNA content in ptenαm/m mice was significantly increased (). Increased mitochondrial content may result either from increased mitochondrial biogenesis or impaired clearance. However, mRNA levels of several mitochondrial biogenesis-related genes, including Tfam, Nrf1, and Ppargc1a showed no significant changes in the ptenαm/m heart (Figure S1C), suggesting that increased mitochondrial content was not due to activated mitochondrial biogenesis.
These results strongly suggest that PTENα deletion results in abnormalities in mitochondrial structure and function, which is likely due to impairment in mitochondrial clearance.
Impaired CCCP-induced mitophagy in the ptenαm/m mouse heart
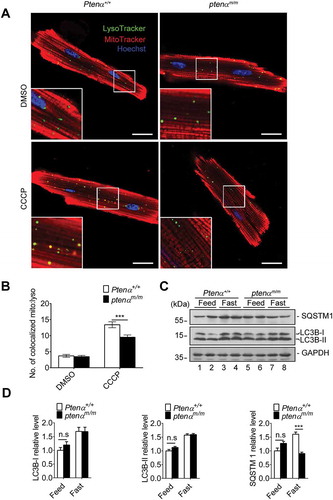
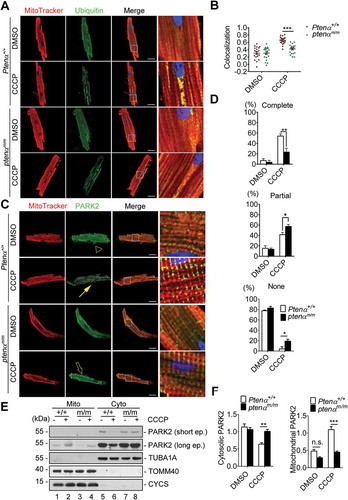
To determine the cause of impairment of mitochondrial clearance in ptenαm/m hearts, we evaluated selective mitochondrial macroautophagy/autophagy (i.e., mitophagy) in isolated cardiomyocytes treated with DMSO or the mitochondrial uncoupler carbonyl cyanide m-chlorophenylhydrazone (CCCP). MitoTracker Red and LysoTracker Green immunofluorescence showed decreased numbers of puncta representing colocalization of mitochondria and lysosomes in ptenαm/m cardiomyocytes (). Identical immunofluorescence results were obtained under treatment with oligomycin combined with antimycin A (O-A) (Figure S2A and B). These results indicate mitochondrial degradation by lysosomes was impaired following PTENα ablation. Autophagy was also evaluated by analysis of SQSTM1 and LC3B protein levels in cardiac lysates from mice following a 48-h fast or I-R. LC3B-II protein levels showed equal increases in fasted heart of Ptenα+/+ and ptenαm/m mice (). However, ptenαm/m mice showed decreased levels of LC3B-II following I-R stimulation (Figure S2C-D). These results indicate autophagy is compromised in PTENα-deficient hearts during I-R-induced injury.
Figure 4. Evaluation of mitophagy and autophagy in mouse hearts. (a) Representative confocal images of isolated cardiomyocytes from 4-months-old mice, labeled with MitoTracker Red and LysoTracker Green following treatment with DMSO or 1 μM CCCP. Magnification: 100x; scale bars: 20 μm. (b) Numbers of colocalized lysosome and mitochondria per cell. Cells (20) from 3 mice from each group were analyzed. Data are presented as mean ± SEM; ***p < 0.001 comparing Ptenα+/+, ptenαm/m groups, analyzed by two-way ANOVA followed by Bonferroni’s multiple comparisons test. (c-d) Evaluation of general autophagy by immunoblotting SQSTM1 and LC3B in heart tissues from 4-months-old mice that were fed normally or fasted for 48 h. Left ventricles were dissected and the homogenates were immunoblotted with SQSTM1 and LC3B antibodies. Relative expression of LC3B-I, LC3B-II, and SQSTM1 was quantified with ImageJ (n = 3). n.s., not significant, p > 0.05; ***p < 0.001 comparing Ptenα+/+, ptenαm/m groups, analyzed with two-way ANOVA followed by Bonferroni’s multiple comparisons test.
In mammalian cells there are 2 types of mitophagy, which are distinguished according to dependence on mitochondrial ubiquitination. PRKN-mediated mitophagy depends on mitochondrial ubiquitination to recruit autophagy receptors, whereas BNIP3L/NIX (BCL2 interacting protein 3 like), BNIP3 (BCL2 interacting protein 3) or FUNDC1 (FUN14 domain containing 1) bind LC3 directly to mediate mitophagy. We thus sought to determine which type of mitophagy is impaired in ptenαm/m mice. Fluorescence analysis of isolated Ptenα+/+ and ptenαm/m cardiomyocytes showed that CCCP-induced ubiquitination of mitochondrial proteins () was attenuated in ptenαm/m cardiomyocytes, indicating PARK2-ubiquitin dependent mitophagy was impaired. PARK2 translocation was evaluated with fluorescence analysis and subcellular fractionation. Both experiments showed PARK2 translocation onto depolarized mitochondria was compromised after PTENα ablation ( and S3A).
Figure 5. Mitophagy is impaired in PTENα-deficient cardiomyocytes. (a) Representative confocal images of isolated cardiomyocytes from 4-months-old mice, labeled with MitoTracker Red and a ubiquitin antibody following treatment with DMSO or 1 μM CCCP. Magnification: 100x; scale bars: 20 μm. (b) Colocalization analysis of mitochondria and ubiquitin by Spearman’s rank correlation coefficient with Image software; n = 20 cells from 3 mice from each group were analyzed. Data are presented as mean ± SEM; ***p < 0.001 comparing Ptenα+/+, ptenαm/m groups, analyzed with two-way ANOVA followed by Bonferroni’s multiple comparison test. ANOVA F1, 76 = 13.5. (c) Representative confocal images of isolated cardiomyocytes from 4-months-old mice, labeled with MitoTracker Red and a PARK2 antibody following treatment with DMSO or 1 μM CCCP. Complete colocalization (arrow), partial colocalization (hollow arrow), and no colocalization (arrowhead) are shown. Magnification: 100x; scale bars: 20 μm. (d) Summary of PARK2 translocation in DMSO- or CCCP-treated Ptenα+/+ or ptenαm/m cardiomyocytes. 15 cells were used for percentage calculation for each condition according to the criteria in (A). Statistics were obtained from 3 independent experiments. Data are presented as mean ± SEM; *p < 0.05, **p < 0.01 comparing Ptenα+/+, ptenαm/m groups, analyzed by two-way ANOVA followed by Bonferroni’s multiple comparisons test. ANOVA F1, 8 = 9.481 in ‘Complete’; F1, 8 = 3.193 in ‘Partial’; F1, 8 = 11.86 in ‘None’. (e-f) Immunoblot analysis of PARK2 in mitochondrial and cytosolic fractions of isolated cardiomyocytes treated with DMSO or 1 μM CCCP from 3- or 4-months-old mice. Cyto, cytosolic fraction; Mito, mitochondrial fraction. TUBA1A is a cytosolic marker; TOMM40 and CYCS are mitochondrial markers. Mitochondrial and cytosolic PARK2 were quantified with ImageJ (n = 3). n.s., not significant, p > 0.05; **p < 0.01; ***p < 0.001 comparing Ptenα+/+, ptenαm/m groups, analyzed by two-way ANOVA followed by Bonferroni’s multiple comparisons test.
We also attempted to identify phagophore-engulfed mitochondria with transmission electron microscopy using CCCP-perfused hearts. However, CCCP perfusion induced marked cardiac damage and rendered it difficult to identify autophagosomes in cardiomyocytes (Figure S3B). This is understandable, as mitophagy is a transiently dynamic process, and autophagosomes are rapidly degraded by lysosomes [Citation28], which increases the difficulty of identifying autophagosomes.
Identification of the E3 ubiquitin ligase PRKN as a PTENα-associated protein
To further explore the mechanism of PTENα regulation of mitophagy, affinity isolation combined with mass spectrometry was used to identify PTENα-associated proteins. S•Tag PTENα or PTEN purified from HEK293T cells was incubated with mouse cardiac homogenate, followed by mass spectrometry analysis of associated proteins. It was a surprise to find the E3 ubiquitin ligase PRKN was on the list of interactors with PTENα, but PTEN potential interacting proteins were not (). We then performed co-immunoprecipitation assays to confirm this interaction in HEK293T cells co-transfected with plasmids encoding C-terminal FLAG-tagged PRKN (PRKN-FLAG) and C-terminal GFP-tagged PTENα (PTENα-GFP). PTENα showed weak interaction with PRKN under normal conditions. However, association of these 2 proteins was markedly enhanced upon CCCP treatment (, lane 4 vs. 2). Oligomycin and antimycin A (O-A; inhibitors of the mitochondrial respiratory chain) treatment also promoted interaction of PTENα and PRKN (Figure S4A), indicating this interaction occurs with mitochondrial dysfunction. Reciprocal immunoprecipitation with overexpressed FLAG-tagged PTENα (FLAG-PTENα) and immunoblotting for PRKN-GFP further validated this interaction (, lane 4 vs. 2).
Figure 6. PRKN/PARK2 is identified as a PTENα-associated protein upon mitochondrial depolarization. (a) Silver staining and MS analysis of PTENα-associated proteins. The empty vector (PSA), S•Tag PTENα and -PTEN were purified from HEK293T cells and incubated with mouse cardiac homogenate; associated proteins were identified by mass spectrometry. (b) Co-IP with HEK293T cells co-transfected with plasmids encoding PTENα-GFP and PRKN-FLAG. Cells were treated with 10 μM CCCP or DMSO for 1 h before harvest. Lysates immunoprecipitated with anti-FLAG were immunoblotted with anti-GFP or anti-FLAG. The asterisk indicates degradation of PTENα. (c) Co-IP in HEK293T cells co-transfected with plasmids encoding PRKN-GFP and FLAG-PTENα. Cells were treated with 10 μM CCCP or DMSO for 1 h before harvest. Lysates immunoprecipitated with anti-FLAG were immunoblotted with anti-GFP or anti-FLAG. (d) In vitro binding assay of PTENα-His with GST-PRKN. PTENα-His (1 µg) and 3 μg GST-PRKN were mixed in PBS containing 0.1% NP40, and PRKN was immunoprecipitated with a PRKN monoclonal antibody or mouse lgG and immunoblotted with anti-PTEN or anti-PRKN. PTENα-His was expressed and purified from insect cells, and GST-PRKN was expressed and purified from E. coli. The asterisk indicates degradation of PTENα. (e) Interaction of FLAG-PTENα and its truncations with PRKN-GFP in HEK293T cells with CCCP treatment. Cells were treated with 10 μM CCCP for 1 h before harvest. Lysates immunoprecipitated with anti-FLAG were immunoblotted with anti-GFP or anti-FLAG. IgH, heavy chain of IgG. (F) Interaction of PRKN-GFP and its truncations with HA-PTENα in HEK293T cells with CCCP treatment. Cells were treated with 10 μM CCCP for 1 h before harvest. Lysates immunoprecipitated with anti-GFP were immunoblotted with anti-HA or anti-GFP.
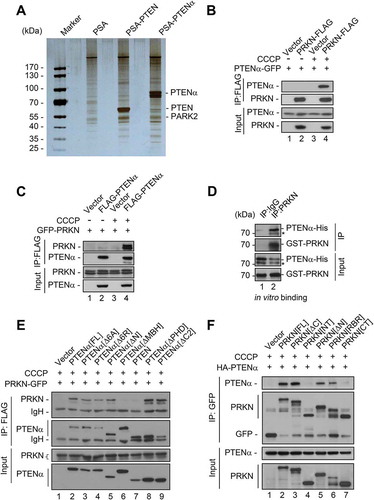
These findings raised a question as to whether endogenous PTENα and PRKN interact, and this was examined in mouse cardiac tissue. We found that endogenous PRKN was immunoprecipitated by PTENα under basal conditions, although the binding was relatively weak (Figure S4B). We next sought to determine whether PRKN interacts directly with PTENα. Purified GST-PRKN from E. coli and PTENα-His from insect cells were incubated in vitro, and PRKN was immunoprecipitated with a PRKN monoclonal antibody (GST-affinity isolation was not used because PTENα-His associates directly with GST agarose). PTENα was detected in PRKN-immunoprecipitated samples (), indicating PTENα and PRKN interact directly.
Human PTENα has an additional 173 amino acids at the N-terminus as compared with canonical PTEN [Citation8], but this N-terminal structure has not been completely characterized. It has been reported that the first 144 amino acids of PTENα are intrinsically disordered [Citation11,Citation29], whereas residues 145–176 may form an α-helix that has potential membrane binding ability, which is referred to as the membrane binding helix (MBH) region [Citation29]. In addition, the N-terminal extension contains a poly-alanine secretion signal and a poly-arginine re-entry sequence that respectively enable the protein to be secreted and enter neighboring cells [Citation9] (Figure S4C).
Based on previous studies, we constructed various PTENα truncations or mutants to narrow the search area for the region of PTENα and PRKN interaction (Figure S4D). These truncations were co-transfected with PRKN-GFP into HEK293T cells followed by CCCP treatment. Without CCCP treatment, only the truncation without the phosphatase domain (PTENα[∆PHD]) showed weak interaction with PRKN (Figure S4F, lane 8). However, when CCCP was added, all truncations except those lacking the MBH region (PTEN and PTENα[∆MBH]) showed interaction with PRKN (), indicating the MBH region of PTENα is indispensable for this interaction. We next sought to determine which specific region of PRKN is requisite for interaction with PTENα. A series of GFP-tagged truncated forms of PRKN were generated (Figure S4E) and plasmids encoding these forms of PRKN co-transfected with those encoding PTENα-GFP into HEK293T cells. When treated with DMSO, only PRKN without the RING2 domain (PRKN[∆C]) showed weak interaction with PTENα (Figure S4G, lane 3; lane 8 is a positive control). Upon CCCP treatment, all PRKN truncations except those without the RING1 domain (PRKN[NT] and PRKN[CT]) showed interaction with PTENα (), indicating that the RING1 domain of PRKN is essential for this interaction.
Mitochondrial and cytoplasmic fractions were used to determine the subcellular location in which the PTENα-PRKN interaction occurs. PRKN-FLAG and PTENα-GFP were co-transfected into HEK293T cells and treated with CCCP. Immunoprecipitation with FLAG antibody and immunoblotting with GFP revealed this interaction occurs mostly in the mitochondrial fraction (Figure S5A, lane 6 vs. 5 and 8). PTENα localizes in both mitochondria and the cytoplasm [Citation8], whereas PTEN has almost no mitochondrial localization. This raised a question as to which region in the N-terminus of PTENα is essential for its mitochondrial localization. To investigate this, a series of truncated forms of PTENα with C-terminal GFP-tag were transfected into HEK293T cells. Exogenous PTENα was detected in both the mitochondrial and the cytoplasmic fractions (Figure S6A, lane 1), but PTEN was found exclusively in the cytoplasm (Figure S6A, lane 6). PTENα without poly arginine (PTENα[∆6R]) or the MBH (PTENα[∆MBH]) region still showed prominent mitochondrial localization (Figure S6A, lane 3 and 4), whereas deletion of the poly-alanine region (PTENα[∆6A]) or residues 1–144 (PTENα[∆N]) resulted in a remarkable decrease in mitochondrial distribution (Figure S6A, lane 2 and 5). These results indicate that the poly-alanine secretion signal of PTENα is important for its mitochondrial localization.
Our data show that interaction of PTENα and PRKN is markedly enhanced under stress and this interaction occurs mainly in mitochondria. This raised a question as to whether PTENα mitochondrial localization increases during stress. Subcellular fractionation assays of cardiomyocytes were carried out to test for changes in PTENα localization after cardiac ischemia. Subsequent immunoblotting showed that mitochondrial PTENα was markedly increased following stress, and cytoplasmic PTENα was slightly decreased (Figure S6B). These data suggest PTENα is a stress-responding protein that translocates onto mitochondria to initiate a protective function during injury.
PTENα, PRKN and PINK1 form a complex
PINK1 is stabilized on the mitochondrial outer membrane by mitochondrial depolarization [Citation16,Citation17,Citation30], and we thus surmised that overexpression of PINK1 might have an effect similar to CCCP treatment on the PTENα-PRKN interaction. To test this, PINK1-HA was co-transfected with plasmids encoding PRKN-FLAG and PTENα-GFP into HEK293T cells. Interaction of PTENα and PRKN was indeed remarkably enhanced by PINK1 overexpression (, lane 4 vs. 2 and 3). To determine whether PTENα also interacts with PINK1, HEK293T cells were transfected with plasmids encoding PINK1-FLAG and GFP-tagged PTEN or PTENα, and immunoprecipitated with anti-FLAG antibody. PINK1 coimmunoprecipitated specifically with PTENα-GFP, but not with PTEN-GFP (). Reciprocal immunoprecipitation showed that both full-length and cleaved forms of PINK1 interacted with PTENα (). Two-step co-immunoprecipitation (co-IP) was next used to determine whether PTENα, PINK1, and PRKN form a complex. FLAG-PTENα, PINK1-S•Tag-HA and PRKN-GFP were transfected into HEK293T cells as indicated. Cell homogenates were immunoprecipitated with anti-FLAG M2 beads, and FLAG eluates were then immunoprecipitated with S•Tag beads (). As shown in , after first step co-IP with anti-FLAG M2 beads, PTENα was immunoprecipitated with both PRKN and PINK1 (lanes 5 and 6), and after S•Tag affinity isolation PRKN was detected in PTENα-PINK1 complexes (lane 12). We also tested endogenous interaction of PTENα, PINK1, and PRKN using ischemic heart lysates. After immunoprecipitation with anti-PTENα antibody raised in our laboratory, PINK1 and PRKN were immunoblotted individually using commercial antibodies. As shown in Figure S7A, PINK1 and PRKN were both found in the precipitated components, and cardiac ischemia greatly increased these interactions. These results raised the possibility that PTENα, PINK1, and PRKN form a complex upon mitochondrial depolarization, and facilitate mitophagy.
Figure 7. PTENα, PRKN and PINK1 form a complex. (a) PINK1 promotes interaction of PTENα and PRKN. Plasmids encoding PTENα-GFP, PRKN-FLAG and PINK1-HA were co-transfected into HEK293T cells. Cells were harvested 24 h after transfection. Cell homogenates were immunoprecipitated with FLAG antibody and immunoblotted with anti-FLAG and anti-GFP. (b) PINK1 interacts with PTENα but not PTEN. PINK1-FLAG and PTEN-GFP or PTENα-GFP were co-transfected into HEK293T cells. Cells were harvested 24 h after transfection. Cell homogenates were immunoprecipitated with anti-FLAG M2-conjugated beads and immunoblotted with anti-FLAG and anti-GFP. (c) PTENα interacts with PINK1. Plasmids encoding PINK1-FLAG, empty vector, S•Tag-HA-PTEN or -PTENα were co-transfected into HEK293T cells. Cells were treated with 5 μM MG132 for 14 h and harvested 24 h after transfection. Cell homogenates were immunoprecipitated with S protein agarose and immunoblotted with anti-FLAG and anti-HA antibodies. *PINK1 indicates cleaved PINK1. (d) Schematic diagram of two-steps Co-IP of PTENα, PRKN and PINK1. (e) Two-step Co-IP of PTENα, PRKN and PINK1. First co-IP: Plasmids encoding FLAG-PTENα, PINK1-S•Tag-HA and PRKN-GFP were transfected into HEK293T cells as indicated. Cells were harvested 24 h after transfection. Cell homogenates were immunoprecipitated with anti-FLAG M2-conjugated beads, and protein complexes were eluted from the anti-FLAG M2-conjugated beads and immunoblotted with anti-FLAG, anti-HA and anti-GFP. A part of the cell homogenates were retained as first input; Second affinity isolation: FLAG eluates from the first co-IP were immunoprecipitated with S protein agarose, and immunoblotted with anti-FLAG, anti-HA and anti-GFP. A part of the FLAG eluate was retained as the second input.
PTENα promotes PRKN mitochondrial translocation and PRKN-mediated mitophagy
To further evaluate the requirement of PTENα for mitophagy, we generated somatic PTENα knockout HeLa cells using CRISPR/Cas9 technology (Figure S7B, the targeted sequence is marked in red and the initiation codon is within the black box). Immunoblotting with PTEN antibody showed PTENα was eliminated without affecting the PTEN level (Figure S7C). Exogenous PRKN-GFP was stably expressed in HeLa PTENα+/+ and PTENα-/- cells, and PRKN mitochondrial translocation was evaluated by colocalization analysis of mitochondria (highlighted with MitoTracker Red) and PRKN (highlighted with GFP fluorescence). In DMSO-treated PTENα+/+ and PTENα-/- cells, PRKN-GFP was diffused evenly in the cytosol and did not overlap with MitoTracker signals. Upon CCCP treatment, PRKN was completely recruited to mitochondria in 80% of PTENα+/+ HeLa cells, whereas complete PRKN translocation in PTENα-/- cells dropped to 20%, with a 30% increase in cells showing no PRKN translocation (). PRKN translocation was also evaluated by subcellular fraction. As shown in Figure S8A, mitochondrial PRKN was decreased in PTENα-/- cells and was restored when PTENα was reintroduced. We next measured PRKN E3 activity reflected by degradation of mitochondrial proteins. CCCP or O-A-induced degradation of MFN2 (mitofusion 2) and COX4I1 (cytochrome c oxidase subunit 4I1) was delayed in PTENα-/- cells but was restored by re-introduction of exogenous PTENα into PTENα-/- cells ( and S8B).
Figure 8. PTENα promotes PRKN mitochondrial translocation and PRKN-mediated mitophagy. (a) CCCP induced PRKN translocation onto mitochondria in PTENα+/+ and PTENα-/- HeLa. Cells stably expressing PRKN-GFP were treated with 10 μM CCCP for 30 min. Colocalization of PRKN-GFP and mitochondria (MitoTracker Red) is indicated by yellow dots. Complete colocalization (arrow), partial colocalization (hollow arrow), and no colocalization (arrowhead) are indicated. Magnification: 100x; scale bars: 10 μm. (b) Summary of PRKN translocation in DMSO- or CCCP-treated PTENα+/+, PTENα-/- HeLa cells. Cells (20) from each condition were used for calculation of percentages according to the criteria in (A). Data were obtained from 3 independent experiments. Data are presented as mean ± SEM; ***p < 0.001 comparing PTENα+/+, PTENα-/- groups, analyzed by two-way ANOVA followed by Bonferroni’s multiple comparisons test. ANOVA F1, 8 = 36.38 in ‘Complete’; F1, 8 = 64.72 in ‘Partial’; F1, 8 = 156.9 in ‘None’. (c) COX4I1 degradation following O-A treatment. Plasmids encoding FLAG-PTENα and PRKN-GFP were co-transfected into PTENα+/+ or PTENα-/- HeLa cells. Cells were treated with 10 μM oligomycin and 4 μM antimycin A for 12 h and potential targets were evaluated by western blotting. Remaining COX4I1 protein levels were quantified with ImageJ (n = 3). **p < 0.01; ***p < 0.001 comparing PTENα+/+, PTENα-/- groups, analyzed with the paired Student’s t test. (d) O-A induced colocalization of GFP-LC3B with mitochondria. PTENα+/+ or PTENα-/- HeLa cells stably expressing PRKN-MYC were transfected with a plasmid encoding GFP-LC3B for 48 h, and treated with10 μM oligomycin and 4 μM antimycin A for 12 h. Magnification: 100x; scale bars: 20 μm. Colocalization analysis of mitochondria and GFP-LC3B with the Pearson correlation coefficient by ImageJ software. n = 17 cells from each group. Data are presented as mean ± SEM; ***p < 0.001 comparing PTENα+/+, PTENα-/- groups, analyzed by two-way ANOVA followed by Bonferroni’s multiple comparisons test. ANOVA F1, 64 = 18.9.
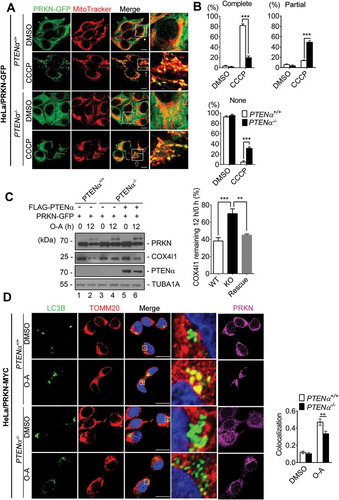
To assess mitochondrial engulfment by phagophores, GFP-LC3B was introduced into HeLa cells expressing PRKN-MYC or empty vector, and mitochondria were labeled with MitoTracker Red. We found HeLa cells expressing PRKN showed increased numbers of puncta representing overlap of GFP-LC3B with MitoTracker Red following CCCP treatment (Figure S8C), indicating PRKN-mediated mitophagy was successfully induced. GFP-LC3B was then introduced into PTENα+/+ and PTENα-/- HeLa cells that stably expressed PRKN-MYC, and mitochondria were labeled with MitoTracker Red. We found there were reduced numbers of puncta representing overlap of GFP-LC3B with MitoTracker Red following O-A treatment in PTENα knockout cells (), indicating PRKN-mediated mitophagy was reduced in PTENα knockout cells.
PTENα recruits PRKN onto mitochondria through promoting PRKN self-association
PRKN recruits itself onto mitochondria through self-association [Citation31,Citation32].We thus hypothesized PTENα promotes PRKN translocation through regulation of PRKN self-association. Co-immunoprecipitation assays were performed to investigate PRKN self-association. PRKN-FLAG and its truncations were co-transfected with PRKN-GFP into HEK293T cells followed by CCCP treatment. We found that PRKN interacts with itself through its C-terminus, consistent with what has been previously reported () [Citation32].
Figure 9. PTENα promotes PRKN self-association. (a) PRKN interacts with itself through its C-terminus. Plasmids encoding PRKN-FLAG and its truncations were co-transfected with a plasmid encoding PRKN-GFP into HEK293T cells. Cells were treated with 10 μM CCCP for 1 h before harvest. Lysates immunoprecipitated with FLAG M2 beads were immunoblotted with anti-GFP or anti-FLAG. (b) PTENα promotes self-association of PRKN. Plasmids encoding PRKN-GFP, PRKN-FLAG and PTENα-GFP were co-transfected into HEK293T cells as indicated. Cells were treated with 10 μM CCCP for 1 h before harvest. Cell homogenates were immunoprecipitated with anti-FLAG M2-conjugated beads and immunoblotted with anti-FLAG and anti-GFP. (c) Co-IP in PTENα+/+or PTENα-/- HeLa cells co-transfected with plasmids encoding PRKN-GFP and PRKN-FLAG. Cells were treated with 20 μM CCCP or DMSO for 2 h before harvest. Lysates immunoprecipitated with anti-FLAG M2-conjugated beads were immunoblotted with anti-GFP or anti-FLAG. (d) Self-association of PRKN in HEK293T cells co-transfected with plasmids encoding PTENα and its truncations. Cells were treated with 10 μM CCCP for 1 h before harvest. Cell homogenates were immunoprecipitated with anti-FLAG M2-conjugated beads and immunoblotted with anti-FLAG and anti-GFP. GAPDH was used as a loading control. PRKN self-association was quantified with ImageJ (n = 3). **p < 0.01; ***p < 0.001compared with the group that was transfected with empty vector, analyzed with the two-tailed paired Student’s t-test. (e) A graphical model for PTENα regulation of mitophagy through PRKN. Under stress, PTENα recruits PRKN onto depolarized mitochondria through protein interaction. PTENα amplifies the effect of this recruitment by promoting self-association of PRKN, leading to mitophagy.
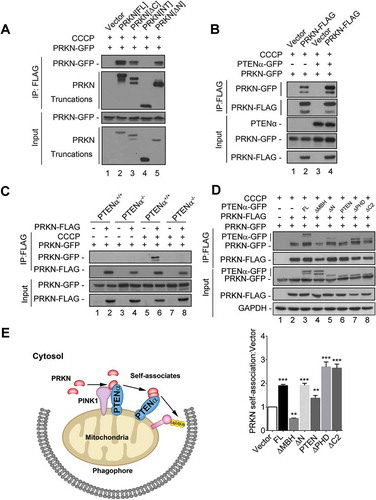
We then sought to determine whether PTENα influences PRKN self-association and found PRKN self-association was markedly enhanced in cells overexpressing PTENα (, lane 4 vs. lane 2). We also performed self-association assays with PTENα+/+ and PTENα-/- HeLa cells. PRKN self-associated upon CCCP treatment in PTENα+/+ HeLa cells, but not in PTENα-/- cells (, lane 9 vs. lane 6), indicating PTENα is required for PRKN self-association. These results demonstrate PTENα regulates PRKN mitochondrial translocation through promotion of PRKN self-association.
We then sought to determine which domain of PTENα is required for PRKN self-association. Plasmids encoding PTENα truncations were co-transfected with plasmids encoding PRKN-FLAG and PRKN-GFP into HEK293T cells as indicated. We found PTENα truncations that can bind PRKN promoted PRKN self-association (, lane 3, 5, 7, 8), but those truncations which cannot bind PRKN did not promote self-association (, lane 4), indicating that PTENα interaction with PRKN is required for PRKN self-association. Moreover, a truncation lacking the phosphatase domain (PTENα[∆PHD]) maintained ability to promote PRKN self-association (, lane 7). This indicated promotion of self-association is phosphatase activity independent.
PTENα and its truncations were next overexpressed to determine which of these molecules can rescue PRKN mitochondrial translocation in PTENα-/- HeLa cells. The percentage of cells with complete PRKN translocation was significantly increased in cells overexpressing PTENα and PTENα[∆PHD] but not in cells overexpressing PTENα[∆MBH] (Figure S9A). These results argue PTENα recruits PRKN onto mitochondria through its MBH domain, which promotes PRKN self-association. In this process PTENα most likely serves as a scaffold protein, but not a phosphatase.
We also attempted to reactivate mitochondrial autophagy in order to rescue the detrimental effects of PTENα-deficiency in cardiomyocytes under stress. It has been reported that nicotinamide/Nam (also known as niacinamide), may activate mitochondrial autophagy and protect cells against dying from stress [Citation33,Citation34]. Drinking water was therefore supplemented with Nam prior to conducting further experiments. After Nam feeding of ptenαm/m mice, the LC3B-I: LC3B-II ratio dropped significantly, and SQSTM1 was greatly increased, indicating successful activation of autophagy (Figure S9B). I-R injury and TTC staining experiments were subsequently repeated, and infarction size was measured in these mice as shown in Figure S9C. The results indicate that Nam has a beneficial effect on I-R injury-induced cell death in ptenαm/m mice. Although Nam protects mitochondria and cells through activating Sirt1-dependent autophagy [Citation34], Nam also protects mitochondria independent of mitophagy [Citation35], and both of these mechanisms may lead to the beneficial effects of Nam on ptenαm/m cardiomyocytes.
Discussion
Mitophagy eliminates damaged mitochondria through induction of lysosome-dependent degradation and is essential for mitochondrial quality control. In this study, we demonstrate that PTENα regulates PRKN-mediated mitophagy and show PTENα is necessary for the maintenance of mitochondrial integrity and protection of cardiomyocytes from injury.
PTEN phosphatase has been reported to promote autophagy through antagonizing the PI3K-AKT-MTOR pathway [Citation36]. Our results show that PTENα ablation does not alter AKT1 Ser473 phosphorylation status, which argues PTENα mitophagy regulation is AKT independent. We also show PTENα binds PRKN through its MBH region on the distinctive N-terminus of PTENα, which PTEN does not possess. PTEN does not associate with PRKN and it is thus very unlikely that it is involved in PRKN-mediated mitophagy. Moreover, the structure and subcellular location of PTENα distinguish it from canonical PTEN in regulation of mitochondrial mitophagy, and this regulation does not involve the classical PI3K-AKT-MTOR pathway. Phosphatase activity is not involved in promoting PRKN self-association, indicating PTENα regulates PRKN mitochondrial translocation in a phosphatase-independent manner.
PRKN is a cytosolic E3 ubiquitin ligase, and it must be transported to mitochondria to initiate mitophagy. Several proteins have been shown to promote PRKN mitochondrial translocation. The outer mitochondrial membrane protein MFN2 is phosphorylated by PINK1 after mitochondrial depolarization, and recruits PRKN to damaged mitochondria, acting as a PRKN receptor in mouse cardiomyocytes. However, MFN2 knockout does not completely abolish PRKN mitochondrial translocation [Citation37]. FBXO7 (F-box protein 7) and BECN1 (beclin 1) interact with PRKN and also drive PRKN translocation to mitochondria following CCCP treatment or PINK1 overexpression [Citation38,Citation39]. RNAi screening has shown that HSPA1L (heat shock protein family A [Hsp70] member 1 like) also facilitates transport of PRKN to mitochondria [Citation40]. However, these 3 proteins localize predominantly in the cytosol. Our results demonstrate PTENα regulation of PRKN consists of 2 related effects. Mitochondrial PTENα recruits PRKN onto depolarized mitochondria through protein interaction, and PTENα amplifies the effect of this recruitment by promoting PRKN self-association as illustrated in .
Previous conventional or conditional pten knockout mouse models primarily targeted exons 3 – 5 of Pten, which code for the entire phosphatase domain. However, this approach invariably interrupts expression of both PTEN and PTENα proteins. Heart-specific pten knockout mice display cardiac hypertrophy and impaired contractility in which activation of PI3K signaling is an apparent mechanism [Citation41,Citation42]. However, it is now clear that the phenotype of previous mouse models resulted from the combined loss of both PTEN and PTENα function.
Neither ptenαm/m nor park2-/- mice develop cardiac dysfunction spontaneously [Citation43], which may raise doubt as to the importance of mitophagy in vivo. However, this is likely due to the fact that mitophagy is controlled by multiple pathways. In fact, several PRKN-independent mitophagy pathways have been reported by different groups [Citation44–Citation47]. Inactivation of one mediator or one pathway does not necessarily bring about overall collapse of mitophagy or mitochondrial homeostasis. Nevertheless, compensatory effects are limited, and as animals age or undergo extreme stimulation such as isoprenaline or I-R injury in our experiments, symptoms of deficiency become apparent. Our Ptenα knockin mice showed no spontaneous cardiac dysfunction, but ablation of PTENα aggravated ISO-induced pathological hypertrophy. These findings are consistent with previous studies which showed Park2 knockout or cardiomyocyte-specific PARK2 ablation in adult mice have normal cardiac function under basal conditions [Citation43,Citation48], but cardiac injury in these animals was exacerbated under stress [Citation43]. Mitophagy regulated by PTENα and PRKN is therefore an important mechanism that protects mitochondria from stress-induced injury.
We have identified a novel PTENα function in cardiac protection and have shown that PRKN serves as an effector of PTENα function in mitochondrial quality control. PTENα interacts with PRKN, and recruits PRKN to mitochondria through direct binding to PRKN and promotion of its self-association. Disruption of this process by abolishing expression of PTENα destroys mitochondrial homeostasis and causes stress-induced cardiac dysfunction in mice. Our findings demonstrate that PTENα is a controller of mitochondrial quality, which regulates mitophagy through PRKN. This study contributes to understanding of the diverse functions of recently identified PTEN family members.
Materials and methods
Cell lines
HeLa and HEK293T cells were obtained from the American Type Culture Collection (ATCC). HEK293T (CRL-11268) cells were cultured in MEM (Corning, 10–010-CVR) supplemented with 10% fetal bovine serum (PAN Biotech, P30-3302), and HeLa (CCL-2) cells were cultured in DMEM (Corning, 10–013-CVR) in a 37°C incubator with 5% (v:v) CO2. The insect cell line Sf9 was obtained from Invitrogen (B82501) and cultured in Grace’s insect medium (Gibco, 12658027).
Antibodies and reagents
Immunoblotting was carried out using primary antibodies including: PTEN (Cell Signaling Technology, 9559); PTENα (established in our laboratory,αα-N); TOMM20 (Abclonal, A6774); PRKN (Cell Signaling Technology, 4211 and 2312); SQSTM1 (Abclonal, A7758); LC3B (Ruiyingbio, RLM3381); AKT1 (Cell Signaling Technology, 9272); p-AKT1 Ser473 (Cell Signaling Technology, 9271); TOMM40 (Santa Cruz Biotechnology, sc-11414); CYCS (Santa Cruz Biotechnology, sc-13156); MFN1 (Abclonal,A9880); MFN2 (Abclonal,A13606); TUBA1A (MBL, M175-3); ACTB (MBL, PM053); GAPDH (Sungene Biotech, KM9002); FLAG (Sigma-Aldrich, F3165); GFP (Ray Antibody Biotech, RM1008); HA (Sigma-Aldrich, H3663); His (Abcam, ab18184); GST (Abcam, ab19256); and GFP (Biodragon-immunotech, B1152). Primary antibodies used for immunofluorescence included anti-PRKN (Cell Signaling Technology, 2312); and anti-ubiquitin (Ruiyingbio, RLM3636). The reagents used were as follows: antimycin A (Abcam, ab141904), BSA (Sigma Aldrich, A-7030), CCCP (Sigma Aldrich, C2759), chloroquine (Sigma Aldrich, C6628), D-mannitol (Amresco, 0122), isoprenaline (Sigma Aldrich, I5627), 2,3-butanedione 2-monoxime (Sigma Aldrich, B0753), MG132 (Meilunbio, MB5137), nicotinamide (Sigma Aldrich, 72345), MitoTracker Green FM (Thermo Fisher Scientific, M7514), MitoTracker Deep Red FM (Thermo Fisher Scientific, M22426), LysoTracker Green DND-26 (Thermo Fisher Scientific, L7526), oligomycin A (Solarbio, O8150-5), heparin sodium solution (BioRoYee, R-10264), type 2 collagenase (Worthington Biochemical Corporation, LS004176), protease XIV (Sigma Aldrich, P5147), taurine (Amresco, 0599), tetramethylrhodamine, methyl ester, perchlorate (Thermo Fisher Scientific, T668), blebbistatin (Sigma Aldrich, B0560), and 2, 3, 5-triphenyltetrazolium chloride (Adamas-beta, 45959B).
Plasmids and cloning strategies
The plasmid pSA is designed and deposited in Addgene by our laboratory. The plasmids pEGFP-N1 (38131, deposited by Shawn Ferguson), pEGFP-C1 (22122, deposited by Henry Paulson), pGEX4T-1(10706, deposited by William Sellers), pFastBac-HTB (10938, deposited by William Sellers) were purchased from Addgene. RNU6-1/U6-sgRNA plasmid and pcDNA3.1-Cas9 were gifts from Dr. Jianzhong Xi in the College of Engineering, Peking University. PTEN, PTENα, PRKN, PINK1 or truncations and mutations of these molecules were inserted into these plasmids.
CRISPR-CAS9-mediated somatic Ptenα knockout
Guide RNAs were ligated into the U6-sgRNA plasmid. HeLa cells were seeded onto 24-well plates containing 500 μl DMEM medium at a density of 1 × 10⁶ cells per ml of cell suspension. U6-sgRNA plasmid (200 ng) and 200 ng of Cas9 plasmid in total were transfected into cells using polyethylenimine (Polysciences, 23966–2) according to the manufacturer’s instruction. Medium was replaced at 12 h post transfection. Cells were maintained for another 72 h to allow sufficient time for genome engineering mediated by the CRISPR-Cas9 system. Transfected cells were then treated with 500 μg/ml of G418 (Inalco, 1758–1811) for 3 days. After G418 selection, cell clones were selected and amplified for mutation sequencing.
Co-immunoprecipitation
HEK293T cells were lysed in co-immunoprecipitation lysis buffer containing 150 mM NaCl, 0.1 mM EDTA, 10% glycerol (Aladdin, G116203), 0.5% NP40 (Fluka, N74385) and a cocktail of protease inhibitors (Roche, 04693132001). Cell lysate (500 µg) was incubated with antibody for 4 h, followed by incubation with protein A/G agarose (Santa Cruz Biotechnology, sc-2003) for 1 h. The protein-bead complex mixture was washed in washing buffer containing 0.1% NP40 and subjected to western blot to evaluate protein interaction.
S•tag affinity isolation assay
HEK293T cells were transfected with pSA, pSA-PTEN, and pSA-PTENα plasmids and harvested 36 h after transfection. Cells were lysed with lysis buffer (50 mM Tris-HCl, pH 7.5, 150 mM NaCl, 2 mM EDTA, 1% NP40, 1 mM NaF). Equal amounts of protein were incubated with S-protein agarose (Novagen, 69704–3) for 2 h followed by washing 3 times with a buffer containing 0.1% NP40. S protein agarose was then incubated with mouse cardiac homogenate for 4 h followed by washing 4 times with a buffer containing 0.1% NP40. After boiling at 100°C in loading buffer, proteins were loaded onto NuPAGE 4%-12% gels (Invitrogen, NP0321BOX) and visualized with silver staining (Pierce Silver Stain Kit; Thermo Fisher Scientific, 24612) or were subjected to western blot. Potential interacting proteins in specific bands were evaluated with mass spectroscopy analysis.
In vitro binding
Purified PTENα-His (1 µg) was incubated with 3 μg GST-PRKN in PBS (137 mM NaCl, 2.7 mM KCl, 10 mM Na2HPO4, 2 mM KH2PO4) containing 0.1% NP40 supplemented with PMSF (BioDee, DE-0754), and PRKN mouse monoclonal antibody or mouse lgG (Santa Cruz Biotechnology, sc-2025) was added and incubated at 4°C for 4 h, then washed 3 times with PBS (with 0.1% NP40) followed by western blot analysis.
Immunofluorescence
Cells were cultured on glass slides at least 24 h prior to the experimental procedure. Transfected or isolated cells were treated with 10 µM (HeLa cells) or 1 µM (cardiomyocytes) CCCP for 30 min and were incubated with MitoTracker Red and rinsed twice with PBS. Cells were fixed in cold acetone for 15 min, followed by permeabilization and blocking in PBS buffer containing 1% BSA and 0.3% Triton X-100 (Sigma Aldrich, V900502) at room temperature for 1 h. Ubiquitin antibody (1:50) or PRKN antibody (Cell Signaling Technology, 2312; 1:50) was incubated overnight at 4°C. After mounting with anti-fade mounting reagent (Applygen, C1210-10), images were acquired with a Nikon A1 confocal microscope and analyzed with ImageJ software.
Mass spectrometry
After Coomassie Brilliant Blue staining of a gel, excised gel segments were subjected to in-gel trypsin digestion and dried. Peptides were dissolved in 10 μl 0.1% formic acid and auto-sampled directly onto a 100 μm × 10 cm fused silica emitter made in our laboratory packed with reversed-phase ReproSil-Pur C18-AQ resin (3 μm and 120 Å; Ammerbuch, Germany). Samples were then eluted for 50 min with linear gradients of 5–32% acetonitrile in 0.1% formic acid at a flow rate of 300 nl/min. Mass spectrometry data were acquired with an LTQ Orbitrap Elite mass spectrometer (Thermo Fisher Scientific) equipped with a nanoelectrospray ion source (Proxeon Biosystems). Fragmentation in the LTQ was performed by collision-induced dissociation (normalized collision energy, 35%; activation Q, 0.250; activation time, 10 ms) with a target value of 3,000 ions. The raw files were searched with the SEQUEST engine against a database from the UniProt protein sequence database.
Animal maintenance
Animal protocols used for these experiments adhered to standards of animal care and were approved by the Peking University Health Center animal unit. Male mice were used unless otherwise indicated. C57BL/6 Ptenα+/+ and ptenαm/m mice were created in our laboratory (principal investigator Dr. Yuxin Yin) as described below. Mice were maintained in a specific pathogen-free animal facility on a 12-hour light/12-hour dark cycle with free access to food and water, at an ambient temperature of 21 ± 2°C.
Generation of PTENα-deficient mice
To generate ptenαm/m mice, mouse embryonic stem (ES) cells were electroporated with a knockin-targeting construct designed to replace 347CTG and 362CTG of the Pten gene with GGA. Targeted G418-resistant clones were identified with PCR, and 2 independent positive clones were injected into C57BL/6 blastocysts to establish chimeras. The chimeras were bred with EIIa-Cre transgenic female mice to delete the LoxP-flanked neomycin resistance gene (neo) from the targeted allele. The resultant neo-deleted mosaic ptenαm/m mice were genotyped with PCR. Positive mosaic mice were crossed with C57BL/6 mice for 6 generations to obtain heterozygous mice suitable for these experiments. Expression of the mutant gene was confirmed by sequencing analysis of Pten cDNA. The offspring were PCR genotyped using the selected primer set:
Forward, 5ʹ-CTGATAACGTGGGAGTAGACGGATG-3ʹ;
Reverse, 5ʹ-TTCATTTAGAAGGCTGGATTGACGA-3ʹ.
Echocardiography
Two-dimensional echocardiography was carried out using a high-resolution imaging system (Vevo®2100) with a 30-MHz imaging transducer in unconscious mice anesthetized with isoflurane for the duration of the procedure. Two-dimensional echocardiographic images were captured and recorded with a digital format. Images were analyzed offline by a researcher blinded to the murine genotype. Left ventricular mass (LVM), left ventricular end-diastolic volume (LVEDV), left ventricular end-diastolic dimension (LVDd) and left ventricular end-systolic dimension (LVDs) were measured. The percentage of fractional muscle shortening, which quantifies contractility of the ventricular wall and serves as an indicator of cardiac function, was calculated as FS = ([LVDd – LVDs]/LVDd) × 100%.
Measurement of cellular respiration
Oxygen consumption rate measurement was performed with the Seahorse XF24 Extracellular Flux Analyzer and Seahorse XF Cell Mito Stress Test Kit (Agilent, 103015–100). Primary MEF cells were plated in XF24 cell culture plates at 4 × 10⁴ cells/well. Cells were equilibrated with Seahorse assay medium with no supplements and incubated in a 37°C non-CO2 incubator for 60 min immediately prior to XF assay. Oligomycin A (1 μM), carbonyl cyanide-p-trifluoromethoxyphenylhydrazone (FCCP, 1 μM), and antimycin A-rotenone (0.5 μM) compounds were components of Seahorse XF Cell Mito Stress Test Kit (Agilent, 103015–100) and prepared in assay medium identical to that in corresponding wells, and were automatically injected from the agent ports into the wells at times as indicated.
Determination of infarction size
The area of infarction was determined by 2, 3, 5-triphenyltetrazolium chloride (TTC) staining in I-R hearts. After I-R treatment, the heart was harvested and rinsed with saline. The tissue was sliced from apex to base into 3 transverse sections of equal thickness and was stained with 1% w:v TTC (Adamas-beta, 45959B) dissolved in PBS at 37ºC for 30 min, followed by fixation in 4% formaldehyde overnight. The heart slices were photographed with a digital camera, and the areas of infarction (white) were analyzed with ImageJ software as a percentage of total area.
Cardiac mitochondria isolation
Mitochondria were isolated from mouse heart using an MSE buffer (220 mM mannitol [Amresco, 0122], 70 mM sucrose [Xilong Scientific, S3055], 2 mM EGTA, 5 mM MOPS, pH 7.4, 2 mM taurine [Amresco, 0599], 0.2% BSA). Briefly, 50 mg of tissue were homogenized with 1 ml MSE Buffer on ice for 30–50 passes and the homogenate was then centrifuged at 800 g for 10 min to remove the debris. The supernatant was further centrifuged at 12,000 g for 10 min, and the supernatant was the cytosolic fraction of the cardiac tissue. The pellets were retained as mitochondria extract. RIPA lysis buffer (100 µl; 50 mM Tris, pH 7.4, 150 mM NaCl, 1% NP40, 0.5% sodium deoxycholate [Sigma-Aldrich, D6750]) was used to lyse the mitochondria.
Isolation of adult mouse cardiac myocytes
Three- to 4-months-old mice were used for cardiac myocyte isolation. The animals were injected with heparin (100 U/ml, 0.2 ml) before sacrifice. Immediately after the animals died, the hearts were rapidly excised, cannulated and perfused through the aorta with AfCS perfusion buffer consisting of 113 mM NaCl, 4.7 mM KCl, 0.6 mM KH2PO4, 0.6 mM Na2HPO4, 1.2 mM MgSO4, 12 mM NaHCO3, 10 mM KHCO3, 10 mM HEPES, 30 mM taurine (Amresco, 0599), 1.5 mM glucose, 10 mM 2,3-butanedione 2-monoxime (BDM; Sigma Aldrich, B0753), for 5 min at a speed of 3 ml/min. Perfusion was then switched to digestion buffer (including 0.65 mg/ml type 2 collagenase and 12 µM CaCl2 in AfCS perfusion buffer) and perfused for 10–15 min. Ventricles were cut and teased into pieces in stop 1 buffer (0.65 mg/ml type 2 collagenase, 0.065 mg/ml protease XIV, 15 mg/ml BSA, 12 µM CaCl2 in AfCS perfusion buffer). After centrifugation (5 min at 500 g), cells were resuspended in stop 2 buffer (15 mg/ml BSA, 12 µM CaCl2 in AfCS perfusion buffer) and gradually adjusted to a final [Ca2+] of 1.8 mM.
Detection of mitophagy in isolated cardiomyocytes
Isolated cardiac myocytes were treated with DMSO or 1 µM CCCP at 37°C. For colocalization analysis of mitochondria and lysosomes, cells were incubated in stop 2 buffer containing 100 nM MitoTracker Red and 500 nM LysoTracker Green for 10 min. For colocalization of ubiquitin and lysosomes, cells were fixed in cold acetone for 15 min. After permeabilization and blocking in PBS containing 1% BSA and 0.3% Triton X-100 for 1 h, cells were incubated with PBS containing ubiquitin antibody (1:50) overnight at 4°C, followed by incubation in stop 2 buffer containing 100 nM MitoTracker Red. Images were captured at 100 x magnification with a Nikon A1 confocal microscope. Colocalization analysis was determined with ImageJ software. At least 25–30 cells from 3 mice in each group were evaluated.
Transmission electron microscopy
Cardiac muscle from 2- to 6-months-old mice was isolated, fixed with 2.5% glutaraldehyde in 0.1 M Sorenson’s buffer (pH 7.2; Bioreyee, D-F1090), and treated with 1% OsO4 in Sorenson’s buffer for 1 h. After dehydration and embedding, thin sections (6 nm) were cut with an ultra-microtome, stained with uranyl acetate and lead citrate, and examined with an electron microscope (JEM-1400). Pictures were captured with a digital camera and recorded with a TIFF Image Capture Engine.
Determination of mitochondrial ∆ψm
After injection with heparin (100 U/ml, 0.2 ml), mice were sacrificed, and the hearts were rapidly excised, cannulated and perfused with Tyrode’s solution containing 137 mM NaCl, 2.8 mM KCl, 1.05 mM MgSO4, 0.42 mM NaH2PO4, 11.9 mM NaHCO3, 1.8 mM CaCl2, 5.5 mM glucose, and were equilibrated with 95% O2 and 5% CO2. After 10 min, the hearts were perfused with Tyrode’s solution containing 50 nM tetramethylrhodamine methyl ester and 50 nM blebbistatin for 30 min. For I-R stress, the hearts were subjected to 30 min of ischemia followed by 30 min of reperfusion. Confocal images were taken at 20x magnification from multiple randomly selected regions at a depth of ~ 30 µm in the epimyocardium of the left ventricle before and after I-R with a Nikon A1 confocal microscope.
ATP measurement in tissue
The EnzyLightTM ATP Assay Kit (Bioassay, EATP-100) was used to determine intracellular or tissue ATP levels according to the manufacturer’s protocol. Homogenate (10 µl) from the left ventricle was suspended in 90 μl of reconstituted reagent, and luminescence was recorded immediately with the Flex Station 3 (Molecular Devices).
Real-time PCR
Total RNA was extracted using TRIzol (Invitrogen, 10296010). Reverse transcription and real-time amplification was performed using SYBR Green Supermix (TransGen Biotech, AQ131-01). Primers used for PCR amplification are listed in Table S2. Analysis was performed using the 7500 Real-Time PCR system (Applied Biosystems).
Mitochondrial and cytosol isolation
A commercial mitochondria-cytosol fractionation kit (Applygen, C1260) was used for extraction of mitochondrial and cytoplasmic fractions. Briefly, 2 × 10⁷ cells were homogenized with 1 ml Mito-Cyto Isolation Buffer on ice for 30–40 passes and the homogenate was then centrifuged twice at 800 g for 5 min to remove the sediments. The supernatant was further centrifuged at 12,000 g for 10 min; the pellet was the mitochondrial fraction and the supernatant was the cytosol fraction.
Statistical analysis
Paired and unpaired data were evaluated with the Student’s t-test. Grouped data were evaluated by two-way analysis of variance (ANOVA). P values of less than 0.05 were considered to be statistically significant. All data are presented as mean ± SEM, except where otherwise specifically noted.
Supplemental Material
Download Zip (17.4 MB)Acknowledgments
We thank Dr. Z. Zhang’s laboratory for sharing human PRKN cDNA. We thank Dr. X. Zhao for mass spectrum technical assistance.
Disclosure statement
The authors declare that they have no conflicts of interest regarding publication of this study.
Supplemental material
Supplemental data for this article can be accessed here.
Additional information
Funding
Related Research Data
References
- Suzuki A, De La Pompa JL, Stambolic V, et al. High cancer susceptibility and embryonic lethality associated with mutation of the PTEN tumor suppressor gene in mice. Curr Biol. 1998 Oct 22;8(21):1169–1178. PubMed PMID: 9799734.
- Maehama T, Dixon JE. The tumor suppressor, PTEN/MMAC1, dephosphorylates the lipid second messenger, phosphatidylinositol 3,4,5-trisphosphate. J Biol Chem. 1998 May 29;273(22):13375–13378. PubMed PMID: 9593664.
- Di Cristofano A1PB, Cordon-Cardo C, Pandolfi PP. Pten is essential for embryonic development and tumour suppression. Nat Genet. 1998;19(4):348–355. PubMed Central PMCID: PMC9697695.
- Wang G, Li Y, Wang P, et al. PTEN regulates RPA1 and protects DNA replication forks. Cell Res. 2015;25(11):1189–1204.
- Feng J, Liang J, Li J, et al. PTEN controls the DNA replication process through MCM2 in response to replicative stress. Cell Rep. 2015 Nov 17;13(7):1295–1303. PubMed PMID: 26549452.
- Podsypanina K, Ellenson LH, Nemes A, et al. Mutation of Pten/Mmac1 in mice causes neoplasia in multiple organ systems. Proc Natl Acad Sci U S A. 1999 Feb 16;96(4):1563–1568. PubMed PMID: 9990064; PubMed Central PMCID: PMCPMC15517.
- Crackower MA, Oudit GY, Kozieradzki I, et al. Regulation of myocardial contractility and cell size by distinct PI3K-PTEN signaling pathways. Cell. 2002 Sep 20;110(6):737–749. .
- Liang H, He S, Yang J, et al. PTENalpha, a PTEN isoform translated through alternative initiation, regulates mitochondrial function and energy metabolism. Cell Metab. 2014 May 6;19(5):836–848. PubMed PMID: 24768297; PubMed Central PMCID: PMCPMC4097321.
- Hopkins BD, Fine B, Steinbach N, et al. A secreted PTEN phosphatase that enters cells to alter signaling and survival. Science. 2013 Jul 26;341(6144):399–402. PubMed PMID: 23744781; PubMed Central PMCID: PMCPMC3935617.
- Kubli DA, Quinsay MN, Gustafsson AB. Parkin deficiency results in accumulation of abnormal mitochondria in aging myocytes. Commun Integr Biol. 2013 Jul 1;6(4):e24511. . PubMed PMID: 23986804; PubMed Central PMCID: PMC3737749.
- Malaney P, Uversky VN, Dave V. The PTEN Long N-tail is intrinsically disordered: increased viability for PTEN therapy. Mol Biosyst. 2013 Nov;9(11):2877–2888. . PubMed PMID: 24056727.
- Van Der Bliek AM, Shen Q, Kawajiri S. Mechanisms of mitochondrial fission and fusion. Cold Spring Harb Perspect Biol. 2013 Jun;5(6). PubMed PMID: 23732471; PubMed Central PMCID: PMCPMC3660830. DOI:10.1101/cshperspect.a011072
- Scarpulla RC. Metabolic control of mitochondrial biogenesis through the PGC-1 family regulatory network. Biochim Biophys Acta. 2011 Jul;1813(7):1269–1278. . PubMed PMID: 20933024; PubMed Central PMCID: PMCPMC3035754.
- Shires SE, Gustafsson AB. Mitophagy and heart failure. J Mol Med. 2015 Mar;93(3):253–262. . PubMed PMID: 25609139; PubMed Central PMCID: PMCPMC4334711.
- Narendra D, Tanaka A, Suen DF, et al. Parkin is recruited selectively to impaired mitochondria and promotes their autophagy. J Cell Biol. 2008 Dec 1;183(5):795–803. PubMed PMID: 19029340; PubMed Central PMCID: PMC2592826.
- Narendra DP, Jin SM, Tanaka A, et al. PINK1 is selectively stabilized on impaired mitochondria to activate Parkin. PLoS Biol. 2010 Jan;8(1):e1000298. PubMed PMID: 20126261; PubMed Central PMCID: PMC2811155.
- Matsuda N, Sato S, Shiba K, et al. PINK1 stabilized by mitochondrial depolarization recruits Parkin to damaged mitochondria and activates latent Parkin for mitophagy. J Cell Biol. 2010 Apr 19;189(2):211–221. PubMed PMID: 20404107; PubMed Central PMCID: PMC2856912.
- Koyano F, Okatsu K, Kosako H, et al. Ubiquitin is phosphorylated by PINK1 to activate parkin. Nature. 2014 Jun 5;510(7503):162–166. PubMed PMID: 24784582.
- Kazlauskaite A, Kondapalli C, Gourlay R, et al. Parkin is activated by PINK1-dependent phosphorylation of ubiquitin at Ser65. Biochem J. 2014 May 15;460(1):127–139. PubMed PMID: 24660806; PubMed Central PMCID: PMC4000136.
- Kane LA, Lazarou M, Fogel AI, et al. PINK1 phosphorylates ubiquitin to activate Parkin E3 ubiquitin ligase activity. J Cell Biol. 2014 Apr 28;205(2):143–153. PubMed PMID: 24751536; PubMed Central PMCID: PMC4003245.
- Shiba-Fukushima K, Imai Y, Yoshida S, et al. PINK1-mediated phosphorylation of the Parkin ubiquitin-like domain primes mitochondrial translocation of Parkin and regulates mitophagy. Sci Rep. 2012;2:1002. PubMed PMID: 23256036; PubMed Central PMCID: PMC3525937.
- Kondapalli C, Kazlauskaite A, Zhang N, et al. PINK1 is activated by mitochondrial membrane potential depolarization and stimulates Parkin E3 ligase activity by phosphorylating Serine 65. Open Biol. 2012 May;2(5):120080. PubMed PMID: 22724072; PubMed Central PMCID: PMC3376738.
- Ding WX, Yin XM. Mitophagy: mechanisms, pathophysiological roles, and analysis. Biol Chem. 2012 Jul;393(7):547–564. . PubMed PMID: 22944659; PubMed Central PMCID: PMC3630798.
- Youle RJ, Narendra DP. Mechanisms of mitophagy. Nat Rev Mol Cell Biol. 2011 Jan;12(1):9–14. . PubMed PMID: 21179058.
- Vincow ES, Merrihew G, Thomas RE, et al. The PINK1-Parkin pathway promotes both mitophagy and selective respiratory chain turnover in vivo. Proc Natl Acad Sci U S A. 2013 Apr 16;110(16):6400-5. doi: 10.1073/pnas.1221132110. PubMed PMID: 23509287; PubMed Central PMCID: PMCPMC3631677.
- Wang P, Mei F, Hu J, et al. PTENalpha modulates CaMKII signaling and controls contextual fear memory and spatial learning. Cell Rep. 2017 Jun 20;19(12):2627–2641. PubMed PMID: 28636948.
- Galindo CL, Skinner MA, Errami M, et al. Transcriptional profile of isoproterenol-induced cardiomyopathy and comparison to exercise-induced cardiac hypertrophy and human cardiac failure. BMC Physiol. 2009;9:23. PubMed PMID: 20003209; PubMed Central PMCID: PMCPMC2799380.
- Klionsky DJ, Abdelmohsen K, Abe A, et al. Guidelines for the use and interpretation of assays for monitoring autophagy (3rd edition). Autophagy. 2016;12(1):1-222. doi: 10.1080/15548627.2015.1100356. PubMed PMID: 26799652; PubMed Central PMCID: PMCPMC4835977.
- Masson GR, Perisic O, Burke JE, et al. The intrinsically disordered tails of PTEN and PTEN-L have distinct roles in regulating substrate specificity and membrane activity. Biochem J. 2016 Jan 15;473(2):135–144. PubMed PMID: 26527737; PubMed Central PMCID: PMCPMC4700475.
- Vives-Bauza C, Zhou C, Huang Y, et al. PINK1-dependent recruitment of Parkin to mitochondria in mitophagy. Proc Natl Acad Sci U S A. 2010 Jan 5;107(1):378–383. PubMed PMID: 19966284; PubMed Central PMCID: PMC2806779.
- Okatsu K, Koyano F, Kimura M, et al. Phosphorylated ubiquitin chain is the genuine Parkin receptor. J Cell Biol. 2015 Apr 13;209(1):111–128. PubMed PMID: 25847540; PubMed Central PMCID: PMCPMC4395490. eng.
- Lazarou M, Narendra DP, Jin SM, et al. PINK1 drives Parkin self-association and HECT-like E3 activity upstream of mitochondrial binding. J Cell Biol. 2013 Jan 21;200(2):163–172. PubMed PMID: 23319602; PubMed Central PMCID: PMC3549971.
- Kang HT, Hwang ES. Nicotinamide enhances mitochondria quality through autophagy activation in human cells. Aging Cell. 2009 Aug;8(4):426–438. . PubMed PMID: 19473119.
- Shen C, Dou X, Ma Y, et al. Nicotinamide protects hepatocytes against palmitate-induced lipotoxicity via SIRT1-dependent autophagy induction. Nutr Res. 2017 Apr;40:40–47. PubMed PMID: 28473059; PubMed Central PMCID: PMCPMC5444203.
- Song SB, Jang SY, Kang HT, et al. Modulation of mitochondrial membrane potential and ROS generation by nicotinamide in a manner independent of SIRT1 and mitophagy. Mol Cells. 2017 Jul 31;40(7):503–514. PubMed PMID: 28736426; PubMed Central PMCID: PMCPMC5547220.
- Arico S, Petiot A, Bauvy C, et al. The tumor suppressor PTEN positively regulates macroautophagy by inhibiting the phosphatidylinositol 3-kinase/protein kinase B pathway. J Biol Chem. 2001 Sep 21;276(38):35243–35246. PubMed PMID: 11477064.
- Chen Y, Dorn GW 2nd. PINK1-phosphorylated mitofusin 2 is a Parkin receptor for culling damaged mitochondria. Science. 2013 Apr 26;340(6131):471–475. . PubMed PMID: 23620051; PubMed Central PMCID: PMC3774525.
- Choubey V, Cagalinec M, Liiv J, et al. BECN1 is involved in the initiation of mitophagy: it facilitates PARK2 translocation to mitochondria. Autophagy. 2014 Jun;10(6):1105–1119. PubMed PMID: 24879156; PubMed Central PMCID: PMC4091171.
- Burchell VS, Nelson DE, Sanchez-Martinez A, et al. The Parkinson’s disease-linked proteins Fbxo7 and Parkin interact to mediate mitophagy. Nat Neurosci. 2013 Sep;16(9):1257–1265. PubMed PMID: 23933751; PubMed Central PMCID: PMC3827746.
- Hasson SA, Kane LA, Yamano K, et al. High-content genome-wide RNAi screens identify regulators of parkin upstream of mitophagy. Nature. 2013 Dec 12;504(7479):291–295. PubMed PMID: 24270810.
- Ruan H, Li J, Ren S, et al. Inducible and cardiac specific PTEN inactivation protects ischemia/reperfusion injury. J Mol Cell Cardiol. 2009 Feb;46(2):193–200. PubMed PMID: 19038262.
- Oudit GY, Kassiri Z, Zhou J, et al. Loss of PTEN attenuates the development of pathological hypertrophy and heart failure in response to biomechanical stress. Cardiovasc Res. 2008 Jun 1;78(3):505–514. PubMed PMID: 18281373.
- Kubli DA, Zhang X, Lee Y, et al. Parkin protein deficiency exacerbates cardiac injury and reduces survival following myocardial infarction. J Biol Chem. 2013 Jan 11;288(2):915–926. PubMed PMID: 23152496; PubMed Central PMCID: PMC3543040.
- Wei Y, Chiang WC, Sumpter R Jr., et al. Prohibitin 2 is an inner mitochondrial membrane mitophagy receptor. Cell. 2017 Jan 12;168(1–2):224–238.e10. PubMed PMID: 28017329; PubMed Central PMCID: PMCPMC5235968. eng.
- Chen Z, Liu L, Cheng Q, et al. Mitochondrial E3 ligase MARCH5 regulates FUNDC1 to fine-tune hypoxic mitophagy. EMBO Rep. 2017 Jan 19. PubMed PMID: 28104734; eng. DOI:10.15252/embr.201643309.
- Kageyama Y, Hoshijima M, Seo K, et al. Parkin-independent mitophagy requires Drp1 and maintains the integrity of mammalian heart and brain. EMBO J. 2014 Dec 1;33(23):2798–2813. PubMed PMID: 25349190; PubMed Central PMCID: PMCPMC4282557. eng.
- Allen GF, Toth R, James J, et al. Loss of iron triggers PINK1/Parkin-independent mitophagy. EMBO Rep. 2013 Dec;14(12):1127–1135. PubMed PMID: 24176932; PubMed Central PMCID: PMCPMC3981094. eng.
- Song M, Gong G, Burelle Y, et al. Interdependence of parkin-mediated mitophagy and mitochondrial fission in adult mouse hearts. Circ Res. 2015 Jul 31;117(4):346–351. PubMed PMID: 26038571; PubMed Central PMCID: PMCPMC4522211. eng.