
ABSTRACT
Targeting macroautophagy/autophagy is a novel strategy in cancer immunotherapy. In the present study, we showed that the natural product rocaglamide (RocA) enhanced natural killer (NK) cell-mediated lysis of non-small cell lung cancer (NSCLC) cells in vitro and tumor regression in vivo. Moreover, this effect was not related to the NK cell recognition of target cells or expressions of death receptors. Instead, RocA inhibited autophagy and restored the level of NK cell-derived GZMB (granzyme B) in NSCLC cells, therefore increasing their susceptibility to NK cell-mediated killing. In addition, we further identified that the target of RocA was ULK1 (unc-51 like autophagy activating kinase 1) that is required for autophagy initiation. Using firefly luciferase containing the 5´ untranslated region of ULK1, we found that RocA inhibited the protein translation of ULK1 in a sequence-specific manner. Taken together, RocA could block autophagic immune resistance to NK cell-mediated killing, and our data suggested that RocA was a promising therapeutic candidate in NK cell-based cancer immunotherapy.
Introduction
NK cells are the fundamental member of innate lymphoid cells and play a critical role in host immunosurveillance against viruses and malignant tumors [Citation1]. NK cells kill target cells mainly through 3 mechanisms [Citation2]. A major mechanism is to release lytic granules, such as PRF1 (perforin 1) and GZMB, which can induce either caspase-dependent or -independent apoptosis in target cells. Another mechanism is to induce death receptor-mediated cell death through the binding of FASLG (Fas ligand) and TNFSF10 (TNF superfamily member 10) expressed on NK cells to FAS (Fas cell surface death receptor) and TNFSF10 receptors on the surface of target cells. Third, NK cells may also induce target cell death by secreting IFNG (interferon gamma) and TNF (tumor necrosis factor). Manipulation of NK cells becomes a novel immunotherapeutic strategy in lung cancer that is the leading cause of cancer death worldwide [Citation3]. However, cancer cells may escape from NK cell-mediated killing [Citation4].
As an evolutionarily conserved catabolic process, autophagy is the major intracellular degradation system, by which cytoplasmic materials are delivered to and degraded in the lysosome [Citation5]. Autophagy can be induced by a variety of microenvironmental stresses, such as hypoxia, nutrient deprivation, endoplasmic reticulum stress, glucose/energy depletion, oxidative stress, expression of aggregate-prone proteins, chemotherapy and other diverse stresses [Citation6]. In normal cells, autophagy has been proposed to suppress malignant transformation. However, it is thought that autophagy can promote tumor progression and resistance to therapy once malignant transformation has occurred [Citation7]. Therefore, autophagy is a promising therapeutic candidate for cancer treatment, and many clinical trials are investigating the effects of autophagy inhibition in various cancers [Citation8].
Autophagy is closely related to immune evasion in established tumors. For example, autophagy affects tumor susceptibility to cytotoxic T-lymphocyte (CTL)-mediated cell lysis under hypoxia through the regulation of STAT3 (signal transducer and activator of transcription 3) phosphorylation, and autophagy blockage can restore CTL activity and promote tumor regression [Citation9,Citation10]. Moreover, autophagy can be activated by epithelial-mesenchymal transition (EMT), leading to cancer cell resistance to CTL-mediated lysis. However, autophagy inhibition through targeting BECN1 (beclin 1) can restore CTL-mediated tumor cell lysis without affecting the mesenchymal morphology and the expressions of EMT markers [Citation11,Citation12]. Additionally, autophagy can promote degradations of GZMB and synaptic GJA1/connexin 43 in tumor cells, resulting in decreased tumor cell susceptibility to NK-mediated lysis under hypoxia, and autophagy blockage can restore NK cell-mediated cell lysis [Citation13,Citation14]. Therefore, targeting autophagy has emerged as a novel immunotherapeutic strategy to block cancer cell immune escape [Citation15].
Rocaglamide (RocA), 1H-2,3,3a,8b-tetrahydrocyclopenta[b]benzofuran, was first identified from Aglaia elliptifolia, and it has anti-cancer activity through inhibiting translation initiation, activating the ATM (ATM serine/threonine kinase)/ATR (ATR serine/threonine kinase)-CHEK1 (checkpoint kinase 1)/CHEK2 (checkpoint kinase 2) cell cycle checkpoint pathway and triggering the MAPK14 (mitogen-activated protein kinase 14) and MAPK8 (mitogen-activated protein kinase 8) signaling pathways [Citation16]. In this study, we found that RocA derived from Aglaia odorata could enhance NK cell-mediated lysis of NSCLC cells through autophagy inhibition. This finding suggested that RocA could be potentially applied in NK cell-based immunotherapy for NSCLC treatment.
Results
RocA enhances NK cell-mediated killing of NSCLC cells in vitro and tumor regression in vivo
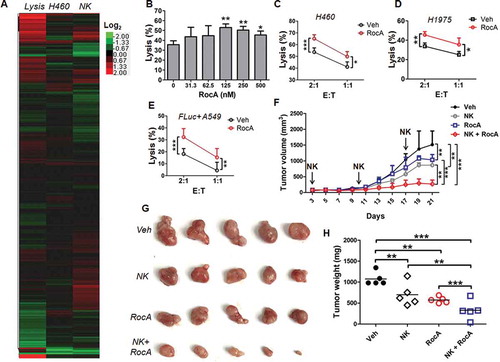
In the present study, we performed a high-throughput screening assay to find natural products that enhance NK cell-mediated cell killing, and 2,880 Chinese medicine-derived natural products were screened ()). After 3 rounds of screenings, we found that RocA could potentially enhance NK cell-mediated lysis of NSCLC cells. Cytotoxicity assay showed that RocA affected viabilities of H460, A549, H1975 and NK cells, but the IC50 of NSCLC cells was much lower than that of NK cells (Figure S1). We further confirmed the enhancement effect of RocA on NK cell-mediated killing in H460 (), H1975 ()) and A549 ()) cells at the indicated concentrations in vitro. The in vivo effect was then determined. Mice with H1975 cell subcutaneous xenograft tumors were treated with NK cells, RocA or both. RocA and NK cells alone significantly inhibited H1975 cell tumor growth, whereas the combination treatment exhibited a synergistic suppression ()). The tumors of mice treated with a combination of NK cells and RocA were much smaller ()) and lighter ()) compared with mice treated with NK cells, RocA or vehicle alone. Taken together, these results indicated that RocA could impair the viability of NSCLC cells and NK cells but had much less of an effect on NK cells, and it could significantly enhance NK cell-mediated cell killing in vitro and tumor regression in vivo.
Figure 1. RocA enhances NK cell-mediated killing of NSCLC cells in vitro and tumor regression in vivo. (A) A total of 2,880 natural products were screened as described in the Materials and Methods. The heat map represents effects of 2,880 natural products on NK cell-mediated lysis (the left column), H460 cell viability (the middle column), and NK cell viability (the right column), respectively. The average value for percent lysis (the left column) or percent viability (the middle and right column) were processed by log2 transformation. The colors in the heat map reflect a log2 scale. (B) H460 cells were co-incubated with expanded NK cells in the presence of RocA at different concentrations (0, 31.25, 62.5, 125, 250 and 500 nM) for 24 h, and NK cell-mediated lysis was assessed by a luminescent cell viability assay. Data were pooled from 3 donors. H460 (C) or H1975 (D) cells were co-incubated with expanded NK cells in the absence or presence of 250 nM of RocA for 24 h, and then NK cell-mediated lysis was evaluated by a luminescent cell viability assay. Data were pooled from 3 donors. (E) FLuc+ A549 cells were co-incubated with expanded NK cells in the absence or presence of 250 nM of RocA for 24 h, and then NK cell-mediated lysis was assessed by a biophotonic cytotoxicity assay. E:T corresponds to effector cells:target cells. Data were pooled from 3 donors. (F-H) A total of 3 × 10⁶ of H1975 cells per mouse were subcutaneously inoculated in the back of SCID-Bg mice on day 0, and then 1 × 10⁷ of expanded NK cells per mouse were administered by intravenous injection on days 3, 10 and 17, and 0.3 mg/kg of RocA was administered by i.p. injection every 2 days from day 3. Tumor size was measured every 2 days, mice were sacrificed on day 21, and tumors were excised, photographed and weighed. Data represent 3 independent experiments. *, p < 0.05; **, p < 0.01; ***, p < 0.001.
NK cell depletion reverses tumor regression by RocA
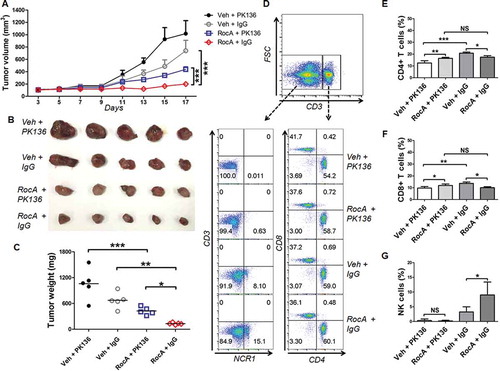
The above-mentioned results showed that RocA could enhance NK cell-mediated tumor regression in vivo in an immune-incompetent mouse model. To further confirm this finding, we determined the therapeutic efficacy of RocA by using an immune-competent syngeneic mouse model. C57BL/6 mice with Lewis lung cancer (LLC) cell subcutaneous xenograft tumors were treated with PK136 antibody (anti-NK1.1 for NK cell depletion), RocA or both. RocA significantly inhibited LLC cell tumor growth, whereas PK136 treatment clearly reduced this suppression ()). The tumors of mice treated with RocA and PK136 were much bigger ()) and heavier ()) compared with mice treated with RocA and control IgG. The NK cells were totally depleted by PK136. The CD4+ CD8+ T cells were also partially decreased by PK136, but there was no significant difference between RocA plus PK136- and RocA plus IgG-treated mice (). Taken together, these results clearly showed that RocA suppressed the tumor growth dependent, at least partially, on NK cells.
Figure 2. NK cell depletion reverses tumor regression by RocA. A total of 1.5 × 10⁶ of LLC cells per mouse were subcutaneously inoculated on the upper back in C57BL/6 mice on day 0, and then 100 μg of PK136 antibody or control IgG per mouse was administered via i.p. injection on day 0, 3, 7 10 and 13, and 1.0 mg/kg of RocA was administered via i.p. injection every 2 days from day 3. (A-C) Tumor size was measured every 2 days, mice were sacrificed on day 21, and tumors were excised, photographed and weighed. (D) Splenocytes were isolated and used to detect the populations of NK cells (CD3− NCR1/NKp46+) and T cells (CD3+ CD4+ and CD3+ CD8+); (E-G) the statistical analysis for CD4+, CD8+ T cells and NK cells. Data represent 3 independent experiments. *, p < 0.05; **, p < 0.01; ***, p < 0.001; NS, non-statistical significance.
RocA-enhanced NK cell-mediated cell killing is not related to NK cell-target cell recognition and expression of death receptors in NSCLC cells
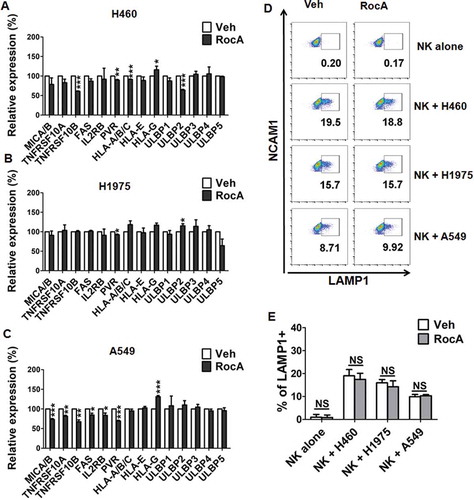
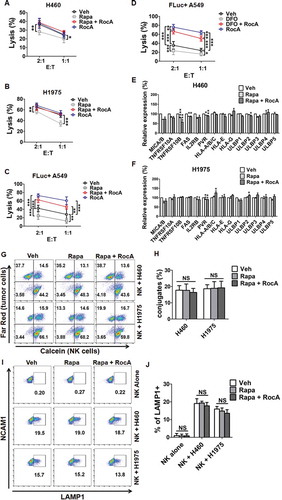
We next determined the mechanism of action, by which RocA enhanced NK cell-mediated cell killing. Surface expressions of activating and inhibitory ligands and death receptors in NSCLC cells as well as LAMP1 (lysosomal associated membrane protein 1) in NK cells were assessed due to their correlations with NK cell-target cell recognition. RocA did not increase surface expressions of activating ligands, such as MICA/B (MHC class I polypeptide-related sequence A/B), IL2RB/CD122, PVR/CD155, ULBP1 (UL16 binding protein 1) to ULBP5, and death receptors, TNFRSF10A (TNF receptor superfamily member 10a), TNFRSF10B (TNF receptor superfamily member 10b) and FAS, while it also did not decrease surface expressions of inhibitory ligands HLA (major histocompatibility complex, class I)-A/B/C, HLA-E and HLA-G in H460 ()), H1975 ()) and A549 ()) cells. Moreover, RocA did not increase the surface expression of LAMP1 in NK cells stimulated with H460, H1975 or A549 cells (). LAMP1 is a sensitive marker of NK cell degranulation following cancer cell stimulation [Citation17], and its expression reflects the degree of stimulation, which is determined by NK cell-target cell recognition. Therefore, the unchanged expression of LAMP1 suggested that RocA did not increase NK cell-target cell recognition. Taken together, these results revealed that the enhancement of NK cell-mediated cell killing by RocA might not be related to NK cell-target cell recognition and expression of death receptors in NSCLC cells.
Figure 3. RocA does not increase NK cell degranulation and expressions of death receptors in NSCLC cells. H460 (A), H1975 (B) or A549 (C) cells were treated with 250 nM RocA for 24 h, and then the expression of NK cell activating ligands (MICA/B, IL2RB/CD122, PVR/CD155, ULBP1 to ULBP5), inhibitory ligands (HLA-A/B/C, HLA-E and HLA-G) and death receptors (TNFRSF10A, TNFRSF10B and FAS) were assessed by flow cytometry. Data were pooled from 3 independent experiments. (D) H460, H1975 or A549 cells were treated with 250 nM RocA for 24 h, and then incubated with expanded NK cells for 4 h. LAMP1 expression on the NK cell surface was analyzed by flow cytometry. Data are a representation of 3 independent experiments. (E) Data were pooled from (D). *, p < 0.05; **, p < 0.01; ***, p < 0.001; NS, non-statistical significance.
RocA inhibits autophagy in NSCLC cells
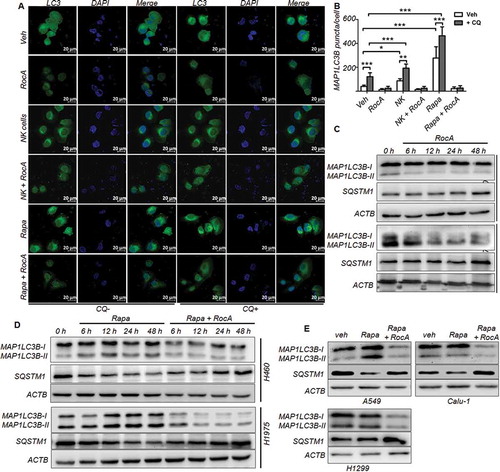
Cancer cells can resist NK cell-mediated killing through autophagy, we therefore investigated whether RocA could inhibit autophagy. The cells were stained with anti-MAP1LC3 (microtubule associated protein 1 light chain 3), a well-characterized marker for autophagosome formation. Confocal microscopy indicated that there was a redistribution of MAP1LC3 from diffuse cytoplasmic staining to discrete vesicular structures following the treatment with NK cells or rapamycin. Strikingly, this redistribution was clearly blocked by RocA in the absence or presence of chloroquine (CQ), a lysosomotropic autophagy inhibitor (). This finding was further confirmed in GFP-MAP1LC3+ HeLa cells under the above-mentioned conditions (NK cells, rapamycin or Earle’s balanced salt solution medium) (Figure S2). Western blotting analysis showed that the intracellular MAP1LC3-II isoform, which is specific for phagophores and autophagosomes, was reduced and the autophagy receptor and substrate SQSTM1 (sequestosome 1) was increased by RocA ()). The intracellular MAP1LC3 underwent a conversion from the MAP1LC3-I isoform to the MAP1LC3-II isoform, and the SQSTM1 was reduced in H460 and H1975 cells upon rapamycin treatment, whereas this conversion of MAP1LC3 and reduction of SQSTM1 were reversed by RocA ()). This finding was also observed in other NSCLC cells, such as A549, Calu-1 and H1299 cells ()). Taken together, these results clearly demonstrated that RocA could inhibit autophagy in NSCLC cells and acted prior to the effect of CQ, suggesting that RocA exerted its inhibitory action upstream of autolysosome formation in the autophagic flux.
Figure 4. RocA inhibits autophagy in NSCLC cells. (A) H460 cells were incubated with NK cells or 800 nM rapamycin in the absence or presence of 250 nM RocA or 50 μM CQ for 12 h. Cells were fixed and stained with anti-MAP1LC3B antibody and DAPI, then observed and photographed under laser confocal microscopy (63×). (B) The quantification of autophagosomes, *, p < 0.05; **, p < 0.01; ***, p < 0.001. (C) H460 or H1975 cells were incubated with RocA. At different time points (0, 6, 12, 24 and 48 h), cells were lysed and analyzed to detect MAP1LC3 and SQSTM1. (D) H460 or H1975 cells were incubated with rapamycin in the absence or presence of RocA. At different time points (0, 6, 12, 24 and 48 h), cells were lysed and analyzed to detect MAP1LC3 and SQSTM1. (E) A549, Calu-1 or H1299 cells were incubated with rapamycin in the absence or presence of 250 nM RocA for 24 h, and cells were then lysed and analyzed to detect MAP1LC3 and SQSTM1. Data are a representation of 3 independent experiments.
RocA reverses autophagic impairment of NSCLC cell susceptibility to NK cell-mediated killing
Because RocA could inhibit autophagy, we next determined whether RocA could reverse autophagic impairment of NSCLC cell susceptibility to NK cell-mediated killing. H460 and H1975 cells were treated with rapamycin, and then a calcein release assay was performed to evaluate NK cell-mediated killing of cancer cells. We found that rapamycin clearly impaired H460 and H1975 cell susceptibility to NK cell-mediated killing, whereas RocA significantly reversed this impairment (). A similar phenomenon was also observed in A549 cells stably expressing firefly luciferase (FLuc+ A549) cells upon rapamycin treatment ()) or deferoxamine (DFO)-induced chemical hypoxia ()) using a biophotonic cytotoxicity assay, which is a highly sensitive luciferase assay for assessing NK cell-mediated killing. In addition, DFO actually could mimic hypoxia through increasing HIF1A (hypoxia inducible factor 1 subunit alpha) protein expression and activating autophagy (Figure S3). Moreover, RocA did not increase expression of activating and death receptors or decrease the expression of inhibitory receptors on H460 and H1975 cell surfaces (). Furthermore, rapamycin pretreatment did not increase NK cell-target cell conjugates (,H)) and LAMP1 surface expression in NK cells stimulated with H460 or H1975 cells (,J)). These results demonstrated that RocA could reverse autophagic impairment of NSCLC cell susceptibility to NK cell-mediated killing, suggesting that RocA enhanced NK cell-mediated killing through autophagy inhibition.
Figure 5. RocA reverses autophagic impairment of NSCLC cell susceptibility to NK cell-mediated killing without affecting NK cell-target cell conjugates and NK cell degranulation. H460 or H1975 cells were treated with 800 nM rapamycin in the absence or presence of 250 nM RocA for 24 h. (A and B) Pretreated H460 or H1975 cells were incubated with NK cells for 4 h, and then NK cell-mediated lysis was assessed by a calcein release assay. Data are a representation of 3 independent experiments. (C and D) FLuc+ A549 cells were co-incubated with expanded NK cells in the absence or presence of 800 nM rapamycin or 100 μM DFO with or without 250 nM RocA for 24 h, and then NK cell-mediated lysis was assessed by a biophotonic cytotoxicity assay. Data were pooled from 3 donors. E:T corresponds to effector cells: target cells. (E and F) The expression of NK cell-activating ligands (MICA/B, IL2RB/CD122, PVR/CD155 and ULBP1 to ULBP5), inhibitory ligands (HLA-A/B/C, HLA-E and HLA-G) and death receptors (TNFRSF10A, TNFRSF10B and FAS) were assessed by flow cytometry. Data were pooled from 3 independent experiments. (G and H) Pretreated H460 or H1975 cells were stained with Far Red, and NK cells were stained with calcein-AM, and then they were co-incubated for 30 min. Population of Far Red+ calcein+ cells was analyzed by flow cytometry. (I and J) Pretreated H460 or H1975 cells were incubated with NK cells for 4 h, and then the LAMP1 expression on NK cell surface was detected. *, p < 0.05; **, p < 0.01; ***, p < 0.001; NS, non-statistical significance.
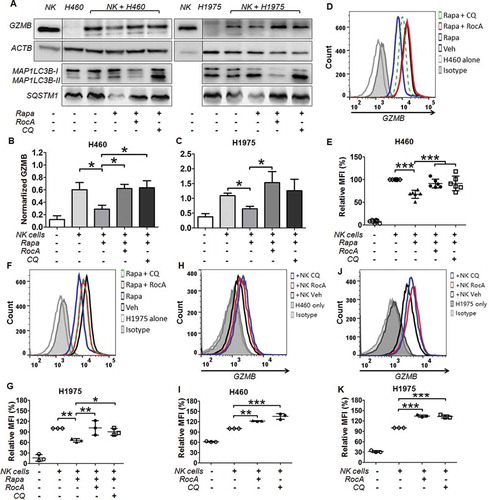
RocA restores the level of NK cell-derived GZMB in NSCLC cells
NK cell-derived GZMB in cancer cells is critical for autophagic resistance to NK cell-mediated killing. Therefore, we determined the level of GZMB in NSCLC cells. H460 or H1975 cells were co-cultured with NK cells and rapamycin in the absence or presence of RocA or CQ. NK cells were removed by using anti-NCAM1/CD56 magnetic microbeads to avoid the interference of GZMB in NK cells (Figure S4). The level of GZMB in H460 and H1975 cells was clearly reduced upon rapamycin treatment, whereas this reduction was significantly reversed by RocA or CQ (). Similar results were also observed by flow cytometry analysis (). We also detected the GZMB level in H460 and H1975 cells under NK cell treatment without rapamycin and found that RocA could elevate the level of GZMB in NSCLC cells (-K)). Taken together, these results clearly showed that RocA could restore/elevate the level of NK cell-derived GZMB in NSCLC cells, suggesting that RocA enhanced NK cell-mediated cell killing by restoring NK cell-derived GZMB in NSCLC cells.
Figure 6. RocA restores the level of NK cell-derived GZMB in NSCLC cells. H460 or H1975 cells were incubated with NK cells in the absence or presence of 800 nM rapamycin, 250 nM RocA or 50 μM CQ for 24 h. (A) NK cells were removed, and H460 and H1975 cells were lysed and analyzed to detect GZMB, MAP1LC3 and SQSTM1 by western blotting. (B and C) Data were pooled from (A). (D-G) GZMB level in H460 and H1975 cells was determined by flow cytometry. (H-K) H460 or H1975 cells were incubated with NK cells in the absence or presence of 250 nM RocA or 50 μM CQ for 12 h, and the GZMB level in H460 and H1975 cells was determined by flow cytometry.*, p < 0.05; **, p < 0.01; ***, p < 0.001.
RocA inhibits the expression of ULK1 at the protein level through sequence-specific translational repression
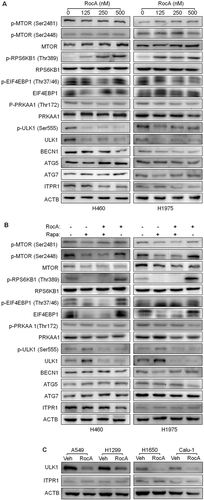
We next determined the underlying molecular mechanism of action by which RocA inhibited autophagy in NSCLC cells. The expressions of MTOR (mechanistic target of rapamycin kinase) and p-MTOR were detected, and there were no apparent changes (), row 1–3). We also detected the phosphorylation levels of well-known MTOR downstream targets RPS6KB1 (ribosomal protein S6 kinase B1) and EIF4EBP1 (eukaryotic translation initiation factor 4E binding protein 1). Unexpectedly, RocA clearly increased phosphorylation of RPS6KB1 and EIF4EBP1 (), row 4–7). We then determined the expression of PRKAA1, ULK1, BECN1, ATG5 (autophagy related 5) and ATG7 (autophagy related 7), and found that RocA clearly inhibited the expression of ULK1 and p-ULK1 (Ser555) in H460 and H1975 cells, whereas it barely altered the expression of PRKAA1, p-PRKAA1 (Thr172), BECN1, ATG5 and ATG7 (), row 8–14). ITPR1 (inositol 1,4,5-trisphosphate receptor type 1) is required for NK cell-induced autophagy [Citation18], however, we did not observe clear changes in the expression of ITPR1 at the protein level in response to RocA treatment (, row 15; )). Moreover, the RocA-triggered inhibitory effect on ULK1 expression was also confirmed in the presence of rapamycin ()) and in other NSCLC cells, such as A549, H1299, H1650 and Calu-1 cells ()). The above findings were further confirmed by a quantified analysis (Figure S5).
Figure 7. RocA inhibits ULK1 protein expression in NSCLC cells. (A) H460 or H1975 cells were treated with RocA at different concentrations (0, 125, 250 and 500 nM) for 24 h, then lysed and applied to detect p-MTOR (Ser2481 and Ser2448), MTOR, p-RPS6KB1 (Ser555), RPS6KB1, p-EIF4EBP1 (Thr37/46), EIF4EBP1, p-PRKAA1 (Thr172), PRKAA1, p-ULK1 (Ser555), ULK1, BECN1, ATG5, ATG7 and ITPR1. (B) H460 or H1975 cells were incubated with 800 nM rapamycin in the absence or presence of 250 nM RocA for 24 h, then lysed and analyzed to detect the above proteins. (C) A549, H1299, H1650 or Calu-1 cells were incubated with 250 nM RocA for 24 h, then lysed and analyzed to detect ULK1 and ITPR1. Data are a representation of 3 independent experiments.
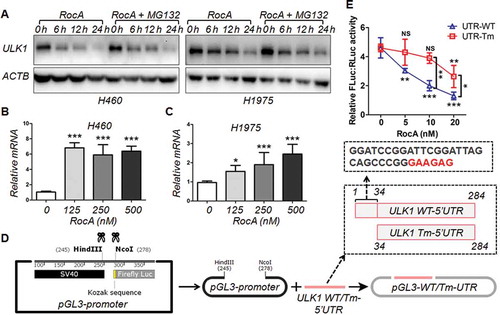
In addition, RocA also inhibited the expression of ULK1 at the protein level in the presence of MG132 ()), whereas its expression at the mRNA level was not inhibited (). RocA has been recently shown to inhibit translation initiation in a polypurine sequence-specific manner [Citation19]. We found that there was a polypurine motif (GAAGAG) in the sequence of 5´untranslated region (UTR) of ULK1. We next deleted the Kozak sequence before the initiation codon ATG of the firefly luciferase gene in the pGL3-promoter vector and then inserted the wild-type (WT) or truncated mutation (Tm) 5´ UTR of ULK1 into this region ()). Our data showed that RocA dose-dependently inhibited the expression of firefly luciferase in the cells transfected with pGL3-WT-UTR, whereas such an inhibitory effect was attenuated in the cells transfected with pGL3-Tm-UTR ()). In summary, these results demonstrated that RocA could inhibit the expression of ULK1 at the protein level through polypurine sequence-specific translational repression.
Figure 8. RocA inhibits ULK1 protein translation in NSCLC cells through sequence-specific translational repression. (A) H460 or H1975 cells were treated with 250 nM of RocA in the absence or presence of MG132 for different durations (6, 12 and 24 h) and then analyzed to detect ULK1 protein expression. Data are a representation of 3 independent experiments. H460 (B) or H1975 (C) cells were treated with RocA at different concentrations (0, 125, 250 and 500 nM) for 24 h, and then analyzed to detect ULK1 expression at the mRNA level. Data were pooled from 3 independent experiments. (D) Constructs of pGL3 containing WT or Tm (Tm) 5´ UTR of ULK1. (E) pGL3-WT-UTR and pGL3-Tm-UTR were transfected into 293T cells together with pGL4.74 control vector. After 24 h, the cells were treated with RocA at different concentrations (0, 125, 250 and 500 nM) for another 24 h and then analyzed to detect luciferase activity. Data are a representation of 3 independent experiments. *, p < 0.05; **, p < 0.01; ***, p < 0.001; NS, non-statistical significance.
Discussion
Targeting autophagy is a novel strategy to block immune escape in cancer immunotherapy. In this study, RocA was found to enhance NK cell-mediated cell killing in vitro and tumor regression in vivo, and this enhancement was not related to NK cell-target cell recognition or the expression of death receptors. Moreover, RocA could inhibit autophagy, reverse autophagic impairment of NK cell-mediated killing and restore the NK cell-derived GZMB level in NSCLC cells. Furthermore, RocA decreased protein expression of ULK1 and firefly luciferase containing a polypurine sequence of the 5´ UTR of ULK1. These results revealed that RocA could enhance NK cell-mediated cell killing through autophagy inhibition via targeting ULK1.
Immune effector cells can recognize and destroy malignant transformed cells, playing a crucial role in the host defense against cancer. However, the interaction between cancer cells and lymphoid effectors may induce autophagy and promote cancer cell survival [Citation20]. Other environmental stresses, such as hypoxia, can also induce autophagy and promote cancer cell escape from NK cell-mediated lysis [Citation21]. In this study, we found that autophagy was clearly induced by NK cells, rapamycin and starvation in NSCLC cells, leading to significantly impaired NSCLC cell susceptibility to NK cell-mediated lysis. These results were consistent with previous findings, further confirming that autophagy can help cancer cells evade an effective immune response and escape immunosurveillance [Citation22].
RocA inhibits cancer cell growth as an inhibitor of KRAS (KRAS proto-oncogene, GTPase) [Citation23], RHO GTPases [Citation24] and CFLAR (CASP8 and FADD like apoptosis regulator) [Citation25,Citation26]. However, it remains largely unexplored whether RocA can inhibit autophagy, although RocA does not inhibit MTOR signaling [Citation26], which is a key regulator of autophagy. In this study, we found that RocA did not suppress MTOR phosphorylation; inversely, RocA could inhibit autophagy. Furthermore, RocA could significantly increase the GZMB level in NSCLC cells and reverse autophagic impairment of NSCLC cell susceptibility to NK cell-mediated killing. These findings implied that RocA was a novel autophagy inhibitor and could block autophagic immune resistance to NK cell-mediated killing, suggesting that RocA could be potentially applied in NK cell-based caner immunotherapy.
As a homolog of yeast Atg1, ULK1 is the first member of the ULK family proteins that include ULK1, ULK2, ULK3, ULK4 and STK36 (serine/threonine kinase 36) in mammalian cells. ULK1 and ULK2 are highly identical and may have similar functions, but ULK1 is predominant in autophagy [Citation27]. ULK1 is the central component in autophagic flux and required for autophagy initiation [Citation28,Citation29]. Nutrient starvation or rapamycin can inhibit MTORC1 and promote ULK1 function to initiate autophagy [Citation30,Citation31], which is consistent with our findings that rapamycin inhibited MTOR activity by inhibiting MTOR Ser2481 and Ser2448 phosphorylation, and promoted ULK1 activity by increasing ULK1 Ser555 phosphorylation ()). RocA could not release the rapamycin-induced suppression of MTOR, but it could dramatically inhibit the expression of ULK1 at the protein level, suggesting that RocA inhibited autophagy through targeting ULK1.
RPS6KB1 and EIF4EBP1 are well-known MTOR downstream targets [Citation32]. In this study, we found that RocA did not activate MTOR, and it also did not reverse rapamycin-induced inhibition of RPS6KB1 and EIF4EBP1, but clearly increased phophorylation levels of RPS6KB1 and EIF4EBP1. RocA did not activate MTOR, so why could it increase the phosphorylation of RPS6KB1 and EIF4EBP1? In fact, ULK1 promotes multisite RPTOR (regulatory associated protein of MTOR complex 1) phosphorylation and reduces the ability of RPTOR to bind to the substrates RPS6KB1 and EIF4EBP1, leading to the reduction of phosphorylation of RPS6KB1 and EIF4EBP1 by MTOR complex 1. The loss of ULK1 correlated with an increase in endogenous phospho-RPS6KB1 and phospho-EIF4EBP1 [Citation33]. Therefore, RocA-dependent reduction of ULK1 could inhibit the substrate-binding activity of RPTOR and increase phosphorylation of RPS6KB1 and EIF4EBP1. This result further confirmed that RocA inhibited autophagy through targeting ULK1.
Autophagy is induced by NK cells to resist NK cell-mediated killing in renal carcinoma cells, and ITPR1 is required for NK cell-induced autophagy [Citation34]. In this study, we found that NK cells could also induce autophagy in NSCLC cells, which was consistent with the previous reports. However, RocA could inhibit NK cell-induced autophagy, but it did not inhibit the expression of ITPR1 in most NSCLC cells. This observation did not mean that ITPR1 was not necessary for NK cell-induced autophagy. In fact, ITPR1 is upstream of ULK1 in the autophagy machinery [Citation35]. Therefore, RocA could block ITPR1-mediated autophagic signaling by inhibiting ULK1, suggesting that ULK1 was also required for NK cell-induced autophagy and a potential target for cancer cell escape from NK cell-mediated lysis.
RocA clearly inhibited the expression of ULK1 at the protein level, whereas its expression at the mRNA level was not repressed. Moreover, ULK1 repression was not affected by the proteasome inhibitor MG132. This finding indicated that RocA inhibited ULK1 protein expression through translational repression, which was consistent with a previous finding that RocA represses translational initiation through stabilizing an EIF4A (eukaryotic translation initiation factor 4A)-RNA interaction to either alter the level and/or impair the activity of the EIF4F complex [Citation36]. Recently, RocA has been found to specifically clamp EIF4A onto polypurine sequences in the 5´ UTR to block 43S preinitiation complex scanning, leading to translational repression rather than reduction of EIF4A availability [Citation19]. We found that there was a polypurine sequence (GAAGAG) in the 5´ UTR of ULK1. RocA could dose-dependently inhibit the expression of firefly luciferase containing the WT 5´ UTR of ULK1, whereas such an inhibitory effect was significantly attenuated following the deletion of the polypurine sequence. This finding confirmed that RocA could inhibit translation initiation in a polypurine sequence-specific manner, revealing that RocA suppressed ULK1 via translational repression.
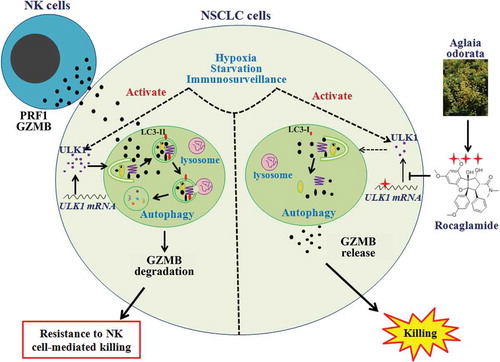
In conclusion, NSCLC cells might resist NK cell-mediated killing through autophagic degradation of NK cell-derived GZMB in the presence of hypoxia, starvation or immunosurveillance. However, RocA could repress ULK1 translation, inhibit autophagy and restore the NK cell-derived GZMB level in NSCLC cells, leading to enhancement of NK cell-mediated killing (). We, for the first time, showed that RocA is a novel autophagy inhibitor and could block autophagic immune resistance to NK cell-mediated killing, and our data suggested that RocA is a promising therapeutic candidate in NK cell-based cancer immunotherapy.
Figure 9. Scheme of RocA-enhanced NK cell-mediated killing of NSCLC cells through blocking autophagic immune resistance. Armed NK cells may recognize and kill NSCLC cells. However, cancer cells can resist NK cell-mediated killing through decreasing the NK cell-derived GZMB level in NSCLC cells by autophagy under hypoxia, starvation and immune surveillance via activating ULK1. RocA can repress ULK1 protein translation in a sequence-specific manner, resulting in autophagy inhibition and elevation of NK cell-derived GZMB in NSCLC cells, and leading to improved NK cell-mediated cell lysis.
Materials and methods
Reagents
A chemical library consisting of 2,880 natural products was obtained from the China National Compound Resource Center (NCRC). RocA (BBP00609) was purchased from BioBioPha Co., Ltd. Calcein-AM (C3099), CellTraceTM Far Red Cell Proliferation Kit (C34572) and Earle’s balanced salt solution (24010043) were obtained from Thermo Fisher Scientific. Rapamycin (V900930), CQ (C6628), MG132 (M8699), DAPI (D9542) and deferoxamine (DFO; D9533), Thiazolyl Blue Tetrazolium Bromide (MTT; M2128) were provided by Millipore Sigma. Recombinant human IL2 (200–02) was supplied from PeproTech. FITC-NCAM1/CD56 (318304), Alexa Fluor® 647-GZMB (515406), APC-MICA/MICB (320908), APC-FAS/CD95 (305607), APC-HLA-A/B/C (311410), PE-TNFRSF10A/DR4 (307206), PE-TNFRSF10B/DR5 (307406), PE-PVR/CD155 (337508), FITC anti-mouse CD4 (100405), PE anti-mouse CD3 (100205), PerCP/Cy5.5 anti-mouse CD8 (100733) and APC anti-mouse NCR1/NKp46 (137608) antibodies, as well as their murine isotypes (FITC-IgG Fc [409310], PE-IgG Fc [409,304], APC-IgG Fc [409306], Alexa Fluor® 647-IgG [400135]), APC goat anti-mouse IgM (406509), APC goat anti-mouse IgG (405308), and Purified anti-mouse NK1.1 (PK136) antibody (108702) were purchased from BioLegend Inc. PE-Cy5-LAMP1 (555802) and PE-NECTIN2/CD112 (551057) antibodies as well as PE-Cy5 control antibody (551497) were obtained from BD Biosciences. Antibodies against MAP1LC3B (2775), MTOR (2983), phospho-MTOR (Ser2448; 5536), phospho-MTOR (Ser2481; 2974), phospho-PRKAA1 (Thr172; 2535), PRKAA1 (5832), phospho-RPS6KB1 (Thr389; 9234), RPS6KB1 (2708), phospho-EIF4EBP1 (Thr37/46; 2855), EIF4EBP1 (9644), phospho-ULK1 (Ser555; 5869), ATG5 (12994), ATG7 (8558), BECN1 (3495), GZMB (4275), HIF1A (79233T) and ACTB (4967) were supplied from Cell Signaling Technology. Antibodies against ULK1 (sc-33182), ULBP1 (sc-53131), ULBP2 (sc-80419), ULBP3 (sc-53132), ULBP4 (sc-53133) and ULBP5 (sc-53134) were provided by Santa Cruz Biotechnology. CellTiter-Glo® Luminescent Cell Viability Assay Kit (G7571) was purchased from Promega Corporation. Cell Counting Kit (CCK)-8 (40203ES60) was purchased from Yeasen.
Expansion of NK cells
Human peripheral blood mononuclear cells (PBMCs) were obtained from the Shanghai Blood Center under a research protocol approved by the Department of Shanghai Blood Administration. PBMCs were either freshly used or frozen in 10% DMSO (Amresco, 0231) containing fetal bovine serum (Gibco, 10099141). For frozen PBMCs, the cells were thawed 1 day prior to the incubation in RPMI-1640 medium (HyClone, SH30809.01) supplemented with 10% fetal calf serum, 1% penicillin-streptomycin (Yeasen, 60162ES76), 2 mM L-glutamine and 200 U/mL of IL2 at 37°C in an environment of 5% CO2. NK cells were expanded as previously described [Citation37]. Briefly, fresh or frozen PBMCs were co-incubated with irradiated mbIL-21-CD137L-K562 cells, which were built and maintained in our lab, for 2 weeks in RPMI-1640 medium containing 100 U/mL of IL2 at 37°C in 5% CO2.
Luminescent cell viability assay and high-throughput screening
To determine NK cell-mediated lysis or find natural products that improve NK cell-mediated lysis, a luminescent cell viability assay was performed as previously described [Citation38]. Briefly, 1 × 10³ of pooled expanded NK cells, target cells, or a mixture of both cells (1:1) were seeded into white 384-well opaque-walled plates (Corning, 3707). Natural products were added to each well to a final concentration of 10 μM in triplicate. Equal volumes of DMSO and 200 U/mL of recombinant human IL2 were employed as negative and positive controls, respectively. After 24-h co-incubation, CellTiter-Glo® Reagent was added, and the luminescent signal was measured using a Synergy 2 Multi-Mode Microplate Reader (BioTek Instruments, Inc., Winooski, VT, USA). The percentage of viable cells was calculated using a formula as follows: viable cells % = (MEANMIX – MEANNK)/MEANTarget× 100, where MEANMIX is the mean luminescence of a mixture of NK cells and target cells; MEANNK is the mean luminescence of NK cells; and MEANTarget refers to the mean luminescence of target cells. Moreover, the percentage of lysis was determined according to a formula as follows: lysis % = [1-(MEANMIX – MEANNK)/MEANTarget] × 100. For the high-throughput screening assay, a 20% increase of target cell killing compared with vehicle treatment was arbitrarily selected for next-round screening, and 3 successive rounds of screenings were performed. Target cells for 1st, 2nd and 3rd round screenings were H460, A549 and H1975 cells, respectively.
Biophotonic cytotoxicity assay
The biophotonic cytotoxicity assay was performed to determine NK cell cytotoxicity as previously described [Citation39]. Briefly, FLuc+ A549 cells, NK cells or a mixture of both cells (1:1) were seeded into 96-well opaque-walled plates and incubated in the absence or presence of 800 nM of rapamycin or 100 μM of DFO with or without 250 nM of RocA for 24 h, and then D-luciferin (PerkinElmer, 122796) was added to a final concentration of 0.14 mg/mL. The luminescent intensity was measured from 8 mm above the bottom of the plate using a Synergy 2 Multi-Mode Microplate Reader. The percentage of viable cells was calculated using a formula as follows: viable cells % = (MEANEXP – MEANSDS)/(MEANmedia – MEANSDS), where MEANEXP indicates the mean luminescence of the experimental sample, MEANSDS is the background luminescence of target cells that were lysed by 1× SDS buffer, and MEANmedia represents the mean luminescence of target cells used in the assay. Moreover, the percentage of lysis was determined according to a formula as follows: lysis % = [1-(MEANEXP – MEANSDS)/(MEANmedia – MEANSDS)] × 100.
Subcutaneous xenograft tumor models
All animal procedures, including tumor transplantation, tumor volume monitoring and euthanasia, were approved by the Institutional Animal Care and Use Committee at Shanghai University of Traditional Chinese Medicine. For the subcutaneous xenograft model, male SCID/Bg or C57BL/6 mice (6 ~ 8-week-old, weighing 18–20 g) were purchased from the Beijing Vital River Laboratory Animal Technology Co., Ltd. and maintained under an SPF environmental condition. A total of 3 × 10⁶ of H1975 cells per mouse were subcutaneously inoculated on the upper back in SCID/Bg mice on day 0, then 1 × 10⁷ of NK cells per mouse was administered via intravenous injection every 1 week, 3 times, and 0.3 mg/kg of RocA was administered via intraperitoneal (i.p.) injection every 2 days from day 3. For NK cell depletion, a total of 1.5 × 10⁶ LLC cells per mouse were subcutaneously inoculated on the upper back in C57BL/6 mice on day 0, then mice were administered with 100 μg of PK136 antibody per mouse via i.p. injection on day 0, 3, 7 10 and 13, and 1.0 mg/kg of RocA was administered via i.p. injection every 2 days from day 3. The tumor volumes were recorded every 2 days using a caliper. Tumor volume was calculated using a formula as follows: V = (π/8)a× b2, where V = tumor volume, a = maximum tumor diameter, and b = minimum tumor diameter. Mice were sacrificed on day 21, and then tumors were excised, weighed and photographed. Splenocytes were isolated and used to detect CD4+ CD8+ T cells and NK cells by flow cytometry analysis.
Calcein release assay
Target cells were treated with 800 nM rapamycin, 250 nM RocA or both for 24 h and then incubated with 2 μg/mL of calcein-AM at 37°C for 1 h with occasional shaking. NK cells and target cells were mixed at an E:T (effector cells: target cells) ratio of 1:1 and co-cultured in 96-well U-bottom plates for 4 h. Supernatants were transferred to a new 96-well flat-bottom plate, and the fluorescence signal was measured using a Synergy 2 Multi-Mode Microplate Reader (excitation filter 485 nm; emission filter 538 nm). The percentage of lysis was determined according to a formula as follows: lysis % = [(experimental release – spontaneous release)/(maximum release – spontaneous release)] × 100.
Flow cytometry analysis
Cells were exposed to appropriate fluorescence-conjugated antibodies for 30 min at 4°C in the dark, then washed and resuspended in PBS (Thermo Fisher Scientific, 21600069) containing 1% fetal bovine serum. For indirect staining, cells were first exposed to appropriate primary antibodies for 30 min at 4°C in the dark, followed by incubation with appropriate secondary antibodies for 30 min at 4°C in the dark. Data were acquired using a BD Accuri C6 (BD Biosciences, USA) and analyzed using FlowJo software (Ashland, OR, USA).
Degranulation assay
LAMP1 surface expression was analyzed to assess the effect of RocA on NK cell degranulation. Briefly, NSCLC cells were treated with 800 nM rapamycin in the absence or presence of 250 nM RocA for 24 h, and then the cells were co-incubated with NK cells at a ratio of 1:1 for 4 h. For each assay, anti-LAMP1 antibody or isotype IgG was added and incubated for 4 h, and then NK cells were stained with anti-human NCAM1/CD56 antibody for 30 min at 4°C. LAMP1 expression on the surface of NK cells was determined with a BD Accuri C6 instrument. Data were analyzed using the FlowJo software.
Nk-target conjugates
NK cells and NSCLC cells were respectively stained with calcein-AM (green) and CellTraceTM Far Red (red) according to the manufacturer’s instructions and then co-cultured at a ratio of 1:1 for 30 min at 37°C. Subsequently, the cells were immediately fixed in ice-cold 4% paraformaldehyde, and the double-positive population (E-T conjugates) was assessed by flow cytometry analysis.
Immunofluorescence histology
Cells were fixed with 4% paraformaldehyde for 20 min, treated with 1% Triton X-100 (Amresco, 0694) for 20 min and incubated with anti-MAP1LC3B antibody (Abcam, ab48394) at 4°C overnight. The cells were then incubated with Alexa Fluro® 488 Conjugated anti-rabbit antibody (Cell Signaling Technology, 4412) for 30 min and stained with 4ʹ,6-diamidino-2-phenylindole (DAPI; Beyotime, C1005) for 20 min. Images were captured by laser confocal microscopy (ZEISS, Oberkochen, Germany).
Western blotting analysis
Cells were lysed with RIPA Buffer (Beyotime, P0013B) supplemented with a protease and phosphatase inhibitor cocktail (Sigma-Aldrich, PPC1010). Contents of proteins were quantified using a BCA protein reagent assay kit (Yeasen, 20201ES76) and analyzed by SDS-PAGE using an 8 ~ 10% gel, followed by immunoblotting using Enhanced Chemiluminescence Substrate (MerckMillipore, WBKLS0500) according to the manufacturer’s instructions. Bands were automatically visualized using a chemiluminescent detection system (ProteinSimple, CA, USA).
GZMB detection
Expanded NK cells were co-incubated with target cells (E:T ratio 1:1) for 30 min at 37°C. Cells were washed twice and subjected to high-speed vortexing to disrupt E-T conjugates. Target cells were separated from NK cells using anti-human NCAM1/CD56 magnetic microbeads (Miltenyi Biotec, 130-050-401) and applied to detect GZMB by western blotting. Alternatively, cells were immediately fixed with 4% paraformaldehyde for 30 min at 4°C, then permeabilized with True-NuclearTM Transcription Factor Buffer (Biolegend, 424401) and stained with FITC anti-human NCAM1/CD56 and Alexa Fluor® 647 anti-human GZMB antibodies. Intracellular GZMB content in target cells was analyzed by flow cytometry analysis.
Quantitative real-time PCR
A total of 3 × 10⁵ of H460 or H1975 cells were seeded in 6-cm plates and incubated with different concentrations (0, 125, 250 and 500 nM) of RocA for 24 h. Total RNA was extracted using the MiniBEST Universal RNA extraction kit (TaKaRa, 9767), and 1 μg of total RNA was reverse transcribed into cDNA using the PrimeScriptTM RT MasterMix kit (TaKaRa, RR036A) according to the manufacturer’s instructions. Real-time PCR was performed using a SYBR® Premix Ex Taq™ kit (TaKaRa, RR420A) according to the manufacturer’s instructions on an ABI system (Applied Biosystems, Thermo Fisher Scientific Inc., MA, USA). After a denaturation step at 95°C for 30 sec, amplifications were carried out with 40 cycles at a melting temperature of 95°C for 5 sec and an annealing temperature of 60°C for 30 sec, followed by melt curve analysis. The relative expression was calculated using the 2−ΔΔCt method. Primers were listed as follows: ACTB forward: 5´-CCCTAGGCACCAGGGTGTGA-3´; ACTB reverse: 5´-GTCGTCCCAGTTGGTAACAATG-3´; ULK1 forward: 5´-GCAAGTTCGAGTTCTCCCG-3´; ULK1 reverse: 5´-CGACCTCCAAATCGTGCTTCT-3´.
Dual-luciferase reporter assay
The WT or Tm 5´ UTR of ULK1 (NM_003565.2) was amplified by PCR using the primers as follows: WT forward: 5´-AAGCTTGGATCCGGATTCGGATTA-3´; Tm forward: 5´-GGAAGCTTGCCGTGGCACA-3´; WT/Tm reverse: 5´-CAAATCGTGCTTCTCGCGGTGG-3´. The amplicons were then inserted into the cloning sites of HindIII and NcoI located between the SV40 promoter and firefly luciferase open reading frame (ORF) in the pGL3-promoter vector (Promega, E1761) to construct the 5´ UTR of ULK1 (named pGL3-WT-UTR and pGL3-Tm-UTR, respectively), and then a dual-luciferase reporter assay was performed using the Dual-Luciferase® Reporter Assay Kit (Promega, E1910) according to the manufacturer’s instructions. Briefly, 293T cells were seeded into 96-well plates 1 day prior to transfection, and then cells were co-transfected with pGL3-WT-UTR or pGL3-Tm-UTR and pGL4.74 control vector (Promega, E6921) at a ratio of 4:1 (reporter construct:control vector) using FuGENE HD Transfection Reagent (Promega, E2311) according to the manufacturer’s instructions. After 24 h, cells were treated with different concentrations of RocA for 24 h and then lysed using Passive Lysis Buffer. Activities of firefly luciferase and Renilla luciferase were immediately measured using a Synergy 2 Multi-Mode Microplate Reader. The activity of firefly luciferase was normalized to that of Renilla luciferase.
Statistical analysis
All data were analyzed using SPSS statistical software and expressed as mean ± standard error of means (SEM). Statistical comparison was assessed by one-way ANOVA. Multi-comparison was performed using LSD post-hoc test. P < 0.05 was considered statistically significant.
Abbreviation
| ACTB | = | actin beta |
| ATG5 | = | autophagy related 5 |
| ATG7 | = | autophagy related 7 |
| BECN1 | = | beclin 1 |
| CQ | = | chloroquine |
| CTL | = | cytotoxic T-lymphocyte |
| DFO | = | deferoxamine |
| EIF4A | = | eukaryotic translation initiation factor 4A |
| EIF4EBP1 | = | eukaryotic translation initiation factor 4E binding protein 1 |
| FAS | = | Fas cell surface death receptor |
| GZMB | = | granzyme B |
| HLA | = | major histocompatibility complex, class I |
| ITPR1 | = | inositol 1,4,5-trisphosphate receptor type 1 |
| LAMP1 | = | lysosomal associated membrane protein 1 |
| LLC | = | Lewis lung cancer |
| MAP1LC3 | = | microtubule associated protein 1 light chain 3 |
| MICA/B MHC | = | class I polypeptide-related sequence A/B |
| MTOR | = | mechanistic target of rapamycin kinse |
| NK | = | natural killer |
| NSCLC | = | non-small cell lung cancer |
| PBMC | = | peripheral blood mononuclear cell |
| PRF1 | = | perforin 1 |
| RocA | = | rocaglamide |
| RPTOR | = | regulatory associated protein of MTOR complex 1 |
| RPS6KB1 | = | ribosomal protein S6 kinase B1 |
| PRKAA1 | = | protein kinase AMP-activated catalytic subunit alpha 1 |
| SQSTM1 | = | sequestosome 1 |
| TNFRSF10A | = | TNF receptor superfamily member 10a |
| TNFRSF10B | = | TNF receptor superfamily member 10b |
| ULBP1 | = | UL16 binding protein 1 |
| ULK1 | = | unc-51 like autophagy activating kinase 1 |
| ULK2 | = | unc-51 like autophagy activating kinase 2 |
| UTR | = | untranslated region |
Supplemental Material
Download MS Word (1.6 MB)Acknowledgments
We thank Dr. Yuanzhi Lao for providing the GFP-MAP1LC3+ Hela cells.
Disclosure statement
No potential conflict of interest was reported by the authors.
Supplementary material
Supplementary data can be accessed here.
Additional information
Funding
Related Research Data
References
- Morvan MG, Lanier LL. NK cells and cancer: you can teach innate cells new tricks. Nat Rev Cancer. 2016 Jan;16(1):7–19. PubMed PMID: 26694935; eng.
- Carotta S. Targeting NK cells for anticancer immunotherapy: clinical and preclinical approaches. Front Immunol. 2016;7:152. PubMed PMID: 27148271; PubMed Central PMCID: PMC4838611. eng.
- Carrega P, Ferlazzo G. Natural killers are made not born: how to exploit NK cells in lung malignancies. Front Immunol. 2017;8:277. PubMed PMID: 28348567; PubMed Central PMCID: PMC5346886. eng.
- Guillerey C, Huntington ND, Smyth MJ. Targeting natural killer cells in cancer immunotherapy. Nat Immunol. 2016 Aug 19;17(9):1025–1036. PubMed PMID: 27540992; eng.
- Mizushima N, Komatsu M. Autophagy: renovation of cells and tissues. Cell. 2011 Nov 11;147(4):728–741. PubMed PMID: 22078875; eng.
- Sui X, Chen R, Wang Z, et al. Autophagy and chemotherapy resistance: a promising therapeutic target for cancer treatment. Cell Death Dis. 2013 Oct 10;4:e838. PubMed PMID: 24113172; PubMed Central PMCID: PMC3824660. eng.
- Galluzzi L, Pietrocola F, Bravo-San Pedro JM, et al. Autophagy in malignant transformation and cancer progression. EMBO J. 2015 Apr 01;34(7):856–880. PubMed PMID: 25712477; PubMed Central PMCID: PMC4388596. eng.
- Ozpolat B, Benbrook DM. Targeting autophagy in cancer management - strategies and developments. Cancer Manag Res. 2015;7:291–299. PubMed PMID: 26392787; PubMed Central PMCID: PMC4573074. eng.
- Noman MZ, Buart S, Van Pelt J, et al. The cooperative induction of hypoxia-inducible factor-1 alpha and STAT3 during hypoxia induced an impairment of tumor susceptibility to CTL-mediated cell lysis. J Immunol. 2009 Mar 15;182(6):3510–3521. PubMed PMID: 19265129; eng.
- Noman MZ, Janji B, Kaminska B, et al. Blocking hypoxia-induced autophagy in tumors restores cytotoxic T-cell activity and promotes regression. Cancer Res. 2011 Sep 15;71(18):5976–5986. PubMed PMID: 21810913; eng.
- Akalay I, Janji B, Hasmim M, et al. Epithelial-to-mesenchymal transition and autophagy induction in breast carcinoma promote escape from T-cell-mediated lysis. Cancer Res. 2013 Apr 15;73(8):2418–2427. PubMed PMID: 23436798; eng.
- Akalay I, Janji B, Hasmim M, et al. EMT impairs breast carcinoma cell susceptibility to CTL-mediated lysis through autophagy induction. Autophagy. 2013 Jul;9(7):1104–1106. PubMed PMID: 23635487; PubMed Central PMCID: PMC3722321. eng.
- Baginska J, Viry E, Berchem G, et al. Granzyme B degradation by autophagy decreases tumor cell susceptibility to natural killer-mediated lysis under hypoxia. Proc Natl Acad Sci USA. 2013 Oct 22;110(43):17450–17455. PubMed PMID: 24101526; PubMed Central PMCID: PMC3808626. eng.
- Tittarelli A, Janji B, Van Moer K, et al. The selective degradation of synaptic connexin 43 protein by hypoxia-induced autophagy impairs natural killer cell-mediated tumor cell killing. J Biol Chem. 2015 Sep 25;290(39):23670–23679. PubMed PMID: 26221040; PubMed Central PMCID: PMC4583044. eng.
- Janji B, Viry E, Moussay E, et al. The multifaceted role of autophagy in tumor evasion from immune surveillance. Oncotarget. 2016 Apr 05;7(14):17591–17607. PubMed PMID: 26910842; PubMed Central PMCID: PMC4951235. eng.
- Li-Weber M. Molecular mechanisms and anti-cancer aspects of the medicinal phytochemicals rocaglamides (=flavaglines). Int J Cancer. 2015 Oct 15;137(8):1791–1799. PubMed PMID: 24895251; eng.
- Alter G, Malenfant JM, Altfeld M. CD107a as a functional marker for the identification of natural killer cell activity. J Immunol Methods. 2004 Nov;294(1–2):15–22. PubMed PMID: 15604012; eng.
- Messai Y, Noman MZ, Hasmim M, et al. ITPR1 protects renal cancer cells against natural killer cells by inducing autophagy. Cancer Res. 2014 Dec 01;74(23):6820–6832. PubMed PMID: 25297632; eng.
- Iwasaki S, Floor SN, Ingolia NT. Rocaglates convert DEAD-box protein eIF4A into a sequence-selective translational repressor. Nature. 2016 Jun 23;534(7608):558–561. PubMed PMID: 27309803; PubMed Central PMCID: PMC4946961. eng.
- Buchser WJ, Laskow TC, Pavlik PJ, et al. Cell-mediated autophagy promotes cancer cell survival. Cancer Res. 2012 Jun 15;72(12):2970–2979. PubMed PMID: 22505650; PubMed Central PMCID: PMC3505669. eng.
- Viry E, Baginska J, Berchem G, et al. Autophagic degradation of GZMB/granzyme B: a new mechanism of hypoxic tumor cell escape from natural killer cell-mediated lysis. Autophagy. 2014 Jan;10(1):173–175. PubMed PMID: 24248158; PubMed Central PMCID: PMC4389872. eng.
- Viry E, Noman MZ, Arakelian T, et al. Hijacker of the antitumor immune response: autophagy is showing its worst facet. Front Oncol. 2016;6:246. PubMed PMID: 27917371; PubMed Central PMCID: PMC5114287. eng.
- Yurugi H, Marini F, Weber C, et al. Targeting prohibitins with chemical ligands inhibits KRAS-mediated lung tumours. Oncogene. 2017 Apr 17;36:5914. PubMed PMID: 28414306; eng.
- Becker MS, Muller PM, Bajorat J, et al. The anticancer phytochemical rocaglamide inhibits Rho GTPase activity and cancer cell migration. Oncotarget. 2016 Aug 09;7(32):51908–51921. PubMed PMID: 27340868; PubMed Central PMCID: PMC5239523. eng.
- Wu Y, Giaisi M, Kohler R, et al. Rocaglamide breaks TRAIL-resistance in human multiple myeloma and acute T-cell leukemia in vivo in a mouse xenogtraft model. Cancer Lett. 2017 Mar 28;389:70–77. PubMed PMID: 27998762; eng.
- Bleumink M, Kohler R, Giaisi M, et al. Rocaglamide breaks TRAIL resistance in HTLV-1-associated adult T-cell leukemia/lymphoma by translational suppression of c-FLIP expression. Cell Death Differ. 2011 Feb;18(2):362–370. PubMed PMID: 20706274; PubMed Central PMCID: PMC3131883. eng.
- Klionsky DJ, Abdelmohsen K, Abe A, et al. Guidelines for the use and interpretation of assays for monitoring autophagy (3rd edition). Autophagy. 2016;12(1):1–222. PubMed PMID: 26799652; PubMed Central PMCID: PMC4835977. eng.
- Hurley JH, Young LN. Mechanisms of autophagy initiation. Annu Rev Biochem. 2017 Jun 20;86:225–244. PubMed PMID: 28301741; eng.
- Park JM, Jung CH, Seo M, et al. The ULK1 complex mediates MTORC1 signaling to the autophagy initiation machinery via binding and phosphorylating ATG14. Autophagy. 2016;12(3):547–564. PubMed PMID: 27046250; PubMed Central PMCID: PMC4835982. eng.
- Jung CH, Ro SH, Cao J, et al. mTOR regulation of autophagy. FEBS Lett. 2010 Apr 02;584(7):1287–1295. PubMed PMID: 20083114; PubMed Central PMCID: PMC2846630. eng.
- Kim J, Kundu M, Viollet B, et al. AMPK and mTOR regulate autophagy through direct phosphorylation of Ulk1. Nat Cell Biol. 2011 Feb;13(2):132–141. PubMed PMID: 21258367; PubMed Central PMCID: PMC3987946. eng.
- Mamane Y, Petroulakis E, LeBacquer O, et al. mTOR, translation initiation and cancer. Oncogene. 2006 Oct 16;25(48):6416–6422. PubMed PMID: 17041626; eng.
- Dunlop EA, Hunt DK, Acosta-Jaquez HA, et al. ULK1 inhibits mTORC1 signaling, promotes multisite Raptor phosphorylation and hinders substrate binding. Autophagy. 2011 Jul;7(7):737–747. 15491 [pii]. PubMed PMID: 21460630; PubMed Central PMCID: PMC3149699. eng.
- Messai Y, Noman MZ, Janji B, et al. The autophagy sensor ITPR1 protects renal carcinoma cells from NK-mediated killing. Autophagy. 2015 Feb 25. PubMed PMID: 25714778; eng. DOI:10.1080/15548627.2015.1017194
- Parys JB, Decuypere JP, Bultynck G. Role of the inositol 1,4,5-trisphosphate receptor/Ca2+-release channel in autophagy. Cell Commun Signal. 2012 Jul 06;10(1):17. PubMed PMID: 22770472; PubMed Central PMCID: PMC3413604. eng.
- Sadlish H, Galicia-Vazquez G, Paris CG, et al. Evidence for a functionally relevant rocaglamide binding site on the eIF4A-RNA complex. ACS Chem Biol. 2013 Jul 19;8(7):1519–1527. PubMed PMID: 23614532; PubMed Central PMCID: PMC3796129. eng.
- Wang X, Lee DA, Wang Y, et al. Membrane-bound interleukin-21 and CD137 ligand induce functional human natural killer cells from peripheral blood mononuclear cells through STAT-3 activation. Clin Exp Immunol. 2013 Apr;172(1):104–112. PubMed PMID: 23480190; PubMed Central PMCID: PMC3719936. eng.
- Gong C, Yao C, Xu Z, et al. Enhancement of NK cell-mediated lysis of non-small lung cancer cells by nPKC activator, ingenol 3,20 dibenzoate. Mol Immunol. 2017 Mar;83:23–32. PubMed PMID: 28092804; eng.
- Brown CE, Wright CL, Naranjo A, et al. Biophotonic cytotoxicity assay for high-throughput screening of cytolytic killing. J Immunol Methods. 2005 Feb;297(1–2):39–52. PubMed PMID: 15777929; eng.