
ABSTRACT
Macroautophagy/autophagy has emerged as a central process in lymphocyte homeostasis, activation and differentiation. Based on our finding that the p66 isoform of SHC1 (p66SHC) pro-apoptotic ROS-elevating SHC family adaptor inhibits MTOR signaling in these cells, here we investigated the role of p66SHC in B-cell autophagy. We show that p66SHC disrupts mitochondrial function through its CYCS (cytochrome c, somatic) binding domain, thereby impairing ATP production, which results in AMPK activation and enhanced autophagic flux. While p66SHC binding to CYCS is sufficient for triggering apoptosis, p66SHC-mediated autophagy additionally depends on its ability to interact with membrane-associated LC3-II through a specific binding motif within its N terminus. Importantly, p66SHC also has an impact on mitochondria homeostasis by inducing mitochondrial depolarization, protein ubiquitination at the outer mitochondrial membrane, and local recruitment of active AMPK. These events initiate mitophagy, whose full execution relies on the role of p66SHC as an LC3-II receptor which brings phagophore membranes to mitochondria. Importantly, p66SHC also promotes hypoxia-induced mitophagy in B cells. Moreover, p66SHC deficiency enhances B cell differentiation to plasma cells, which is controlled by intracellular ROS levels and the hypoxic germinal center environment. The results identify mitochondrial p66SHC as a novel regulator of autophagy and mitophagy in B cells and implicate p66SHC-mediated coordination of autophagy and apoptosis in B cell survival and differentiation.
Abbreviations: ACTB: actin beta; AMPK: AMP-activated protein kinase; ATP: adenosine triphosphate; ATG: autophagy-related; CYCS: cytochrome c, somatic; CLQ: chloroquine; COX: cyclooxygenase; CTR: control; GFP: green fluorescent protein; HIFIA/Hif alpha: hypoxia inducible factor 1 subunit alpha; IMS: intermembrane space; LIR: LC3 interacting region; MAP1LC3B/LC3B: microtubule associated protein 1 light chain 3 beta; MTOR/mTOR: mechanistic target of rapamycin kinase; OA: oligomycin and antimycin A; OMM: outer mitochondrial membrane; PHB: prohibitin; PBS: phosphate-buffered saline; PINK1: PTEN induced putative kinase 1; RFP: red fluorescent protein; ROS: reactive oxygen species; SHC: src Homology 2 domain-containing transforming protein; TMRM: tetramethylrhodamine, methyl ester; TOMM: translocase of outer mitochondrial membrane; ULK1: unc-51 like autophagy activating kinase 1; WT: wild-type
Introduction
Autophagy is a process that allows for the demise of senescent cellular macromolecules or organelles, which is exploited under conditions of nutrient limitation to provide endogenous energy sources [Citation1]. A key determinant in the activation of autophagy is the bioenergetic status of the cell. A decrease in the levels of intracellular ATP, resulting from limited availability of nutrients or impairment in mitochondrial function, is sensed by the AMP-activated protein kinase (AMPK), which is activated to turn off the major nutrient sensor, MTOR (mechanistic target of rapamycin kinase), while turning on the pro-autophagic kinase ULK1 [Citation2,Citation3]. This results in a metabolic shift from anabolism to catabolism, halting energy consumption and promoting autophagy [Citation2,Citation4,Citation5].
Autophagy has emerged in recent years as a central regulator of lymphocyte survival and homeostasis [Citation6]. While dispensable for thymocyte development, autophagy promotes naïve T cell activation and proliferation by controlling the degradation of negative regulators of T cell antigen receptor (TCR) signaling as well as cell cycle inhibitors [Citation7–Citation10]. Conversely, autophagy limits TCR signaling in activated effector T cells through the selective degradation of the NFKB regulator BCL10, promotes their survival through the degradation of pro-apoptotic proteins and is implicated in effector CD8+ T cell survival and memory formation during viral infection [Citation11–Citation13]. Furthermore activation-induced T cell death relies on inhibition of macroautophagy, underscoring a role for autophagy in effector T cell homeostasis [Citation14,Citation15]. At variance with T cells, autophagy has been reported to be dispensable for B-cell activation and the generation of the primary response to antigen [Citation16]; however, non-canonical autophagy has been recently shown to be operational in naïve activated B cells as well as germinal center B cells, where active MTOR suppresses canonical autophagy [Citation17]. Autophagy also participates in B cell development, promoting the pro-B to pre-B transition [Citation16], and is required for the generation and maintenance of memory B cells in response to viral infection. This process ensures moreover the survival of plasma cells to sustain long-lived humoral immunity by limiting the excessive production of antibodies and the resulting endoplasmic reticulum stress [Citation18,Citation19]. Of note, an increase in mitochondrial mass has been observed in T cells lacking components of the autophagic machinery [Citation20,Citation21], suggesting that autophagy-mediated removal of damaged mitochondria may contribute to lymphocyte survival.
While these findings have established a key role for autophagy in lymphocytes, the signaling pathways responsible for initiating the autophagic process under homeostatic conditions remain largely to be characterized. We previously demonstrated that p66SHC, a member of the SHC family of protein adaptors, restrains the activation of the MTOR target, AKT, in B cells, affecting cell survival [Citation22]. In addition, p66SHC has recently emerged as a central modulator of MTOR-dependent energy metabolism in fibroblasts [Citation23]. Here we have addressed the role of p66SHC in B-cell autophagy. We show that p66SHC limits glycolysis and disrupts mitochondrial function, resulting in impaired ATP production and, consequently, AMPK activation and increased autophagic flux. Moreover we provide evidence that, in the presence of p66SHC, B cells undergo mitophagy, with p66SHC enhancing the ubiquitination of proteins at the surface of mitochondria and promoting the local recruitment of active, phosphorylated AMPK (p-AMPK) as well as LC3-II. This results from the ability of p66SHC to interact with membrane-associated LC3 through an LC3-interacting region (LIR) motif and form a complex with active AMPK. Hence, p66SHC acts as an LC3 receptor to recruit autophagosomal membranes and associated machinery to damaged mitochondria.
Results
p66SHC decreases ATP production in B cells by limiting glycolysis and compromising mitochondrial integrity
To address the impact of p66SHC expression on cellular bioenergetics, we measured ATP levels in cells where p66SHC is epigenetically silenced by promoter methylation (MEC B cells) [Citation24], and that we stably transfected with either a construct encoding p66SHC or the corresponding empty vector. The levels of ATP were found to be reduced in p66SHC-expressing MEC cells compared to empty vector controls, resulting in an increased ADP:ATP ratio (). Similar results were obtained when we analyzed splenic B cells purified from wild-type and p66shc-/-mice ().
Figure 1. p66SHC impairs B cell glycolysis and mitochondrial integrity. (A) Left, Immunoblot analysis of p66SHC in lysates of MEC-1 cells stably transfected with empty vector (ctr) or with an expression construct encoding wild-type p66SHC (n ≥ 3). ACTB was used as a loading control. Right, Relative levels of ATP and ADP:ATP ratio in ctr and p66 cells (n ≥ 3). RLU, relative light units. (B) Left, immunoblot analysis of p66SHC in lysates of splenic B cells from wild-type (WT) and p66shc-/- mice (n ≥ 10/group). ACTB was used as a loading control. Right, relative levels of ATP (n ≥ 10/group) and ADP:ATP ratio (≥ 2 mice/exp, n ≥ 3) in splenic B cells from WT and p66shc-/– mice. RLU, relative light units. (C) Lactate, citrate and pyruvate levels in ctr and p66 cells (n = 3). (D) Flow cytometric analysis of TMRM-loaded ctr and p66 cells. The histogram shows the percentages of TMRMlow (depolarized) cells. (E,F) Immunoblot analysis of p-AMPK (Thr172) and p-MTOR (Ser2448) and the respective non-phosphorylated counterparts, in lysates of ctr and p66 cells (n ≥ 3) (E) or of splenic B cells from of WT and p66shc-/- mice (n ≥ 10 mice for each group) (F). ACTB was used as a loading control. Representative immunoblots are shown on the left of each panel, while the quantifications are shown on the right. The data are expressed as mean± SD. ***P ≤ 0.001; **P ≤ 0.01; *P ≤ 0.05 (Student’s t-test).
p66SHC could affect ATP production by modulating 2 different processes. First, studies on p66shc-/- MEFs have demonstrated that p66SHC inhibits glycolysis [Citation23]. Second, a pool of p66SHC, localized in the mitochondrial intermembrane space (IMS), disrupts the respiratory chain by oxidizing CYCS (cytochrome c, somatic) [Citation25]. This event not only impairs ATP production, but also leads to the ROS-dependent dissipation of the mitochondrial transmembrane potential [Citation25]. A reduction in pyruvate as well as in glycolytic intermediates used for ATP biosynthesis downstream of pyruvate in the mitochondrial oxidative phosphorylation pathway and in the cytosolic glycolytic pathway, namely lactate and citrate, respectively, was observed in p66SHC-overexpressing MEC cells (), similar to what has been reported for MEFs [Citation23]. Moreover, mitochondrial membrane potential was lower in the presence of p66SHC, as assessed by flow cytometric analysis following loading with the fluorescent probe TMRM (). Hence, p66SHC inhibits ATP production by impairing both glycolysis and mitochondrial function.
p66SHC promotes B cell autophagy by modulating AMPK activity
The inhibitory effect of p66SHC on ATP production and resulting alteration in the AMP:ATP balance suggests that the AMPK and MTOR pathways might be modulated in B cells not only in response to B-cell antigen receptor (BCR) signaling, as previously reported [Citation22], but also under homeostatic conditions. Consistent with this notion, activation of AMPK (phospho-Thr172) was found to be enhanced in the p66SHC-expressing MEC transfectant, concomitant with a reduction in the levels of active MTOR (phospho-Ser2448) (). The ability of p66SHC to modulate in opposite directions AMPKand MTOR activation was confirmed in p66shc-/- B cells, which displayed lower levels of p-AMPK and higher levels of p-MTOR compared to wild-type B cells ().
AMPK inhibits MTOR complex 1 (MTORC1) by preventing MTOR activation both through direct phosphorylation and phosphorylation of the MTOR inhibitory complex TSC1-TSC2 [Citation26]. This not only halts anabolism but also relieves the MTORC1-dependent inhibition of the autophagy-initiating complex, consisting of ULK1/2, ATG13, ATG101 and RB1CC1/FIP200 [Citation27]. The increase in the levels of p-AMPK in B cells expressing p66SHC suggests its potential implication in autophagy. To address this possibility we measured the autophagic flux in the MEC transfectants. To this aim we used treatment with chloroquine, a potent inhibitor of autophagy which leads to an accumulation of LC3-II, the cleaved and lipidated form of LC3 that participates in autophagosome biogenesis and is degraded upon autophagome fusion to the lysosome [Citation28,Citation29]. Immunoblot analysis with an antibody against LC3 showed an increase in autophagic flux in p66SHC-expressing cells (). This finding was confirmed using a flow cytometry-based assay to measure LC3-II under cell permeabilization conditions where the cytosolic LC3 species (LC3-I) is released from the cell, making it possible to selectively measure membrane-bound, lipidated LC3 (LC3-II) ().
Figure 2. p66SHC promotes B cell autophagy. (A) Immunoblot analysis of the autophagy marker LC3B in lysates of ctr and p66 cells untreated or treated for 1 h with a downstream inhibitor of the autophagy pathway, chloroquine (CLQ). ACTB was used as loading control. The histogram shows the quantification of autophagy flux [Citation80] as the difference in LC3-II:ACTB between CLQ-treated and untreated cells (mean fold ± SD accumulation of LC3B-II in samples treated with CLQ compared to the vehicle control; vehicle control value = 1, dashed line; see also the Methods section) (n ≥ 3). (B) Flow cytometric analysis of LC3-FITC staining of the ctr and p66 cells untreated or treated for 1 h with the commercial lysosome inhibitor ‘Autophagy Reagent A’ (CLQ) (n ≥ 3). The histogram shows the mean fold accumulation of LC3+ cells treated with the ‘Autophagy Reagent A’ compared to the vehicle control (vehicle control value = 1, dashed line). (C) Left, quantification of the ratio between the fluorescence intensity of GFP-LC3 and RFP-LC3ΔG in ctr and p66 cells transiently transfected with the pMRX-IP-GFP-LC3-RFP-LC3ΔG construct and labeled with anti-GFP and anti-RFP antibodies (≥ 10 cells/sample, n = 3). Right, representative images (medial optical sections) are shown. Size bar: 5 μm. (D) Immunoblot analysis of LC3B in lysates of splenic B cells from WT and p66shc-/- mice treated with or without CLQ. ACTB was used as a loading control. The histogram shows the quantification of autophagy flux as the difference in LC3-II:ACTB between CLQ-treated and untreated cells (mean fold ± SD accumulation of LC3B-II in samples treated with CLQ compared to the vehicle control; vehicle control value = 1, dashed line) (n ≥ 10 mice/group). (E) Flow cytometric analysis of LC3-FITC staining of splenic B cells from WT and p66shc-/- mice (≥ 2 mice/exp, n ≥ 3). Cells were either untreated or treated for 1 h with the lysosome inhibitor ‘Autophagy Reagent A’ (CLQ) (n ≥ 3). The histogram shows the mean fold accumulation of LC3+ cells compared to the vehicle control (vehicle control value = 1, dashed line). The asterisks above each graph column indicate the statistical significance compared to the vehicle control. The data are expressed as mean± SD. ***P ≤ 0.001; **P ≤ 0.01; *P ≤ 0.05 (Student’s t-test).
![Figure 2. p66SHC promotes B cell autophagy. (A) Immunoblot analysis of the autophagy marker LC3B in lysates of ctr and p66 cells untreated or treated for 1 h with a downstream inhibitor of the autophagy pathway, chloroquine (CLQ). ACTB was used as loading control. The histogram shows the quantification of autophagy flux [Citation80] as the difference in LC3-II:ACTB between CLQ-treated and untreated cells (mean fold ± SD accumulation of LC3B-II in samples treated with CLQ compared to the vehicle control; vehicle control value = 1, dashed line; see also the Methods section) (n ≥ 3). (B) Flow cytometric analysis of LC3-FITC staining of the ctr and p66 cells untreated or treated for 1 h with the commercial lysosome inhibitor ‘Autophagy Reagent A’ (CLQ) (n ≥ 3). The histogram shows the mean fold accumulation of LC3+ cells treated with the ‘Autophagy Reagent A’ compared to the vehicle control (vehicle control value = 1, dashed line). (C) Left, quantification of the ratio between the fluorescence intensity of GFP-LC3 and RFP-LC3ΔG in ctr and p66 cells transiently transfected with the pMRX-IP-GFP-LC3-RFP-LC3ΔG construct and labeled with anti-GFP and anti-RFP antibodies (≥ 10 cells/sample, n = 3). Right, representative images (medial optical sections) are shown. Size bar: 5 μm. (D) Immunoblot analysis of LC3B in lysates of splenic B cells from WT and p66shc-/- mice treated with or without CLQ. ACTB was used as a loading control. The histogram shows the quantification of autophagy flux as the difference in LC3-II:ACTB between CLQ-treated and untreated cells (mean fold ± SD accumulation of LC3B-II in samples treated with CLQ compared to the vehicle control; vehicle control value = 1, dashed line) (n ≥ 10 mice/group). (E) Flow cytometric analysis of LC3-FITC staining of splenic B cells from WT and p66shc-/- mice (≥ 2 mice/exp, n ≥ 3). Cells were either untreated or treated for 1 h with the lysosome inhibitor ‘Autophagy Reagent A’ (CLQ) (n ≥ 3). The histogram shows the mean fold accumulation of LC3+ cells compared to the vehicle control (vehicle control value = 1, dashed line). The asterisks above each graph column indicate the statistical significance compared to the vehicle control. The data are expressed as mean± SD. ***P ≤ 0.001; **P ≤ 0.01; *P ≤ 0.05 (Student’s t-test).](/cms/asset/bbab301f-abc8-4b2f-99f7-0040ceef233e/kaup_a_1505153_f0002_oc.jpg)
Similar results were obtained when the autophagic flux was measured using a reporter encoding acid-sensitive GPF-tagged LC3 and acid-resistant RFP-tagged LC3 [Citation30] transiently transfected in ctr or p66SHC-expressing MEC cells (). Consistent with the pro-autophagic function of p66SHC, the autophagic flux was reduced in p66shc-/- B cells compared to wild-type B cells (). Of note, no significant increase in autophagic flux was observed when either control or p66SHC-expressing MEC cells were treated with the MTOR inhibitor Torin1, despite the fact that MTOR autophosphorylation was effectively inhibited under these conditions (Fig. S1A). Moreover, whereas MTOR inhibition has been implicated in mitophagy induction and reduced ROS production [Citation31], Torin1 treatment did not reverse the increase in ROS levels elicited by p66SHC expression (Fig. S1B). This suggests that, at variance with B cell proliferation and differentiation, which require MTOR [Citation32], B cell autophagy is MTOR-independent under homeostatic conditions. Moreover the data indicate that the pro-autophagic function of p66SHC can be accounted for at least in part by the metabolism-related activation of AMPK. Collectively, these results support a role for p66SHC as a promoter of homeostatic autophagy in B cells, which results from its ability to modulate the AMPK pathway by decreasing ATP production.
p66SHC forms a complex with LC3-II and p-AMPK at cell membranes
Based on its ability to act as a multifunctional adaptor, we hypothesized that p66SHC might promote autophagy not only by having an impact on cellular metabolism but also by facilitating the recruitment of components of the autophagic machinery or autophagy regulators to target molecules and/or organelles. Scanning the amino acid sequence of p66SHC revealed the presence of 3 putative LIR motifs, one of which is localized in the unique N-terminal CH2 domain that characterizes this SHC1 isoform compared to the shorter p52SHC and p46SHC isoforms. The ability of p66SHC to interact with LC3 was addressed in co-immunoprecipitation experiments on post-nuclear supernatants from a stable MEC transfectant expressing GFP-tagged p66SHC. p66SHC was found to associate with LC3, with a preference for the lipidated form (). This interaction was confirmed in the reciprocal immunoprecipitation using anti-LC3 antibody ().
Figure 3. p66SHC interacts with LC3B-II and p-AMPK through an N-terminal LIR motif. (A) Immunoblot analysis of GFP-specific immunoprecipitates from lysates of GFP-p66SHC-expressing cells (n = 3). (B) Immunoblot analysis of LC3B-immunoprecipitates from lysates of GFP-p66SHC-expressing cells (n = 3). (C) Immunoblot analysis of SHC- immunoprecipitates from lysates of ctr and p66 cells obtained using an anti-pan-SHC1 antibody (n = 3). (D) Schematic presentation of the 3 isoforms of SHC1 (p46, p52 and p66) and the respective domains, namely the N-terminal collagen-homology domain (CH2), the CYCS-binding domain (CB), the phosphotyrosine-binding domain (PTB), the internal collagen homology domain (CH1) and the C-terminal SRC-homology domain 2 (SH2). The 3 putative LIR motifs highlighted as gray boxes on the SHC1 isoforms span p66SHC residues 10–13, 427–430 and 549–552. The YNPL LIR motif (residues 10–13) in the CH2-domain was mutated to ANPA. (E) Immunoblot analysis of GFP-specific immunoprecipitates from lysates of MEC transfectants expressing GFP-tagged wild-type p66SHC (wtLIR) or the GFP-tagged p66-mLIR mutant (mLIR). Preclearing controls (proteins that bound to protein-A–Sepharose before the addition of primary antibody) are included in each blot (neg ctr). Total cell lysates were included in each gel to identify the migration of the proteins tested. The immunoblots shown are representative of 3 independent experiments.
Of the 3 SHC1 isoforms only p66SHC was able to interact with LC3-II, as assessed in immunoprecipitation experiments carried out on ctr MEC cells (which lack p66SHC) [Citation24] and their p66SHC-reconstituted counterparts, using an anti-panSHC antibody (). This result suggests that the interaction between p66SHC and LC3-II is mediated by the putative LIR motif falling in the unique CH2 domain of p66SHC. To test this hypothesis, the LIR motif was mutagenized from YNPL to ANPA, a modification that is expected to abrogate LC3 binding () [Citation33,Citation34]. At variance with wild-type p66SHC (p66GFP), the p66SHC LIR mutant (p66GFP-mLIR) was unable to associate with LC3 (). This result validates the YNPL sequence in the CH2 domain as a LIR motif and provides evidence of a direct interaction between p66SHC and LC3-II.
After its cleavage from LC3 by the protease ATG4 and lipidation by a conjugation system consisting of several ATG proteins, LC3-II associates with the membrane of the nascent phagophore [Citation35]. The ability of p66SHC to interact with LC3-II suggests that the complex may form at intracellular membranes. To assess this possibility p66SHC was immunoprecipitated from cytosolic and membrane fractions obtained from the p66SHC MEC transfectant. Immunoblot analysis of fractionated control and p66SHC-expressing cells showed that, as expected, LC3-II was selectively associated with the membrane fractions (). A proportion of LC3-I was also detected in the membrane fractions, similar to what reported by others [Citation36]. While the major pool of p66SHC was present in the cytosolic fractions (), LC3-II was mainly co-immunoprecipitated by the membrane-associated p66SHC pool, as assessed using the MEC transfectant expressing GFP-tagged p66SHC (). Hence p66SHC interacts with LC3-II at cellular membranes, suggesting that it may act as a receptor to recruit phagophore membranes to target macromolecules and/or organelles.
Figure 4. p66SHC forms a complex with LC3-II and p-AMPK at cell membranes. (A) Immunoblot analysis of LC3B, SHC1, p-AMPK and AMPK in cytosolic (C) and membrane (M) fractions from ctr and p66 cell lysates. The histograms in the lower part of the panel show the quantification of LC3B-I, LC3B-II, p-AMPK and p-AMPK:AMPK in multiple experiments (n ≥ 3). The cis-Golgi marker GOLGA2/GM130 was used to assess the purity of membrane fractions. The samples in the figure belong to the same immunoblot. (B) Immunoblot analysis of GFP-specific immunoprecipitates from lysates of cytosolic (C) and membrane (M) fractions from lysates of GFP-p66SHC-expressing MEC cells. The histogram in the lower part of the panel shows the quantification of LC3B-II and p-AMPK in multiple experiments (n ≥ 3). (C) Immunoblot analysis of p66 in cell membranes fractionated on 10–30% iodixanol gradients. The graph in the right part of the panel shows the quantification (%) of LAMP1, p66SHC and LC3B-II in each fraction vs total specific protein (n = 3). The data are expressed as mean± SD. ****P ≤ 0.0001; ***P ≤ 0.001; **P ≤ 0.01; *P ≤ 0.05 (one-way ANOVA and Student’s t-test).
To further clarify this issue, membrane fractions from p66SHC-expressing MEC cells were subjected to iodixanol gradient fractionation to discriminate between subcellular membrane compartments [Citation37]. Immunoblot analysis of the individual fractions showed a strong enrichment of LC3-II in the fractions positive for the lysosomal/autolysosomal marker LAMP1, as expected. The membrane pool of p66SHC was selectively enriched in these fractions (), consistent with the notion that p66SHC associates with phagophore and subsequently autophagosomal and autolysosomal membranes by interacting with LC3-II.
Interestingly, testing the p66SHC immunoprecipitates from post-nuclear supernatants for AMPK revealed that AMPK is constitutively associated with p66SHC (). Probing the same samples with an anti-p-AMPK showed a strong immunoreactive band (), indicating that p66SHC has the ability to interact with active AMPK. This interaction was not observed when similar experiments were carried out with the p66-mLIR mutant (). The finding that AMPK was found to also co-immunoprecipitate with LC3 () suggests that the AMPK recruitment to p66SHC may be indirectly mediated by LC3. Interestingly, p-AMPK was specifically enriched in membrane fractions in both control and p66SHC-expressing MEC cells (). Moreover the membrane-associated p66SHC pool preferentially interacted with p-AMPK compared to the cytosolic pool (). Taken together, these data provide evidence that p66SHC forms a complex with LC3-II and active AMPK at cell membranes.
Both the CYCS binding site and the LIR motif are required for the pro-autophagic activity of p66SHC
The ability of p66SHC to increase intracellular ROS relies on specific amino acid residues located in 2 different domains of the protein: i) a phosphorylatable serine at position 36 (S36) in the CH2 domain that is unique to the p66SHC isoform, which prevents the nuclear translocation of the transcription factor FOXO3 thereby suppressing the expression of ROS scavenger enzymes; and ii) 2 glutamic acid residues at positions 132 and 133 (E132-E133), located within a short domain shared by the p66SHC and p52SHC isoforms, that bind and oxidize CYCS in the mitochondrial intermembrane space thereby interrupting the respiratory chain (Fig. S2A) [Citation25].
To identify the molecular determinants responsible for the pro-autophagic activity of p66SHC, we measured autophagy in MEC B cells stably transfected with plasmids encoding 2 p66SHC mutants where these critical amino acid residues have been substitued to impair its pro-oxidant function, namely p66SHC-SA (p66SA, carrying a S→A substitution at position 36) and p66SHC-QQ (p66QQ, carrying E→Q substitutions at positions 132 and 133; EE132,133QQ) (Fig. S2A). Immunoblot analysis of mitochondria purified from the p66 MEC transfectant confirmed that, similar to other cell types, a pool amounting to approximately 20% (20.3% ± 5.2%) of the cellular content of p66SHC is associated with mitochondria in B cells (Fig. S2B).
No differences in autophagic flux were observed between MEC B cells expressing wild-type p66SHC or the p66SA mutant (). Conversely, the enhancement in autophagic flux observed in the presence of p66SHC was abrogated in cells expressing either p66QQ or p66GFP-mLIR (). Of note, the dissipation of mitochondrial membrane potential observed in the presence of p66SHC was rescued by the EE132,133QQ mutation, but was maintained in cells expressing either p66-mLIR or p66SA, consistent with the integrity of the CYCS binding site in these mutants (). These results suggest that p66SHC primes B cells for autophagy by impairing mitochondrial function through its CYCS binding domain, but ensures its execution by recruiting phagophore membranes to damaged organelles or macromolecules through its ability to interact with LC3-II. Moreover, since the QQ mutation selectively affects the ability of p66SHC to bind CYCS and disrupt the respiratory chain in mitochondria [Citation25], these results implicate the mitochondrial pool of p66SHC in the regulation of B-cell autophagy.
Figure 5. The pro-autophagic activity of p66SHC requires both the CYCS-binding site and the LIR motif. (A,B) Immunoblot analysis of LC3B in lysates of the ctr, p66, p66QQ and p66SA MEC transfectants (A) or of the MEC transfectants expressing GFP-tagged wild-type p66SHC (p66GFP) or the GFP-tagged p66SHCLIR mutant (p66GFP-mLIR) (B), untreated or treated with CLQ. ACTB was used as loading control. The histograms show the quantification of autophagy flux [Citation80] as the difference in LC3-II:ACTB between CLQ-treated and untreated cells (mean fold ± SD accumulation of LC3B-II in samples treated with CLQ compared to the vehicle control; vehicle control value = 1, dashed line; see also the Methods section) (n ≥ 3). The asterisks above each graph column indicate the statistical significance compared to the vehicle control. (C) Flow cytometric analysis of FITC-LC3 staining of the ctr, p66, p66SA, p66QQ transfectants, as well as of the transfectants expressing GFP-tagged wild-type p66SHC (p66GFP) or the GFP-tagged p66SHC LIR mutant (p66GFP-mLIR). Cells were either untreated or treated for 1 h with the commercial lysosome inhibitor ‘Autophagy Reagent A’ (CLQ) (n ≥ 3). The histogram shows the mean fold accumulation of LC3+ cells compared to the vehicle control (vehicle control value = 1, dashed line). (D) Flow cytometric analysis of the TMRM-loaded transfectants. The histogram shows the percentages of TMRMlow (depolarized) cells (n ≥ 3). (E) Flow cytometric analysis of ANXA5-7-AAD staining of the ctr cells and transfectants expressing GFP-tagged wild-type p66SHC (p66GFP) or the GFP-tagged p66SHC LIR mutant (p66GFP-mLIR). Cells were either untreated or treated for 40 min with 2 μg/ml A23187 (n ≥ 3). The histogram shows the percentages of ANXA5+ 7-AAD- cells. The data are expressed as mean± SD. ****P ≤ 0.0001; ***P ≤ 0.001; **P ≤ 0.01; *P ≤ 0.05 (one-way ANOVA).
![Figure 5. The pro-autophagic activity of p66SHC requires both the CYCS-binding site and the LIR motif. (A,B) Immunoblot analysis of LC3B in lysates of the ctr, p66, p66QQ and p66SA MEC transfectants (A) or of the MEC transfectants expressing GFP-tagged wild-type p66SHC (p66GFP) or the GFP-tagged p66SHCLIR mutant (p66GFP-mLIR) (B), untreated or treated with CLQ. ACTB was used as loading control. The histograms show the quantification of autophagy flux [Citation80] as the difference in LC3-II:ACTB between CLQ-treated and untreated cells (mean fold ± SD accumulation of LC3B-II in samples treated with CLQ compared to the vehicle control; vehicle control value = 1, dashed line; see also the Methods section) (n ≥ 3). The asterisks above each graph column indicate the statistical significance compared to the vehicle control. (C) Flow cytometric analysis of FITC-LC3 staining of the ctr, p66, p66SA, p66QQ transfectants, as well as of the transfectants expressing GFP-tagged wild-type p66SHC (p66GFP) or the GFP-tagged p66SHC LIR mutant (p66GFP-mLIR). Cells were either untreated or treated for 1 h with the commercial lysosome inhibitor ‘Autophagy Reagent A’ (CLQ) (n ≥ 3). The histogram shows the mean fold accumulation of LC3+ cells compared to the vehicle control (vehicle control value = 1, dashed line). (D) Flow cytometric analysis of the TMRM-loaded transfectants. The histogram shows the percentages of TMRMlow (depolarized) cells (n ≥ 3). (E) Flow cytometric analysis of ANXA5-7-AAD staining of the ctr cells and transfectants expressing GFP-tagged wild-type p66SHC (p66GFP) or the GFP-tagged p66SHC LIR mutant (p66GFP-mLIR). Cells were either untreated or treated for 40 min with 2 μg/ml A23187 (n ≥ 3). The histogram shows the percentages of ANXA5+ 7-AAD- cells. The data are expressed as mean± SD. ****P ≤ 0.0001; ***P ≤ 0.001; **P ≤ 0.01; *P ≤ 0.05 (one-way ANOVA).](/cms/asset/2378258e-d305-4c06-996c-87f7727ffeb5/kaup_a_1505153_f0005_b.gif)
Disruption of mitochondrial function through CYCS binding is also responsible for the pro-apoptotic activity of p66SHC, as demonstratred by the fact that the p66QQ mutant fails to induce apoptosis [Citation38–Citation41]. To assess whether the LIR-dependent pro-autophagic activity of p66SHC affects this function, apoptosis was measured by flow cytometric analysis of Annexin 5 (ANXA5) and 7-aminoactinomycin D staining in the MEC transfectants expressing p66SHC or the p66-mLIR mutant. Cells were analyzed either under basal conditions or following treatment with the calcium ionophore A23187, which promotes apoptosis by inducing calcium overload. Apoptosis was enhanced both under basal conditions and following A23187 treatment in MEC cells expressing the p66-mLIR mutant (). This finding indicates that the pro-autophagic activity of p66SHC is implicated in the regulation of B cell survival and suggests that the apoptotic function of p66SHC is self-contained by its pro-autophagic activity.
p66SHC promotes mitophagy in B cells
Depolarized mitochondria are targeted for autophagy mainly by the PINK1-PRKN/PARKIN pathway [Citation42]. Following phosphorylation by PINK1, which is stabilized at the outer mitochondrial membrane (OMM) of depolarized mitochondria, PRKN ubiquitinates proteins at the mitochondrial surface. Similar to the autophagy receptor SQSTM1/p62, these are recognized by AMPK, which activates locally the autophagy-initiating complex component ULK1 [Citation3]. The dissipation of the mitochondrial membrane potential that we observe in the presence of p66SHC () suggests that p66SHC might i) sensitize cells to chemical mitochondrial uncouplers, and ii) target depolarized mitochondria to phagophores through its pro-autophagic activity.
To address these issues we first compared the loss of mitochondrial membrane potential in control and p66SHC-expressing MEC cells treated with a combination of oligomycin and antimycin A (OA), which are known to induce mitochondrial depolarization and trigger mitophagy [Citation43]. A more robust dissipation in mitochondrial transmembrane potential was observed in OA-treated p66SHC-expressing B cells compared to the control transfectant (), which is likely to be accounted for by the ability of p66SHC to promote mitochondria depolarization under basal conditions, thereby enhancing the susceptibility of mitochondria to OA-mediated uncoupling. This effect was abrogated in cells expressing the p66QQ mutant (), indicating that p66SHC enhances the susceptibility of B cells to chemical mitochondrial inhibitors, and that this ability depends on CYCS binding and ROS production. Conversely, mitochondrial depolarization was still observed in cells expressing the p66-mLIR mutant (). These results are consistent with a role for the ROS generated as a result of the interruption of the respiratory chain in the mitochondrial defects observed in p66SHC-expressing cells [Citation25], and places the p66SHC-LC3-II interaction downstream of mitochondria depolarization.
Figure 6. p66SHC promotes mitochondrial inhibitor-induced mitophagy in B cells. (A) Flow cytometric analysis of TMRM-loaded ctr, p66, p66QQ, p66GFP and p66GFP-mLIR cells untreated or treated for 1 h with the mitophagy inducers oligomycin mix (A, B and C isomers) and antimycin A (OA). The histogram shows the percentages of TMRMlow (depolarized) cells (n ≥ 3). (B) Immunoblot analysis of MT-CO2/COXII and COX4I1/COXIV in ctr MEC cells or the MEC transfectants expressing wild-type p66SHC (p66) or the p66SHC-QQ (p66QQ) mutant, or GFP-tagged wild-type p66SHC (p66GFP) or the GFP-tagged p66SHC LIR mutant (p66GFP-mLIR), untreated or treated for 24 h with OA. ACTB was used as a loading control. (C) Quantification of MT-CO2 and COX4I1 in samples treated and analyzed as in B (n ≥ 3). (D) Left, quantification using Mander’s coefficient of the weighted colocalization of mCherry-GFP-FIS1 in the ctr and p66 MEC transfectant stably transfected with the mCherry-GFP-FIS1 construct, untreated or treated for 24 h with OA and labelled with anti-GFP and anti-RFP antibodies (≥ 10 cells/sample, n = 3). Right, representative images (medial optical sections) are shown. Size bar: 5 μm. The data are expressed as mean± SD. ****P ≤ 0.0001; ***P ≤ 0.001; **P ≤ 0.01; *P ≤ 0.05 (one-way ANOVA).
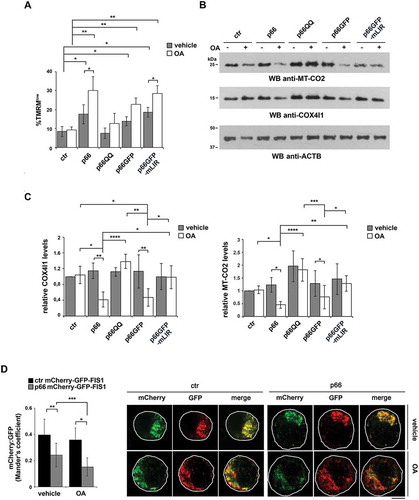
To further investigate the role of p66SHC in B-cell mitophagy, we carried out an immunoblot analysis of lysates from the MEC transfectants either untreated or treated with OA, using antibodies against the inner mitochondrial membrane (IMM) proteins MT-CO2/COX-II and COX4I1/COX-IV. OA treatment resulted in a striking decrease in the levels of these mitochondrial proteins in p66SHC-expressing cells compared to ctr MEC cells (), indicating that mitochondria are more susceptible to mitophagy in the presence of p66SHC. In support of these findings, mitophagy was found to be enhanced in the presence of p66SHC as assessed by imaging cells stably transfected with the mCherry-GFP-FIS1 mitophagy reporter (). These effects were not observed in cells expressing either p66QQ or p66-mLIR (), indicating that p66SHC-dependent mitophagy requires both its CYCS binding domain and the LIR motif. Of note, we also monitored mitophagy induction in p66 cells during hypoxia, which is a condition physiologically experienced by B cells in the germinal centers [Citation44,Citation45]. For these experiments we used degradation of the OMM protein TOMM20 and the IMM protein TIMM23 as markers of hypoxia-induced autophagy [Citation46]. Immunoblot analysis showed that TOMM20 was expressed at comparable levels in ctr and p66 cells, while TIMM23 was upregulated in the presence of p66SHC (). Nonetheless, both proteins underwent a substantial drop in p66 cells beginning from 24 h of hypoxia, while a reduction in their levels could be observed in ctr cells only after 48 h (). Hence p66SHC enhances hypoxia-induced mitophagy.
Figure 7. p66SHC promotes hypoxia-induced mitophagy in B cells. Immunoblot analysis of TIMM23 and TOMM20 in ctr or MEC transfectants expressing wild-type p66SHC (p66), under normoxic (Norm.) or hypoxic conditions (8–48 h 1% O2). ACTB was used as a loading control. The histograms in the lower part show the quantification of the relative TIMM23 and TOMM20 levels in each transfectant over time (n = 3). The levels of TOMM20 are comparable in ctr and p66 cells under normoxia, while the levels of TIMM23 are 2.4 ± 0.3 fold (mean± SD, n = 3) higher in p66 cells compared to ctr cells under the same conditions. The data are expressed as mean± SD. ***P ≤ 0.001; **P ≤ 0.01; *P ≤ 0.05 (one-way ANOVA).
Mitochondrial fission is a prerequisite for mitophagy [Citation47]. This process is regulated by the cytoplasmic dynamin-related protein DNM1L/DRP1, which translocates to depolarized mitochondria to form the core fission complex with the OMM proteins FIS1 and MFF. Conversely fusion, which is regulated by the dynamin-like GTPases OPA1 and MFN1 at the IMM, is inhibited in damaged mitochondria through the degradation of OPA1 [Citation47]. To assess whether p66SHC-dependent mitophagy was coupled to mitochondrial dynamics, we carried out an immunoblot analysis of OPA1, DNM1L and MFN1 on lysates of ctr and p66SHC-expressing MEC cells. Consistent with the loss of mitochondrial transmembrane potential, the levels of OPA1 and MFN1 were decreased in the presence of p66SHC, with a concomitant increase in the levels of DNM1L (Fig. S3). Hence mitochondrial fission is associated with p66SHC-dependent mitophagy.
OMM protein ubiquitination, which tags depolarized mitochondria for autophagic clearance [Citation48], was enhanced in mitochondria purified from p66 MEC cells, as assessed by immunoblot with an anti-pan-ubiquitin antibody (, left panel), in line with their enhanced depolarization. This was paralleled by an increase in mitochondria-associated p
-AMPK and LC3-II (, right panel). In agreement with the ability of AMPK to trigger mitophagy by phosphorylating the autophagy-initiating kinase ULK1 and promoting its recruitment to mitochondria [Citation49,Citation50], the mitochondrial association of the autophagosome-nucleating complex components BECN1/Beclin 1 and PIK3C3/VPS34 was found to be increased in p66SHC-expressing cells upon OA treatment (Fig. S4). Immunoprecipitation experiments on lysates of mitochondria purified from MEC cells expressing GFP-tagged p66SHC showed that mitochondria-associated p66SHC was able to interact with both LC3-II and p-AMPK (). Hence, in addition to promoting mitophagy by impairing mitochondrial function, p66SHC acts as a receptor to recruit both phagophore membranes and the autophagy-initiating kinase AMPK to mitochondria.
Figure 8. p66SHC recruits LC3B-II and p-AMPK to depolarized mitochondria. (A,B) Immunoblot analysis of ubiquitin (left panel) or LC3B and p-AMPK (central and right panel) in lysates from purified mitochondria of the ctr and p66 MEC transfectants (A) or of the MEC transfectants expressing GFP-tagged wild-type p66SHC (p66GFP) or the GFP-tagged p66SHC LIR mutant (p66GFP-mLIR) (B), untreated or treated for 1 h with OA (n ≥ 3). PHB was used to assess the purity of mitochondrial fractions. The histograms in the lower part of central and right panel A-B show the quantification of LC3B and p-AMPK in multiple experiments (n ≥ 3). (C) Immunoblot analysis of GFP-specific immunoprecipitates from lysates of purified mitochondria from the MEC transfectants expressing GFP-tagged wild-type p66SHC (p66GFP) or the GFP-tagged p66SHC LIR mutant (p66GFP-mLIR) (n ≥ 3). Mitochondrial lysates were included in each gel to identify the migration of the proteins tested. (D) Immunoblot analysis of GFP-specific immunoprecipitates from lysates of purified mitochondria from the MEC transfectants expressing GFP-tagged wild-type p66SHC (p66GFP), untreated or treated for 3 h with OA, alone or in combination with epoxomicin (n = 3). The immunoblots shown are representative of 3 independent experiments. The data are expressed as mean± SD. **P ≤ 0.01; *P ≤ 0.05 (one-way ANOVA).
Interestingly, an enhancement in protein ubiquitination was also observed in cells expressing the p66SHC LIR mutant, in agreement with its ability to bind CYCS and induce mitochondria depolarization (, left panel). Both the recruitment of p-AMPK and LC3-II to mitochondria and the interaction of mitochondria-associated p66SHC with LC3-II and p-AMPK were, however, found to be strictly dependent on the integrity of the p66SHC LIR motif ( right panel, ). Hence the ability of p66SHC to disrupt mitochondrial function is important to prime B cells for mitophagy but its execution requires its ability to act as an LC3-II receptor.
Upon mitochondrial damage, proteasome-dependent rupture of the OMM occurs, thus allowing the exposure of proteins resident in the IMM-IMS to the cytosol [Citation51–Citation53]. Given the IMS localization of p66SHC, we hypothesized that this could also apply to p66SHC. Immunoblot analysis of purified mitochondria treated with trypsin showed that, consistent with its localization in the IMS, p66SHC was partially resistant to trypsin, at variance with proteins associated with the OMM (e.g., TOMM20), which underwent degradation. On the contrary, proteins associated with the IMM, such as PHB (prohibitin), were completely unaffected (Fig. S5). Notably, enhanced susceptibility of p66SHC to trypsin-mediated degradation was observed when mitophagy was induced by OA treatment (Fig. S5). These data support the notion that, due to the defects in OMM integrity, which are observed already under basal conditions in p66SHC-expressing cells and which are exacerbated following mitophagy induction, IMS-associated p66SHC becomes exposed to the cytosol, making it accessible to LC3-II and AMPK.
The IMM-associated receptor, PHB2, has been recently shown to act as an autophagy receptor, acquiring the ability to interact with LC3-II following proteasome-mediated degradation of the OMM in response to a mitochondrial uncoupling agent [Citation54]. To understand whether a similar process occurs during B cell mitophagy, p66SHC was immunoprecipitated from mitochondria purified from cells treated with OA in the presence or absence of the proteasome inhibitor epoxomicin, and its interaction with LC3-II was assessed by immunoblot. Epoxomicin treatment impaired the ability of p66SHC to interact with LC3-II (). This result indicates that proteasome-mediated degradation of the OMM, likely favored by the dissipation in the mitochondrial transmembrane potential that can be observed even under basal conditions in p66SHC-expressing cells and that is enhanced by OA, allows for IMS-resident p66SHC to interact with LC3-II-decorated phagophore membranes.
As a complement to these experiments, the association of LC3 with mitochondria was assessed by confocal imaging of control and p66SHC-expressing MEC cells co-stained for LC3 and the mitochondrial marker TOMM20. A significant aggregation of mitochondria with the features of mito-aggresomes [Citation55] was observed in the presence of p66SHC, not only following induction of mitophagy, but also under basal conditions ( and ), consistent with its pro-mitophagic function. A colocalization analysis showed that the number of LC3+ puncta colocalizing with mitochondria was higher in p66SHC-expressing cells compared to empty vector controls both under basal conditions and following treatment with OA, while no difference was observed in non-mitochondrial LC3+ puncta (). Co-staining the MEC transfectants with anti-p-AMPK () or anti-ubiquitin () antibodies and TOMM20 revealed that p-AMPK and ubiquitinated proteins also showed a punctate pattern, which partly colocalized with mitochondria. The number of pAMPK+ or Ub+ dots specifically colocalizing with mitochondria was higher in p66SHC-expressing cells, with a further increase following OA treatment (, ). Taken together, these results strongly support a role for p66SHC in B-cell mitophagy involving the recruitment of p-AMPK and LC3-II to the surface of ubiquitinated depolarized mitochondria.
Figure 9. p66SHC promotes the association of LC3B and p-AMPK with mitochondria. (A) Left, quantification of LC3B+ dots colocalizing with mitochondria (identified as TOMM20+ dots) in ctr and p66 cells untreated or treated for 1 h with OA (≥ 10 cells/sample, n = 3). Note that the levels of TOMM20, which as an OMM protein undergoes degradation during mitophagy, were not affected at this time point, as assessed by immunoblot of purified mitochondria (87±0.07% in OA-treated vs vehicle-treated ctr cells; 94±0.14% in OA-treated vs vehicle-treated p66 cells). Right, quantification of non-mitochondrial LC3B+ dots (LC3B+ TOMM20-) in ctr and p66 cells untreated or treated for 1 h with OA (≥ 10 cells/sample, n = 3). Representative images (medial optical sections) are shown below each histogram. (B) Left, quantification of p-AMPK+ dots colocalizing with mitochondria (TOMM20+) in ctr and p66 cells untreated or treated for 1 h with OA (≥ 10 cells/sample, n = 3). Right, quantification of non-mitochondrial p-AMPK+ dots (p-AMPK+ TOMM20-) in ctr and p66 cells untreated or treated for 1 h with OA (≥ 10 cells/sample, n = 3). Representative images (medial optical sections) are shown below each histogram. The insets in the bottom left corner of the corresponding image in panels A and B are shown at a higher magnification (x 2.5). Size bar: 5 μm. The data are expressed as mean± SD. ****P ≤ 0.0001; ***P ≤ 0.001; *P ≤ 0.05 (one-way ANOVA).
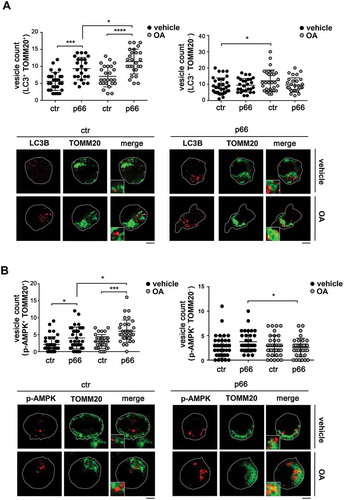
Figure 10. p66SHC promotes mitochondria ubiquitination and PRKN recruitment. (A) Left, quantification of ubiquitin+ dots colocalizing with mitochodria (TOMM20+) in ctr and p66 cells untreated or treated for 1 h with OA (≥ 10 cells/sample, n = 3). Right, quantification of non-mitochondrial ubiquitin dots (Ub+ TOMM20-) in ctr and p66 cells untreated or treated for 1 h with OA (≥ 10 cells/sample, n = 3). Representative images (medial optical sections) are shown below each histogram. (B) Left, quantification of PRKN+ dots colocalizing with TOMM20+ in ctr and p66 cells untreated or treated for 1 h with OA (≥ 10 cells/sample, n = 3). Right, quantification of non-mitochondrial PRKN+ dots (PRKN+ TOMM20-) in ctr and p66 cells dots (≥ 10 cells/sample, n = 3). Representative images (medial optical sections) are shown below each histogram. The insets in the bottom left corner of the corresponding image in panels A and B are shown at a higher magnification (x 2.5). Size bar: 5 μm. The data are expressed as mean± SD. ****P ≤ 0.0001; *P ≤ 0.05 (one-way ANOVA).
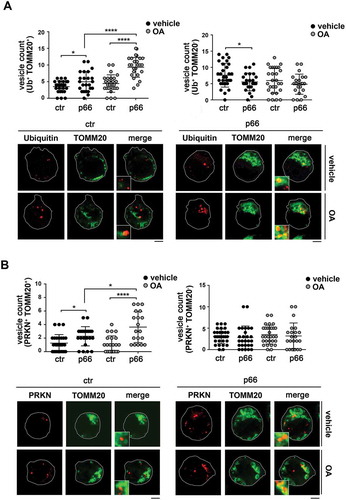
Figure 11. p66SHC limits B cell differentiation to plasma cells. Flow cytometric analysis of differentiation of splenic B cells from wild-type (WT) and p66shc-/- mice (n ≥ 4/group) monitored by SDC1/CD138 and IgG1 expression on day 4 following activation with lipopolysaccharide (LPS) in the presence of IL4 (to induce CSR) or IL5 (to induce plasma cell differentiation). The histograms show the percentages of SDC1/CD138+ (plasma cells) and IgG1+ (class-switched cells) cells. The data are expressed as mean± SD. ***P ≤ 0.001; *P ≤ 0.05 (Student’s t-test).
Interestingly, a similar colocalization analysis of PRKN (which, together with PINK1, was found to be expressed in MEC cells; Fig. S6) and TOMM20 revealed an increase in the number of mitochondria positive for PRKN in the presence of p66SHC (). Since PRKN is largely responsible for the ubiquitination of surface proteins on depolarized mitochondria [Citation48], this finding suggests an implication of the PRKN-PINK1 pathway in p66SHC-dependent B cell mitophagy.
p66SHC limits the differentiation of activated B cells to plasma cells
Mitophagy and ROS have been implicated in plasma cell differentiation [Citation56,Citation57]. Interestingly, mitochondrial ROS have been recently demonstrated to provide instructions for stochastically distinct and mutually exclusive events that occur during the differentiation of activated B cells, namely class switch recombination (CSR) and plasma cell differentiation [Citation58]. Specifically, ROShigh B cells undergo preferentially CSR, while ROSlow B cells preferentially differentiate to plasma cells. To assess the potential impact of the p66SHC on B cell differentiation, splenic B cells purified from control and p66shc-/- mice were activated with lipopolysaccharide in the presence of either IL4, to promote CSR, or IL5, to promote plasma cell differentiation. Cells were analyzed by flow cytometry 4 days after activation, using IgG1 as a readout of CSR and SDC1/CD138 as a plasma cell marker. Consistent with the mitochondria-depolarizing and ROS-generating activity of p66SHC, plasma cell differentiation was found to be enhanced in activated p66shc-/- B-cells, with a concomitant reduction in CSR (). These results identify p66SHC as a novel regulator of B cell fate.
Discussion
The dual function of p66SHC as an adaptor that antagonizes survival signals as well as a pro-oxidant molecule that promotes apoptosis has been demonstrated in several cell types, including B cells [Citation59]. Here we provide evidence that, in B cells, p66SHC is also implicated in autophagy and mitophagy, thereby further affecting cell survival. Notably, this new function relies on 2 different properties of this protein: i) its ability to disrupt mitochondrial integrity, which induces autophagy and primes mitochondria for their degradation, and ii) its role as a mitophagy receptor, which mediates the engulfment of damaged mitochondria into phagophores.
The mitochondrial pool of p66SHC disrupts electron transport by binding CYCS, resulting in impaired ATP production and ROS generation [Citation25,Citation60]. In addition, p66SHC has been implicated in the control of the cellular energy balance by limiting glycolysis [Citation23]. We found that the mitochondrial and glycolytic dysfunctions associated with p66SHC in B cells cooperatively target the energy sensor AMPK, which is activated in response to the decrease in ATP, thereby promoting autophagy. Notably, the p66QQ mutant, which selectively affects the function of mitochondrial p66SHC [Citation25], fails to induce autophagy, supporting the notion that p66SHC-dependent autophagy is mediated to a large extent by the mitochondrial pool. In this context, it is noteworthy that AMPK has been reported to be activated by mitochondrial ROS [Citation49], suggesting an additional mechanism linking p66SHC to AMPK activation beside the alteration in the ATP:AMP balance.
MTOR activity is reduced in the presence of p66SHC, most likely as a consequence of the reduced ATP production, which triggers AMPK activation and therefore the inhibitory phosphorylation of TSC2 and RPTOR/RAPTOR, 2 MTORC1 regulators [Citation61]. However, at variance with its effects on metabolism [Citation23], the pro-autophagic function as well as the ROS-elevating activity of p66SHC are independent of MTOR, as assessed using the MTOR inhibitor Torin1. Interestingly, MTORC1 has been shown to promote ROS production in the liver by modulating the expression of NDUFS3, a pro-oxidant subunit of the electron chain transport complex I [Citation31]. The fact that p66SHC enhances ROS production [Citation25, Citation60] and the present report], notwithstanding the reduced MTOR activity observed in p66SHC-expressing cells, suggests that the functional link between MTOR, ROS and mitophagy might depend both on the specific pathway responsible for ROS generation and on the cellular context.
Interruption of the respiratory chain by p66SHC not only impairs ATP production but also results in dissipation of the mitochondrial transmembrane potential, triggering the ubiquitination of proteins on the OMM, which is a signal for the recruitment of the autophagy machinery for mitochondria degradation [Citation48]. Consistently, components of the autophagosome-nucleating complex, namely BECN1 and PIK3C3/VPS34, are targeted to the mitochondria in the presence of p66SHC. The enhanced association of p-AMPK with mitochondria in p66SHC-expressing B cells is likely to contribute significantly to the local assembly of autophagosomes. Indeed, active AMPK phosphorylates the kinase ULK1, promoting its recruitment to mitochondria to initiate autophagy [Citation50,Citation62]. Moreover mitochondrial damage or accumulation of ubiquitinated proteins has been reported to lead to AMPK activation and the AMPK-dependent recruitment of the PIK3C3/VPS34- and ATG16L1-containing complexes to mitochondria [Citation63–Citation65].
Whereas the mitochondrial dysfunctions resulting from p66SHC binding to CYCS are required for p66SHC-mediated B cell mitophagy, they are not sufficient to sustain its execution. Indeed, this function requires the ability of mitochondria-associated p66SHC to function as a mitophagy receptor through its direct binding to LC3-II. Interestingly, in addition to promoting the engulfment of damaged mitochondria by pre-formed phagophore membranes, this interaction is required for the recruitment of activated AMPK to the complex. This finding suggests that p66SHC is not only indirectly implicated in AMPK activation but may help by stabilizing active AMPK at mitochondria.
LC3-II-mediated recruitment of phagophore membranes to damaged organelles is exploited both by autophagy receptors associated with the OMM, such as BNIP3L/NIX, BNIP3 and FUNDC1 [Citation66], and by cytosolic proteins, such as SQSTM1/p62, OPTN, and others, that are recruited to damaged mitochondria [Citation67–Citation69]. Our data identify p66SHC as a new autophagy receptor that interacts with LC3-II through a LIR motif mapping within its N-terminal CH2 domain. This evidence, taken together with the presence of p66SHC-LC3-II complexes in purified mitochondria, supports a role for p66SHC as a novel mitochondria-associated LC3-II receptor. A major conundrum in the function of mitochondrial p66SHC as an autophagy receptor is its submitochondrial localization in the IMS, where it has access to CYCS, whereas LC3 would be expected to associate with the OMM. Recently ubiquitination of OMM proteins has been shown to result in OMM rupture, which leads to autophagic clearance of damaged mitochondria [Citation51–Citation53]. Consistent with this model, PHB2 has been identified as an IMM mitophagy receptor that can recruit LC3-II following OMM degradation by the proteasome [Citation54]. The inability of p66SHC to interact with LC3-II following cell treatment with a proteasome inhibitor under conditions of mitophagy delineates a similar scenario, whereby ubiquitination of depolarized mitochondria in the presence of p66SHC sets the conditions for proteasome-mediated degradation of the OMM, making IMS-associated p66SHC exposed to the cytosol and hence accessible for interaction with LC3-II to promote phagophore membrane recruitment. In support of this notion, we found that mitochondrial p66SHC was more susceptible to limited digestion with trypsin when cells were treated with a OA, which induce mitochondria damage [Citation67].
Whereas it was initially identified as a competitive inhibitor of the pro-mitogenic and pro-survival p52SHC isoform [Citation38], p66SHC has been directly implicated in apoptosis beyond its function as molecular adaptor [Citation70]. Our findings highlight a new, unexpected function for this protein as a positive regulator of autophagy-related cell survival in B cells. A similar opposite role in the control of cell survival has been reported for other proteins, such as TP53/p53 and PRKN [Citation71,Citation72]. The pro-apoptotic function of p66SHC crucially relies on its ability to promote ROS accumulation, which is dependent both on S36 in the CH2 domain and to E132-E133 in the CYCS binding domain [Citation25,Citation38,Citation41,Citation73]. Our results show that only the CYCS binding site (E132-E133) is required for inducing autophagy/mitophagy, likely due to its ability to elevate ROS levels at mitochondria. At variance, the LIR domain of p66SHC is essential for the execution of this process but is dispensable for and actually limits apoptosis. These results suggest that, from a starting point of cellular oxidative stress, p66SHC may integrate additional cues, acting as a molecular switch to direct the cell towards the alternative fates of apoptosis or autophagy. At a more general level, they highlight p66SHC as a potential hub where essential information on the cellular and environmental contexts is integrated to determine the biological outcome. In this respect, p66SHC has been suggested to protect neuronal cells from apoptosis in a model of ischemic preconditioning [Citation74].
Both canonical and noncanonical autophagy have been implicated in several steps of the life of B cells, namely development in the bone marrow, activation and differentiation in germinal centers, survival after differentiation to plasma cells and generation of memory cells [Citation16–Citation19,Citation56]. We have previously shown that p66SHC deficiency does not affect overall B cell development, whereas it limits the BCR-dependent activation of mature B cells both ex vivo and in vivo [Citation75], a function that can be accounted for, at least in part, by its ability to competitively inhibit p52SHC, thereby uncoupling the BCR from RAS and other effectors [Citation59]. Here we show that p66SHC controls a key step in Bcell differentiation, namely the stochastic processes of CSR versus differentiation to plasma cells, limiting the latter. This function is likely related to the ROS-elevating activity of p66SHC, because the levels of intracellular ROS determine the fate of the activated B cells [Citation58,Citation76]. Whether the ROS-related pro-autophagic/mitophagic activity of p66SHC directly contributes to this process remains to be understood. Nevertheless, our results showing that p66SHC promotes hypoxia-induced mitophagy, taken together with the recent finding that germinal centers are hypoxic [Citation44,Citation45], suggests a functional role for p66SHC-mediated mitophagy in differentiating B cells. Of note, a role for MTOR in B cell differentiation has been established [Citation77]. However, mature B cell subsets appear to be differentially controlled by MTOR, at least in part because of their different basal levels of MTOR activity [Citation78]. Moreover, specific roles are emerging for MTORC1 and MTORC2 in this process [Citation77]. Future studies will need to address whether the increase in MTOR phosphorylation, observed in p66shc-/- Bcells, also contributes to the ability of these cells to differentiate more efficiently to plasma cells.
By ensuring removal of damaged mitochondria, mitophagy promotes cell survival, as exemplified by ATG5- or PIK3C3/VPS34-deficient T cells, where impaired survival correlates with an increase in mitochondrial mass [Citation20,Citation21]. In this respect, our identification of p66SHC as a promoter of mitophagy has important physiological and pathological implications. Naïve B cells are very long-lived and must be protected from damage to maintain a functional repertoire. Similar considerations apply to the long-term survival of memory B cells, that has been shown to depend on autophagy [Citation18,Citation56]. p66SHC may contribute to this property by setting the balance between autophagic removal of damaged mitochondria and apoptotic cell demise of irreversibly damaged cells. In the pathological context of B-cell chronic lymphocytic leukemia, where we have demonstrated a deficiency in p66SHC expression that is causal to the extended survival of leukemic B cells [Citation22], we can hypothesize that damaged mitochondria may fail to be eliminated, contributing to genomic instability and tumor progression. These considerations warrant further studies to shed light onto the role of p66SHC in the control of B cell homeostasis through mitophagy and the relevance of its dysregulation to leukemia.
Materials and methods
Cells, plasmids and reagents
The human chronic lymphocytic leukemia-derived B-cell line MEC-1 B cells were used to generate all transfectants. The cells are p66SHC-deficient due to methylation of a CpG island in the gene promoter [Citation24]. Cells were grown at 37°C, 5% CO2, in RPMI (Sigma-Aldrich, R8758) containing 10% bovine calf serum (GE Healthcare HyClone, SH30072.03). A panel of MEC-1 cell lines stably transfected with pcDNA3.1 (empty vector, ctr; ThermoFisher Scientific, V79020), pcDNA3.1-p66SHC (p66), pEGFP-p66SHC (p66GFP) or the respective mutants p66SHC-SA (S→A substitution at position 36 [Citation73]) and p66SHC-QQ (EE→QQ substitutions at positions 132–133 [Citation25]) were previously described [Citation79]. A MEC-1 cell line stably transfected with the GFP-tagged p66LIR construct was also generated using pEGFP-p66LIR. Stably transfected cells were selected in G418 containing-medium at the final concentration of 1 mg/mL (Gibco-BRL/Life Technologies, 11,811–031). The expression of p66SHC protein was routinely checked by immunoblot. The morphology of the cells was not affected by either the mutations or the treatments at the time points analyzed, as assessed by interference contrast microscopy (data not shown). Ctr and p66 MEC-1 cell lines stably transfected with the mCherry-GFP-FIS1 [Citation43] construct were also generated. Stably transfected cells were selected both in G418- and hygromycin B-containing medium at the final concentration of 1 mg/mL (Gibco-BRL/Life Technologies, 11,811–031) and 0.2 mg/mL (Invitrogen, 10,687–010), respectively. The human embryonic kidney 293 (HEK293) and the cervical cancer-derived HeLa cell lines were used as positive and negative control for PRKN expression, respectively. Cells were grown at 37°C, 5% CO2, in DMEM (Sigma-Aldrich, D6429) containing 10% bovine calf serum (BCS).
All primary commercial antibodies used in this work are listed in , together with information about the dilutions used for immunoblotting, immunofluorescence and immunoprecipitation. Secondary peroxidase-labeled antibodies were from Jackson ImmunoResearch Laboratories (anti-mouse, 115–035-146; anti-rabbit, 111–035-144), and Alexa Fluor 488- and 555-labeled secondary antibodies were from ThermoFisher Scientific (anti-mouse 488, A11001; anti-rabbit 488, A11008; anti-mouse 555, A21422; anti-rabbit 555, A21428).
Table 1. Commercial antibodies.
Mice
The experiments on mice were carried out on p66shc-/- mice in the 129/Sv genetic background [Citation73]. These mice carry a homozygous deletion of the shc1 exon that encodes the unique CH2 domain of p66SHC, which results in the specific loss of p66SHC while leaving intact the expression of the p52SHC and p46SHC isoforms (see ) [Citation73].
Animals were bred in the animal facility at the University of Siena (Siena, Italy), on age- and sex-matched 2- to 9-month-old mice. All animal experiments were carried out in agreement with the Guiding Principles for Research Involving Animals and Human Beings and approved by the local ethics committee.
Mice were killed by cervical dislocation and the spleen was harvested to negatively purify splenic B cells by immunomagnetic sorting using the Dynabeads Mouse SPN/CD43 (ThermoFisher Scientific, 11422D) which resulted in > 85% purity as assessed by flow cytometry.
Analysis of mitochondrial membrane potential
Mitochondrial membrane potential was measured using the fluorescent probe TMRM (ThermoFisher Scientific, T668). After a treatment with OA (2.5 μg/ml oligomycin [mix of isomers A, B and C; Merck Millipore, 495,455] and 4 μM antimycin A [Sigma-Aldrich, A8674]) for 1 h, cells (106/sample) were suspended in 200 μl RPMI 1640 w/o phenol Red (Gibco/ThermoFisher Scientific, 11,835–063) containing 25 mM HEPES, pH 7.4 (Sigma-Aldrich, H3375) and 200 nM TMRM and incubated for 20 min at 37°C. Cells were then diluted to 1 ml with RPMI 1640 w/o phenol red added with 25 mM HEPES, pH 7.4 and acquired using a GUAVA flow cytometer (Merck Millipore).
Autophagy and mitophagy analysis
To monitor autophagic flux by western blot, cells (1x10⁶/sample) were either left untreated or treated for 1 h at 37°C with 40 μM chloroquine (Sigma-Aldrich, C6628). After the incubation time, cells were harvested and lysed in lysis buffer (1% Triton X-100 [AppliChem PanReac, A1388] in 20 mM Tris-HCl, pH 8.0, 150 mM NaCl, Protease Inhibitor cocktail [Calbiochem, 539,134]) for 20 min on ice and processed for immunoblotting. To induce autophagy, cells were treated for 1 h with 250 nM Torin1 (Tocris, 4247) (time of treatment chosen based on a time course analysis; see Figure S7A). The densitometric analysis of LC3-II and ACTB/actin was carried out using ImageJ. The autophagy flux, which is defined as the amount of autophagic degradation, was assessed by blocking LC3-II degradation through chloroquine treatment [Citation80]. The difference in LC3-II levels, normalized to ACTB, between chloroquine-treated and untreated cells was reported as autophagy flux in the graphs (see also legends to and ).
Measurements of autophagy fluxes by flow cytometry were carried out using the FlowCellect™ Autophagy LC3 Antibody-based Assay Kit (Merck Millipore, FCCH100171) according to the manufacturer’s instructions as described previously [Citation81,Citation82]. Briefly, cells (0.2x10⁶/sample) were either left untreated or treated for 1 h at 37°C with the lysosome inhibitor ‘Autophagy Reagent A’ (chloroquine; Merck Millipore, CS208212) provided in the kit (time of treatment chosen based on a time course analysis; see figure S7B). Cells were subsequently permeabilized and processed for flow cytometry according to the manufacturer’s instructions.
To monitor the autophagic flux by immunofluorescence, cells (5x10⁶/sample) were transiently transfected with the vector pMRX-IP-GFP-LC3-RFP-LC3ΔG (Addgene, 84,572; deposited by Noborou Mizushima) [Citation30] and analyzed 48 h post-transfection. The ratio between the fluorescence intensity of GFP-LC3 and RFP-LC3ΔG, either as such or following staining with anti-GFP and anti-RFP antibodies, was measured on median optical sections using ImageJ.
To monitor mitophagy, cells were either left untreated or treated for 24 h at 37°C with OA (time of treatment chosen based on a time course analysis; see figure S7C). After 24 h, cells were harvested and lysed in lysis buffer (1% Triton X-100 in 20 mM Tris-HCl, pH 8.0, 150 mM NaCl, Protease Inhibitor cocktail) for 20 min on ice and processed for immunoblotting. Where indicated, cells were pretreated for 1 h with the proteasome inhibitor epoxomicin (100 nM; Abcam, ab144598) prior to addition of OA for 3 h. Ctr and p66 MEC cells stably transfected with the vector mCherry-GFP-FIS1[Citation80] were harvested and processed for immunofluorescence either as such or following staining with anti-GFP and anti-RFP (which recognizes mCherry) antibodies. The quantitative colocalization analysis of mCherry-GFP-FIS1 was performed on median optical sections using ImageJ and JACoP plug-in to determine Manders’ coefficient M1 [Citation83], which represents the percentage of mCherry-LC3 pixels (red channel) that overlaps with GFP-LC3 pixels (green channel) (0 = no colocalization; 1 = 100% colocalization). None of the treatments affected cell viability at the concentrations and times chosen for the analyses, as assessed by trypan blue (Sigma-Aldrich, T8154) exclusion (Fig. S7D).
Immunofluorescence microscopy
After a treatment with OA for 1 h cells (0.1x10⁵/sample) were pelleted, washed twice in ice-cold PBS (Medicago, 09–9400-100) and allowed to adhere for 15 min on poly-L-lysine (Sigma-Aldrich, P1274)-coated wells of diagnostic microscope slides (Erie Scientific Company, ER-208B-CE24). For LC3B staining, cells were fixed in 4% paraformaldehyde (ThermoFisher Scientific, 28,908) for 10 min at room temperature (RT) and incubated 10 min in 50 mM NH4Cl to quench the excess of the reactive aldhehyde groups. Cells were then permeabilized in 100% methanol (Carlo Erba, 412,383) at −20°C for 10 min. Following blocking in 5% normal goat serum (Jackson ImmunoResearch Laboratories, 005–000-001) and 1% BSA (AppliChem PanReac, A6588) for 1 h, samples were incubated with primary antibodies overnight at 4°C. After washing in PBS, samples were incubated for 1 h at RT with Alexa Fluor 488- and 555-labeled secondary antibodies. For p-AMPK, TOMM20, ubiquitin, PRKN, BECN1, GFP and RFP staining, cells were fixed and permeabilized in 100% methanol at −20°C for 10 min and incubated with primary antibodies overnight at 4°C. After washing in PBS, samples were incubated for 1 h at RT with Alexa Fluor 488- and 555-labeled secondary antibodies.
Confocal microscopy was carried out on a Zeiss LSM700 using a 63X objective. A Z series of optical sections were generated at 0.5-µm increments. Images were acquired with pinholes opened to obtain 0.8-μm-thick sections. Detectors were set to detect an optimal signal below the saturation limits. Images were processed with ImageJ 1.46r software (National Institutes of Health, USA).
Immunoprecipitations and immunoblotting
For immunoprecipitation experiments, cells (5x10⁷/sample) were pelleted, washed twice in ice-cold PBS and lysed in 500 μl lysis buffer (0.5% Triton X-100 in 20 mM Tris-HCl, pH 8.0, 150 mM NaCl) in the presence of protease inhibitors (Calbiochem, 539,134) and the phosphatase inhibitor sodium vanadate (Sigma-Aldrich, S6508). Quantification was carried out using the BCA Assay kit (EuroClone, EMP014500). Postnuclear supernatants (2 mg/sample for the ctr/p66 samples and for the p66GFP and p66-mLIR transfectants) were immunoprecipitated for 2 h using, depending on the antibodies to be used for the subsequent immunoblot analysis, either 2 μg mouse anti-GFP mAb (Life Technologies) or 2 μg rabbit anti-SHC1 (Merck Millipore) antibodies, and 3 mg/sample protein-A-Sepharose (PAS; GE Healthcare, 17–0780-01). Before immunoprecipitation, post-nuclear supernatants were precleared for 1 h with the same amount of PAS. PAS-antibody complexes as well as PAS controls were pelleted, washed 4X with 1 ml lysis buffer, then resuspended in 15 μl Laemmli buffer (LifeTechnologies, B0007), boiled for 5 min and subjected to SDS-PAGE. All gels included a sample of the lysates used for the immunoprecipitations (50 μg/sample).
Immunoblotting was carried out using peroxidase-labeled secondary Ig and a chemiluminescence detection kit (Pierce Rockford, 34,078). Stripping was carried out by using ReBlot Plus Mild Antibody Stripping Solution, 10x (Chemicon, 2502). Blots were scanned using a laser densitometer (Duoscan T2500; Agfa, Milan, Italy) and quantified using ImageJ 1.46r (National Institutes of Health, USA).
ATP, ROS and metabolic measurements
Cellular ATP was measured using a bioluminescent assay. Cells (1x10⁶/sample) were incubated 40 min in RPMI (0% bovine calf serum), pelleted, washed twice in ice-cold PBS and lysed in 40 μl lysis buffer containing 1% Triton X-100 in the presence of protease and phosphatase inhibitors. The samples were incubated at 4°C for 5 min and immediately boiled for 5 min. Samples were centrifuged for 10 min at 12,000 g. ATP was measured using the ATP determination kit (ThermoFisher Scientific, A22066). Light emission was recorded as relative light units (RLU) using a Junior LB 9509 (Berthold Technologies) luminometer. The ADP:ATP ratio was measured using the ADP:ATP ratio assay kit (Sigma-Aldrich, MAK135). ADP:ATP ratio was calculated as (RLU ADP signal – RLU residual ATP signal)/RLU ATP signal).
Intracellular ROS production was measured using the fluorescent probe CM-H2DCFDA (ThermoFisher Scientific, C6827). Cells were labeled for 30 min at 37°C with 5 μM CM-H2DCFDA and ROS production was measured by flow cytometry.
A Lactate assay kit (Sigma-Aldrich, MAK064), citrate assay kit (Sigma-Aldrich, MAK057) and pyruvate assay kit (Sigma-Aldrich, MAK071) were used to measure metabolic products in cells (1x10⁶/sample) using an enzymatic assay microplate reader (Bio-Rad).
Apoptosis assay
Apoptosis was analyzed by flow cytometry using the PE Annexin V Apoptosis Detection Kit I (BD Pharmingen, 559,763). Cells (0.3x10⁶/sample) were incubated 40 min in RPMI (0% FCS, 1% BSA) with 2 μg/ml A23187 (Sigma-Aldrich, C7522) or vehicle control DMSO (SERVA Electrophoresis GmbH, 20,385.02), pelleted, washed twice in ice-cold PBS and stained with PE-labeled ANXA5/annexin V and 7-aminoactinomycin D (7-AAD), following the manufacturer’s instructions. Cells were analyzed using a GUAVA flow cytometer (Merck Millipore), gating on ANXA5-positive and 7-AAD-negative cells which were considered as early apoptotic.
Membrane fractionation and mitochondria purification
For membrane fractionation, cells (1x10⁷/sample for immunoblotting, 10x107/sample for immunoprecipitation) were pelleted, washed twice in ice-cold PBS and resuspended in 500–1000 μl homogenization medium (0.25 M sucrose [J.T.Baker, 4097], 1 mM EDTA, 10 mM Tris-HCl, pH 7.4) in the presence of protease and phosphatase inhibitors. The samples were homogenized by 10 pestle strokes through Dounce homogenization and 10 passages through a 26-gauge syringe needle. The homogenate was centrifuged at 3000 g for 5 min at 4°C to remove nuclei and the supernatant was centrifuged at 68,000 g for 1 h at 4°C.
The microsomal pellet was fractionated by iodixanol gradient centrifugation, as previously described [Citation37]. Briefly, the pellet was resuspended in 1.2 ml homogenization buffer, mixed 1:1 with 60% iodixanol (Sigma-Aldrich, D1556) in buffer diluent (0.25 M sucrose, 6 mM EDTA, 60 mM Tris-HCl, pH 7.4), layered onto a gradient consisting of 1.3 ml of 20% iodixanol and 1.2 ml of 10% iodixanol in homogenization buffer and centrifuged at 350,000 g for 3 h at 4°C. Ten fractions were collected from the top of the tube and analyzed by SDS-PAGE (equal volumes of each fraction).
Purification of mitochondria was performed from cells (20x106/sample for immunoblotting, 10x107/sample for immunoprecipitation) using the Mitochondria Isolation Kit (ThermoFisher Scientific, 89,874) following the manufacturer’s instructions. For trypsin digestion, 100 μg of purified mitochondria were resuspend in digestion buffer (10 mM sucrose, 0.1 mM EGTA-Tris, 10 mM Tris-HCl, pH 7.4) and treated with 10 μg trypsin (Sigma-Aldrich, T9201) for 20 min at 4°C. The reaction was stopped by boiling in Laemmli buffer for 5 min.
Site-specific mutagenesis
Mutagenesis of the LIR motif (YNPL) was obtained using the Polymerase Incomplete Primer Extension (PIPE) cloning method [Citation84] and the following primers: forward (5ʹ- AAGGCCAATCCAGCCCGGAATGAGTCTCTGTCATC-3ʹ) and reverse (5ʹ-CCGGGCTGGATTGGCCTTGGGCTTGGGGGGCAGGA-3ʹ). Point mutations Y10A and L13A were inserted in the CH2 domain of pEGFP-p66. The pEGFP-p66LIR plasmid was verified by DNA sequencing (Eurofins, Rome, Italy).
Hypoxia induction and in vitro B cell differentiation
For hypoxia induction, cells were incubated at 1% O2 in an In VIVO 300 hypoxia workstation (Ruskin Technologies). The induction of hypoxia was assessed by immunoblot analysis of HIF1A (Fig. S8). Degradation of TIMM23 and TOMM20 was used as a readout of hypoxia-induced mitophagy as described [Citation46], as under these conditions COX proteins are transcriptionally upregulated [Citation85]. Cells were subjected to hypoxia for 16–48 h based on TIMM23 and TOMM20 degradation (), in agreement with previous reports on hypoxia induction in B cells [Citation44,Citation45].
For the B cell differentiation experiments naïve B cells were prepared by magnetic cell sorting using anti-SPN/CD43 microbeads (ThermoFisher Scientific,11422D). Purified splenic B cells (0.3x10⁶/sample) were cultured in RPMI supplemented with 10% BCS in the presence of 10 μg/ml lipopolysaccharide (Sigma-Aldrich, L8274) and 25 ng/ml IL4 (PeproTech, 214–14) or 25 ng/ml IL5 (Sigma-Aldrich, I1145) for 4 days, as described by Jang et al [Citation58]. Cells were pelleted, washed twice in ice-cold PBS supplemented with 2% FCS and stained with PE-SDC1/CD138 and APC-IgG1 for 30 min. Cells were analyzed using a GUAVA flow cytometer (Merck Millipore).
Statistical analysis
Mean values, standard deviation values and Student’s t test (unpaired) were calculated using the Microsoft Excel application. One-way ANOVA followed by Tukey post hoc test was used for multiple comparisons and calculated using GraphPad (Prism Software). A p value < 0.05 was considered as statistically significant.
Author contributions
AO, VC, FC, DS and CTB designed the experiments and analyzed the data; AO, CC and VC performed the experiments; PGP provided key reagents; AO, VC, FC and CTB wrote the paper.
Supplemental Material
Download PDF (6.4 MB)Acknowledgments
The authors wish to thank Luca Scorrano and Paolo Bernardi for useful discussions, George FG Allen for the kind gift of the mCherry-GFP-FIS1 plasmid and Sonia Grassini for technical assistance. This work was carried out with the generous support of AIRC grants IG 2014-15220 and IG 2017-20148 and an ITT-Regione Toscana grant to CTB. The CTB lab is also supported by Telethon - Italy (Grant GGP1102). VC is supported by the Lundbeck Foundation (R209–2015–3505) and the KBVU from the Danish Cancer Society (R146-A9471). The FC lab is supported by AIRC (IG2016- 18906), Fondazione Roma, KBVU from the Danish Cancer Society (R146-A9364), the Bjarne Saxhof Foundation and the Novo Nordisk Foundation (7559, 22544). Further, the FC lab in Copenhagen is part of the Center of Excellence for Autophagy, Recycling and Disease (CARD), funded by the Danish National Research Foundation.
Disclosure statement
No potential conflict of interest was reported by the authors.
Supplementary Material
Supplementary date for this article can be accessed here.
Additional information
Funding
Related Research Data
References
- Boya P, Reggiori F, Codogno P. Emerging regulation and functions of autophagy. Nat Cell Biol. 2013;15:713–720.
- Kim J, Kundu M, Viollet B, et al. AMPK and MTOR regulate autophagy through direct phosphorylation of Ulk1. Nat Cell Biol. 2011;13:132–141.
- Egan DF, Shackelford DB, Mihaylova MM, et al. Phosphorylation of ULK1 (hATG1) by AMP-activated protein kinase connects energy sensing to mitophagy. Science. 2011;331:456–461.
- He C, Klionsky DJ. Regulation Mechanisms and Signaling pathways of autophagy. Annu Rev Genet. 2010;43:67–93.
- Russell RC, Yuan HX and Guan KL. Autophagy regulation by nutrient signaling. Cell Research. 2014;24:42–57.
- McLeod IX, Jia W, He YW. The contribution of autophagy to lymphocyte survival and homeostasis. Immunol Rev. 2012;249:195–204.
- Pua HH, Dzhagalov I, Chuck M, et al. A critical role for the autophagy gene Atg5 in T cell survival and proliferation. J Exp Med. 2007;204:25–31.
- Bronietzki AW, Schuster M, Schmitz I. Autophagy in T-cell development, activation and differentiation. Immunol Cell Biol. 2015;93:25–34.
- Valdor R, Mocholi E, Botbol Y, et al. Chaperone mediated autophagy regulates T cell responses through targeted degradation of negative regulators of T cell activation. Nat Immunol. 2014;15:1046–1054.
- Jia W, He MX, McLeod IX, et al. Autophagy regulates T lymphocyte proliferation through selective degradation of the cell-cycle inhibitor CDKN1B/p27Kip1. Autophagy. 2015;11:2335–2345.
- Paul S, Kashyap AK, Jia W, et al. Selective autophagy of the adaptor protein Bcl10 modulates T cell receptor activation of NF-kB. Immunity. 2012;36:947–958.
- Xu X, Araki K, Li S, et al. Autophagy is essential for effector CD8 T cell survival and memory formation. Nat Immunol. 2014;15:1152–1161.
- Schlie K, Westerback A, DeVorkin L, et al. Survival of effector CD8+ T cells during influenza infection is dependent on autophagy. J Immunol. 2015;194:4277–4286.
- Li C, Capan E, Zhao Y, et al. Autophagy is induced in CD4+ T cells and important for the growth factor-withdrawal cell death. J Immunol. 2006;177:5163–5168.
- Corrado M, Mariotti FR, Trapani L, et al. Macroautophagy inhibition maintains fragmented mitochondria to foster T cell receptor-dependent apoptosis. EMBO J. 2016;35:1793–1809.
- Arnold J, Murera D, Arbogast F, et al. Autophagy is dispensable for B-cell development but essential for humoral autoimmune responses. Cell Death Differ. 2016;23:853–864.
- Martinez-Martin N, Maldonado P, Gasparrini F, et al. A switch from canonical to noncanonical autophagy shapes B cell responses. Science. 2016;355:641–647.
- Chen M, Hong MJ, Sun H, et al. Essential role for autophagy in the maintenance of immunological memory against influenza infection. Nat Med. 2014;20:503–510.
- Pengo N, Scolari M, Oliva L, et al. Plasma cells require autophagy for sustainable immunoglobulin production. Nat Immunol. 2013;14:298–305.
- Stephenson LM, Miller BC, Ng A, et al. Identification of Atg5-dependent transcriptional changes and increases in mitochondrial mass in Atg5-deficient T lymphocytes. Autophagy. 2009;5:625–635.
- Willinger T, Flavell RA. Canonical autophagy dependent on the class III phosphoinositide-3 kinase Vps34 is required for naive T-cell homeostasis. Proc Natl Acad Sci U S A. 2012;109:8670–8675.
- Capitani N, Lucherini OM, Sozzi E, et al. Impaired expression of p66SHC, a novel regulator of B-cell survival, in chronic lymphocytic leukemia. Blood. 2010;115:3726–3736.
- Soliman MA, Abdel Rahman AM, Lamming DW, et al. The adaptor protein p66SHC inhibits MTOR-dependent anabolic metabolism. Sci Signal. 2014;7:ra17.
- Cattaneo F, Patrussi L, Capitani N, et al. Expression of the p66SHC protein adaptor is regulated by the activator of transcription STAT4 in normal and chronic lymphocytic leukemia B cells. Oncotarget. 2016;7:57086–57098.
- Giorgio M, Migliaccio E, Orsini F, et al. Electron transfer between cytochrome c and p66SHC generates reactive oxygen species that trigger mitochondrial apoptosis. Cell. 2005;122:221–233.
- Alers S, Löffler AS, Wesselborg S, et al. Role of AMPK-MTOR-Ulk1/2 in the regulation of autophagy: cross talk, shortcuts, and feedbacks. Mol Cell Biol. 2012;32:2–11.
- Noda NN, Fujioka Y. Atg1 family kinases in autophagy initiation. Cell Mol Life Sci. 2015;72:3083–3096.
- Martens S. No ATG8s, no problem? How LC3/GABARAP proteins contribute to autophagy JCB. J Cell Biol. 2016; 215:761–763.
- Padman BS, Nguyen TN, Lazarou M. Autophagosome formation and cargo sequestration in the absence of LC3/GABARAPs. Autophagy. 2017;13:772–774.
- Kaizuka T, Morishita H, Hama Y, et al. An autophagic flux probe that releases an internal control. Mol Cell. 2016;64:835–849.
- Oaks Z, Winans T, Caza T, et al. Mitochondrial dysfunction in the liver and antiphospholipid antibody production precede disease onset and respond to rapamycin in lupus-prone mice. Arthritis Reumatol. 2016;68:2728–2739.
- Limon JJ, Fruman DA. Akt and MTOR in B cell activation and differentiation. Front Immunol. 2012;3:228–239.
- Noda NN, Ohsumi Y, Inagaki F. Atg8-family interacting motif crucial for selective autophagy. FEBS Lett. 2010;584:1379–1385.
- Birgisdottir ÅB, Lamark T, Johansen T. The LIR motif - crucial for selective autophagy. J Cell Sci. 2013;126:3237–3247.
- Tanida I, Ueno T, Kominami E. LC3 conjugation system in mammalian autophagy. Int J Biochem Cell Biol. 2004;36:2503.
- Ge L, Melville D, Zhang M, et al. ER–golgi intermediate compartment is a key membrane source for the LC3 lipidation step of autophagosome biogenesis. eLife. 2013;2:e00947.
- Li X, Donowitz M. Fractionation of subcellular membrane vesicles of epithelial and nonepithelial cells by OptiPrep density gradient ultracentrifugation. Methods Mol Biol. 2008;440:97–110.
- Nemoto S, Finkel T. Redox regulation of forkhead proteins through a p66SHC-dependent signaling pathway. Science. 2002;295:2450–2452.
- Pacini S, Pellegrini M, Migliaccio E, et al. p66SHC promotes apoptosis and antagonizes mitogenic signaling in T cells. Mol Cell Biol. 2004;24:1747–1757.
- Pellegrini M, Finetti F, Petronilli V, et al.. p66SHC promotes T cell apoptosis by inducing mitochondrial dysfunction and impaired Ca2+ homeostasis. Cell Death and Differentiation. 2007;14:338–347.
- Pellegrini M, Pacini S, Baldari CT. p66SHC: the apoptotic side of Shc proteins. Apoptosis. 2005;10:13–18.
- Matsuda N, Sato S, Shiba K, et al. PINK1 stabilized by mitochondrial depolarization recruits Parkin to damaged mitochondria and activates latent Parkin for mitophagy. JCB. 2010;189:211–221.
- Allen GF, Toth R, James J, et al. Loss of iron triggers PINK1/Parkin-independent mitophagy. EMBO Rep. 2013;14:1127–1135.
- Cho SH, Raybuck AL, Stengel K, et al. Germinal centre hypoxia and regulation of antibody qualities by a hypoxia response system. Nature. 2016;537:234–238.
- Abbott RK, Thayer M, Labuda J, et al. Germinal center hypoxia potentiates immunoglobulin class switch recombination. J Immunology. 2016;197:4014–4020.
- Liu L, Feng D, Chen G, et al. Mitochondrial outer-membrane protein FUNDC1 mediates hypoxia-induced mitophagy in mammalian cells. Nat Cell Biol. 2012;14:177–185.
- Gomes LC, Scorrano L. Mitochondrial morphology in mitophagy and macroautophagy. Biochim Biophys Acta. 2013;1833:205–212.
- Yamano K, Matsuda N, Tanaka K. The ubiquitin signal and autophagy: an orchestrated dance leading to mitochondrial degradation. EMBO Rep. 2016;17:300–316.
- Sinha RA, Singh BK, Zhou J, et al. Thyroid hormone induction of mitochondrial activity is coupled to mitophagy via ROS-AMPK-ULK1 signaling. Autophagy. 2015;11:1341–1357.
- Tian W, Li W, Chen Y, et al. Phosphorylation of ULK1 by AMPK regulates translocation of ULK1 to mitochondria and mitophagy. FEBS Letters. 2015;589:1847–1854.
- Yoshii SR, Kishi C, Ishihara N, et al. Parkin mediates proteasome-dependent protein degradation and rupture of the outer mitochondrial membrane. J Biol Chem. 2011;286:19630–19640.
- Chan N, Salazar AM, Pham AH, et al. Broad activation of the ubiquitin-proteasome system by Parkin is critical for mitophagy. Hum Mol Genet. 2011;20:1726–1737.
- Tanaka A, Cleland MM, Xu S, et al. Proteasome and p97 mediate mitophagy and degradation of mitofusins induced by Parkin. J Cell Biol. 2010;191:1367–1380.
- Wei Y, Chiang WC, Sumpter R Jr, et al. Prohibitin 2 is an inner mitochondrial membrane mitophagy receptor. Cell. 2017;168:224–238 e10.
- Lee JY, Nagano Y, Taylor JP, et al. Disease-causing mutations in Parkin impair mitochondrial ubiquitination, aggregation, and HDAC6-dependent mitophagy. J Cell Biol. 2010;189:671–679.
- Sandoval H, Kodali S, Wang J. Regulation of B cell fate, survival, and function by mitochondria and autophagy. Mitochondrion. 2017;S1567-7249:30191–30195.
- Bertolotti M, Sitia R, Rubartelli A. On the redox control of B lymphocyte differentiation and function. Antioxid Redox Signal. 2012;16:1139–1149.
- Jang KJ, Mano H, Aoki K, et al. Mitochondrial function provides instructive signals for activation-induced B-cell fates. Nat Commun. 2015;6:6750.
- Finetti F, Savino MT, Baldari CT. Positive and negative regulation of antigen receptor signaling by the Shc family of protein adapters. Immunol Rev. 2009;232:115–134.
- Orsini F, Migliaccio E, Moroni M, et al. The lifespan determinant p66SHC localizes to mitochondria where it associates with mtHsp70 and regulates trans-membrane potential. J Biol Chem. 2004;11:25689–25695.
- Shauw RJ. LKB1 and AMP-activated protein kinase control of mTOR signalling and growth. Acta Physiol. 2009;196:65–80.
- Zhao B, Qiang L, Joseph J, et al. Mitochondrial dysfunction activates the AMPK signaling and autophagy to promote cell survival. Genes Dis. 2016 3;Mar(1):82–87.
- Jiang S, Park DW, Gao Y, et al. Participation of proteasome-ubiquitin protein degradation in autophagy and the activation of AMP-activated protein kinase. Cell Signal. 2015;27:1186–1197.
- Liang J, Xu ZX, Ding Z, et al. Myristoylation confers noncanonical AMPK functions in autophagy selectivity and mitochondrial surveillance. Nat Comm. 2015;6:7926.
- Nguyen TN, Padman BS, Usher J, et al. family LC3/GABARAP proteins are crucial for autophagosome–lysosome fusion but not autophagosome formation during PINK1/Parkin mitophagy and starvation. JCB. 2016;215:857–874.
- Ding WX, Ni HM, Li M, et al. Nix is critical to two distinct phases of mitophagy, reactive oxygen species-mediated autophagy induction and Parkin-ubiquitin-p62-mediated mitochondrial priming. J Biol Chem. 2010;285:27879–27890.
- Lazarou M, Sliter DA, Kane LA, et al. The ubiquitin kinase PINK1 recruits autophagy receptors to induce mitophagy. Nature. 2015;524:309–314.
- Geisler S, Holmström KM, Skujat D, et al. (2010) PINK1/Parkin-mediated mitophagy is dependent on VDAC1 and p62/SQSTM1. Nat Cell Biol. 2010;12:119–131.
- Richter B, Sliter DA, Herhaus L, et al. Phosphorylation of OPTN by TBK1 enhances its binding to Ub chains and promotes selective autophagy of damaged mitochondria. Proc Natl Acad Sci U S A. 2016;113:4039–4044.
- Pinton P, Rimessi A, Marchi S, et al. Protein kinase C beta and prolyl isomerase 1 regulate mitochondrial effects of the life-span determinant p66SHC. Science. 2007;315:659–663.
- Chen X, Chen J, Gan S, et al. DNA damage strength modulates a bimodal switch of p53 dynamics for cell-fate control. BMC Biol. 2013;11:73.
- Carroll RG, Hollville E, Martin SJ. Parkin sensitizes toward apoptosis induced by mitochondrial depolarization through promoting degradation of Mcl-1. Cell Rep. 2014;9:1538–1553.
- Migliaccio E, Giorgio M, Mele S, et al. The p66SHC adaptor protein controls oxidative stress response and life span in mammals. Nature. 1999;402:309–313.
- Brown JE, Zeiger SLH, Hettinger JC, et al. Essential role of the redox-sensitive kinase p66SHC in determining energetic and oxidative status and cell fate in neuronal preconditioning. J Neurosci. 2010;30:5242-5252.
- Finetti F, Pellegrini M, Ulivieri C, et al. The proapoptotic and antimitogenic protein p66SHC acts as a negative regulator of lymphocyte activation and autoimmunity. Blood. 2008;111:5017–5027.
- Bertolotti M, Yim SH, Garcia-Manteiga JM, et al. B- to plasma-cell terminal differentiation entails oxidative stress and profound reshaping of the antioxidant responses. Antioxid Redox Signal. 2010;13:1133–1144.
- Iwata TN, Ramírez-Komo JA, Park H, et al. Control of B lymphocyte development and functions by the mTOR signaling pathways. Cytokine Growth Factor Rev. 2017;35:47–62.
- Sintes J, Gentile M, Zhang S, et al. mTOR intersects antibody-inducing signals from TACI in marginal zone B cells. Nat Commun. 2017;8:1462.
- Capitani N, Patrussi L, Trentin L, et al. S1P1 expression is controlled by the pro-oxidant activity of p66SHC and is impaired in B-CLL patients with unfavorable prognosis. Blood. 2012;120:4391–4399.
- Klionsky DJ, Abdelmohsen K, Abe A, et al. Guidelines for the use and interpretation of assays for monitoring autophagy. Autophagy. 2016;12:1–222.
- Siggs OM, Stockenhuber A, Deobagkar-Lele M, et al. Mutation of Fnip1 is associated with B-cell deficiency, cardiomyopathy, and elevated AMPK activity. Proc Natl Acad Sci U S A. 2016;113:E3706–3715.
- Kozako T, Suzuki T, Yoshimitsu M, et al. Novel small-molecule SIRT1 inhibitors induce cell death in adult T-cell leukaemia cells. Sci Rep. 2015;5:11345.
- Manders EM, Stap J, Brakenhoff GJ, et al. Dynamics of three-dimensional replication patterns during the S-phase, analysed by double labelling of DNA and confocal microscopy. J Cell Sci. 1992;103:857–862.
- Klock HE, Koesema EJ, Knuth MW, et al. Combining the polymerase incomplete primer extension method for cloning and mutagenesis with microscreening to accelerate structural genomics efforts. Proteins. 2008;71:982–994.
- Semenza GL. Oxygen-dependent regulation of mitochondrial respiration by hypoxia-inducible factor 1. Biochem J. 2007;405:1–9.