
ABSTRACT
Macroautophagy/autophagy is emerging as an important process in adult muscle stem cells functions: it regulates metabolic reprogramming during activation from a quiescent state, maintains stemness and prevents senescence. We now show that autophagy is specifically required for neonatal myogenesis and muscle development. Specific deletion of Atg7 in PAX7+ (paired box 7) precursors led in mice to a dwarf phenotype, with an effect restricted to the neonatal phase of muscle development. Atg7 knockdown suppressed neonatal satellite cell (nSC) proliferation and differentiation, downregulating the GH-IGF1 functions. When we disrupted autophagy, NFE2L2/NRF2 (nuclear factor, erythroid 2 like 2) accumulated in muscle and nSCs and negatively modulated DDIT3/CHOP (DNA-damage inducible transcript 3) expression. Lower levels of DDIT3 were responsible for reduced GHR expression leading to impaired local production of IGF1. Our results conclusively identify a novel autophagy-dependent pathway that regulates nSC behavior and indicate that autophagy is required for skeletal muscle development in the neonatal phase.
Abbreviations: AKT/protein kinase B: Thymoma viral proto-oncogene; ASCs: adult stem cells; ATF4: activating transcription factor 4; ATG7: autophagy related 7; BAT: brown adipose tissue; BMP: bone morphogenetic protein; CEBPB: CCAAT/enhancer binding protein (C/EBP), beta; CSA: cross sectional area; CTNNB1: catenin (cadherin associated protein), beta 1; DDIT3: DNA-damage inducible transcript 3; DM: differentiation medium; E: embryonic stage; EIF2AK3/PERK; EIF4EBP1: eukaryotic translation initiation factor 2 alpha kinase 3; eukaryotic translation initiation factor 4E binding protein 1; ER: endoplasmic reticulum; FGF21: fibroblast growth factor 21; GH: growth hormone; GHR: growth hormone receptor; HSCs: hematopoietic stem cells; IGF1: insulin-like growth factor 1; ITGAM: integrin alpha M; KEAP1: kelch-like ECH-associated protein 1; LY6A/Sca-1; MAP1LC3: lymphocyte antigen 6 complex, locus A; microtubule-associated protein 1 light chain 3; MAPK1/ERK2: mitogen-activated protein kinase 1; MAPK3/ERK1: mitogen-activated protein kinase 3; miRNAs: microRNAs; MSCs: mesenchymal stem cells; MTOR: mechanistic target of rapamycin kinase; mtUPR: mitochondrial unfolded protein response; MYF5: myogenic factor 5; MYH: myosin, heavy polypeptide; MYOD1: myogenic differentiation 1; MYOG: myogenin; NFE2L2: nuclear factor, erythroid derived 2, like 2; nSC: neonatal satellite cells; NSCs: neuronal stem cells; P: postnatal day; PAX7: paired box 7; PECAM1: platelet/endothelial cell adhesion molecule 1; PPARG: peroxisome proliferator activated receptor gamma; PTPRC: protein tyrosine phosphatase, receptor type, C; ROS: reactive oxygen species; RPS6: ribosomal protein S6; SCs: adult satellite cells; SQSTM1: sequestosome 1; STAT5: signal transducer and activator of transcription 5; TGFB1: transforming growth factor beta 1; WAT: white adipose tissue; WT: wild type.
Introduction
Skeletal muscle development during embryonic, fetal and neonatal periods requires successive waves of muscle stem cell activation, proliferation and fusion that involve different types of myoblasts. Embryonic myogenesis, occurring between E10.5-E12.5, allows the generation of primary fibers by differentiation of embryonic myoblasts. Fetal myogenesis, occurring between E14.5 and birth (P0), involves fusion of fetal myoblasts to existing primary fibers and fusion of single myoblasts generating secondary myofibers. At the end of this phase, newly formed basal lamina surrounds each individual fiber. Neonatal myogenesis, between P0 and P21, allows myofiber growth by rapid increase in myonuclear number, due to satellite cell proliferation and fusion with existing myofibers. Finally, adult myogenesis after P21 enables myofibers to grow in the absence of myonuclear addition and is required for postnatal growth and repair after damage [Citation1,Citation2].
Embryonic, fetal, and adult myoblasts differ in their characteristics [Citation3]. Embryonic and fetal muscle precursors are interstitial mononuclear cells, whereas neonatal and adult progenitors are localized beneath the basal lamina of the myofibers. These cells are termed satellite cells [Citation4] and are morphologically identifiable from the end of fetal myogenesis. Expression of transcription factors, cell surface receptors, and extracellular matrix proteins differ between embryonic and fetal myoblasts [Citation5], while it is still unclear whether differences exist between neonatal and fetal myoblasts. In agreement, primary, secondary, and adult myofibers are distinct, especially in the expression of muscle contractile proteins [Citation1].
Different signaling pathways regulate the myogenic phases. Embryonic myogenesis is insensitive to TGFB1/TGFbeta (transforming growth factor beta 1) and BMP (bone morphogenetic protein) signaling as well as to activation of the CTNNB1 (catenin beta 1) pathway. By contrast, these molecules can affect fetal myogenesis and satellite cell differentiation [Citation3,Citation6–Citation8]. Extrinsic signals from connective tissue are also important for muscle maturation, promoting the switch from fetal to adult muscle [Citation9]; thus, evaluating the full range of intrinsic and extrinsic factors that regulate fetal, neonatal, and adult myogenesis is necessary to understand how muscle development is controlled.
In stem cells functions, the importance of a functional autophagic machinery is being unraveled. Pluripotency, self-renewal as well as quiescence require autophagy [Citation10]. Autophagy is a homeostatic process acting as a quality control pathway and as a recycling system [Citation11], carrying out degradation of cytoplasmic components including damaged organelles, toxic protein aggregates and intracellular pathogens [Citation12]. In adult stem cells (ASCs), including hematopoietic (HSCs), mesenchymal (MSCs) and neuronal (NSCs) stem cells, autophagy sustains such ASCs functions as erythroid maturation, adipocyte differentiation, neuritogenesis and neuronal differentiation [Citation13].
In muscle, autophagy contributes to the metabolic reprogramming that occurs during myogenic differentiation and provides a successful process of myogenesis [Citation14,Citation15]. Autophagy is required for adult satellite cell (SC) activation from a quiescent state, promoting the metabolic adaptations needed for leaving quiescence [Citation16]. Further, autophagy has been identified as capable of maintaining satellite cells stemness, thus preventing the switch between quiescence and senescence [Citation17]. In MYF5+ (myogenic factor 5) precursor cells, autophagy regulates energy and glucose homeostasis affecting brown adipose tissue and skeletal muscle development [Citation18]. However MYF5+ cells contribute to adult myonuclei by 50% [Citation19], and, consequently, loss of Atg7 in MYF5+ progenitors modestly affects myocyte size.
To date, little information has been provided on whether autophagy controls muscle development. To study this we deleted Atg7 specifically in satellite cells and found that Atg7 knockdown leads to severe deficiencies in neonatal skeletal muscle growth. Furthermore, we identified in the regulation of NFE2L2 and DDIT3 the molecular determinants responsible for the effectiveness of the muscle GH-IGF1 system, thus defining the existence of a direct link between both factors and a proper autophagic flux. Collectively, our results provide in vivo evidence that basal autophagy is a process regulating muscle maturation in the neonatal phase.
Results
Generation of Pax7 promoter-regulated Atg7 knockout mice (atg7Δ)
To investigate the physiological role of autophagy during myogenesis we generated an Atg7 conditional knockout mouse by the Cre-loxP technology. We crossed Atg7-floxed mice (Atg7fl/fl) with a transgenic line expressing Cre recombinase under the control of the Pax7 promoter. We chose to generate this model (referred to as atg7Δ hereafter) to study the role of autophagy in skeletal muscle growth. PAX7 is not expressed in progenitor cells until E11.5 and then persists in fetal (E14.5–P0; P, postnatal day) and neonatal muscle (P0–P21) [Citation20]. In addition, PAX7+ progenitors do not give rise to embryonic muscle, but are required for fetal myogenesis in the limb [Citation8]. PAX7 also regulates neonatal progenitors and it is crucial for their maintenance, proliferation, and differentiation [Citation2,Citation21], whereas, in adults, PAX7 labels all satellite cells [Citation1]. Consistently, ATG7 expression was almost undetectable in atg7Δ embryos at E14.5 and E18.5 () and in neonatal skeletal muscle, as shown by immunofluorescence and western blotting analysis (). The trace amounts of ATG7 protein visible in the blot could be due to contamination by endothelial cells, fibroblasts and blood cells. Atg7 deletion was accompanied by suppression of MAP1LC3/LC3 (microtubule-associated protein 1 light chain 3) lipidation and accumulation of SQSTM1/p62 (sequestosome 1) in skeletal muscle () indicating an efficient inhibition of autophagy, also strengthened by the presence of SQSTM1 aggregates in immunofluorescence analysis of muscle sections ().
Figure 1. Autophagy is specifically inhibited in atg7Δ mice muscles. (a) Myosin heavy chain (MYH) (red) and ATG7 (green) immunostaining of abdominal muscle in transverse sections of WT and atg7Δ embryos at E14.5 (scale bar: 50 µm) and of hind limb muscle at E18.5 (scale bar: 25 µm). DAPI is used as a nuclear stain (blue). (b) Left panel: representative immunoblotting analysis of ATG7 and VCL (vinculin) as a loading control in muscle (gastrocnemius, GC) protein extracts from WT and atg7Δ mice at P21. Right panel: representative immunostaining of MYH (red) and ATG7 (green) in WT and atg7Δ muscle sections at P21. DAPI is used as a nuclear stain (blue) (scale bar: 25 µm). (c) Representative immunoblotting analysis of autophagy-related proteins SQSTM1, MAP1LC3 and GAPDH as a loading control in GC protein extracts. (d) Representative SQSTM1 immunostaining (red) of tibialis anterior (TA) sections. DAPI is used for nuclear staining (blue) (scale bar: 100 μm). (e) Representative immunoblotting analysis of ATG7 and GAPDH as a loading control in other organs.
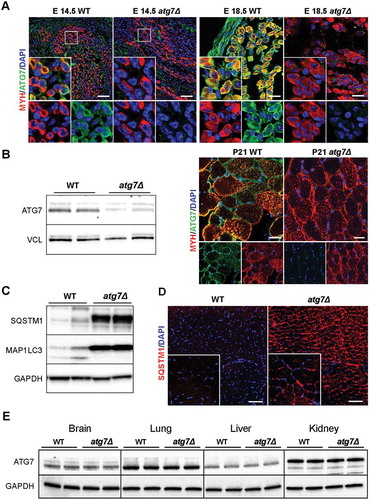
No changes in ATG7 expression were found in other organs we assessed, namely brain, liver, lung and kidney (), confirming the specificity of Atg7 deletion in muscle.
Skeletal muscle growth is severely compromised in atg7 Δ mice
Fetal and neonatal muscle express PAX7. During fetal myogenesis, myoblasts fuse to primary fibers formed during embryonic myogenesis and to each other to generate secondary myofibers. In neonatal sections, the total number of myofibers was similar comparing wild type (WT) and atg7Δ mice (). At E18.5, the mean cross sectional area (CSA) of muscle fibers did not differ between the 2 genotypes (). Altogether these findings suggest that fetal myogenesis is not affected by Atg7 deletion.
Figure 2. Skeletal muscle growth is severely compromised in atg7Δ mice. (a) Fiber number in TA sections from WT and atg7Δ mice at P21 (n ≥ 4 per genotype). (b) MYH (red) and LAM/laminin (green) immunostaining of hind limb muscle in WT and atg7Δ embryos at E18.5; DAPI is used for nuclear staining (blue) (scale bar: 25 μm). Cross sectional area (CSA) measurement is provided (n = 3 per genotype). (c) Reduced body weight and size in atg7Δ mice compared to the WT counterpart (n ≥ 50 per genotype). (d) Analysis of muscles and organs size in atg7Δ and WT mice at P21 (QD: Quadriceps). Muscles (n ≥ 30 per genotype) and organs (n ≥ 13 per genotype) weights have been normalized to body weight. (e) Growth curve of WT and atg7Δ mice from P7 to P21 (n ≥ 13 per genotype). Values are expressed as mean ± SEM. * vs WT (* P < 0.05, ** P < 0.01, *** P < 0.001).
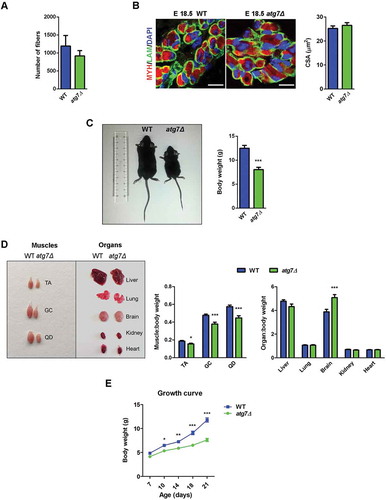
After birth, male atg7Δ mice showed a dwarf phenotype and were significantly smaller than WT littermates with a significant body weight reduction by 40% at P21 (). The weights of different organs, when normalized for body weight, did not decrease in atg7Δ mice compared to age matched controls, while hindlimb muscles mass was significantly lower in atg7Δ mice ( and S1A), indicating that in autophagy-deficient mice only skeletal muscle was reduced out of proportion to the body mass. Compared to WT littermates, atg7Δ mice showed impaired growth by P10 that became more evident at P21 (). Conversely, female atg7Δ mice displayed a normal growth curve (Figure S1B) and there were no obvious differences in body, or muscle size (Figure S1C) compared to WT littermates.
The stomachs of pups were full of milk in both WT and atg7Δ mice, excluding feeding difficulties of mice that could account for the discrepancies between male and female phenotype.
Muscle growth started to differ at P14 and worsened at P21, whereas no differences were observed at P7 (); the same result was obtained calculating the skeletal muscle growth index (i.e., hindlimbs skeletal muscle weight normalized to whole body weight) (). In atg7Δ mice at P21, there was a greater number of smaller myofibers and fewer large myofibers compared to WT, resulting in a reduced mean CSA (). mRNA and protein analysis of MYOD1 (myogenic differentiation 1) and MYOG (myogenin), 2 markers of muscle differentiation, confirmed the impairment of skeletal muscle differentiation in atg7Δ mice ().
Figure 3. Skeletal muscle growth deficiency in atg7Δ mice during postnatal phase. (a) Weight curve and (b) growth index, calculated as hindlimbs skeletal muscle weight (TA, GC, QD) normalized to body weight, of WT and atg7Δ mice from P7 to P21 (n ≥ 7 per genotype). (c) Representative LAM/laminin immunostaining (red) of TA sections from WT and atg7Δ mice at P21; DAPI is used for nuclear staining (blue) (left panel) (scale bar: 50 μm). Analysis of mean cross sectional area (CSA) (middle panel) and fiber CSA distribution (right panel) (n = 4 per genotype) are provided. (d) Quantitative reverse transcription PCR (RT-qPCR) and immunoblotting analysis of myogenic differentiation markers MYOG and MYOD1 in GC at P21. Densitometric analysis is provided (n ≥ 6 per genotype). (e) Representative MYH immunostaining on TA sections from WT and atg7Δ mice at P21. Percentage of MYH2 (green), and double-positive MYH2 and MYH1 fibers (yellow squares) are provided. LAM/laminin is used for fiber outline (gray); DAPI is used for nuclear staining (blue) (scale bar: 100 µm) (n ≥ 3 per genotype). Values are expressed as mean ± SEM. * vs WT (* P < 0.05, ** P < 0.01, *** P < 0.001).
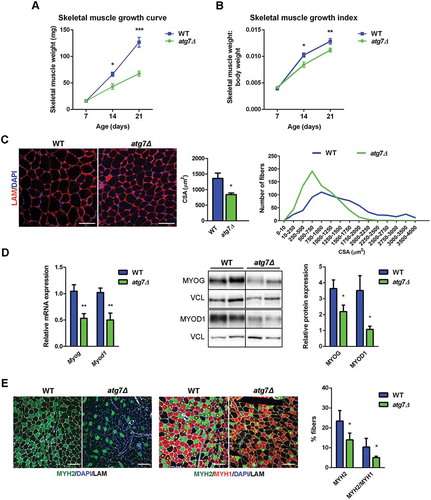
The absence of differences during fetal myogenesis and the delay in skeletal muscle growth between day 10 and 21 in atg7Δ mice suggests that autophagy is crucial for neonatal myogenesis and is consistent with an impaired neonatal progenitors proliferation and differentiation.
Morphological analysis by hematoxylin and eosin staining of muscles at P21 revealed a normal overall muscle morphology without inflammatory infiltrate and/or centrally nucleated fibers (Figure S1D). In agreement, no significant apoptosis was detected in both WT and atg7Δ mice by TUNEL assay on cryosections (Figure S1E). At P21 immunofluorescence staining for MYH4/MyHC-IIb (myosin, heavy polypeptide 4, skeletal muscle) and MYH1/MyHC-IIx (myosin heavy chain 1), both markers of glycolytic fibers, were likewise unchanged, as well as MYH7/MyHC-I (myosin, heavy polypeptide 7, cardiac muscle, beta) as marker of oxidative fibers (Figure S2A). By contrast, we showed a reduction in the proportion of MYH2/MyHC-IIa (myosin, heavy polypeptide 2, skeletal muscle, adult)-positive fibers in atg7Δ mice compared to WT (). A decrease of type IIa fibers can be associated with no changes in type IIx and IIb fibers when the mixed IIa and IIx fibers lose the expression of IIa, but retain the IIx myosin, and this occurred in atg7Δ mice (). This may lead to a reduced oxidative metabolism and dysregulated energy homeostasis.
Both skeletal muscle and adipose tissue are responsible for energy balance, and during development PAX7+ cells contribute to muscle, brown adipose tissue (BAT) and dermis [Citation22]. As expected, atg7Δ BAT displayed an absence of ATG7, accumulation of SQSTM1 and nonlipidated MAP1LC3 (Figure S2B), indicating an impairment in the autophagic process. Conversely, in white adipose tissue (WAT) we failed to detect Atg7 deletion, as well as SQSTM1 and MAP1LC3 accumulation (Figure S2B), excluding autophagy disruption in this tissue. In atg7Δ mice, BAT mass was decreased in proportion to overall body mass (Figure S2C) and adipose markers such as CEBPB/C/EBP-beta (CCAAT/enhancer binding protein [C/EBP], beta) and PPARG/PPAR-gamma (peroxisome proliferator activated receptor gamma) were downregulated (Figure S2D) demonstrating that BAT differentiation is affected in our model. The atg7Δ model shared many similarities with the knockout of Atg7 in MYF5+ progenitors [Citation18] and although WT and atg7Δ mice showed equivalent basal serum-free fatty acid and triglyceride levels (Figure S2E), indicating that lipolysis provided unchanged levels of lipid fuel, we cannot exclude a β-oxidation impairment as reported in Myf5-Atg7 knockout pups [Citation18].
Defective autophagy negatively affects neonatal myogenesis in vivo
Loss of muscle mass could be due to activation of atrophy-related genes, atrogenes, that are involved in the ubiquitin-proteasome degradation system [Citation23]. Thus, we monitored expression levels of the atrophy-related ubiquitin ligases Trim63/Murf-1 (tripartite motif-containing 63) and Fbxo32/Atrogin-1 (F-box protein 32) in hindlimb muscles of WT and atg7Δ mice at P14 and P21, i.e. when delay in muscle growth was still initial and well advanced, respectively (). Neither was changed at both time points, demonstrating that disrupted autophagy in the PAX7+ progenitors does not induce a typical atrophy program.
Whether autophagy influences neonatal myogenesis leading to smaller muscles was investigated further. At P21 the mean number of myonuclei () and the number of neonatal PAX7+ satellite cells () were reduced in atg7Δ mice, suggesting that autophagy is crucial for proliferation and differentiation of neonatal satellite cells (nSCs).
Figure 4. Defective autophagy negatively affects neonatal myogenesis in vivo. (a) RT-qPCR analysis of atrogenes Trim63 and Fbxo32 in GC of WT and atg7Δ mice at P14 and P21 (n ≥ 3 per genotype). (b) Mean number of myonuclei in single fibers from WT and atg7Δ mice at P21 (n ≥ 4 per genotype). (c) PAX7 immunostaining (red). Percentage of PAX7+ cells on total DAPI nuclear counterstaining (blue) is provided. LAM/laminin is used as a fiber outline (green) (scale bar: 20 µm) (n ≥ 3 per genotype). (d) MKI67 immunostaining (red). Percentage of MKI67+ cells on total DAPI nuclear counterstaining (blue) is provided (scale bar: 50 µm) (n = 3 per genotype). (e) RT-qPCR analysis of proliferation-related genes Ccnd1 and Mki67 in GC of WT and atg7Δ mice at P21 (n ≥ 5 per genotype). Values are expressed as mean ± SEM. * vs WT (* P < 0.05, ** P < 0.01, *** P < 0.001).
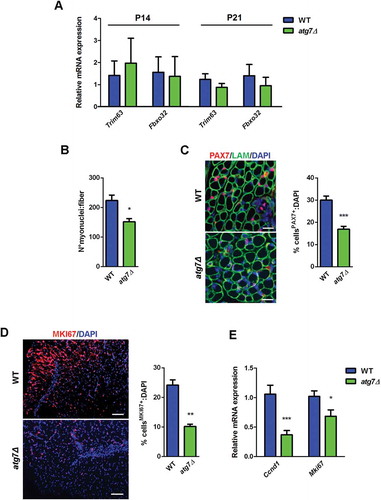
We assessed proliferation directly by an immunofluorescence analysis of the cell proliferation marker MKI67/Ki67 on neonatal muscle sections at P7: atg7Δ mice showed a reduction in the number of MKI67+ cells compared to WT (). Consistently, at P21, the mRNA levels of Mki67 and Ccnd1 (cyclin D1), an important regulator of cell cycle progression, were significantly lower in atg7Δ mice () indicating an impairment in cell proliferation that could account for the defect in muscle growth of atg7Δ mice.
Defective autophagy results in an altered muscle GH-IGF1 pathway
An important physiological regulatory pathway driving postnatal skeletal muscle expansion is the GH (growth hormone)-IGF1 (insulin-like growth factor 1) axis, whose alterations are also associated with a dwarf phenotype in mice [Citation24–Citation26]. In skeletal muscle of atg7Δ mice at P21, Ghr (growth hormone receptor) mRNA and protein levels were reduced, as was the expression of Igf1 mRNA (). By contrast no changes in Ghr and Igf1 mRNA levels were observed in the liver (), indicating a muscle-restricted reduction of IGF1 levels.
Figure 5. The GH-IGF1 pathway is altered in atg7Δ mice skeletal muscle. (a) RT-qPCR analysis of Ghr and Igf1 and immunoblotting analysis of GHR in GC of WT and atg7Δ mice at P21 (n ≥ 5 per genotype). GAPDH is used as a loading control. (b) RT-qPCR analysis of Ghr and Igf1 in liver of WT and atg7Δ mice at P21 (n ≥ 5 per genotype). (c) Representative immunoblot analysis of phospho-AKT on threonine 308 (p-AKT Thr308) normalized to total AKT (n ≥ 10 per genotype), phospho-RPS6 (p-RPSS6) normalized to total RPS6 (n ≥ 6 per genotype), phospho-EIF4EBP1 (p-EIF4EBP1) normalized to total EIF4EBP1 (n ≥ 8 per genotype), phospho-MAPK1/3 (p-MAPK1/3) normalized to total MAPK1/3 (n ≥ 6 per genotype) in GC protein extracts. Densitometric quantifications are provided. (d) Representative immunoblot analysis of phospho-STAT5 normalized to total STAT5 and RT-qPCR analysis of Ar in GC extracts (n ≥ 5 per genotype). Values are expressed as mean ± SEM. * vs WT (* P < 0.05, ** P < 0.01).
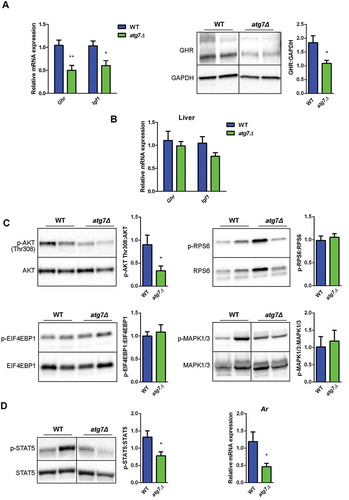
AKT phosphorylation on threonine 308, a downstream effector of IGF1 signaling, was lower in atg7Δ mice at P21 confirming the alteration of this axis ().
Next we checked whether MTOR (mechanistic target of rapamycin kinase) was affected [Citation27]. No changes were detected in the phosphorylation levels of MTOR downstream targets RPS6/S6 (ribosomal protein S6) and EIF4EBP1 (eukaryotic translation initiation factor 4E binding protein 1) (), likely excluding the involvement of MTOR in this phenotype.
Whereas the MAPK/ERK (mitogen-activated protein kinase) pathway has been implicated in IGF1-dependent muscle growth regulation, the phosphorylation levels of MAPK1/ERK2 (mitogen-activated protein kinase 1)-MAPK3/ERK1 were not affected in our dwarf mice (), suggesting that IGF1 and AKT are the main factors that are affected by GH1. The transcription factor STAT5 (signal transducer and activator of transcription 5) is essential for IGF1 expression in the liver and muscle [Citation28,Citation29] and loss of STAT5 has an impact on postnatal growth with a more severe phenotype in male [Citation28], in agreement with the known sexually dimorphic pattern of GH pulses. Moreover STAT5 directly regulates the levels of the Ar (androgen receptor) gene [Citation30], a known regulator of muscle growth [Citation31]. In atg7Δ mice, STAT5 was less active () and this may explain why skeletal muscle mass was preferentially reduced in males. Consistently, Ar expression decreased in male atg7Δ mice ().
Defective autophagy severely decreases proliferative potential and differentiation capacity of neonatal satellite cells (nSC)
To examine directly whether atg7Δ mice have a defect in nSC proliferation and differentiation, we established primary muscle cells cultures from WT and atg7Δ mice at P10, by negative selection against the lineage markers ITGAM/CD11b (integrin alpha M), PECAM1/CD31 (platelet/endothelial cell adhesion molecule 1), PTPRC/CD45 (protein tyrosine phosphatase, receptor type, C) and LY6A/Sca-1 (lymphocyte antigen 6 complex, locus A) to exclude the Lin-negative population. As expected, the expression of ATG7 was absent in cell culture, and autophagy was blocked as demonstrated by suppression of MAP1LC3 lipidation and accumulation of SQSTM1 in western blotting analysis (Figure S3A). Consistent with this observation, immunofluorescence analysis showed an accumulation of SQSTM1 aggregates in nSCs from atg7Δ mice (Figure S3B).
The proliferation index of nSCs from atg7Δ mice was lower at both 24 and 48 h in growth conditions () as was the expression of MKI67 (), confirming that the reduced skeletal muscle mass in atg7Δ mice is accompanied by reduced nSC proliferative capacity.
Figure 6. Defective autophagy decreases nSC proliferation and differentiation. (a) Proliferation index of WT and atg7Δ nSCs at 24 (n = 7 per genotype) and 48 h (n ≥ 6 per genotype). (b) Representative immunoblot analysis of the proliferation marker MKI67 in WT and atg7Δ nSC protein extracts. (c-e) Experiments performed with WT and atg7Δ nSCs seeded at low density (25 x 103 cells/0.8 cm2) and differentiated into myotubes after 2 days of proliferation. (c) Representative MYH immunostaining (red) and DAPI nuclear counterstaining (blue) (scale bar: 100 µm) and RT-qPCR analysis of myogenic markers Myog, Myod1 and Myh2 (n ≥ 5 per genotype). (d) Fusion index, calculated as the percentage of the number of nuclei within myotubes over the total number of nuclei, is provided (n = 5 per genotype). (e) Mean myotubes diameter (n = 5 per genotype). (f) Mean number of myonuclei/myotube (n ≥ 5 per genotype) (left panel) and percentage of myotubes with 5 or more nuclei (right panel) (n = 5 per genotype). (g) Experiments performed with WT and atg7Δ nSCs seeded at high density (125 x 103 cells/0.8 cm2) and immediately differentiated into myotubes. Representative MYH immunostaining (red) and DAPI nuclear counterstaining (blue) (scale bar: 100 µm). Fusion index (left panel), mean number of myonuclei/myotube (middle panel) and percentage of myotubes with 5 or more nuclei (right panel) are calculated (n = 3 per genotype). Values are expressed as mean ± SEM. * vs WT (* P < 0.05, ** P < 0.01, *** P < 0.001).
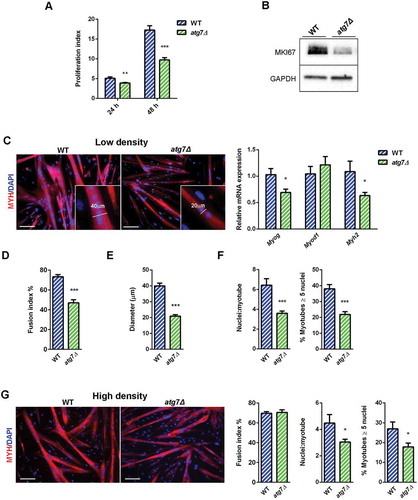
Cell density can affect satellite cell differentiation. To assess this aspect we switched nSCs to a mitogen-poor differentiation medium (DM) and monitored their differentiation. Differentiation occurs in 2 phases: single myoblasts fuse to form nascent myotubes, followed by recruitment of new nuclei to existing myotubes, leading to larger fully differentiated, myotubes. The fusion index is a valid proxy of the first phase efficiency, while the mean number of nuclei/myotube and the percentage of myotubes with 5 or more nuclei are indexes of second phase effectiveness [Citation25].
When nSCs were seeded at low confluence, they proliferated for 2 days before switching to DM. After 48 h of DM, both WT and atg7Δ mice formed multinucleated myotubes (); however, the expression levels of the myogenic markers Myog and Myh2 were reduced (). Consistently, the atg7Δ fusion index was significantly reduced () and the myotube diameter was 50% smaller than in WT (). The mean number of nuclei/myotube as well as the number of myotubes with 5 or more nuclei were severely reduced in atg7Δ mice, in agreement with a lower fusion index (), suggesting an impairment in terminal differentiation of satellite cells.
Conversely, when nSCs were seeded at high confluence and immediately switched to DM without a proliferation step, the fusion index was not reduced (), while we observed defective myotube growth, as shown by a reduced number of nuclei/myotubes and myotubes with 5 or more nuclei ().
Altogether, these data indicate that autophagy is required for both phases of differentiation: formation of myotubes controlling the number of myoblasts available for fusion, and accretion of nascent myotubes. This also suggests that autophagy has a crucial role in the overall functions of nSCs resulting in an in vivo delay of skeletal muscle growth.
Autophagy is required for induction of the GH-IGF1 axis
Given the involvement of the GH-IGF1 axis observed in atg7Δ mice and considering the effects of GH on myoblasts [Citation24,Citation25], we evaluated this axis on primary nSC cultures.
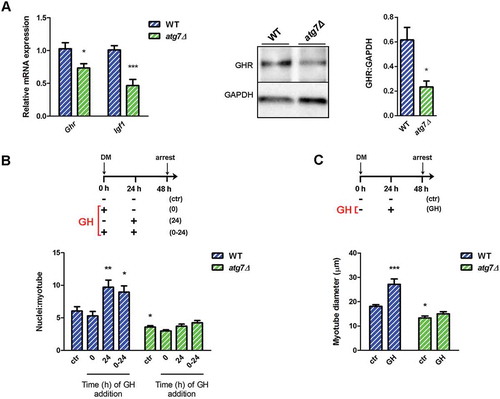
GH stimulates IGF1 production in myoblasts [Citation32,Citation33] and this IGF1 promotes cell proliferation in an autocrine manner [Citation24]. In agreement with this model, in growth condition mRNA (Ghr) and protein levels of GHR and Igf1 mRNA were significantly reduced in atg7Δ nSCs, compared to WT (), accounting for lower levels of proliferation.
GH controls myotube growth by enhancing the accumulation of nuclei in nascent myotubes [Citation24,Citation25]. GH did not enhance myotube growth when added once at the beginning of differentiation, whereas it boosted myotube size when added 24 h after differentiation induction, or twice, at time 0 and after 24 h ( and , blue bars), as previously described [Citation24,Citation25]. These GH effects were completely blunted in atg7Δ mice, as shown by the analysis of the mean number of nuclei/myotube and the quantification of myotube diameter ( and , green bars). Altogether, our data indicate that autophagy is essential for GH-IGF1 function during neonatal myogenesis affecting GHR levels and nSC behavior.
Figure 7. Autophagy is required for GH-IGF1 functions. (a) RT-qPCR analysis of Ghr and Igf1 in WT and atg7Δ nSCs (n ≥ 6 per genotype) and representative immunoblotting analysis of GHR and GADPH, as a loading control, in nSC protein extracts (n ≥ 3 per genotype). * vs WT (* P < 0.05, *** P < 0.001). (b) Myoblasts were switched into differentiation medium (DM) and treated with GH (600 ng/ml) at the beginning (0), after 24 h (24 h) or twice at time 0 and after 24 h (0 h + 24 h) of differentiation and finally harvested at 48 h. Mean number of myonuclei/myotube is calculated. (c) Myoblasts were treated with GH (600 ng/ml) after 24 h of differentiation induction and the mean myotubes diameter is provided. *vs WT untreated control (ctr) nSCs (n = 4 experiments) (* P < 0.05, ** P < 0.01, *** P < 0.001). Values are expressed as mean ± SEM.
To identify the pathway involved in this phenotype among the different signals that control cell proliferation, we conducted a gene expression analysis. Published data [Citation34,Citation35] identified 139 genes, specifically expressed in proliferating conditions, and referred to them as a ‘Myoblasts signature’. This signature is composed of cell cycle regulators and many controllers of mitosis. Within this group, we selected 93 genes whose mRNA is highly expressed in proliferative conditions and we analyzed this last group of genes comparing WT and atg7Δ nSCs after 24 h in growth medium. None of these genes was significantly changed in atg7Δ mice (Table S1), suggesting that none of these pathways is involved in the decreased atg7Δ nSCs proliferative capacity.
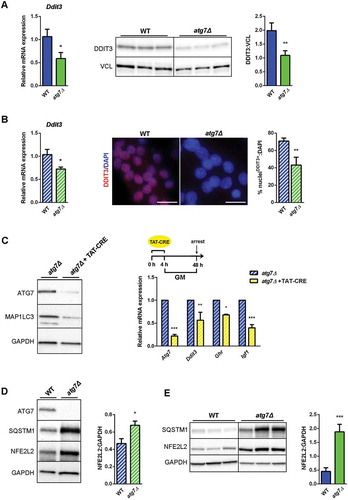
Next, we examined other known regulators of GHR expression in both neonatal muscles and satellite cells. Several microRNAs (miRNAs) have been described to directly bind Ghr transcript and to negatively regulate its expression [Citation36,Citation37]. The levels of miRNAs were unchanged (Mir16 and Mir142–3p) or even reduced (Mir129–5p and Mir202–3p) in atg7Δ mouse muscles at P21 compared to WT (Figure S3C), excluding their potential role in downregulating GHR levels. Among transcriptional activators and repressors of the Ghr promoter [Citation38], we found that the expression level of the activators, Cebpb and Ets1 (E26 avian leukemia oncogene 1, 5ʹ domain) as well of the repressor Hes1 (hes family bHLH transcription factor 1) were unchanged in nSCs ruling out their involvement in the impairment of GHR levels (Figure S3D). By contrast mRNA and protein levels of the activator DDIT3 were reduced in muscle () as well as in growing atg7Δ nSCs ().
Figure 8. Both NFE2L2 and DDIT3 are dysregulated in atg7Δ muscle and satellite cells. (a) RT-qPCR and immunoblotting analysis of DDIT3 in GC from WT and atg7Δ mice at P21. Densitometric quantification is provided (n ≥ 6 per genotype).*vs WT (* P < 0.05, ** P < 0.01, *** P < 0.001). (b) RT-qPCR analysis (n ≥ 7 per genotype) and representative nuclear immunostaining (red) of DDIT3 in WT and atg7Δ nSCs (scale bar:25 µm). DAPI is used as a nuclear stain (blue). Percentage of DDIT3-positive nuclei is provided (n = 3 per genotype).*vs WT (* P < 0.05, ** P < 0.01). (c) Acute Atg7 deletion mediated by TAT-Cre recombinase: nSCs derived from Atg7 floxed homozygous mice (Atg7fl/fl) and negative for Cre recombinase expression were treated or not with TAT-Cre recombinase for 4 h and cultured in proliferation medium (GM) for 48 h. Representative immunoblot analysis of ATG7, MAP1LC3 and GAPDH, as a loading control, are shown (left panel) and RT-qPCR analysis of Atg7, Ddit3, Ghr and Igf1 are provided (n ≥ 3 experiments) (right panel). * vs untreated Atg7fl/fl (* P < 0.05, ** P < 0.01, *** P < 0.001). (d) Representative immunoblotting analysis of ATG7, SQSTM1, NFE2L2 and GAPDH as loading control in WT and atg7Δ nSCs (n ≥ 4 per genotype) and of (e) SQSTM1, NFE2L2 and GAPDH as a loading control in GC from WT and atg7Δ mice at P21 (n = 7 per genotype). Densitometric quantifications are provided.*vs WT (* P < 0.05, *** P < 0.001). Values are expressed as mean ± SEM.
To validate DDIT3 as positive modulator of the Ghr promoter in the mouse model, we silenced Ddit3 in the C2C12 cell line. Ghr mRNA levels changed accordingly with Ddit3 expression levels, following an identical pattern and indicating that DDIT3 is able to control Ghr expression (Figure S3E). DDIT3, in concert with ATF4 (activating transcription factor 4), sustains the ER stress response [Citation39,Citation40]. However, Atf4 expression was not enhanced in atg7Δ cells (Figure S3F), suggesting that the ER stress response is not associated with the dwarf phenotype of our mice.
Similar to chronic knockdown, acute genetic deletion of Atg7 by Cre recombinase administration to floxed nSCs (, led to reduction of Ddit3, Ghr and Igf1 expression levels (, suggesting that the effect of autophagy impairment is specific and not due to compensatory events of a chronic adaptation.
DDIT3 expression correlates negatively with the presence of NFE2L2 [Citation41,Citation42], and dysregulation of autophagy results in prolonged NFE2L2 activation in a SQSTM1-dependent manner [Citation43]. Consistently, in atg7Δ mice we found accumulation of SQSTM1 and increased levels of NFE2L2 in both nSCs () and muscle (), highlighting the involvement of NFE2L2 in the atg7Δ phenotype. To conclusively assess whether a direct link between autophagy, NFE2L2, DDIT3 and GH signaling exists we used a genetic approach by which we rescued ATG7 expression in atg7Δ nSCs. Lentiviral infection of Atg7 restored expression levels of the protein () and basal autophagy, revealed by a lipidated MAP1LC3 band () and by SQSTM1 reduction in western blot and immunofluorescence analyses ( and ).
Figure 9. Rescue of ATG7 normalized NFE2L2 and DDIT3 levels and restores GH-IGF1 functions in atg7Δ nSCs. WT and atg7Δ nSCs were infected with control lentivirus (LV ctr) or lentivirus expressing ATG7 (LV Atg7). (a) Representative immunoblot analysis of ATG7, MAP1LC3, SQSTM1 and GAPDH, as a loading control. (b) Representative SQSTM1 immunostaining (red). DAPI is used for nuclear counterstaining (blue); phalloidin (ThermoFisher Scientific, A22287) is used for cell outline (gray) (scale bar: 10 µm). (c) Percentage of MKI67+ cells of total DAPI nuclear counterstaining (n = 3 experiments). (d) Mean number of myonuclei/myotube (left panel) and percentage of myotubes with 5 or more nuclei (right panel) (n = 3 experiments). (e) RT-qPCR analysis of myogenic markers Myog, Myod1 and Myh2 (n ≥ 3 experiments). (f) Representative immunoblotting analysis of ATG7, MAP1LC3, NFE2L2 and GAPDH as a loading control (n = 3 experiments). (g) Representative DDIT3 nuclear immunostaining (red) and DAPI as nuclear counterstaining (blue) (scale bar: 25 µm). (h) RT-qPCR analysis of Ddit3, Ghr and Igf1 (n ≥ 3 per treatment). * vs WT nSCs infected with LV ctr (* P < 0.05, ** P < 0.01, *** P < 0.001); + vs atg7Δ nSCs infected with LV ctr (+ P < 0.05, ++ P < 0.01). Values are expressed as mean ± SEM.
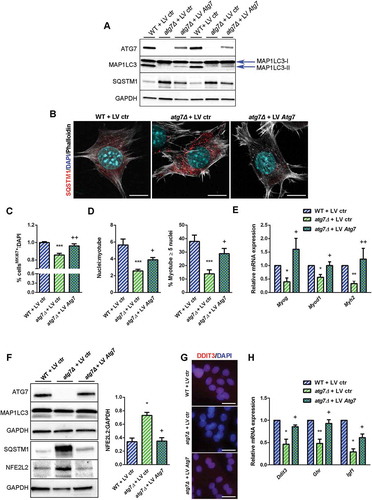
It is noteworthy that rescued ATG7 was sufficient to recover both proliferative capacity of nSCs as indicated by the higher number of MKI67+ cells () and differentiation capability, as shown by improved myotube growth () and enhanced myogenic marker expression (), confirming that autophagy is crucial for neonatal myogenesis. Of note, ATG7 expression normalized NFE2L2 levels in agreement with SQSTM1 levels () leading to increased DDIT3 expression ( and ) and Ghr levels (). Accordingly, the Igf1 levels were also enhanced after overexpression of ATG7 (), providing evidence that the GH-IGF1 axis is under the control of autophagy, through NFE2L2 and DDIT3 regulation.
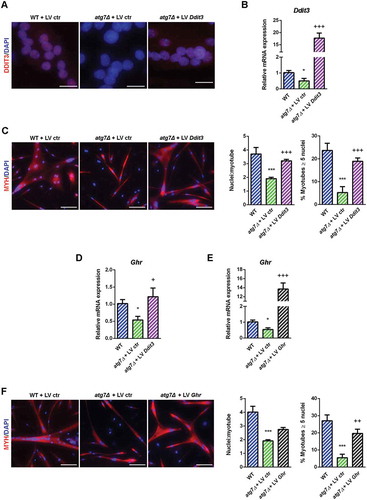
To confirm the involvement of DDIT3 and GHR in the mechanism responsible for the atg7Δ mouse dwarf phenotype we rescued both by lentiviral infection of atg7Δ nSCs. Rescue of DDIT3, as shown by immunofluorescence and mRNA analysis ( and ), restored differentiation capacity improving myotube growth to the level of WT (). Of note, Ghr expression increased after DDIT3 restoration (, confirming that GHR levels depend on DDIT3 levels. Similarly, GHR overexpression ( had a positive effect on myotube development replacing the normal differentiation capacity of atg7Δ nSCs (.
Figure 10. Rescue of DDIT3 and GHR restored myogenic capacity of atg7Δ nSCs. WT and atg7Δ nSCs were infected with control lentivirus (LV ctr) or lentivirus expressing DDIT3 (LV Ddit3) or GHR (LV Ghr). (a) Representative DDIT3 nuclear immunostaining (red) and DAPI nuclear counterstaining (blue) (scale bar: 25 µm). (b) RT-qPCR analysis of Ddit3 after lentivirus infection (n ≥ 4 per treatment). (c) Representative MYH immunostaining (red) and DAPI nuclear counterstaining (blue) (scale bar: 50 µm). Mean number of nuclei/myotube and percentage of myotubes with nuclei number ≥ 5 are provided (n = 3 per treatment). (d) RT-qPCR analysis of Ghr after infection with LV Ddit3 of atg7Δ nSCs (n = 3 per treatment). (e) RT-qPCR analysis of Ghr after infection with LV Ghr of atg7Δ nSCs (n = 3 per treatment). (f) Representative MYH immunostaining (red) and DAPI nuclear counterstaining (blue) (scale bar: 100 µm). Mean number of nuclei/myotube and percentage of myotubes with 5 or more nuclei are provided (n = 3 per treatment). * vs WT nSCs infected with LV ctr (* P < 0.05, *** P < 0.001); + vs atg7Δ nSCs infected with LV ctr (+ P < 0.05, ++ P < 0.01, +++ P < 0.001). Values are expressed as mean ± SEM.
Discussion
This study demonstrates that autophagy plays a necessary role in neonatal myogenesis and in normal muscle growth, and defines which signaling pathways downstream of it are involved in its biological effect.
Deletion of Atg7 and impairment of autophagy in embryonic MYF5+ progenitors slightly affects myocyte size [Citation18]. MYF5 is expressed at E10.5 in embryonic myoblasts and persists in fetal and adult myoblasts [Citation5], whereas it is downregulated in differentiated myogenic cells. Despite this, MYF5+ cells partially contribute to adult myonuclei [Citation19], and consequently, loss of Atg7 in MYF5+ progenitors is not the best model to investigate the role of autophagy in muscle development.
By deleting Atg7 specifically in PAX7+ progenitors, we have now found that autophagy does not affect fetal myogenesis, but reduces neonatal muscle fiber growth leading to a dwarf phenotype of mice, specifically starting at day 10 after birth. Thus, in this conditional knockout the role of autophagy is restricted to the neonatal phase. This suggests that autophagy in muscle development is important also before adulthood, and its modulation may be useful for neuromuscular disorders alongside classical therapies and rehabilitation. Little is known about the relevance of autophagy during embryonic myogenesis, which might be explored after conditional deletion of Atg7 under the control of Pax3, a gene playing a key role in that specific developmental phase [Citation8].
Several signaling pathways regulate myogenesis. TGFB1 and BMP signaling as well as the CTNNB1 pathway can affect fetal myogenesis and satellite cells [Citation3,Citation6–Citation8]. By contrast, these molecules have no effects on embryonic myogenesis; moreover extrinsic signals from connective tissue are important for the switch from fetal to adult muscle [Citation9]; thus, evaluating the full range of factors that regulate fetal, neonatal, and adult myogenesis is of interest to understand the molecular basis of muscle development.
Our study reveals a significant role of GH-IGF1 in mediating the effect of autophagy on neonatal myogenesis. The GH-IGF1 axis has a well-established role in skeletal muscle development [Citation24–Citation26,Citation28]. Igf1 as well as igf1r (insulin-like growth factor 1 receptor) null mice are runted [Citation24,Citation44], similar to the dwarf phenotype observed in atg7Δ mice characterized by reduced myonuclei and smaller myofibers without other signs of muscle degeneration.
Of note, the involvement of GH-IGF1 may also explain why the appearance of the muscle defect occurs preferentially in male mice, because GH through STAT5 leads to production of localized IGF1 that is essential for normal postnatal growth preferentially in males [Citation28,Citation30]. Besides, STAT5 controls AR expression, the dysregulation of which impairs muscle growth [Citation30,Citation31]. Consistently, in male atg7Δ mice STAT5 signaling was less activated and AR was downregulated.
The reduced number of PAX7-positive cells, detected in neonatal muscles of transgenic mice, suggests the existence of an impairment in neonatal precursor cells; indeed atg7Δ nSCs displayed a reduced proliferative capacity associated with low expression levels of GHR and Igf1 mRNA without changes either in cell cycle regulators or in mitosis controllers. This finding is in agreement with the observation that IGF1 increases proliferation and in turn fusion of myoblasts [Citation24]. However, autophagy is required for both phases of the myogenic differentiation process. Autophagy, affecting GH signaling, controls both proliferation, hence the number of myoblasts available for fusion, and the accretion of nascent myotubes, promoting myonuclear addition and maturation of nascent myotubes.
Overall, our findings demonstrate that the effectiveness of the GH-IGF1 axis in muscle depends on autophagy and results in changes of nSC proliferation and differentiation, leading to neonatal myogenesis impairment in vivo. So far, we described a genetic knockout approach and analyses long after the gene deletions; however, we used a Cre recombinase approach to inhibit autophagy acutely in floxed nSCs. These experiments were designed to avoid compensatory or secondary effects associated with chronic autophagy inhibition. We examined the correlation between autophagy and the GH-IGF1 pathway immediately after gene deletion. It is interesting to note that the effects of chronic inhibition of autophagy in nSCs are the same of those of acute inhibition, reinforcing the specificity of the results observed.
We have also identified DDIT3 as the downstream molecular target of autophagy involved in GHR regulation and responsible for myogenic impairment of atg7Δ nSCs. DDIT3 is an activator of the human GHR promoter [Citation38] that we validated also in the mouse system and it is one of the master genes involved in mitochondrial unfolded protein response (mtUPR) [Citation45,Citation46] and ER stress [Citation39]. In neonatal muscle and growing nSCs, loss of autophagy specifically reduced DDIT3 expression, without impairing other regulatory factors, as for instance miRNAs and promoter repressors. In agreement, DDIT3 expression was completely restored after ATG7 recovery and DDIT3 overexpression normalized Ghr levels, confirming that DDIT3 is under the control of autophagy, and that both affect GHR expression.
DDIT3 is a member of the CEBP transcription factor family that can be activated by ER stress [Citation47], amino acid starvation, oxidative stress [Citation48] and mtUPR [Citation45]. DDIT3 is negatively regulated by NFE2L2 levels [Citation41,Citation42,Citation49], a transcription factor that is directly linked to autophagy. Autophagy disruption enhances NFE2L2 activation with a mechanism mediated by SQSTM1 [Citation43], that sequesters KEAP1 (kelch-like ECH-associated protein 1) into phagophores impairing NFE2L2 ubiquitination and degradation [Citation43]. In atg7Δ mice, NFE2L2 levels were increased as were those of SQSTM1; ATG7 recovery normalized both NFE2L2 and SQSTM1 levels and in turn DDIT3 expression, confirming that DDIT3 is a target of NFE2L2 and that both depend on an intact autophagy process.
Autophagy deficiency enhances mitochondrial dysfunctions associated with a stress response that involves ATF4 and results in induction of FGF21 (fibroblast growth factor 21) in muscle [Citation50]. Accordingly, atg7−/- muscles fail to control protein folding enhancing an ER stress response, associated with ROS generation [Citation23]. In our model, the reduced levels of DDIT3 and the unchanged levels of Atf4 can exclude the induction of ER stress via EIF2AK3/PERK in the absence of Atg7. The apparent discrepancy between our data and those in the aforementioned studies may be reconciled by the fact that the Pax7 promoter is activated in satellite cells; conversely, the Myl1 (myosin, light polypeptide 1) promoter is activated only in differentiated myofibers. Thus, autophagy could enhance different responses during development or in differentiated muscle fibers.
Mitochondrial dysfunctions have been found in adult atg7Δ mice, where they are associated with ROS production, and contribute to acquisition of senescence and to impaired regenerative capacity of adult satellite cells [Citation17]. The authors reporting these findings show that adult quiescent satellite cells display numerical and functional impairments, suggesting that basal autophagy is required for the postnatal establishment and the maintenance of the quiescent stem cell population. These results are not in contrast with our present findings, and therefore we cannot exclude that mitochondrial dysfunctions could contribute to the phenotype observed in neonatal mice and nSCs. However, adult satellite cells (after P21) differ significantly from neonatal progenitors, in that they are quiescent cells derived from neonatal PAX7+ progenitors and they do not require PAX7 for their maintenance and function [Citation1].
In conclusion, our results provide in vivo evidence that basal autophagy, by regulating the GH-IGF1 pathway, controls specifically neonatal satellite cell activity, including proliferation and terminal differentiation and impairs selectively neonatal myogenesis. Disrupting autophagy, NFE2L2 accumulates accordingly with higher SQSTM1 levels and this leads to reduced DDIT3 expression. DDIT3, in turn, controls GHR expression reducing local production of IGF1. Collectively, we identify autophagy as an important factor for muscle maturation in the neonatal phase, and we identify a novel mechanism regulating nSC behavior.
Materials and methods
Animals
All procedures involving mice were carried out in strict accordance with the Italian law on animal care (D.L. 26/2014), as well as European Directive (2010/63/UE).
Mice with Atg7 deletion in satellite cells, here referred to as atg7Δ mice, were generating by crossing Atg7fl/fl mice (provided by M. Sandri, Venetian Institute of Molecular Medicine; Department of Biomedical Science, University of Padova, Padova, Italy) [Citation23] with Pax7Cre mice (provided by P. Muñoz-Cánoves, Pompeu Fabra University, CIBER on Neurodegenerative Diseases -CIBERNED- Barcelona, Spain) [Citation17]. All mice used in this study were between 6–21 days after birth and had age-matched littermate controls. Genomic DNA isolated from mice containing an Atg7fl/fl was subjected to PCR analysis using the primers described by Komatsu and co-workers [Citation51].
Atg7fl:
Fw: 5ʹ-TGGCTGCTACTTCTGCAATGATGT-3ʹ;
Rev: 5ʹ-CAGGACAGAGACCATCAGCTCCAC-3ʹ.
Cre recombinase:
Fw: 5ʹ-CACCAGCCAGCTATCAACTCG-3ʹ;
Rev: 5ʹ-TTACATTGGTCCAGCCACCAG-3ʹ.
Animal experimentation was approved by the Ministero della Salute (approval numbers n° 0214). All efforts were made to reduce both animal suffering and the number of animals used.
Preparation of embryos
Mouse mutants were genotyped and interbred, and embryos were harvested at the indicated time points. Embryos were fixed in 4% paraformaldehyde (PFA; Sigma-Aldrich, P6148), embedded and cryopreserved in a sucrose (VWR, 443815S) gradient (30%-20%-10%), and frozen with OCT freezing medium (Tissue-Tek O.C.T. Compound; VWR, 25608–930) in isopentane (Sigma-Aldrich, 277258). Cryostat sections 10–20 µm were labeled with antibodies for ATG7, MYH and LAM/laminin (references for antibodies were reported in ).
Table 1. Antibodies list.
Free fatty acid and triglyceride serum levels
Free fatty acid and triglyceride serum levels (Cayman, 700310 and 10010303) were measured according to the manufacturer’s protocol by fluorimetric and colorimetric assays, respectively.
Neonatal satellite cells isolation and culture conditions
To obtain purified nSCs we applied a standardized, automated tissue dissociation protocol using the gentleMACS™ Octo Dissociator with Heaters (Miltenyi Biotec, Bergisch Gladbach, Germany) that efficiently produces a viable single-cell suspension preserving cell surface markers.
Dissociation is followed by magnetic depletion of lineage PECAM1-, PTPRC-, ITGAM-, and LY6A/Sca-1-positive cells using the Satellite Cell Isolation Kit (Miltenyi Biotec, 130–104–268), according to the manufacturer’s protocols.
nSCs were cultured in DMEM (EuroClone, ECB7501L) supplemented with 20% fetal bovine serum (EuroClone, ECS0180L), 3% chick embryo extract (custom made) [Citation52], 10 ng/ml basic FGF (PeproTech, 100–18B) and 1% penicillin-streptomycin (EuroClone, ECB3001D/1) at 37°C with 5% CO2. To assess myotube formation, nSCs were plated on matrigel (BD Biosciences, 354234)-coated plates and cultured for 2 days in growth medium, ensuring sufficient cell density to promote fusion and differentiation. Myogenic differentiation was induced in DMEM supplemented with 2% horse serum (EuroClone, ECS0090L) and 1% penicillin-streptomycin, and myotubes were immunostained for skeletal muscle myosin and DAPI (ThermoFisher Scientific, 62248) to calculate fusion index and number of nuclei. Both were determined from 3 to 5 randomly chosen microscopy fields and the fusion index was expressed as the ratio of the number of nuclei within myotubes over the total number of nuclei. Each experiment was replicated at least 3 times.
To measure the hypertrophic response of GH, nSCs were treated with 600 ng/ml of GH (Genotropin ® 0.4mg, Pfizer, kindly provided by Dr. Pogliani Laura, Hospital Luigi Sacco-ASST Fatebenefratelli Sacco) added at the beginning of differentiation. Hormone was added daily and after 48 h the cells were harvested and the diameter of myotubes was measured, counting 3 random fields for each condition and repeating the experiments at least 4 times.
To acutely knockdown Atg7, nSCs from homozygous fl/fl mice were isolated and treated with Cre recombinase (5 µM; Merck Millipore, SCR508) for 4 h in DMEM 1% glutamine (EuroClone ECB3000D). Then, the medium was replaced with growth medium and the cells were harvested after 48 h. Each experiment was replicated at least 3 times.
C2C12 culture conditions and transfection
C2C12 cells (ATCC, CRL-1772) were cultured in DMEM (EuroClone, ECB7501L) supplemented with 20% fetal bovine serum (EuroClone, ECS0180L) and 1% penicillin-streptomycin at subconfluent densities.
To knock down Ddit3 in C2C12 cells, iBONI siRNA Pool (a mix of 3 RNA duplex-small interfering RNAs) (Riboxx Life Sciences, D-00101–0005) treatment was carried out using Lipofectamine RNAiMAX (ThermoFisher Scientific, 13778100) according to the manufacturer’s instructions. iBONI siRNA Pool negative control (non-targeting siRNA; Riboxx Life Sciences, K-00100–0005) was also used. siRNA were added at a concentration of 50 nM, and 72–96 h after transfection cells were harvested for RNA analysis. The sequences of siRNAs are listed in Table S2. Each experiment was replicated at least 3 times.
Lentivirus infection
pLenti-CMV-Gfp-2A-Puro-Blank vector (abm, LV590), pLenti-GIII-CMV-Mouse-Atg7-GFP-2A-Puro (abm, LV473195), pLenti-GIII-CMV-Mouse-Ddit3-GFP-2A-Puro (abm, LV495317) and pLenti-GIII-CMV-Mouse-Ghr-GFP-2A-Puro (abm, LV456983) vectors were provided by Aurogene srl. The plasmids were transfected into the HEK293T cell line (available in the lab) using Lipofectamine LTX with Plus Reagent (ThermoFisher Scientific, 15338100) to package into active virus particles. nSCs were lentivirally transduced by 2 cycles of infection and harvested 24 or 48 h post infection.
Cell proliferation analysis
In nSC cultures, proliferative capacity was assayed using the Cytotrack cell proliferation assay kit (CytoTrack Green 511/525; Bio-Rad, 1351203), measuring the serial halving of cell fluorescence intensity via flow cytometry [Citation53]. Cells were loaded with CytoTrack Green according to the manufacturer’s protocol, plated at 5 × 10⁵ cells per well and harvested after 24 and 48 h in growing conditions. The fluorescence was acquired using a Gallios Flow Cytometer (Beckman-Coulter, Brea, CA, USA) and analyzed with the software FCS Express 4 (De Novo System, Portland, OR, USA). The proliferation index is defined as the average number of cells that an initial cell became, and it was calculated using FCS Express software. Each experiment was performed at least 3 times.
Quantitative real-time PCR analysis
RNA was isolated from muscles or nSCs in growing and differentiated conditions (48 h) by phase separation in TRIzol (ThermoFisher Scientific, 15596026) according to an already described protocols [Citation46,Citation54]. Total RNA (1 µg) was retro-transcribed using either Script Reverse Transcription Supermix (Bio-Rad, 1708841) for mRNA analysis, or NCode VILO miRNA cDNA synthesis kit (ThermoFisher Scientific, A11193050) for microRNA analysis. PCR was performed using SsoAdvanced Universal SYBR Green Supermix (Bio-Rad, 1725271) and the CFX96 Touch Real-Time PCR Detection System (Bio-Rad). The primers for RT-qPCR are listed in Table S3. All reactions were run as triplicates and the fold change was determined relative to either Rplp0 (ribosomal protein, large, P0; mRNA internal reference) or Rnu6 (U6 small nuclear RNA; miRNA internal reference) housekeeping transcripts using the 2−ΔΔCT formula [Citation53].
For gene expression analysis, a customizable PrimePCR 96-well plate (Bio-Rad) was designed with a selection of 93 genes from those reported as part of the ‘Myoblast Signature’ [Citation34]. We selected genes whose mRNA levels were at least 10-fold higher in proliferating myoblasts, and total RNA from WT and atg7Δ mice-derived proliferating nCSs was extracted after 2 days in growth medium. The screening was replicated at least 3 times. The list of genes and the fold change are reported in Table S1
Immunofluorescence
For histology, muscles were dissected and immediately frozen in liquid N2-cooled isopentane (Sigma-Aldrich, 277258) to allow preparation of 5-μm thick sections [Citation55].
For immunofluorescence, we followed protocols already described [Citation56]. In brief, frozen 5-μm cross-sections of muscle were fixed with 4% PFA for 10 min and permeabilized with 0.1% Triton X-100 (Sigma-Aldrich, X100) in DPBS (EuroClone, ECB4004L). Sections were then blocked for 30 min with blocking solution: 2% normal goat serum (NGS; Vector Laboratories, S-1000), 0.5% bovin serum albumin (BSA; Sigma-Aldrich, A2058) in DPBS. All primary antibodies were diluted in blocking solution and incubated at room temperature for 2 h. After incubation with the appropriate fluorescent-labeled secondary antibodies (Alexa Fluor conjugates; ThermoFisher, listed in ), nuclei were counterstained with Hoechst 33342 (ThermoFisher Scientific, H1399) and slides were finally mounted with the ProLong Gold antifade reagent (ThermoFisher Scientific, P36984). The antibodies are listed in .
Immunocytochemistry was performed following the same protocol with the exception of PAX7. Dissected muscles were incubated overnight at 4°C in 30% sucrose, flash frozen, cryosectioned at 10 µm, and stored at −80°C before staining. Muscle sections were fixed for 3 min in 4% PFA and treated for antigen retrieval by incubation in pre-heated citrate buffer (10 mM sodium citrate, pH 6.0; Sigma-Aldrich, C9999), for 15 min at 80°C. Tissue sections were permeabilized with 0.1% Triton X-100, 1% BSA in DPBS for 30 min and blocked in 10% NGS in DPBS for 30 min at room temperature. Primary antibody incubation in 0.1% Triton X-100, 1% BSA in DPBS was carried out overnight at 4°C then sections were incubated with fluorescently labeled secondary antibodies in 0.1% Triton X-100, 1% BSA in DPBS for 1 h at RT. DAPI (ThermoFisher Scientific, D1306) staining was used to label nuclei. Slides were finally mounted with the ProLong Gold antifade reagent.
For cell staining, cells were plated in 8-well Nunc LabTeck Chamber slides (ThermoFisher Scientific, 154534PK). Cells were fixed with 4% PFA for 10 min at room temperature and permeabilized with 0.1% Triton X-100 in DPBS for 5 min at room temperature. Cells were then blocked in blocking solution (10% NGS in DPBS), and labeled with primary antibodies, prepared in blocking solution and incubated at 4°C overnight. Cells were then incubated with Alexa Fluor-conjugated antibodies in blocking solution for 1 h at room temperature [Citation54].
Confocal imaging was performed with a Leica TCS SP5 AOBS microscope system with oil immersion objective 63x/1.47 (Leica, Wetzlar, Germany). Image acquisitions were controlled by Leica LAS AF software (Leica, Wetzlar, Germany).
Histology and morphometric analysis
For the assessment of skeletal muscle morphology, LAM/laminin, and hematoxylin and eosin (H & E) staining were performed as previously described [Citation57,Citation58]. For quantitative analysis, cross-sectional area (CSA) was analyzed in LAM/laminin-stained (see ) muscle sections using ImageJ software. For each muscle, the distribution of myofiber was calculated by analyzing approximately 500 myofibers for each genotype [Citation46,Citation54].
For histological analyses, the number of fibers was counted in H & E-stained (Bio-Optica, 05–06002/L, 05–10002/L) muscle sections and analyzed using ImageJ software [Citation46,Citation54].
Single myofiber isolation of hind limb muscle and nuclei immunofluorescence on single fibers was performed as previously described [Citation59]. Nuclei of 30 individual fibers from each genotype were analyzed.
Immunoblotting
Proteins were extracted from muscles, adipose tissues (BAT and WAT) and cells. Muscles, BAT and WAT were homogenized with Ultra-Turrax (Ika Werke GmbH & Co. KG, 0003737000) in a lysis buffer containing 20 mM Tris-HCl, pH 7.4, 10 mM EGTA, 150 mM NaCl, 1% Triton X-100, 10% glycerol (Sigma Aldrich, G5516), 1% SDS (Sigma Aldrich, L3771), supplemented with a cocktail of protease and phosphatase inhibitors (cOmplete and PhosSTOP; Sigma-Aldrich, 04693116001 and PHOSS-RO). Protein extracts from cells were performed in RIPA buffer (50 mM Tris-HCl, pH 7.4, 150 mM NaCl, 0.1% SDS [Sigma Aldrich, L3771], 1% NP-40 [Sigma-Aldrich, NP-40S], 0.25% sodium deoxycholate [Sigma-Aldrich, D6750], 1 mM EDTA) supplemented with a cocktail of protease and phosphatase inhibitors.
Protein concentrations were determined by Bio-Rad protein assay (Bio-Rad, 500–0006). Thirty to 50 µg of total protein were loaded on 4–20% polyacrylamide precast gels (Criterion TGX Stain-free precast gels; Bio-Rad, 5678094). Proteins were transferred onto a nitrocellulose membrane using a Trans-Blot Turbo SystemTM (Bio-Rad) and Transfer packTM (Bio-Rad, 1704156). The antibodies used for the analyses are listed in and bands were visualized using HRP-linked secondary antibodies (Bio-Rad, anti-mouse 1706516, anti-rabbit 1706515) and the Clarity Western ECL substrate (Bio-Rad, 1705061), with ChemiDoc MP imaging system (Bio-Rad). The blots were routinely treated with glycine (0.2 M, pH 2.5) stripping buffer and reprobed with the appropriate antibodies.
Statistical analyses
Results are presented as mean + SEM. Statistical significance was determined by Student’s t-tests for simple comparison or by one-way ANOVA and Bonferroni post test for multiple comparisons with Graph Pad Prism software. p < 0.05 was considered statistically significant.
Supplemental Material
Download Zip (5 MB)Acknowledgments
We are grateful to Pura Muñoz-Cánoves (Pompeu Fabra University, CIBER on Neurodegenerative Diseases -CIBERNED- Barcelona, Spain) for providing us Pax7Cre mice and to Silvia Brunelli (School of Medicine and Surgery, University of Milano-Bicocca, Milan, Italy) for technical advice for embryos analyses. This work was supported by Ministero della Salute Giovani Ricercatori (GR–2011–02350544) to CDP; Ricerca corrente 2017 and Ministero dell’Istruzione, Università e Ricerca PRIN2015 (2015MJBEM2) to EC.
Disclosure statement
No potential conflict of interest was reported by the authors.
Supplementary material
Supplementary data for this article can be accessed here.
Additional information
Funding
Related Research Data
References
- Murphy M, Kardon G. Origin of vertebrate limb muscle: the role of progenitor and myoblast populations. Curr Top Dev Biol. 2011;96:1–32. PubMed PMID: 21621065.
- Messina G, Cossu G. The origin of embryonic and fetal myoblasts: a role of Pax3 and Pax7. Genes Dev. 2009 Apr 15;23(8):902–905. PubMed PMID: 19390084.
- Biressi S, Molinaro M, Cossu G. Cellular heterogeneity during vertebrate skeletal muscle development. Dev Biol. 2007 Aug 15;308(2):281–293. PubMed PMID: 17612520.
- Mauro A. Satellite cell of skeletal muscle fibers. J Biophys Biochem Cytol. 1961 Feb;9:493–495. PubMed PMID: 13768451; PubMed Central PMCID: PMC2225012.
- Biressi S, Tagliafico E, Lamorte G, et al. Intrinsic phenotypic diversity of embryonic and fetal myoblasts is revealed by genome-wide gene expression analysis on purified cells. Dev Biol. 2007 Apr 15;304(2):633–651. PubMed PMID: 17292343.
- Ono Y, Calhabeu F, Morgan JE, et al. BMP signalling permits population expansion by preventing premature myogenic differentiation in muscle satellite cells. Cell Death Differ. 2011 Feb;18(2):222–234. PubMed PMID: 20689554; PubMed Central PMCID: PMC3044455.
- Perez-Ruiz A, Ono Y, Gnocchi VF, et al. beta-Catenin promotes self-renewal of skeletal-muscle satellite cells. J Cell Sci. 2008 May 01;121(Pt 9):1373–1382. PubMed PMID: 18397993.
- Hutcheson DA, Zhao J, Merrell A, et al. Embryonic and fetal limb myogenic cells are derived from developmentally distinct progenitors and have different requirements for beta-catenin. Genes Dev. 2009 Apr 15;23(8):997–1013. PubMed PMID: 19346403; PubMed Central PMCID: PMC2675868.
- Mathew SJ, Hansen JM, Merrell AJ, et al. Connective tissue fibroblasts and Tcf4 regulate myogenesis. Development. 2011 Jan;138(2):371–384. PubMed PMID: 21177349; PubMed Central PMCID: PMC3005608.
- Guan JL, Simon AK, Prescott M, et al. Autophagy in stem cells. Autophagy. 2013 Jun 01;9(6):830–849. PubMed PMID: 23486312; PubMed Central PMCID: PMC3672294.
- Singh R, Cuervo AM. Autophagy in the cellular energetic balance. Cell Metab. 2011 May 04;13(5):495–504. PubMed PMID: 21531332; PubMed Central PMCID: PMC3099265.
- Mizushima N, Levine B, Cuervo AM, et al. Autophagy fights disease through cellular self-digestion. Nature. 2008 Feb 28;451(7182):1069–1075. PubMed PMID: 18305538; PubMed Central PMCID: PMC2670399.
- Phadwal K, Watson AS, Simon AK. Tightrope act: autophagy in stem cell renewal, differentiation, proliferation, and aging. Cell Mol Life Sci. 2013 Jan;70(1):89–103. PubMed PMID: 22669258; PubMed Central PMCID: PMC3535400.
- Fortini P, Ferretti C, Iorio E, et al. The fine tuning of metabolism, autophagy and differentiation during in vitro myogenesis. Cell Death Dis. 2016 Mar;31(7):e2168. PubMed PMID: 27031965; PubMed Central PMCID: PMC4823951.
- Sin J, Andres AM, Taylor DJ, et al. Mitophagy is required for mitochondrial biogenesis and myogenic differentiation of C2C12 myoblasts. Autophagy. 2016;12(2):369–380. PubMed PMID: 26566717; PubMed Central PMCID: PMC4836019.
- Tang AH, Rando TA. Induction of autophagy supports the bioenergetic demands of quiescent muscle stem cell activation. EMBO J. 2014 Dec 01;33(23):2782–2797. PubMed PMID: 25316028; PubMed Central PMCID: PMC4282556.
- Garcia-Prat L, Martinez-Vicente M, Perdiguero E, et al. Autophagy maintains stemness by preventing senescence. Nature. 2016 Jan 07;529(7584):37–42. PubMed PMID: 26738589.
- Martinez-Lopez N, Athonvarangkul D, Sahu S, et al. Autophagy in Myf5+ progenitors regulates energy and glucose homeostasis through control of brown fat and skeletal muscle development. EMBO Rep. 2013 Sep;14(9):795–803. PubMed PMID: 23907538; PubMed Central PMCID: PMC3790054.
- Haldar M, Karan G, Tvrdik P, et al. Two cell lineages, myf5 and myf5-independent, participate in mouse skeletal myogenesis. Dev Cell. 2008 Mar;14(3):437–445. PubMed PMID: 18331721; PubMed Central PMCID: PMC2917991.
- Relaix F, Rocancourt D, Mansouri A, et al. Divergent functions of murine Pax3 and Pax7 in limb muscle development. Genes Dev. 2004 May 01;18(9):1088–1105. PubMed PMID: 15132998; PubMed Central PMCID: PMC406297.
- Lepper C, Conway SJ, Fan CM. Adult satellite cells and embryonic muscle progenitors have distinct genetic requirements. Nature. 2009 Jul 30;460(7255):627–631. PubMed PMID: 19554048; PubMed Central PMCID: PMC2767162.
- Lepper C, Fan CM. Inducible lineage tracing of Pax7-descendant cells reveals embryonic origin of adult satellite cells. Genesis. 2010 Jul;48(7):424–436. PubMed PMID: 20641127; PubMed Central PMCID: PMC3113517.
- Masiero E, Agatea L, Mammucari C, et al. Autophagy is required to maintain muscle mass. Cell Metab. 2009 Dec;10(6):507–515; S1550–4131(09)00310–6 [pii]. PubMed PMID: 19945408; eng.
- Mavalli MD, DiGirolamo DJ, Fan Y, et al. Distinct growth hormone receptor signaling modes regulate skeletal muscle development and insulin sensitivity in mice. J Clin Invest. 2010 Nov;120(11):4007–4020. PubMed PMID: 20921627; PubMed Central PMCID: PMC2964973.
- Sotiropoulos A, Ohanna M, Kedzia C, et al. Growth hormone promotes skeletal muscle cell fusion independent of insulin-like growth factor 1 up-regulation. Proc Natl Acad Sci U S A. 2006 May 09;103(19):7315–7320. PubMed PMID: 16670201; PubMed Central PMCID: PMC1456062.
- Kim H, Barton E, Muja N, et al. Intact insulin and insulin-like growth factor-I receptor signaling is required for growth hormone effects on skeletal muscle growth and function in vivo. Endocrinology. 2005 Apr;146(4):1772–1779. PubMed PMID: 15618350.
- Schiaffino S, Mammucari C. Regulation of skeletal muscle growth by the IGF1-Akt/PKB pathway: insights from genetic models. Skelet Muscle. 2011 Jan 24;1(1):4. PubMed PMID: 21798082; PubMed Central PMCID: PMC3143906.
- Klover P, Hennighausen L. Postnatal body growth is dependent on the transcription factors signal transducers and activators of transcription 5a/b in muscle: a role for autocrine/paracrine insulin-like growth factor I. Endocrinology. 2007 Apr;148(4):1489–1497. PubMed PMID: 17158201.
- Davey HW, Xie T, McLachlan MJ, et al. STAT5b is required for GH-induced liver IGF-I gene expression. Endocrinology. 2001 Sep;142(9):3836–3841. PubMed PMID: 11517160.
- Klover P, Chen W, Zhu BM, et al. Skeletal muscle growth and fiber composition in mice are regulated through the transcription factors STAT5a/b: linking growth hormone to the androgen receptor. FASEB J. 2009 Sep;23(9):3140–3148. PubMed PMID: 19417088; PubMed Central PMCID: PMC2735360.
- MacLean HE, Chiu WS, Notini AJ, et al. Impaired skeletal muscle development and function in male, but not female, genomic androgen receptor knockout mice. FASEB J. 2008 Aug;22(8):2676–2689. PubMed PMID: 18390925.
- Frost RA, Nystrom GJ, Lang CH. Regulation of IGF-I mRNA and signal transducers and activators of transcription-3 and −5 (Stat-3 and −5) by GH in C2C12 myoblasts. Endocrinology. 2002 Feb;143(2):492–503. PubMed PMID: 11796503.
- Sadowski CL, Wheeler TT, Wang LH, et al. GH regulation of IGF-I and suppressor of cytokine signaling gene expression in C2C12 skeletal muscle cells. Endocrinology. 2001 Sep;142(9):3890–3900. PubMed PMID: 11517167.
- Li Z, Gilbert JA, Zhang Y, et al. An HMGA2-IGF2BP2 axis regulates myoblast proliferation and myogenesis. Dev Cell. 2012 Dec 11;23(6):1176–1188. PubMed PMID: 23177649; PubMed Central PMCID: PMC3645921.
- Fukada S, Uezumi A, Ikemoto M, et al. Molecular signature of quiescent satellite cells in adult skeletal muscle. Stem Cells. 2007 Oct;25(10):2448–2459. PubMed PMID: 17600112.
- Lin S, Li H, Mu H, et al. Let-7b regulates the expression of the growth hormone receptor gene in deletion-type dwarf chickens. BMC Genomics. 2012 Jul;10(13):306. PubMed PMID: 22781587; PubMed Central PMCID: PMC3428657.
- Elzein S, Goodyer CG. Regulation of human growth hormone receptor expression by microRNAs. Mol Endocrinol. 2014 Sep;28(9):1448–1459. PubMed PMID: 25073105.
- Wei Y, Puzhko S, Wabitsch M, et al. Transcriptional regulation of the human growth hormone receptor (hGHR) gene V2 promoter by transcriptional activators and repressor. Mol Endocrinol. 2009 Mar;23(3):373–387. PubMed PMID: 19116245.
- Oyadomari S, Mori M. Roles of CHOP/GADD153 in endoplasmic reticulum stress. Cell Death Differ. 2004 Apr;11(4):381–389. PubMed PMID: 14685163.
- Szegezdi E, Logue SE, Gorman AM, et al. Mediators of endoplasmic reticulum stress-induced apoptosis. EMBO Rep. 2006 Sep;7(9):880–885. PubMed PMID: 16953201; PubMed Central PMCID: PMC1559676.
- Zong ZH, Du ZX, Li N, et al. Implication of Nrf2 and ATF4 in differential induction of CHOP by proteasome inhibition in thyroid cancer cells. Biochim Biophys Acta. 2012 Aug;1823(8):1395–1404. PubMed PMID: 22691366.
- Cullinan SB, Diehl JA. PERK-dependent activation of Nrf2 contributes to redox homeostasis and cell survival following endoplasmic reticulum stress. J Biol Chem. 2004 May 7;279(19):20108–20117. PubMed PMID: 14978030.
- Jiang T, Harder B, Rojo de la Vega M, et al. p62 links autophagy and Nrf2 signaling. Free Radic Biol Med. 2015 Nov;88(Pt B):199–204. PubMed PMID: 26117325; PubMed Central PMCID: PMC4628872.
- Liu JP, Baker J, Perkins AS, et al. Mice carrying null mutations of the genes encoding insulin-like growth factor I (Igf-1) and type 1 IGF receptor (Igf1r). Cell. 1993 Oct 08;75(1):59–72. PubMed PMID: 8402901.
- Horibe T, Hoogenraad NJ. The chop gene contains an element for the positive regulation of the mitochondrial unfolded protein response. PLoS One. 2007 Sep 12;2(9):e835. PubMed PMID: 17848986; PubMed Central PMCID: PMC1950685.
- Touvier T, De Palma C, Rigamonti E, et al. Muscle-specific Drp1 overexpression impairs skeletal muscle growth via translational attenuation. Cell Death Dis. 2015;6:e1663. PubMed PMID: 25719247.
- Ubeda M, Habener JF. CHOP gene expression in response to endoplasmic-reticular stress requires NFY interaction with different domains of a conserved DNA-binding element. Nucleic Acids Res. 2000 Dec 15;28(24):4987–4997. PubMed PMID: 11121490; PubMed Central PMCID: PMC115245.
- Guyton KZ, Xu Q, Holbrook NJ. Induction of the mammalian stress response gene GADD153 by oxidative stress: role of AP-1 element. Biochem J. 1996 Mar 1;314(Pt 2):547–554. PubMed PMID: 8670069; PubMed Central PMCID: PMC1217084.
- Cullinan SB, Zhang D, Hannink M, et al. Nrf2 is a direct PERK substrate and effector of PERK-dependent cell survival. Mol Cell Biol. 2003 Oct;23(20):7198–7209. PubMed PMID: 14517290; PubMed Central PMCID: PMC230321
- Kim KH, Jeong YT, Oh H, et al. Autophagy deficiency leads to protection from obesity and insulin resistance by inducing Fgf21 as a mitokine. Nat Med. 2013 Jan;19(1):83–92. PubMed PMID: 23202295.
- Komatsu M, Waguri S, Ueno T, et al. Impairment of starvation-induced and constitutive autophagy in Atg7-deficient mice. J Cell Biol. 2005 May 09;169(3):425–434. PubMed PMID: 15866887; PubMed Central PMCID: PMC2171928.
- Pajtler K, Bohrer A, Maurer J, et al. Production of chick embryo extract for the cultivation of murine neural crest stem cells. Journal Visualized Experiments: JoVE. 2010 Nov;27(45). PubMed PMID: 21178955; PubMed Central PMCID: PMC3159602. DOI:10.3791/2380.
- Perrotta C, Buonanno F, Zecchini S, et al. Climacostol reduces tumour progression in a mouse model of melanoma via the p53-dependent intrinsic apoptotic programme. Sci Rep. 2016 Jun;07(6):27281. PubMed PMID: 27271364; PubMed Central PMCID: PMC4895139.
- De Palma C, Morisi F, Pambianco S, et al. Deficient nitric oxide signalling impairs skeletal muscle growth and performance: involvement of mitochondrial dysregulation. Skelet Muscle. 2014;4(1):22. PubMed PMID: 25530838; PubMed Central PMCID: PMC4272808.
- De Palma C, Di Paola R, Perrotta C, et al. Ibuprofen-arginine generates nitric oxide and has enhanced anti-inflammatory effects. Pharmacological Res. 2009;60(4):221–228.
- Pambianco S, Giovarelli M, Perrotta C, et al. Reversal of defective mitochondrial biogenesis in limb-girdle muscular dystrophy 2D by independent modulation of histone and PGC-1alpha acetylation. Cell Rep. 2016 Dec 13;17(11):3010–3023. PubMed PMID: 27974213.
- De Palma C, Morisi F, Cheli S, et al. Autophagy as a new therapeutic target in Duchenne muscular dystrophy. Cell Death Dis. 2012;3:11.
- Miglietta D, De Palma C, Sciorati C, et al. Naproxcinod shows significant advantages over naproxen in the mdx model of duchenne muscular dystrophy. Orphanet J Rare Dis. 2015;10(1):101. PubMed PMID: 26296873; PubMed Central PMCID: PMC4546261. .
- Buono R, Vantaggiato C, Pisa V, et al. Nitric oxide sustains long-term skeletal muscle regeneration by regulating fate of satellite cells via signaling pathways requiring Vangl2 and cyclic GMP. Stem Cells. 2012 Feb;30(2):197–209. PubMed PMID: 22084027; PubMed Central PMCID: PMC3378700.