
ABSTRACT
Heterozygous mutations in GBA, the gene encoding the lysosomal enzyme glucosylceramidase beta/β-glucocerebrosidase, comprise the most common genetic risk factor for Parkinson disease (PD), but the mechanisms underlying this association remain unclear. Here, we show that in GbaL444P/WT knockin mice, the L444P heterozygous Gba mutation triggers mitochondrial dysfunction by inhibiting autophagy and mitochondrial priming, two steps critical for the selective removal of dysfunctional mitochondria by autophagy, a process known as mitophagy. In SHSY-5Y neuroblastoma cells, the overexpression of L444P GBA impeded mitochondrial priming and autophagy induction when endogenous lysosomal GBA activity remained intact. By contrast, genetic depletion of GBA inhibited lysosomal clearance of autophagic cargo. The link between heterozygous GBA mutations and impaired mitophagy was corroborated in postmortem brain tissue from PD patients carrying heterozygous GBA mutations, where we found increased mitochondrial content, mitochondria oxidative stress and impaired autophagy. Our findings thus suggest a mechanistic basis for mitochondrial dysfunction associated with GBA heterozygous mutations.
Abbreviations: AMBRA1: autophagy/beclin 1 regulator 1; BECN1: beclin 1, autophagy related; BNIP3L/Nix: BCL2/adenovirus E1B interacting protein 3-like; CCCP: carbonyl cyanide 3-chloroyphenylhydrazone; CYCS: cytochrome c, somatic; DNM1L/DRP1: dynamin 1-like; ER: endoplasmic reticulum; GBA: glucosylceramidase beta; GBA-PD: Parkinson disease with heterozygous GBA mutations; GD: Gaucher disease; GFP: green fluorescent protein; LC3B: microtubule-associated protein 1 light chain 3 beta; LC3B-II: lipidated form of microtubule-associated protein 1 light chain 3 beta; MitoGreen: MitoTracker Green; MitoRed: MitoTracker Red; MMP: mitochondrial membrane potential; MTOR: mechanistic target of rapamycin kinase; MYC: MYC proto-oncogene, bHLH transcription factor; NBR1: NBR1, autophagy cargo receptor; Non-GBA-PD: Parkinson disease without GBA mutations; PD: Parkinson disease; PINK1: PTEN induced putative kinase 1; PRKN/PARK2: parkin RBR E3 ubiquitin protein ligase; RFP: red fluorescent protein; ROS: reactive oxygen species; SNCA: synuclein alpha; SQSTM1/p62: sequestosome 1; TIMM23: translocase of inner mitochondrial membrane 23; TOMM20: translocase of outer mitochondrial membrane 20; VDAC1/Porin: voltage dependent anion channel 1; WT: wild type
Introduction
GBA (glucosylceramidase beta) is a lysosomal enzyme that degrades glucosylceramide to ceramide and glucose. Homozygous GBA mutations cause Gaucher disease (GD), the most common lysosomal disorder, whereas heterozygous GBA mutations are the most common genetic risk factor for Parkinson disease (PD), present in 7–20% of all PD cases [Citation1]. Compared to PD patients lacking GBA mutations (Non-GBA-PD), patients with heterozygous GBA mutations (GBA-PD) have an earlier age at onset, greater cognitive decline, and a faster rate of disease progression [Citation2,Citation3].
The mechanisms underlying the association between heterozygous GBA mutations and PD are unclear. The pathogenesis of PD, however, involves abnormalities in mitochondrial function, which include impaired mitochondrial electron transport chain function, damaged mitochondrial DNA, impaired calcium buffering, and abnormal mitochondrial morphology and dynamics [Citation4–Citation7]. Moreover, familial PD can be caused by mutations in genes that encode the proteins PINK (PTEN induced putative kinase 1), PRKN/PARK2 (parkin RBR E3 ubiquitin protein ligase) and PARK7/DJ-1 [Citation8], each of which contribute to the selective removal of dysfunctional mitochondria by macroautophagy (autophagy hereafter). In this process, known as mitophagy, compromised mitochondria are flagged by autophagy receptors, recognized and engulfed by phagophores, which mature into autophagosomes, and delivered to lysosomes for degradation.
Recent studies reported mitochondrial fragmentation, reduced respiratory chain complex activities, decreased mitochondrial membrane potential (MMP) and lower oxygen consumption in neuronal and glial cells of Gba conditional knockout mice [Citation9,Citation10]. The link between GBA deficiency and mitochondrial dysfunction is corroborated by decreased MMP in neuronal cultures treated with conduritol B epoxide (CBE), a covalent inhibitor of GBA [Citation11,Citation12]. These findings provided evidence for a loss-of-function mechanism of GBA mutations for mitochondrial dysfunction associated with GD, in which both GBA alleles are mutated, resulting in a reduction in GBA protein levels and lysosomal GBA enzyme activity, probably because GBA mutations often lead to misfolded proteins that are retained in the endoplasmic reticulum (ER) and undergo rapid ER-associated degradation through the ubiquitin-proteasome pathway [Citation9]. As a consequence, an accumulation of GBA lipid substrate is found in GD throughout the body.
Whereas reduced GBA activity is associated with GBA1 mutations, and has been reported in both sporadic PD and heterozygous GBA-PD patients, as well as in D409V/WT, L444P/WT, and N370S/WT heterozygous GBA mutant or heterozygous Gba knockout (WT/-) mouse brain [Citation13,Citation14], hemizygous Gba knbockout (GbaWT/-) mouse neurons and glia do not show mitochondrial defects [Citation10]. It thus remains unclear whether and how heterozygous GBA mutations, particularly those commonly encountered in PD patients (L444P and N370S), contribute to mitochondrial dysfunction associated with PD.
In this study, we address whether and how heterozygous GBA mutations affect mitochondrial homeostasis and autophagy-lysosome degradation. We found that knockin mice carrying one copy of the PD-associated L444P mutant Gba allele (GbaL444P/WT) exhibited mitochondrial dysfunction associated with impaired autophagy and mitochondrial priming, a process by which autophagy receptor proteins are recruited to damaged mitochondria for selective degradation. In genetically engineered SH-SY5Y neuroblastoma cells, the loss of GBA activity compromised lysosomal clearance of autophagosomes, whereas the presence of the L444P GBA mutation in the context of normal lysosomal GBA enzyme activity disrupted mitochondrial priming and autophagy induction. We confirmed these mitochondrial and autophagy deficits in brain tissues from PD patients with heterozygous GBA mutations. Together, our results suggest that PD-associated heterozygous GBA mutation is sufficient to drive mitochondrial dysfunction through specific alterations in autophagy-lysosomal function and mitochondrial tagging, and so provides a cellular basis for furthering the development of PD-associated mitochondrial phenotypes.
Results
L444P GBA heterozygous mutation causes mitochondrial dysfunction
To address whether heterozygous GBA mutations impair mitochondrial function, we used a GbaL444P/WT knockin mouse model carrying the heterozygous L444P mutation, a common pathogenic mutation for neuropathic GD and for PD with accelerated longitudinal cognitive decline [Citation15,Citation16]. The brains of these mutant mice possessed ~40% lower GBA protein levels ()) and ~40% lower lysosomal GBA enzyme activity ()) than their wild-type (WT) littermates. We also noted an accumulation of soluble SNCA/α-synuclein protein in the hippocampus of GbaL444P/WT mice (), although we did not find aggregated SNCA species (not shown).
Figure 1. Reduced GBA protein levels and enzyme activity in GbaL444P/WT hippocampus. (A,B,D) Western blot analysis of GBA protein (A, B) and SNCA(A,D) in WT (n = 3) and GbaL444P/WT (L444P/WT, n = 4) mouse hippocampus; (B) GBA enzyme activity measured in lysosome-enriched fractions of WT (n = 4) and GbaL444P/WT mutant (n = 4) mouse hippocampus. Data are presented as mean percentage (%) of WT controls ± standard error (SE) from 3–4 independent experiments. Compared to WT, **, p < 0.01, Student’s t-test.
We assessed mitochondrial function in primary hippocampal neurons by measuring MMP using MitoTracker Red (MitoRed). Total mitochondrial content was determined using MitoTracker Green (MitoGreen). Compared to WT controls, GbaL444P/WT neurons showed a lower baseline MMP but increased total mitochondrial content ()). The ratio of MitoRed to MitoGreen, which reports levels of polarized functional mitochondria, was significantly lower in GbaL444P/WT neurons than in controls, supporting impaired mitochondrial function (). We then assessed mitochondrial morphology by calculating the aspect ratio (length to width ratio) of individual mitochondria labeled by MitoGreen [Citation17], which was increased in GbaL444P/WT neurons, indicating an elongated mitochondrial phenotype in the mutants (). The form factor, which reflects mitochondrial complexity and branching, remained similar between WT controls and mutant neurons.
Figure 2. Mitochondrial dysfunction in GbaL444P/WT mouse hippocampal neurons (A) Representative micrographs of MitoTracker Red- and MitoTracker Green-labeled WT and GbaL444P/WT primary hippocampal neurons in primary cultures (14–15 DIV). DNA stained with Hoechst 33342 (1 μg/μl, blue) did not show nuclear condensation/fragmentation (left panel). The fluorescence intensities of MitoTracker Red and MitoTracker Green were quantified and the red:green ratio was calculated to estimate normalized MMP (right panel) (n ≥ 40 neuronal soma per condition from 4–5 cultures). Scale bar: 10 μm. (B) Mitochondrial morphology in control and GbaL444P/WT mutant neurons. The aspect ratio (left panel) is a measure of mitochondrial length, which is increased with the GBAL444P mutation. There were no differences in the form factor (right panel), which indicates the degree of mitochondrial branching. (C) Representative micrographs (left panel) and quantification (right panel) of MitoSOX Red-labeled WT and GbaL444P/WT mutant primary hippocampal neuronal cultures. Scale bar: 10 μm. For all measurements, >40 individual neurons were imaged per genotype from 4–5 culture dishes (8–10 neurons per dish). Blue, Hochest 33342 nuclei stain. Data are presented as mean % of WT controls ± SE. Compared to WT, * p < 0.05; **, p < 0.01, Student’s t-test.
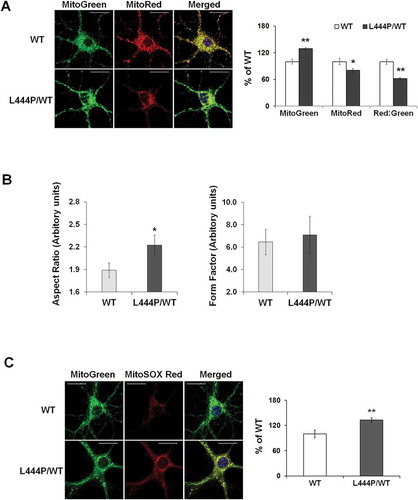
Mitochondrial dysfunction may lead to oxidative stress and generate reactive oxygen species (ROS). We therefore measured mitochondrial ROS levels in live GbaL444P/WT neurons using MitoSOX Red, a cell permeant mitochondrial superoxide indicator that, when oxidized, intercalates into mitochondrial DNA, resulting in red fluorescence. Compared to controls, GbaL444P/WT neurons displayed increased MitoSOX Red fluorescence, indicating higher levels of superoxide production ().
To confirm increased mitochondrial content in the hippocampus of GbaL444P/WT mice in vivo, we probed for the mitochondrial outer membrane proteins VDAC1/PORIN and TOMM20 (translocase of outer mitochondrial membrane 20), the inner membrane protein TIMM23 (translocase of inner mitochondrial membrane 23), and the intermembrane protein CYCS (cytochrome c, somatic) [Citation18,Citation19]. Whereas protein levels of VDAC1 and CYCS were significantly higher in the GbaL444P/WT hippocampus, the levels of TOMM20 and TIMM23, two mitochondrial import proteins that translocate nuclear-encoded precursor proteins to mitochondria, were significantly decreased (). The reduction in TOMM20 protein levels was confirmed by immunohistochemistry in the GbaL444P/WT mouse hippocampus in vivo, where total TOMM20 fluorescence intensity was decreased in CA1 pyramidal neurons (Figure S1(A)). The number of TOMM20-positive puncta was, however, slightly higher in GbaL444P/WT neurons, supporting an increase in mitochondrial content.
We did not find alterations in the protein levels of PPARGC1A/PGC-1α (peroxisome proliferative activated receptor, gamma, coactivator 1 alpha) as well as its downstream targets NRF1 (nuclear respiratory factor 1) and TFAM (transcription factor A, mitochondrial), all of which regulate mitochondrial biogenesis. We further noted that protein levels of MT-CO1 (mitochondrially encoded cytochrome c oxidase I), mitochondrial matrix proteins SOD2 (superoxide dismutase 2, mitochondrial) and PPID (pepidylprolyl isomerase D [cyclophilin D]) as well as mitochondrial DNA copy number (Figure S1(B,C)) remained unaltered in the GbaL444P/WT brain. Therefore, the increase in mitochondrial content may not result from upregulated mitochondrial biogenesis.
Mitochondria are dynamic organelles that require continuous fission and fusion to maintain integrity: fusion allows the exchange of contents, and fission effectively lowers the fraction of defective mitochondria [Citation20]. Thus, an appropriate equilibrium between fission and fusion is critical for normal mitochondrial function [Citation21]. We assessed mitochondrial dynamics by measuring the levels of mitochondrial fission protein DNM1L/DRP1 (dynamin 1-like) and fusion proteins OPA1 (OPA1, mitochondrial dynamin like GTPase), MFN1 (mitofusin 1), and MFN2 (mitofusin 2). Western blot analysis revealed significantly lower protein levels of DNM1L/DRP1 and MFN1 in the GbaL444P/WT hippocampal tissues compared to wild-type littermates, suggesting that the expression of mutant GBA perturbs mitochondrial dynamics (). Together with our finding of increased mitochondria length in GbaL444P/WT neurons (), these data supported a decrease in mitochondrial fission.
Figure 3. Mitochondrial content and mitochondrial dynamics in GbaL444P/WT mouse hippocampus. (A) Representative western blots of mitochondrial protein and proteins related to mitochondrial fission and fusion in WT (n = 3) and GbaL444P/WT (n = 4) mice. (B) Quantification of western blots normalized to GAPDH levels. Data represent mean % of WT ± SE of 3 experimental replicates. Compared to WT, *, p < 0.05, Student’s t-test.
Impaired mitophagy by the L444P GBA heterozygous mutation
We next asked whether the accumulation of compromised mitochondria in GbaL444P/WT neurons resulted from impaired mitophagy. To measure basal mitophagy, we crossed the GbaL444P/WT mice to a transgenic mouse model expressing mitochondrial-targeted Keima (mt-Keima), a coral-derived acid-stable fluorescent protein that exhibits a pH-dependent bimodal excitation spectrum [Citation22]. Protonated Keima in acidic lysosomes has stronger 561-nm excitation, whereas neutral Keima is predominantly excited by 458-nm wavelength light [Citation23,Citation24]. The slow turnover of lysosomal Keima allows for the qualitative measurement of mitophagic flux in live cell cultures [Citation22], and the ratio of 561:458 nm-excited Keima fluorescence intensity indicates the delivery of mitochondria to lysosomes. As in ), mt-Keima within lysosomes was mainly excited by the 561-nm (red) wavelength, but retained some modest capacity for 458-nm (green) excitation, which made the mt-Keima fluorescence yellow. Compared to WT controls, GbaL444P/WT neurons exhibited a significantly lower red excitation, suggesting impaired autophagic delivery of mitochondria to lysosomes. Lysosomal protease inhibition by leupeptin and pepstatin (Leu/Pep) elicited a subtle increase in lysosomal-retained Keima in WT controls, but had no effect in GbaL444P/WT neurons ().
Figure 4. Impaired mitophagy in GbaL444P/WT mouse hippocampal neurons. (A) Representative micrographs of basal mitophagy in WT:mt-Keima and GbaL444P/WT:mt-Keima primary hippocampal neurons (left panel). Neurons were treated with and without the lysosome protease inhibitors leupeptin and pepstatin A (Leu/Pep, 10 μM each) to determine the amount of mitochondrial degraded by lysosomes. The ratio of the 561:458 nm-excited mito-Keima fluorescence in neuronal cell bodies was calculated to reflect mitophagy activity (right panel) . Scale bar: 10 μm; (n = 40 neurons per genotype from 4–5 culture dishes; 14–15 DIV). (B) MitoGreen and LysoTracker Red colabelling in CCCP-treated WT and GbaL444P/WT primary hippocampal neuronal cultures (left panel, scale bar: 10 μm). Neurons were treated with CCCP (10 µM) for 1 h. The cells were recovered in fresh medium, loaded with MitoTracker Green (MitoGreen; 200 nM) for 30 min followed by LysoTracker Red (LysoRed, 200 nM) for 30 min at 37°C. The number of MitoGreen and LysoRed colabeled puncta (yellow) per cell body were counted as an index of mitophagy (right panel). The boxed areas (scale bar: 2 μm) are shown in higher magnification in the right 3 micrographs for clarity. Individual neurons (40 per condition) from 4–5 culture dishes (8–10 neurons per dish) were analyzed. (C) Mitochondrial levels of autophagy receptor proteins in brain tissue from WT (n = 12) and GbaL444P/WT (n = 12) mice. Brain mitochondria were fractionated and analyzed for mitophagy proteins PINK1 and PARK2, K63- and K48-ubiquitinated species, and the autophagy receptors SQSTM1, NBR1, BNIP3L and OPTN. Protein levels were normalized to VDAC1, as the abundance of VDAC1, when normalized to GAPDH, was consistent with the increase in mitochondrial content in the mutants. Data represent mean ± SE (A, B) or mean % of WT controls (C) from 3 independent experiments. Compared to WT, * p < 0.05; **, p < 0.01, Student’s-t test.
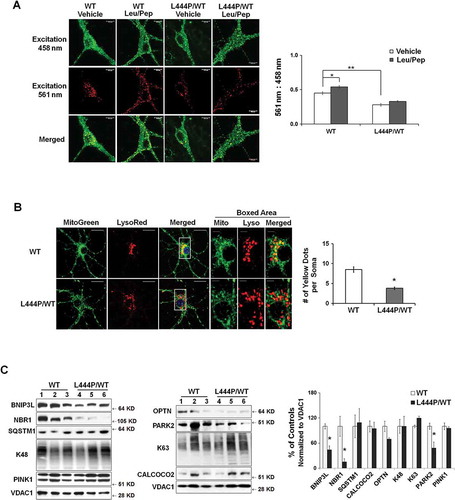
To assess evoked mitophagy, we treated WT and GbaL444P/WT neurons with the protonophore Carbonyl cyanide m-chlorophenyl hydrazone (CCCP, 10 μM), a potent mitochondrial uncoupler that induces mitochondrial depolarization and thus mitophagy [Citation25,Citation26], or with a milder mitochondrial complex III inhibitor, antimycin (40 μM), that was recently shown to induce mitophagy in hippocampal neurons [Citation27]. We found no difference in cell survival between vehicle-treated WT and GbaL444P/WT neurons. One-hour exposure to 10 μM CCCP or 40 μM antimycin had no effects on neuronal survival, but 12-h prolonged treatment induced significant neuronal death in both WT and mutant cultures, with the mutants more vulnerable to both mitochondrial toxins (Figure S2(A)). We thus chose to assess the induction of mitophagy following 1-h CCCP or antimycin exposure, by measuring the colocalization of MitoGreen-labeled mitochondria with LysoTracker Red-labeled lysosomes [Citation28,Citation29]. Compared to WT controls, GbaL444P/WT neurons showed less colocalization of mitochondria and lysosomes following CCCP () or antimycin treatment (Figure S2(B)). Collectively, these data suggested that evoked mitophagy was impaired in GbaL444P/WT mutants.
We further examined the initiation of mitophagy in vivo in WT and GbaL444P/WT CA1 neurons by immunostainning hippocampal brain sections for the mitochondrial protein TOMM20 and the autophagosome protein MAP1LC3B/LC3B. Compared to WT, GbaL444P/WT hippocampal neurons showed fewer puncta positive for both TOMM20 and LC3B (Figure S2(C)), suggesting that fewer mitochondria were recruited to phagophores under basal conditions in the mutants. To determine the steps that may interfere with autophagic delivery of mitochondria to lysosomes, we analyzed the recruitment of the autophagy machinery to damaged mitochondria, a process known as mitochondrial priming, which is thought to occur through either PRKN/PARK2-dependent or -independent mechanisms [Citation9,Citation30]. Mitochondria were fractionated from brains of WT and GbaL444P/WT mice by density centrifugation as outlined in Figure S3(A,B), and subjected to western blot analysis for autophagy receptor proteins, including ubiquitin-dependent receptors NBR1 (NBR1, autophagy cargo receptor), CALCOCO2/NDP52 (calcium binding and coiled-coil domain 2), OPTN (optineurin) and SQSTM1/p62 (sequestosome 1). These cargo-recognizing molecules bind preferentially to Lys63 ubiquitin linkages on the surface of damaged mitochondria to trigger mitochondrial priming [Citation30]. We also examined levels of BNIP3L (BCL2/adenovirus E1B interacting protein 3-like), a mitochondrial outer membrane protein that regulates mitophagy in a PRKN/PARK2- and ubiquitin-independent manner. Compared to control mice, Gba mutants exhibited decreased levels of mitochondrial PARK2, NBR1 and BNIP3L (), suggesting that the processes that target compromised mitochondria for autophagic degradation were disrupted in GbaL444P/WT mice.
Impaired basal autophagy and lysosomal degradation by the L444P GBA heterozygous mutation
Removal of damaged mitochondria through autophagy also requires the induction of general autophagy. Thus, we assessed basal autophagy by western blot analysis of LC3B-II, which represents the abundance of autophagosomes [Citation31], and the autophagy substrate SQSTM1 in hippocampal tissue from WT and GbaL444P/WT mice. Levels of LC3B-II and SQSTM1 proteins were both increased in GbaL444P/WT brain ()). This increase was confirmed by immunohistochemistry in GbaL444P/WT hippocampus ().
Figure 5. Impaired autophagy-lysosome function in GbaL444P/WT neurons. (A) Western blot analysis of autophagy in WT (n = 3) and GbaL444P/WT (n = 4) mouse hippocampal tissue. (B) Quantification of protein bands normalized to GAPDH showed higher levels of the autophagy proteins LC3B-II and SQSTM1, and lower levels of autophagy regulators p-MTOR, AMBRA1 and BECN1 in GbaL444P/WT compared to WT. Data represent mean ± SE from 3 independent experiments. Compared to WT, * p < 0.05; **, p < 0.01, Student’s-t test. (C) Representative micrographs for LC3B and SQSTM1 immunohistochemistry in the CA1 region of WT (n = 3) and GbaL444P/WT (n = 3) mouse hippocampal sections. Scale bar: 20 μm. (D) Representative hippocampal neurons cultured from CAG-RFP-GFP-LC3B reporter mice crossed with WT or GbaL444P mutant mice (top panels). Quantification of GFP-positive (green) and RFP-positive (red) LC3B puncta in cell bodies of primary hippocampal neurons (DIV 14–15) was used to estimate the amount of reporter LC3B protein degraded by autophagy. Neurons were treated with (PI+) and without the lysosome protease inhibitors leupeptin and pepstatin A (10 μM each) to determine the amount of reporter LC3B degraded by lysosomes. Induced autophagy was assessed by treating neurons with rapamycin (200 µM) + leupeptin and pepstatin A. Green puncta denote GFP-positive autophagosomes prior to fusion with lysosomes, and RFP-positive red puncta denote the total pool of autophagic vacuoles. The ‘Red-Green’ denotes autolysosomes, which was calculated by subtracting the number of GFP-positive from RFP-positive puncta. Data are mean ± SEM of ~40 neurons from 4–5 dishes of living neuronal cultures per condition. Compared to WT, *, p < 0.05; **, p < 0.01, One-way ANOVA, Bonferroni post hoc test. Scale bar: 10 μm.
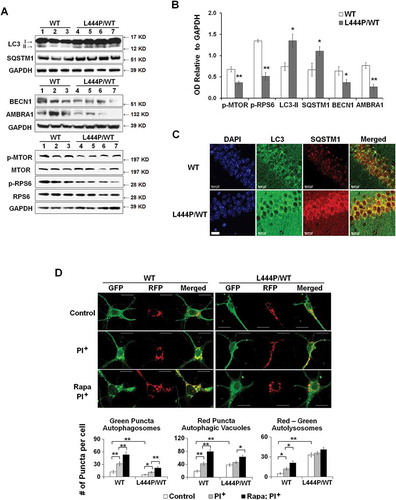
The increase in LC3B-II levels may indicate an enhanced autophagy induction or a blockade in downstream lysosomal degradation. Autophagy can be initiated through MTOR (mechanistic target of rapamycin kinase)-dependent and -independent pathways [Citation32]. MTOR negatively regulates the induction of autophagy, and MTOR activity, reported by levels of phosphorylated MTOR (p-MTOR) and phosphorylated RPS6 (ribosomal protein S6) protein (p-RPS6), is negatively correlated with autophagy induction. BECN1 (beclin 1, autophagy related) and AMBRA1 (autophagy/beclin 1 regulator 1) are key proteins essential for the initiation of autophagosome formation downstream of MTOR, and in some cases, in response to signaling cues bypassing MTOR [Citation33]. Whereas we found lower p-MTOR and p-RPS6 levels in GbaL444P/WT brain than in controls, levels of BECN1 and AMBRA1 were also decreased in GbaL444P/WT brain (), suggesting that the mutant GBA may suppress the induction of basal autophagy despite the decrease in MTOR activity.
To examine how autophagic flux was altered in GbaL444P/WT hippocampal neurons, we crossed GbaL444P/WT mice to a tandem CAG-red fluorescent protein (RFP)-green fluorescent protein (GFP)-LC3B transgenic autophagy reporter mouse line [Citation34]. In this assay, RFP red fluorescence is stable whereas GFP green fluorescence is rapidly quenched in acidic compartments. As such, neutral autophagosomes are labeled with both RFP (red) and GFP (green) fluorescence. When fused with lysosomes, autophagosomes mature into autolysosomes which exhibit RFP (red) fluorescence only [Citation35].
We quantified autophagosomes by counting GFP fluorescent green puncta. The total number of autophagic vacuoles, including autophagosomes and autolysosomes, was determined by counting all RFP fluorescent red puncta. The amount of autolysosomes, which represents the number of autophagosomes that were delivered to and degraded by lysosomes [Citation36], was derived by subtracting the number of green puncta from the number of red puncta (red minus green). Consistent with our previous finding of increased LC3B-II protein levels in the mutants (), GbaL444P/WT neurons exhibited higher levels of total autophagic vacuoles than WT controls (), which is likely due to higher levels of autolysosomes. We further treated these cultures with the lysosomal protease inhibitors leupeptin and pepstatin, which block lysosomal LC3 degradation without elevating lysosome pH, resulting in an increase in autophagic vacuoles. Following leupeptin-pepstatin treatment, we observed a dramatic increase in autolysosomes in WT but not in GbaL444P/WT neurons. These data suggested a rapid degradation of autophagosomes in WT neurons but a blockade of lysosomal degradation in the mutants.
The capacity for autophagy induction was assessed by treating cells with the autophagy inducer rapamycin in the presence of leupeptin and pepstatin. Rapamycin induced a significant increase in the number of total autophagic vacuoles in WT neurons. This increase was however significantly attenuated in GBA mutant neurons (60% induction in WT vs. 25% induction in GbaL444P/WT), suggesting that autophagy induction was impaired by the L444P/WT heterozygous GBA mutant. Together, our findings support the idea that autophagy is impaired in GbaL444P/WT neurons at both an initial autophagy induction step and a later step of lysosomal degradation.
A dual mechanism for mitophagy defect by the L444P GBA heterozygous mutation
Our data above showed that mitophagy was disrupted in the GbaL444P/WT mouse brain due to both reduced efficacy of autophagy-lysosomal degradation and impaired mitochondrial priming. We repeated all of these measurements in human fibroblasts carrying heterozygous GBA mutations (Figure S4(A-D)) and in GbaL444P/WT mouse heart tissue (Figure S4(E,F)), and found similar mitochondrial and autophagy phenotypes. As SNCA protein is not typically expressed in fibroblasts and heart tissue, our findings suggest that GBA heterozygous mutation caused defects in mitophagy independently of SNCA accumulation.
To address whether heterozygous GBA mutations contribute to mitochondrial dysfunction through a loss-of-function mechanism, we generated a GBA gene knockout (KO) SH-SY5Y cell line, in which GBA gene deletion resulted in a complete loss of both GBA protein and enzyme activity (). Given that hemizygous GBAWT/- cells do not show mitochondrial defects [Citation10], we propose that mitochondrial phenotypes in GBA heterozygous mutants may require alternative mechanisms that involve the presence of mutant GBA protein. To distinguish the effect of mutant protein from the loss of GBA enzyme activity, we generated SH-SY5Y cells stably overexpressing MYC-tagged WT or L444P GBA on the background of both copies of endogenous WT GBA alleles.
The expression of endogenous GBA and exogenous MYC-tagged GBA was confirmed by western blot analysis using antibodies against GBA and MYC-tag (). Whereas WT GBA overexpression markedly increased both GBA protein levels and lysosomal GBA enzyme activity, the overexpression of mutant GBAL444P did not interfere with the normal lysosomal enzyme activity of endogenous WT GBA, although the total GBA protein levels significantly increased (). It was reported that the MYC-tagged WT or mutant GBA possessed similar properties as those of endogenous WT and mutant proteins from GD or PD human fibroblasts [Citation37]. We confirmed these early findings by examining GBA protein levels in fractionated ER and lysososmes (Figure S3(C,D)), and found that MYC-tagged WT GBA was mainly transported to lysosomes, whereas MYC-tagged GBAL444P was largely retained in the ER (Figure S3(E)).
Figure 6. Dual effects of heterozygous GBA mutation on mitophagy. (A) GBA protein levels of GBA knockout (KO), MYC-WT GBA (WT) and MYC-L444P (LP) mutant GBA-overexpressing SH-SY5Y cell lines (left panel). The overexpression of MYC-WT and MYC-GBAL444P, and the deletion of endogenous GBA were validated by western blotting using anti-MYC and anti-GBA antibodies (middle panel), and by measuring GBA enzyme activity from lysosomal-enriched fractions (right panel). Compared to Mock controls (C), **, p < 0.01, One-way ANOVA, Bonferroni post hoc test; (B) MitoTracker Red, MitoTracker Green, and MitoSOX Red labeling in control, KO, WT and L444P SH-SY5Y cells. All 4 cell lines were loaded with MitoTracker Red (MitoRed, 200 µM, 20 min) and MitoTracker Green (MitoGreen, 200 µM, 20 min), or MitoSOX Red (3 μM, 10 min) prior to live cell imaging. Scale bar: 10 μm; (C-D) Quantification of MitoTracker fluorescence intensity in KO- (C) and L444P- (D) SH-SY5Y cells. MitoGreen and MitoRed fluorescence estimates the amount of total mitochondria and functional mitochondria, respectively. The ratio of MitoRed to MitoGreen fluorescence intensity was calculated to estimate the levels of functional mitochondria (n = 60–80 cells per condition from 3 independent experiments). (E) Quantification of MitoSOX Red fluorescence intensity in control, KO, WT and L444P SH-SY5Y cells (n = 60–80 cells per condition from 3 independent experiments). Both L444P and KO cells exhibited an increase in MitoSOX Red intensity, indicative of mitochondrial oxidative stress. (F) Western blot analysis of mitochondrial fraction for autophagy receptors in control, KO, WT and L444P cells. Compared to controls, L444P cells showed lower mitochondrial levels of SQSTM1, NBR1, and BNIP3L. (G) Impaired autophagy in KO and L444P cells. Control, KO, WT and L444P cells were treated with (PI+) and without (PI−) lysosome inhibitors leupeptin and pepstatin A (10 μM each). Flux of autophagy including lysosomal degradation was denoted as ‘PI+-PI−’. (H) Western blot analysis of autophagy-activating proteins AMBRA1 and BECN1 in all 4 cell lines. Data represent mean % of mock controls from 3 independent experiments. Compared to controls, L444P cells showed a reduction in protein levels of BECN1 and AMBRA1. *, p < 0.05; **, p < 0.01, One-way ANOVA, Bonferroni post hoc test.
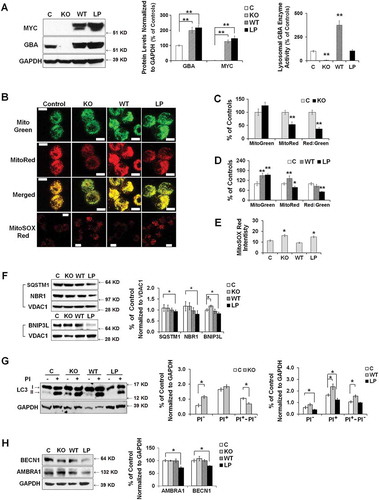
We assessed MMP in these cell lines using MitoRed and mitochondrial content using MitoGreen (). The loss of GBA in the KO cells did not affect mitochondrial content but impaired MMP (). The overexpression of WT GBA resulted in an increase in both MMP and mitochondrial content, whereas GBAL444P overexpression led to a reduction in MMP but an increase in mitochondrial mass (). Both L444P-expressing and KO cells exhibited a reduction in the MitoRed:MitoGreen ratio, reflecting an increase in compromised mitochondria. Consistently, we observed increased MitoSox Red signals in both L444P-expressing and KO cells, indicating increased mitochondrial ROS generation (). Together, these data suggest that either the loss of GBA activity or the presence of the mutant GBAL444P protein can cause the accumulation of compromised mitochondria, decrease in MMP, and mitochondrial oxidative stress. Further, we observed a decrease in protein levels of autophagy receptors SQSTM1, BNIP3L and NBR1 in mitochondria fractionated from L444P-expressing but not KO cells (), suggesting that the mutant GBAL444P protein, but not the loss of GBA enzyme activity, inhibited mitochondrial priming.
We next examined basal autophagy in all four cell lines. Compared to controls, KO cells showed higher LC3B-II levels, while L444P-expressing cells exhibited lower LC3B-II levels (). To assess the flux of autophagy including lysosome degradation, LC3B-II levels were compared between cells treated with (PI+) or without (PI−) lysosome inhibitors leupeptin and pepstatin. Upon treatment, all 4 cell lines showed an increase in LC3B-II levels, but L444P-expressing cells exhibited much lower LC3B-II levels than mock control and WT cells, suggesting that the presence of the GBAL444P protein can suppress autophagosome formation when the lysosomal GBA activity is preserved. We further noted a reduction in AMBRA1 and BECN1 protein levels in the L444P-expressing but not the KO cells (), which confirmed that the mutant GBAL444P protein, but not the loss of GBA enzyme activity, inhibits autophagy induction. The flux of autophagy, denoted as ‘PI+-PI−’, remained intact in the L444P-expressing cells, supporting intact lysosome degradation. The autophagy flux was, however, increased in the WT line but decreased in the KO cells (). Thus, overexpressing WT GBA enhances autophagy flux, whereas the loss of GBA enzyme activity impedes lysosomal clearance of autophagic vacuoles.
Mitochondrial dysfunction in the anterior cingular cortex of GBA-PD patients
Mitochondrial pathology in the anterior cingular cortex of GBA- and non-GBA-PD patients was determined by measuring the levels of mitochondrial proteins that are critical for mitochondrial electron transport, dynamics, and oxidative stress. Both GBA-PD and non-GBA-PD brains exhibited an accumulation of oligomeric SNCA (Figure S5(A)). GBA protein levels were decreased by ~30% in non-GBA-PD and ~60% in GBA-PD, suggesting an additive effect of PD status and heterozygous GBA mutations on reducing GBA protein levels. GBA enzyme activity was significantly lower in GBA-PD, but was not different between controls and non-GBA-PD patients ().
We analyzed protein levels of mitochondrial electron transport chain complexes using an antibody cocktail for subunits essential for the assembly of mitochondrial respiratory chain complexes I-V (Figure S5(B)). No significant differences were detected between non-GBA-PD, GBA-PD and controls. Both GBA-PD and non-GBA-PD patients, however, demonstrated lower complex I enzyme activity than controls (). Compared to controls, pyramidal neurons of GBA-PD patients exhibited an increase in the levels of 8-hydroxy-2′-deoxyguanosine (8-OHdG, ), a widely used biomarker of oxidative DNA damage [Citation18], suggesting the presence of mitochondrial oxidative stress in GBA-PD.
Figure 7. Mitochondrial dysfunction in anterior cingular cortex of control, non-GBA-PD and GBA-PD patients. (A) Western blot (top panel) and quantification of GBA protein levels (bottom left panel) and enzyme activity (bottom right panel). (B) Mitochondrial complex I enzyme activity, measured by dispstick assay. BL, blank. (C) Immunohistochemistry of 8-OHdG. Cortical pyramidal neurons were identified by a characteristic triangular morphology with a prominent apical dendrite pointing toward the pial surface (left panel). Scale bar: 20 μm. Quantification of fluorescence intensity of cytoplasmic 8-OHdG per pyramidal neuron showed an increase in 8-OHdG levels in GBA-PD, indicative of oxidative DNA damage (right panel). (D) Western blot analysis of mitochondrial content. (E) Immunohistochemistry for VDAC1. Upper left, fluorescence micrograph; Upper right, quantification of fluorescence intensity; Lower left, VDAC1+ particles measured by Image J; Lower right, number of puncta quantified using ImageJ. Scale bar, 10 μm. (F) Immunohistochemistry of TOMM20. Upper left, fluorescence micrograph; Upper right, quantification of fluorescence intensity; Lower left, TOMM20+ particles measured by Image J; Lower right, number of puncta quantified using ImageJ. Scale bar, 10 μm. (G) Levels of mitochondrial fusion (OPA1, MFN1, MFN2) and fission (DNM1L, FIS1) proteins. Data represent mean (% of controls) ± SE from 3 independent experiments. Compared to controls, * p < 0.05, **, p < 0.01, One-way ANOVA followed by Bonferroni post hoc test (A, B, D, G) or Student’s t-test (C,E,F).
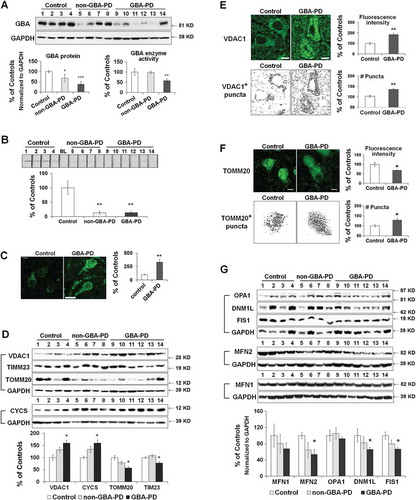
Mitochondrial content was assessed by western blot analysis of the mitochondrial membrane proteins VDAC1, TOMM20, TIMM23, and CYCS, as described above. Consistent with what we observed in GbaL444P/WT mice, protein levels of VDAC1 and CYCS were increased, whereas the levels of TOMM20 and TIMM23 were decreased in GBA-PD brain tissue (). There was a similar but nonsignificant trend (p > 0.05) in non-GBA-PD cases, suggesting that the presence of the GBA mutation may exacerbate these aspects of mitochondrial pathology. Immunohistochemistry of VDAC1 in fixed brain sections confirmed the accumulation of VDAC1-labeled mitochondria in pyramidal neurons from GBA-PD brain (). Whereas the total fluorescence intensity of TOMM20 was lower in GBA-PD, the number of TOMM20-positive mitochondrial content was, in contrast, higher in GBA-PD neurons (). These data together confirmed an increase in mitochondrial content in GBA-PD brain, despite a decrease in mitochondrial protein import complexes.
We also noted that levels of DNM1L, FIS1 (fission, mitochondrial 1) and MFN2 proteins were lower in GBA-PD brain than in controls, suggesting altered mitochondrial dynamics in GBA-PD brain (). Again, we found a similar but nonsignificant trend (p > 0.05) in non-GBA-PD cases.
Impaired autophagy in the anterior cingular cortex of GBA-PD patients
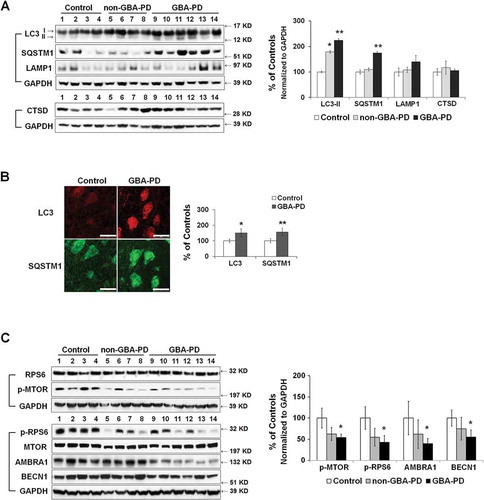
We next asked whether mitochondrial pathology in GBA-PD anterior cingular cortex is associated with abnormalities in autophagy-lysosomal degradation. The level of LC3B-II was significantly higher in GBA-PD and non-GBA-PD patients than in controls (). We, however, detected a significant accumulation of the autophagy substrate SQSTM1 in GBA-PD, but not in non-GBA-PD, brain (), suggesting that the degradation through the autophagy-lysosomal pathway was compromised most significantly in GBA-PD. Abnormalities in autophagy in GBA-PD were confirmed by immunohistochemistry of LC3B and SQSTM1 in fixed cingular cortical brain sections, as the fluorescence intensity of both LC3B and SQSTM1 was higher in pyramidal neurons in GBA-PD patients than in controls (). No differences were detected in levels of the lysosomal proteins LAMP1 and CTSD (cathepsin D) (), suggesting that the total lysosomal content remained similar between control and GBA-PD brain. We then examined whether the increase in LC3B-II levels in GBA-PD was due to enhanced autophagy induction. Whereas MTOR activity, indicated by levels of p-MTOR and p-RPS6, was downregulated in GBA-PD, GBA-PD patients possessed lower levels of AMBRA1 and BECN1 proteins than the controls ().
Figure 8. Abnormal autophagy in anterior cingular cortex of GBA-PD patients. (A) Western blot analysis of autophagy and lysosomal proteins in non-GBA-PD and GBA-PD brains (left). Compared to controls, LC3B-II levels were increased in both GBA-PD and non-GBA-PD brains, whereas SQSTM1 protein only accumulated in GBA-PD brain (right). (B) Immunohistochemistry of LC3B and SQSTM1 in control and GBA-PD brains (left). Compared to controls, pyramidal neurons from GBA-PD brains showed increased LC3B and SQSTM1 immunoreactivity (right). Scale bar: 20 μm. (C) Western blot analysis of autophagy regulators MTOR, BECN1 and AMBRA1 in non-GBA-PD and GBA-PD brains (left). GBA-PD brains showed lower protein levels of p-MTOR, p-RPS6, AMBRA1 and BECN1 (right). Data are mean (% of controls) ± SE from 3 independent experiments. Compared to controls, *, p < 0.05; **, p < 0.01, One-way ANOVA followed by Bonferroni post hoc test (A and C) or student’s t test (B).
Discussion
Recent studies reported both mitochondrial dysfunction and autophagy defects in gba gene knockout GD mouse models and cell cultures [Citation10,Citation11,Citation38,Citation39], suggesting a loss-of-function mechanism of GBA mutations in mitochondrial dysfunction that is associated with GD. It remains unclear, however, whether and how PD-associated heterozygous GBA mutations contribute to mitochondrial dysfunction. In this study, we provide evidence that heterozygous L444P Gba/GBA mutation impairs mitochondrial function by inhibiting mitophagy, a process essential for the removal of compromised mitochondria [Citation30,Citation40,Citation41], We confirmed a reduction in both general autophagy and mitochondrial priming in vivo in GbaL444P/WT mouse brain tissue and in vitro in cultured hippocampal neurons. The GBAL444P mutant protein appears to affect mitophagy through a dual mechanism: the loss of GBA activity impedes lysosomal clearance of autophagosomes, whereas the mutant GBA protein inhibits autophagy induction and mitochondrial priming. Importantly, these findings were mirrored in postmortem anterior cingulate cortical tissue from PD patients with heterozygous GBA mutations, suggesting that carriers of heterozygous GBA mutations have mitophagy deficits that may contribute to PD-associated mitochondrial deficits.
Impaired mitochondrial fission by the L444P GBA heterozygous mutation
A number of PD-related proteins, including SNCA, PINK1, PRKN, PARK7, and LRRK2, have been reported to regulate mitochondrial fission and fusion [Citation42–Citation46], suggesting that altered mitochondrial dynamics contributes to neurodegeneration. We found substantial changes in levels of mitochondrial fission and fusion proteins, with a consistent decrease of DNM1L in brain tissues from GBA-PD patients and GbaL444P/WT mice. As most mitochondrial fission pathways converge on DNM1L [Citation42,Citation47], the reduction in DNM1L levels indicates disrupted mitochondria dynamics in GBA-PD, a defect consistent with the elongated mitochondrial phenotype we observed in GbaL444P/WT neurons () and fibroblasts (Figure S3(D)). It has been proposed that coupled fission and fusion, followed by autophagy, plays an important role in removing dysfunctional mitochondrial components [Citation48], and an inhibition of mitochondrial fission may impair mitochondrial degradation by autophagy.
Impaired general autophagy by the L444P GBA heterozygous mutation
We report a reduction in protein levels of autophagy inducers AMBRA1 and BECN1 in brain tissues from GBA-PD patients and GbaL444P/WT mice, which suggests impaired autophagosome biogenesis. We confirmed the reduction in autophagy flux and autophagy induction in GbaL444P/WT mutant mouse neuronal cultures. The steady-state LC3B-II levels were, however, higher in vivo in brain tissues of GBA-PD patients and GbaL444P/WT mice, which may represent impeded lysosomal degradation of autophagosomes. Unexpectedly we found that p-MTOR and p-RPS6 protein levels were decreased in GbaL444P/WT mouse brains. While contrary to our observation of suppressed autophagy induction, these data are consistent with recent studies in GD and GBA-PD patient-derived fibroblasts [Citation49] and Gba1-deficient Drosophila models [Citation50] in which the hypoactive MTOR was proposed to be responsible for impaired recycling of functional lysosomes from autolysosomes.
We found that, in GBA KO SH-SY5Y cells, GBA gene deletion impaired lysosomal degradation of autophagosomes but had little effect on the induction of autophagy. The lack of impaired autophagy induction in these KO cells suggests a gain-of-function mechanism of GBA mutation for altered autophagy. Consistently, we recapitulated the reduced autophagy induction, which is likely to result from reduced AMBRA1 and BECN1 expression, in SH-SY5Y cells overexpressing the mutant GBAL444P, in which endogenous lysosomal WT GBA enzymatic activity was preserved. Note that this SH-SY5Y-overexpressing cell model system may be artificial, and the defects in autophagy induction may result from dramatic overexpression of misfolded protein. By comparing autophagy defects between MYC-tagged WT and L444P mutant GBA-overexpressing SH-SY5Y cells, we found that this inhibitory effect on autophagy induction may be specific to the L444P mutation, given that the expression levels of exogenous MYC-tagged GBA protein levels were similar between the WT and mutant GBA-overexpressing SH-SY5Y cells, and that the properties of MYC-tagged WT and mutant GBA were similar to those of endogenous WT and mutant GBA.
The mechanisms for the reduction in AMBRA1 and BECN1 by mutant GBA remain to be elucidated, but may involve the ER retention of mutant GBA, abnormal interactions between mutant GBA and ER proteins, decreased MTOR activity and altered TFEB (transcription factor EB) protein levels. Indeed, GBA mutations in GD iPSC-derived neuronal cells has been reported to downregulate the expression of TFEB and lysosomal genes [Citation51]. Nevertheless, our data indicate that the mutant GBA protein may act at an early stage to block autophagy induction, whereas the loss of GBA enzyme activity suppresses lysosomal degradation at a later step of autophagosome clearance.
Impaired mitochondrial priming by the L444P GBA heterozygous mutation
The most thoroughly characterized pathway for mitochondrial priming is that of PINK1- PRKN/PARK2 signaling [Citation40,Citation52]. Upon mitochondrial depolarization, PINK1 accumulates on the outer mitochondrial membrane (OMM) to recruit the cytosolic E3 ubiquitin ligase PRKN/PARK2. PRKN/PARK2-mediated ubiquitination of OMM proteins serves as a general signal recognized by autophagy adaptor proteins [Citation53,Citation54], such as SQSTM1, NBR1, CALCOCO2/NDP52 and OPTN/optineurin [Citation55–Citation60]. Through interacting with both LC3 and ubiquitin chains, these receptors target dysfunctional mitochondria to phagophores for degradation. Increasing evidence also supports PRKN/PARK2-independent priming, which involves mitochondria-anchored receptors including OMM proteins BNIP3L and FUNDC1 (FUN14 domain containing 1) [Citation61–Citation64]. AMBRA1 may also act as a mitophagy receptor by binding to LC3 in PRKN/PARK2-dependent and -independent manners [Citation65,Citation66].
We found that protein levels of PARK2, NBR1, and BNIP3L were reduced in mitochondria fractionated from GbaL444P/WT mouse brain. These findings suggest that the GbaL444P/WT mutation impedes both PRKN/PARK2-dependent and -independent mitochondrial priming under basal conditions. Our data corroborate the Osellame et al. study [Citation10] where it was proposed that that MMP in gba knockout neurons was not low enough for PARK2 recruitment because mitophagy could be enhanced by fully dissipating MMP [Citation10]. We thus concluded that mitochondria in GbaL444P/WT heterozygous mutant mice are compromised, and not flagged properly for turnover by the mitophagy pathway. The impaired mitochondrial priming in the GbaL444P/WT mutants, however, appears to be associated with the mutant GBA protein per se but not the loss of GBA enzyme activity.
L444P GBA heterozygous mutation impairs mitophagy through a dual mechanism
Our findings support a dual mechanism by which the heterozygous L444P GBA mutation impairs mitophagy. The loss of lysosomal GBA enzyme activity blocks the degradation of autophagic cargos, whereas the mutant GBA protein per se impairs autophagy induction and the priming of damaged mitochondria. The defects in both autophagy-lysosomal degradation and mitochondrial priming may compromise the autophagic removal of damaged mitochondria, leading to an accumulation of dysfunctional mitochondria and thus mitochondrial oxidative stress. While our data support recent studies in which homozygous GBA mutations alter lysosomal and mitochondrial function via a loss-of-function mechanisms [Citation10,Citation11,Citation38,Citation39], the specific effects of mutant GBA on mitochondrial priming and autophagy induction indicate a gain-of-toxic-function of the mutant protein. This effect may be attributed to the ER retention of mutant GBA protein, resulting in an unfolded protein response [Citation67,Citation68]. For example, N370S and L444P GBA mutant proteins, but not WT GBA, interact with PRKN/PARK2 within the ER [Citation69], preventing the binding of PRKN/PARK2 to other substrates [Citation70].
The co-existence of gain-of-toxic-function and loss-of-function mechanisms of heterozygous GBA mutations has also been implicated in SNCA pathology, a feature of the vast majority of PD cases. The loss of GBA activity promotes SNCA accumulation by inhibiting lysosomal function, whereas direct interactions between mutant GBA and SNCA promote SNCA aggregation [Citation71]. Additionally, impaired mitochondrial homeostasis may interact with SNCA deposition to form a ‘vicious cycle’, in which SNCA accumulation increases mitochondrial permeability [Citation72,Citation73] and mitochondrial ROS generation, which further promotes SNCA misfolding, aggregation, and accumulation [Citation73]. We propose that, as a predisposing factor, heterozygous GBA mutations may contribute to the risk of PD by conferring a distinct subclinical pathological state with mitochondrial dysfunction and autophagy defects, which lowers the threshold and increases the risk for SNCA accumulation, ultimately culminating in the development of PD. Our studies strongly indicate that both the mutation and the enzyme activity should be considered when developing GBA-targeted PD therapy. One such promising strategy is the use of small-molecule chaperones that correct the folding of mutant GBA in the ER and facilitate its trafficking to lysosomes [Citation74], where the residual activity of the mutant GBA allows for the degradation of its lipid substrate, glucocerebroside.
Materials and methods
Human brain tissue, cell lines and animals
Postmortem human brain samples were obtained from the New York Brain Bank (Tables S1 and S2). All cases and controls were matched for age, post-mortem interval and gender. Human fibroblasts were from the Coriell Institute (Control: GM09918, GM03524; GBA-PD and GBA-carrier: ND30364, ND31360; GM00878) and human neuroblastoma SH-SY5Y cells were from ATCC (CRL-2266). The GbaL444P/WT mutant (000117-UNC, B6;129S4) mice were purchased from the Mutant Mouse Regional Resource Centers (MMRRC). The mt-Keima mice were from Dr. Toren Finkel (National Heart, Lung, and Blood Institute (NHLBI)), and the CAG-RFP-GFP-LC3B mice were a gift of Drs. Joseph A. Hill (UT Southwestern Medical Center) and Fangming Lin (Columbia University). All mouse experimental procedures were reviewed and approved by Columbia University Medical Center Institutional Animal Care and Use Committee.
Reagents
LysoTracker Red DND-99 (L7528), MitoTracker Green (M7514), Mitotracker Red (M7512) and MitoSox Red (M36008) were obtained from ThermoFisher Scientific. All were dissolved in DMSO (Sigma, D2650) at 1–5 mM, and stored at -20°C. 4-methylumbelliferyl-β-d-glucopyranoside (M3633), CCCP (C2759), antimycin A (A8674), leupeptin (L2884) and pepstatin (P5318) were obtained from Sigma-Aldrich and were dissolved in distilled water prior to use. All other reagents were analytical grade and obtained from Sigma (Trizma base, T6066; EGTA, 03777; mannitol, M9467; glucose, G6152; potassium gluconate, P1847; potassium chloride, P9333; sodium chloride, S9888; sucrose, S7903; Percoll, GE17-0891–01; paraformaldehyde, 158127).
Primary Antibodies used for western blot and immunohistochemistry include: human total OXPHOS respiratory chain proteins complexes (Abcam, ab110411), MT-CO1/mitochondrial DNA encoded cytochrome c oxidase I (Abcam, ab14705), MFN1 (Santa Cruz Biotechnology, sc50330), MFN2 (Abcam, ab56889), OPA1 (BD Bioscience, BP612606), FIS1 (Proteintech, 10586–1-AP), DNM1L/DRP1 (Santa Cruz Biotechnology, sc32898), VDAC1 (Abcam, ab15895), TOMM20 (Proteintech, 11802–1-AP), TIMM23 (Proteintech, 11123-AP), CYCS/cytochrome C (Abcam, ab13575), PPIF/cyclophilin F (Abcam, ab110324), SOD2 (Abcam, ab13533), PPARGC1A/PGC1-α (Abcam, ab54481), NRF1 (Abcam, ab175932), TFAM (Abcam, ab119684), ACTB/β-actin (Sigma, A5441), GBA (Abnova, H00002629-M01), GBA (Sigma, G4171), SNCA (Sigma, S3062), BECN1/Beclin1 (Sigma, B6186), AMBRA1 (Novus, 26190002), MTOR (Cell Signaling Technology, 2972S), p-MTOR (Cell Signaling Technology, 2971S), RPS6 (Cell Signaling Technology, 2317S), p-RPS6 (Cell Signaling Technology, 2211S), PRKN/PARK2/parkin (Cell Signaling Technology, 2132S), PINK1 (Cell Signaling Technology, 6946S), NBR1 (Proteintech, 16004–1-AP), BNIP3L (Proteintech, 12986–1-AP), OPTN/Optineurin (Proteintech, 10837–1-AP), CALCOCO2/NDP52 (Cell Signaling Technology, 9036S), ubiquitin (Millipore, mab1510), K48 ubiquitin (Millipore, 051307), K63 ubiquitin (Millipore, 051308), GAPDH (Novus, NB300112), LC3B (Novus, NB600-1384), SQSTM1/p62 (MBL, PM045 and ARP, 03-GP62-C), CTSD/cathepsin D (Abcam, ab75852), LAMP1 (Abcam, ab24170), 8-OHdG (Abcam, ab62623), EEA1 (Cell Signaling Technology, #2411), MYC (Abcam, ab9132), and CANX/calnexin (Sigma, MAB3126). Secondary antibodies were from Jackson Immunoresearch (anti-rabbit: 711005152; anti-mouse: 751005151; anti guinea pig: 706005148) for western blot and from ThermoFisher Scientific for immunohistochemistry (Thermofisher Scientific, A21202, A21203, A21206, A21207, A21209).
Generation of WT and L444P mutant GBA overexpressing stable SH-SY5Y cell lines
Human neuroblastoma SH-SY5Y cells were maintained in DMEM plus 10% FBS. To generate GBA mutant plasmids, site-directed mutagenesis was carried out using the QuikChange change site-directed mutagenesis kit (Stratagene, 200514) with the following primers: L444P Forward 5ʹ-GTC AGA AGA ACG ACC CAG ACG CAG TGG CAC-3ʹ, L444P Reverse 5ʹ-GTG CCA CTG CGT CTG GGT CGT TCT TCT GAC-3ʹ. The mutation sites were confirmed by DNA sequencing analysis. To establish stable SH-SY5Y cell lines overexpressing wild type (WT) and L444P mutant GBA genes, we transfected mock SH-SY5Y cells with pcDNA3.1 (ThermoFisher Scientific, V79020) plasmids expressing MYC-tagged WT or L444P mutant human GBA genes, using the Lipofectamine Plus reagent methods (Thermofisher Scientific, 15338100) according to the manufacturer’s instructions. Selection was started 2 d later using a medium containing 700 μg/ml of geneticin (Thermofisher Scientific, 10131027).
Generation of GBA knockout SH-SY5Y cell line
The gRNA that targets exon 4 of human GBA genomic sequence was subcloned into the lentiCRISPR lentiviral plasmid (Addgene, 49535; deposited by Dr. Feng Zhang) following the manufacturer’s instruction. The single guide RNA sequence consists of 5ʹ-TACACGCAGTGGGCGACGGA-3ʹ. For the preparation of lentivirus, human GBA gRNA subcloned lentiCRISPR plasmids were cotransfected with lentiviral packaging plasmids into the HEK293FT cells (ThermoFisher Scientific, R70007). The lentivirus was harvested at 48 h post-transfection and concentrated by ultracentrifugation at 25,000 g for 3 h. Viral particles were quantified using the Lenti-X™ qRT-PCR titration kit (Clontech, 631235). The viral particles were then added to SH-SY5Y cells (10 multiplicity of infection) that were plated at a density of 1 × 10⁵ cells/well in a 6-well plate. Transduced cells were selected with 1 μg/ml of puromycin (Thermofisher Scientific, A1113803) for 3 days. These selected cells were plated at low concentrations in a 10-cm dish and maintained at 37°C with 5% CO2 for 2 wk. After 2 wk of incubation, the selected colonies were isolated using cloning discs (Sigma, Z374431) and re-plated in 24-well plates. The loss of GBA expression was validated by mRNA analysis of human GBA using SYBR Green (Applied Biosystems, A25741) real-time PCR, with primer set: 5ʹ-GAA CAG AAG TTC CAG AAA GTG AA-3ʹ (forward); 5ʹ- TCA GAG AAG TAC GAT TTA AGT AGC A-3ʹ (reverse). Relative mRNA levels were calculated according to the 2−ΔΔCt method. All Δ threshold cycle (Ct) values were normalized to human ACTB (forward, 5ʹ- ATT GCC GAC AGG ATG CAG AAG-3; reverse, 5ʹ-TTG CTG ATC CAC ATC TGC TGG-3ʹ). The loss of GBA expression also confirmed by western blot analysis using GBA antibody (Sigma, G4171) and by measuring GBA enzyme activity.
Primary neuronal culture
Postnatal P1-2 mouse pups were used for primary neuron isolation. The hippocampus was dissected and placed in digestion solution containing 0.25% trypsin (Thermofisher Scientific, 15090046), 20 mM glucose (Sigma, G-6152), 20 mM HEPES (Thermofisher Scientific, 15630080), DNase (50 units/ml, Sigma, DN25-100MG) for 15 min at room temperature. The activity of trypsin was stopped by adding 15% fetal bovine serum (Thermofisher Scientific, 16140071) in Opti-MEM (Thermofisher Scientific, 31985088). The tissue was dissociated using a 1-ml pipette by gentle trituration on the side of the tube 15 times, until no large chunks of tissue remained. The dissociated tissue was centrifuged at 200 g for 2–3 min and the cell pellet was resuspended in Neurobasal medium (Thermofisher Scientific, 10888022) containing 2% B27 supplement (Thermofisher Scientific, 17504044) and 1% GlutaMAX (Thermofisher Scientific, 35050061). All cultures were maintained at 37°C in a humidified 5% CO2-containing atmosphere. At day 14–15 in vitro (DIV 14–15), primary neurons were subjected to live-cell staining for mitochondria (MitoTracker Red and Green, MitoSOX Red) or lysosomes (LysoTracker Red).
Subcellular fractionation
Mitochondria were fractionated from mouse tissue and SHSY-5Y cells by Percoll (Sigma, GE17-0891–01) density gradient centrifugation (Figure S4(A)). Lysosome-enriched and ER-enriched fractions were isolated according to Kim et al. [Citation75], and Schreiner et al. [Citation76].
MitoTracker, MitoSOX Red and LysoTracker label
Primary mouse hippocampal neurons or SH-SY5Y neuroblastoma cells were loaded with 200 nM green-fluorescing MitoTracker Green (MitoGreen, 37°C, 30 min) to measure mitochondrial content, and 100 nM MitoTracker Red (MitoRed, 37°C, 30 min) to measure mitochondrial membrane potential, or with LysoTracker Red DND-99 (200 nM, 37°C, 30 min) to label lysosomes, followed by a wash with warmed complete DMEM medium. To measure mitochondrial reactive oxygen species (ROS) levels, cells were loaded with MitoGreen followed by 10 µM MitoSOX Red (37°C, 15 min), which is a mitochondrial superoxide indicator. The cells were live-imaged immediately after incubation with fresh complete medium for 60 min with the Leica Multiphoton system. The excitation and emission wavelengths for each fluorophore were selected according to the manufacturer’s instructions. The fluorescence intensity of each tracer in various conditions was expressed as the fold of change versus control cells incubated in complete medium. All data were acquired from experiments with at least 3 replicates. For neurons/cells with each genotype, at least 40 neurons were imaged from 3–4 different experiments.
Mito-Keima fluorescence
Primary hippocampal neurons were cultured from WT and GbaL444P/WT mutant mt-Keima mice, and imaged with a Leica multiphoton system. Mt-Keima neurons were excited in 2 channels via 2 sequential wavelengths (458 nm, green; 561 nm, red), and measured at a 590–695 nm emission range. The ratio of red:green (561:458 nm)-excited Keima fluorescence was calculated as an index of mitophagy. All data were acquired from experiments with at least 3 replicates. For each genotype, at least 40 neurons were imaged from 3–4 different experiments. The labeled cells were live-imaged with a Leica Multiphoton system and analyzed with ImageJ. The fluorescence intensity or the number of puncta was quantified on every 3rd section from the image stack containing the nucleus.
Mitochondrial morphology assessment
Neurons or fibroblasts were stained with MitoTracker Green. Image stacks were acquired with a Leica Multiphoton system, projected and binarized before the analysis. Mitochondrial morphological characteristics, including mitochondrial aspect ratio (the ratio between the major and minor axes of the ellipse equivalent to the mitochondrion), degree of branching or form factor ((perimeter2)/(4π· surface area)) [Citation17], were quantified using ImageJ Mito-Morphology Macro (http://imagejdocu.tudor.lu/lib/exe/fetch.php?media=plugin:morphology: mitochondrial_Morphology_macro_plug-in:mitophagy_ver _1_44_final_colocalization_f.txt).
Analysis of cell survival
Cell viability was measured by trypan blue exclusion assay according to standard protocol [Citation77]. Neurons were plated on coverslips in 12-well culture plates. At day 14–15, cells were rinsed with 2 ml HEPES (6.7 mM KCl, 142 mM NaCl, and 10 mM HEPES, pH 7.5), and incubated with 0.5 ml of 0.2% trypan blue (Sigma, T8154) in HEPES for 2 min at room temperature. Trypan-blue positive and -negative cells were counted in 10 random fields per well using the grid-containing eyepiece. The percentage of trypan blue-negative cells, which are indicative of live cells, was calculated to estimate survival rates. All experiments were performed in triplicate.
Western blotting
Human anterior cingular cortex, mouse hippocampal brain tissue, SH-SY5Y cells or fractionated mitochondria were homogenized in 1 × RIPA buffer (Sigma, R0728) supplemented with protease inhibitors (Sigma, 11836170001) and phosphatase inhibitors (Sigma, P5726). The suspensions were centrifuged at 13,000 g at 4°C for 30 min.The supernatants were collected and assayed for total protein concerntration using the Bradford method (BioRad, 5000006). Samples were aliquoted into labeled vials and stored at −80°C until use.
For western blot analysis, protein lysates were mixed with NuPAGE sample buffer (Thermo Fisher Scientific, NP0007), separated in 4–12% NuPAGE Bis–Tris gels (Thermo Fisher Scientific, NP0329BOX) and transferred to Whatman PROTRAN Nitrocellulose Membranes (GE Healthcare, 10600001). The Membranes were washed with 1 × Tris-buffered saline with 0.1% Tween 20 (TBS-T, Santa Cruz Biotechnology, sc-362311), and blocked with 5% dry milk in 1 × TBS-T at room temperature (RT) for 1 h, and then incubated overnight with the primary antibodies. After 3 washes with 1 × TBS-T buffer at 10-min intervals, the membranes were incubated for 1 h at RT with appropriate secondary antibodies, followed by 3 additional washes at 10-min intervals. Protein bands were visualized using ECL (Millipore, WBKLS0500) or Supersignal Chemiluminescent reagents (Thermo Fisher Scientific, 34076).
Prior to western blot analysis of target proteins, the amount of sample needed to produce a linear response for housekeeping proteins was determined. The linear range of sample loading was estimated by serially diluting a representative sample preparation and blotting for ACTB and GAPDH (human brain, mouse brain tissue or cell lysates), or VDAC1 (fractionated mitochondria). The optimal protein load was 10–15 μg for the linear detection of GAPDH and ACTB in total brain or cell lysates, and 4–6 μg for VDAC1 in fractionated mitochondria.
Blots were imaged with the Bio-Rad ChemiDoc™ Touch Imaging System, and we used the Signal Accumulation Mode (SAM) to determine the optimal imaging time for chemiluminescent detection. After the optimal exposure time was determined using a CCD camera, a series of single images with different exposure settings were acquired to identify faint signals in the image. Images with saturated bands were discarded, and data analysis was performed on images in which target protein bands can be detected in all gel lanes.
The densities of immunoreactive bands were quantified using ImageJ and presented as mean ± SE. To further confirm the validity of GAPDH as a loading control, we normalized GAPDH protein levels to that of ACTB (actin beta), and found no differences when comparing disease states or the presence of GBA mutations (Figure S6). Triton X-100 (Sigma, T9204)-soluble and -insoluble SNCA protein in human brain tissue was assessed as described in Rockenstein et al., 2014 [Citation78]. All data were generated from experiments with at least 3 replicates.
Lysosomal GBA enzyme activity assay
GBA enzyme activity was measured in lysosome-enriched fractions using 4-methylumbelliferyl β-D-glucopyranoside (Sigma, M3633) as a substrate, as in Gegg et al., 2012 [Citation79]. Brain tissue or cell pellets were homogenized in buffer containing 250 mM sucrose, 10 mM Tris, pH 7.4, protease (Roche, 11836170001) and phosphatase inhibitor cocktails (Sigma, P5726). Diluted sample (50 µl) was added to 50 μL of 10 mM 4-methylumbelliferyl-β-d-glucopyranoside substrate in a 96-well plate with or without CBE (Sigma, C5424). After incubation with the substrate for 60 min at 37°C, the reaction was terminated using 50 μL of stop solution (1 M glycine-NaOH, pH 12.5, sigma G7126). The plate was read (excitation 365 nm-emission 450 nm) with a BioTek Synergy Mx Monochromator-based Microplate Reader with Gen5 Software (BioTek Instruments, Inc, Winoosk, VT, USA). Fluorescence intensity was converted to CBE-specific enzymatic activity using a standard curve from human GBA (R&D Systems, 7410-GHB) and normalized to protein content per sample determined with a BCA kit (Thermo Scientific Pierce, 23227). All data were acquired from experiments with at least 3 replicates.
Mitochondrial complex I dipstick assay
Mitochondrial complex I activity was determined using the Mitochondrial Dipstick Assay kit (Abcam, ab109876), as described in Tang et al., 2014 [Citation18]. Fifteen micrograms of protein were allowed to wick up laterally through the dipstick membrane, the dipsticks were transferred into the complex I enzyme substrate buffer and enzyme activities were calculated by measuring the optical density of precipitating, colorimetric enzyme reaction using ImageJ. All measurements were made in triplicate.
Immunohistochemistry
Immunohistochemistry was performed in paraffin-embedded sections from age- and postmortem interval-matched control and GBA-PD brains, and in floating sections from perfusion-fixed mouse brains, according to general protocols. Immunohistochemistry was performed in fixed brain sections from GBA-PD (n = 3) and age-matched controls (n = 3), according to general protocols. One cubic centimeter brain sections were fixed in 10% neutral buffered formalin and were embedded in paraffin blocks. Seven-micron-thick consecutive sections were prepared, deparaffinized and rehydrated. Antigen retrieval was performed in a steamer for 40 min with Trilogy buffer (Cell Marque, 920P-10). Sections were then incubated with primary antibodies against mitochondrial membrane proteins VDAC1/porin, SQSTM1 and LC3B at 4°C overnight, followed by an appropriate species of secondary antibodies conjugated to Alexa Fluor 488 and Alexa Fluor 594 (Thermofisher Scientific, A21202, A21203, A21206, A21207, A21209) for 1 h at room temperature. Negative control sections were held in phosphate-buffered saline (Sigma, D1408) without primary antibody during the primary incubation. Background immunoreactivity with anti-rabbit and anti-mouse secondary antibodies alone was negligible.
For 8-OHdG immunostaining, antigen-retrieved paraffin sections were treated with proteinase K (20 μg/ml; Sigma 21627) at 37°C for 45 min. The slides were blocked for endogenous peroxidase activity with peroxidase block (DAKO, S2001), washed 5 min in buffer, and incubated with serum-free protein block (DAKO, X0909) for 1 h. The sections were incubated with anti-8-OHdG antibody at 37°C for 1 h, followed by Alexa Fluor 488-conjugated secondary antibody at RT for 1 h.
Images were acquired using a Leica Multiphoton imaging system with a 63x objective and a zoom factor 4. ImageJ software was used to quantify the fluorescence intensity from 30 randomly selected pyramidal neurons per case. The fluorescence intensity was obtained for the soma of each neuron, averaged and corrected for background by subtracting the fluorescence intensity of the negative control sections. All images were acquired under identical conditions.
Statistical analysis
Data were presented as mean ± standard error (SE) or mean (percentage of controls) ± SE from 3–4 independent experiments. Statistical analyses were performed using GraphPad Prism software. Normal distribution of the data was determined using the Kolmogorov-Smirnov test. Differences among multiple groups were compared using one-way ANOVA followed by Bonferroni’s post-hoc comparisons tests. Differences in the normalized intensity value between controls and GBA-PD groups (or between control and GbaL444P/WT mice) were performed with the non-parametric Kruskal-Wallis test or Student t test, depending on whether datasets are normally distributed. p < 0.05 was considered statistically significant.
Supplemental Material
Download MS Word (6.6 MB)Acknowledgments
We are grateful to Drs. Joseph A. Hill and Fangming Lin for kindly providing us the CAG-RFP-GFP-LC3B autophagy reporter mice, to Dr. Atsushi Miyawaki (RIKEN Brain Science Institute) for the supply of the mt-mKeima reporter gene, and to Dr. Toren Finkel for sharing with us the mt-Keima mice. We also thank the New York Brain Bank for providing human brain tissue and the Coriell Institute for human fibroblasts.
Disclosure statement
No potential conflict of interest was reported by the authors.
Supplementary Data
Supplementary Data can be accessed here.
Additional information
Funding
Related Research Data
References
- Sidransky E, Nalls MA, Aasly JO, et al. Multicenter analysis of glucocerebrosidase mutations in Parkinson’s disease. N Engl J Med. 2009;361(17):1651–1661.
- Sidransky E, Lopez G. The link between the GBA gene and parkinsonism. Lancet Neurol. 2012;11(11):986–998.
- Nalls MA, Duran R, Lopez G, et al. A multicenter study of glucocerebrosidase mutations in dementia with Lewy bodies. JAMA Neurol. 2013;70(6):727–735.
- Exner N, Lutz AK, Haass C, et al. Mitochondrial dysfunction in Parkinson’s disease: molecular mechanisms and pathophysiological consequences. EMBO J. 2012;31(14):3038–3062.
- Schapira AH. Mitochondria in the aetiology and pathogenesis of Parkinson’s disease. Lancet Neurol. 2008;7(1):97–109.
- Winklhofer KF, Haass C. Mitochondrial dysfunction in Parkinson’s disease. Biochim Biophys Acta. 2010;1802(1):29–44.
- Ryan BJ, Hoek S, Fon EA, et al. Mitochondrial dysfunction and mitophagy in Parkinson’s: from familial to sporadic disease. Trends Biochem Sci. 2015;40(4):200–210.
- Hamacher-Brady A, Brady NR. Mitophagy programs: mechanisms and physiological implications of mitochondrial targeting by autophagy. Cell Mol Life Sci. 2016;73(4):775–795.
- Schapira AH, Chiasserini D, Beccari T, et al. Glucocerebrosidase in Parkinson’s disease: insights into pathogenesis and prospects for treatment. Mov Disord. 2016;31(6):830–835.
- Osellame LD, Rahim AA, Hargreaves IP, et al. Mitochondria and quality control defects in a mouse model of Gaucher disease–links to Parkinson’s disease. Cell Metab. 2013;17(6):941–953.
- Gegg ME, Schapira AH. Mitochondrial dysfunction associated with glucocerebrosidase deficiency. Neurobiol Dis. 2016;90:43–50.
- Xu YH, Xu K, Sun Y, et al. Multiple pathogenic proteins implicated in neuronopathic Gaucher disease mice. Hum Mol Genet. 2014;23(15):3943–3957.
- Sardi SP, Clarke J, Kinnecom C, et al. CNS expression of glucocerebrosidase corrects alpha-synuclein pathology and memory in a mouse model of Gaucher-related synucleinopathy. Proc Natl Acad Sci USA. 2011;108(29):12101–12106.
- Taguchi YV, Liu J, Ruan J, et al. Glucosylsphingosine promotes α-synuclein pathology in mutant GBA-associated Parkinson’s Disease. J Neurosci. 2017;37(40):9617–9631.
- Cilia R, Tunesi S, Marotta G, et al. Survival and dementia in GBA-associated Parkinson’s disease: the mutation matters. Ann Neurol. 2016;80(5):662–673.
- Liu G, Boot B, Locascio JJ, et al. Specifically neuropathic Gaucher’s mutations accelerate cognitive decline in Parkinson’s. Ann Neurol. 2016;80(5):674–685.
- Picard M, White K, Turnbull DM. Mitochondrial morphology, topology, and membrane interactions in skeletal muscle: a quantitative three-dimensional electron microscopy study. J Appl Physiol (1985). 2013;114(2):161–171.
- Tang G, Gutierrez Rios P, Kuo SH, et al. Mitochondrial abnormalities in temporal lobe of autistic brain. Neurobiol Dis. 2013;54:349–361.
- Medeiros DM. Assessing mitochondria biogenesis. Methods. 2008;46(4):288–294.
- Itoh K, Nakamura K, Iijima M, et al. Mitochondrial dynamics in neurodegeneration. Trends Cell Biol. 2013;23(2):64–71.
- van der Bliek AM, Shen Q, Kawajiri S. Mechanisms of mitochondrial fission and fusion. Cold Spring Harb Perspect Biol. 2013;5(6):pii:a011072.
- Sun N, Yun J, Liu J, et al. Measuring In Vivo Mitophagy. Mol Cell. 2015;60(4):685–696.
- Katayama H, Kogure T, Mizushima N, et al. A sensitive and quantitative technique for detecting autophagic events based on lysosomal delivery. Chem Biol. 2011;18(8):1042–1052.
- Sargsyan A, Cai J, Fandino LB, et al. Rapid parallel measurements of macroautophagy and mitophagy in mammalian cells using a single fluorescent biosensor. Sci Rep. 2015;5:12397.
- Cai Q, Zakaria HM, Simone A, et al. Spatial parkin translocation and degradation of damaged mitochondria via mitophagy in live cortical neurons. Curr Biol. 2012;22(6):545–552.
- Durcan TM, Fon EA. The three ‘P’s of mitophagy: PARKIN, PINK1, and post-translational modifications. Genes Dev. 2015;29(10):989–999.
- Ebrahimi-Fakhari D, Saffari A, Wahlster L, et al. Impaired mitochondrial dynamics and mitophagy in neuronal models of tuberous sclerosis complex. Cell Rep. 2016;17(4):1053–1070.
- Rodriguez-Enriquez S, Kim I, Currin RT, et al. Tracker dyes to probe mitochondrial autophagy (mitophagy) in rat hepatocytes. Autophagy. 2006;2(1):39–46.
- Zhu J, Dagda RK, Chu CT. Monitoring mitophagy in neuronal cell cultures. Methods Mol Biol. 2011;793:325–339.
- Youle RJ, Narendra DP. Mechanisms of mitophagy. Nat Rev Mol Cell Biol. 2011;12(1):9–14.
- Klionsky DJ, Abdelmohsen K, Abe A, et al. Guidelines for the use and interpretation of assays for monitoring autophagy (3rd edition). Autophagy. 2016;12(1):1–222.
- Nazio F, Cecconi F. mTOR, AMBRA1, and autophagy: an intricate relationship. Cell Cycle. 2013;12(16):2524–2525.
- Strappazzon F, Vietri-Rudan M, Campello S, et al. Mitochondrial BCL-2 inhibits AMBRA1-induced autophagy. EMBO J. 2011;30(7):1195–1208.
- Li L, Wang ZV, Hill JA, et al. New autophagy reporter mice reveal dynamics of proximal tubular autophagy. J Am Soc Nephrol. 2014;25(2):305–315.
- Kimura S, Noda T, Yoshimori T. Dissection of the autophagosome maturation process by a novel reporter protein, tandem fluorescent-tagged LC3. Autophagy. 2007;3(5):452–460.
- Ni HM, Bockus A, Wozniak AL, et al. Dissecting the dynamic turnover of GFP-LC3 in the autolysosome. Autophagy. 2011;7(2):188–204.
- Ron I, Horowitz M. ER retention and degradation as the molecular basis underlying Gaucher disease heterogeneity. Hum Mol Genet. 2005;14(16):2387–2398.
- Cleeter MW, Chau KY, Gluck C, et al. Glucocerebrosidase inhibition causes mitochondrial dysfunction and free radical damage. Neurochem Int. 2013;62(1):1–7.
- de la Mata M, Cotán D, Oropesa-Ávila M, et al. Pharmacological chaperones and coenzyme Q10 treatment improves mutant β-glucocerebrosidase activity and mitochondrial function in neuronopathic forms of gaucher disease. Sci Rep. 2015;5:10903.
- Jin SM, Youle RJ. PINK1- and Parkin-mediated mitophagy at a glance. J Cell Sci. 2012;125(Pt 4):795–799.
- Novak I. Mitophagy: a complex mechanism of mitochondrial removal. Antioxid Redox Signal. 2012;17(5):794–802.
- Berthet A, Margolis EB, Zhang J, et al. Loss of mitochondrial fission depletes axonal mitochondria in midbrain dopamine neurons. J Neurosci. 2014;34(43):14304–14317.
- Poole AC, Thomas RE, Andrews LA, et al. The PINK1/Parkin pathway regulates mitochondrial morphology. Proc Natl Acad Sci USA. 2008;105(5):1638–1643.
- Wang X, Petrie TG, Liu Y, et al. Parkinson’s disease-associated DJ-1 mutations impair mitochondrial dynamics and cause mitochondrial dysfunction. J Neurochem. 2012;121(5):830–839.
- Wang X, Yan MH, Fujioka H, et al. LRRK2 regulates mitochondrial dynamics and function through direct interaction with DLP1. Hum Mol Genet. 2012;21(9):1931–1944.
- Kamp F, Exner N, Lutz AK, et al. Inhibition of mitochondrial fusion by α-synuclein is rescued by PINK1, Parkin and DJ-1. EMBO J. 2010;29(20):3571–3589.
- Loson OC, Song Z, Chen H, et al. Fis1, Mff, MiD49, and MiD51 mediate Drp1 recruitment in mitochondrial fission. Mol Biol Cell. 2013;24(5):659–667.
- Twig G, Elorza A, Molina AJ, et al. Fission and selective fusion govern mitochondrial segregation and elimination by autophagy. EMBO J. 2008;27(2):433–446.
- Magalhaes J, Gegg ME, Migdalska-Richards A, et al. Autophagic lysosome reformation dysfunction in glucocerebrosidase deficient cells: relevance to Parkinson disease. Hum Mol Genet. 2016;25(16):3432–3445.
- Kinghorn KJ, Grönke S, Castillo-Quan JI, et al. A drosophila model of neuronopathic gaucher disease demonstrates lysosomal-autophagic defects and altered mTOR signalling and is functionally rescued by rapamycin. J Neurosci. 2016;36(46):11654–11670.
- Awad O, Sarkar C, Panicker LM, et al. Altered TFEB-mediated lysosomal biogenesis in Gaucher disease iPSC-derived neuronal cells. Hum Mol Genet. 2015;24(20):5775–5788.
- Narendra D, Walker JE, Youle R. Mitochondrial quality control mediated by PINK1 and Parkin: links to parkinsonism. Cold Spring Harb Perspect Biol. 2012;4(11):pii: a011338.
- Ni HM, Williams JA, Ding WX. Mitochondrial dynamics and mitochondrial quality control. Redox Biol. 2015;4:6–13.
- Narendra D, Tanaka A, Suen DF, et al. Parkin is recruited selectively to impaired mitochondria and promotes their autophagy. J Cell Biol. 2008;183(5):795–803.
- Richter B, Sliter DA, Herhaus L, et al. Phosphorylation of OPTN by TBK1 enhances its binding to Ub chains and promotes selective autophagy of damaged mitochondria. Proc Natl Acad Sci USA. 2016;113(15):4039–4044.
- Lazarou M, Sliter DA, Kane LA, et al. The ubiquitin kinase PINK1 recruits autophagy receptors to induce mitophagy. Nature. 2015;524(7565):309–314.
- Wong YC, Holzbaur EL. Temporal dynamics of PARK2/parkin and OPTN/optineurin recruitment during the mitophagy of damaged mitochondria. Autophagy. 2015;11(2):422–424.
- Pankiv S, Clausen TH, Lamark T, et al. p62/SQSTM1 binds directly to Atg8/LC3 to facilitate degradation of ubiquitinated protein aggregates by autophagy. J Biol Chem. 2007;282(33):24131–24145.
- Thurston TL, Ryzhakov G, Bloor S, et al. The TBK1 adaptor and autophagy receptor NDP52 restricts the proliferation of ubiquitin-coated bacteria. Nat Immunol. 2009;10(11):1215–1221.
- Kirkin V, Lamark T, Sou Y-S, et al. A role for NBR1 in autophagosomal degradation of ubiquitinated substrates. Mol Cell. 2009;33(4):505–516.
- Schweers RL, Zhang J, Randall MS, et al. NIX is required for programmed mitochondrial clearance during reticulocyte maturation. Proc Natl Acad Sci USA. 2007;104(49):19500–19505.
- Novak I, Kirkin V, McEwan DG, et al. Nix is a selective autophagy receptor for mitochondrial clearance. EMBO Rep. 2010;11(1):45–51.
- Liu L, Feng D, Chen G, et al. Mitochondrial outer-membrane protein FUNDC1 mediates hypoxia-induced mitophagy in mammalian cells. Nat Cell Biol. 2012;14(2):177–185.
- Zhu Y, Massen S, Terenzio M, et al. Modulation of serines 17 and 24 in the LC3-interacting region of Bnip3 determines pro-survival mitophagy versus apoptosis. J Biol Chem. 2013;288(2):1099–1113.
- Van Humbeeck C, Cornelissen T, Hofkens H, et al. Parkin interacts with Ambra1 to induce mitophagy. J Neurosci. 2011;31(28):10249–10261.
- Strappazzon F, Nazio F, Corrado M, et al. AMBRA1 is able to induce mitophagy via LC3 binding, regardless of PARKIN and p62/SQSTM1. Cell Death Differ. 2015;22(3):419–432.
- Bendikov-Bar I, Ron I, Filocamo M, et al. Characterization of the ERAD process of the L444P mutant glucocerebrosidase variant. Blood Cells Mol Dis. 2011;46(1):4–10.
- Bendikov-Bar I, Horowitz M. Gaucher disease paradigm: from ERAD to comorbidity. Hum Mutat. 2012;33(10):1398–1407.
- Ron I, Rapaport D, Horowitz M. Interaction between parkin and mutant glucocerebrosidase variants: a possible link between Parkinson disease and Gaucher disease. Hum Mol Genet. 2010;19(19):3771–3781.
- Bendikov-Bar I, Rapaport D, Larisch S, et al. Parkin-mediated ubiquitination of mutant glucocerebrosidase leads to competition with its substrates PARIS and ARTS. Orphanet J Rare Dis. 2014;9:86.
- Mazzulli JR, Xu YH, Sun Y, et al. Gaucher disease glucocerebrosidase and α-synuclein form a bidirectional pathogenic loop in synucleinopathies. Cell. 2011;146(1):37–52.
- Mullin S, Schapira A. α-Synuclein and mitochondrial dysfunction in Parkinson’s disease. Mol Neurobiol. 2013;47(2):587–597.
- Zaltieri M, Longhena F, Pizzi M, et al. Mitochondrial dysfunction and α-synuclein synaptic pathology in parkinson’s disease: who’s on first? Parkinsons Dis. 2015;2015:108029.
- McNeill A, Magalhaes J, Shen C, et al. Ambroxol improves lysosomal biochemistry in glucocerebrosidase mutation-linked Parkinson disease cells. Brain. 2014;137(Pt 5):1481–1495.
- Kim YC, Park HW, Sciarretta S, et al. Rag GTPases are cardioprotective by regulating lysosomal function. Nat Commun. 2014;5:4241.
- Schreiner B, Ankarcrona M. Isolation of Mitochondria-Associated Membranes (MAM) from mouse brain tissue. Methods Mol Biol. 2017;1567:53–68.
- Aras MA, Hartnett KA, Aizenman E. Assessment of cell viability in primary neuronal cultures. Curr Protoc Neurosci. 2008;44:7.18.1–7.18.5.
- Rockenstein E, Nuber S, Overk CR, et al. Accumulation of oligomer-prone alpha-synuclein exacerbates synaptic and neuronal degeneration in vivo. Brain. 2014;137(1):1496–1513.
- Gegg ME, Burke D, Heales SJ, et al. Glucocerebrosidase deficiency in substantia nigra of parkinson disease brains. Ann Neurol. 2012;72(3):455–463.