
ABSTRACT
The mechanistic target of rapamycin kinase complex 1 (MTORC1) is a central cellular kinase that integrates major signaling pathways, allowing for regulation of anabolic and catabolic processes including macroautophagy/autophagy and lysosomal biogenesis. Essential to these processes is the regulatory activity of TFEB (transcription factor EB). In a regulatory feedback loop modulating transcriptional levels of RRAG/Rag GTPases, TFEB controls MTORC1 tethering to membranes and induction of anabolic processes upon nutrient replenishment. We now show that TFEB promotes expression of endocytic genes and increases rates of cellular endocytosis during homeostatic baseline and starvation conditions. TFEB-mediated endocytosis drives assembly of the MTORC1-containing nutrient sensing complex through the formation of endosomes that carry the associated proteins RRAGD, the amino acid transporter SLC38A9, and activate AKT/protein kinase B (AKT p-T308). TFEB-induced signaling endosomes en route to lysosomes are induced by amino acid starvation and are required to dissociate TSC2, re-tether and activate MTORC1 on endolysosomal membranes. This study characterizes TFEB-mediated endocytosis as a critical process leading to activation of MTORC1 and autophagic function, thus identifying the importance of the dynamic endolysosomal system in cellular clearance.
Abbreviations: CAD: central adrenergic tyrosine hydroxylase-expressing-a-differentiated; ChIP-seq: chromosome immunoprecipitation sequencing; DAPI: 4ʹ,6-diamidino-2-phenylindole; DMSO: dimethyl sulfoxide; EDTA: ethylenediaminetetraacetic acid; EEA1: early endosomal antigen 1; EGF: epidermal growth factor; FBS: fetal bovine serum; GFP: green fluorescent protein; GTPase: guanosine triphosphatase; HEK293T: human embryonic kidney 293 cells expressing a temperature-sensitive mutant of the SV40 large T antigen; LAMP: lysosomal-associated membrane protein; LYNUS: lysosomal nutrient-sensing complex; MAP1LC3/LC3: microtubule associated protein 1 light chain 3 alpha/beta; MTOR: mechanistic target of rapamycin kinase; MTORC: mechanistic target of rapamycin kinase complex; OE: overexpression; PH: pleckstrin homology; PtdIns(3,4,5)P3: phosphatidylinositol 3,4,5-trisphosphate; RRAGD: Ras related GTPase binding D; RHEB: Ras homolog enriched in brain; SLC38A9: solute carrier family 38 member 9; SQSTM1: sequestosome 1; TFEB: transcription factor EB; TSC2: tuberous sclerosis 2; TMR: tetramethylrhodamine; ULK1: unc-51 like kinase 1; WT: wild type
Introduction
MTORC1 (mechanistic target of rapamycin kinase complex 1) is an evolutionarily conserved serine/threonine kinase that controls organismal growth, and has been found to be deregulated in several devastating human diseases including cancer and neurodegeneration [Citation1,Citation2]. MTORC1 integrates major intracellular and extracellular signaling pathways including growth factor signaling, amino acid sensing, energy status, and cellular stress [Citation1,Citation3]. Such MTORC1-mediated signal integration allows for well-controlled regulation of anabolic and catabolic processes such as protein and lipid synthesis, autophagy, lysosomal biogenesis, and energy metabolism that together regulate cellular growth and homeostasis [Citation2,Citation4]. The MTORC1 complex is localized to endolysosomal membranes through an amino acid-dependent mechanism that involves the heterodimeric RRAGA/B-RRAGC/D GTPases. When positioned on endolysosomal membranes, MTORC1 kinase activity is stimulated by RHEB, a membrane-tethered RAS homolog. Therefore, 2 key sequential events are required for MTORC1 activation: translocation of the complex to endolysosomal membranes, and stimulation of its kinase activity by the GTP-bound RHEB, which is differentially regulated by growth factor signaling [Citation1,Citation2].
MTORC1 controls lysosomal biogenesis and degradation through phosphorylation and inhibition of different members of the basic helix-loop-helix leucine zipper family of transcription factors, including TFEB (transcription factor EB) [Citation1,Citation5–Citation8]. As a master transcriptional regulator of cell catabolism, TFEB globally controls the expression of genes that regulate lysosomal and autophagosomal biogenesis [Citation9,Citation10]. Here, we identify a previously unrecognized novel role for TFEB in promoting the endocytic pathway during starvation to sustain lysosomal function and autophagy.
Defects in endolysosomal trafficking are associated with cancer and severe neurodegenerative diseases, including Alzheimer disease, Parkinson disease, amyotrophic lateral sclerosis and myelination disorders [Citation11–Citation15]. Generally speaking, endocytosis and signal transduction are tightly intertwined processes. Endocytosis drives internalization of ligand-activated receptors and formation of specialized signaling platforms on early endosomes, or sequestration of inhibitory signaling molecules thereby leading to attenuation or generation of the signaling program, respectively [Citation16,Citation17]. While the role of endocytosis has been shown for some signaling pathways including WNT, TGFB, G-protein coupled receptors and others [Citation17–Citation22], given the importance of membrane-trafficking for MTORC1 in nutrient sensing and homeostasis there remains a paucity of data on the relationship between endocytosis and MTORC1 signaling in the context of molecular clearance.
Here, we show that during starvation, TFEB induces cellular endocytosis and formation of endosomes carrying crucial components of the lysosomal nutrient-sensing complex (LYNUS) [Citation23] that are required for stimulating MTORC1 activity. Pharmacological and genetic inhibition of endocytosis or retrograde trafficking abolished MTORC1 activity without affecting total levels of AKT p-T308 and despite the presence of active TFEB in the nucleus. We report that these TFEB-induced endosomes en route to lysosomes facilitate assembly of LYNUS that tethers MTORC1 to lysosomal membranes. The results presented characterize starvation-induced endocytosis as a TFEB-mediated process that leads to reactivation of MTORC1 signaling and sustained autophagic function.
Results
TFEB increases cellular endocytosis and assembly of the MTORC1-containing LYNUS complex
TFEB drives lysosomal biogenesis and molecular clearance through endolysosomal exocytosis and autophagy [Citation10,Citation24,Citation25]. Given the role of endocytosis in membrane sorting, ChIP-seq analyses [Citation6] and microarray analyses of TFEB-overexpressing cells were conducted to examine if TFEB might also have a regulatory effect on endocytic gene expression. ChIP-seq analyses [Citation6] identified 46 TFEB-bound endocytic genes, including RAB5A, RAB7A, and CLTA (clathrin, light polypeptide [Lca]), as a subset of 623 endocytosis-related genes () and Tables S1 and S2). Microarray analyses further identified 35 endocytic genes induced by TFEB expression, including RAB7A and CAV2 (caveolin 2) (Table S3), partially overlapping with the noted endocytic genes ()). Expression of wild-type (WT) or the constitutively active mutant form of TFEB (TFEB-Flag or TFEBS211A-Flag, respectively) in HeLa cells markedly increased the number of EEA1-positive endosomes as determined by immunofluorescence and the overall level of EEA1 expression as judged by immunoblot ()). TFEB-overexpressing cells showed a robust increase of CAV2 ()) and CLTA/B protein levels ()), 2 major endocytic coat proteins.
Figure 1. Overexpression of TFEB stimulates cellular endocytosis. (a) Venn diagram illustrating the relationship between 623 endocytic genes with 46 endocytic genes directly bound by TFEB (ChIP-seq analysis on stable TFEB-FLAG HeLa cells) and 35 TFEB-upregulated endocytic genes (microarray analysis on TFEB-GFP HeLa cells compared to WT HeLa controls), identifying putative genes of interest regulating the endocytic process. A complete list of the 46 endocytic genes identified by ChIP-seq (adapted from [Citation6]) is presented in Table S1, 623 endocytic genes with known/predicted roles in the endocytic pathway are listed in Table S2, and the 35 endocytic genes determined by microarray can be found in Table S3. Bracketed numbers within each domain represent the number of genes in each intersecting or non-overlapping region. (b) Immunofluorescence images represent HeLa cells transiently transfected with WT Flag-TFEB for 48 h and immunostained for EEA1. Flag-TFEB-expressing cells showed a significant increase in the levels of EEA1-positive endosomes as compared to untransfected, neighboring cells. HEK293T cells transiently transfected with constitutively active TFEBS211A also showed an increased level of EEA1 expression. (c and d) HEK293T cells transiently overexpressing TFEBS211A showed increased CAV2 and CLTA/B protein levels. Bar graph represents a quantitative evaluation of the indicated relative protein levels. (e) Overexpression of TFEB-GFP increased the number of dextran-tetramethylrhodamine (dextran-TMR)-positive puncta indicating increased rates of endocytosis, panels on the right show magnifications of the outlined areas in merged images. The bar graph represents quantitative dextran-TMR uptake assays assessing TMR fluorescence intensities in cells. Note that TFEB-overexpression, 50 µM chloroquine (CQ) for 2 h, 1 µM Torin1 for 2 h and 2-h amino acid starvation all potently increased dextran-TMR uptake. (f) In dextran-TMR uptake assays for cellular endocytosis, TFEB-deficient HEK293T cells show a lower rate of uptake compared to control cells, in both fed and 2-h amino acid-starved conditions. Panels on the right are magnifications of the outlined areas in images of fed or starved cells. Bar diagram represents a quantitative assessment of dextran-TMR uptake in control or TFEB-knockdown cells under fed or starved conditions (compare average number of dextran-TMR puncta per cell in control vs TFEB-siRNA-treated cells). Note that amino acid starvation increases endocytic dextran-TMR uptake and is dependent on TFEB expression. Immunoblot analyses represent TFEB knockdown efficiency in HEK293T cells. The bar graph represents a quantitative evaluation of TFEB protein levels. Transient overexpression of TFEB increased and relocalized EGF-rhodamine and CAV2 (see Figure S1). Data are represented as mean ± SEM, n = 3, *p ≤ 0.05; **p ≤ 0.01; ANOVA, Scale bar: 10 μm. ACTB is used as loading control.
![Figure 1. Overexpression of TFEB stimulates cellular endocytosis. (a) Venn diagram illustrating the relationship between 623 endocytic genes with 46 endocytic genes directly bound by TFEB (ChIP-seq analysis on stable TFEB-FLAG HeLa cells) and 35 TFEB-upregulated endocytic genes (microarray analysis on TFEB-GFP HeLa cells compared to WT HeLa controls), identifying putative genes of interest regulating the endocytic process. A complete list of the 46 endocytic genes identified by ChIP-seq (adapted from [Citation6]) is presented in Table S1, 623 endocytic genes with known/predicted roles in the endocytic pathway are listed in Table S2, and the 35 endocytic genes determined by microarray can be found in Table S3. Bracketed numbers within each domain represent the number of genes in each intersecting or non-overlapping region. (b) Immunofluorescence images represent HeLa cells transiently transfected with WT Flag-TFEB for 48 h and immunostained for EEA1. Flag-TFEB-expressing cells showed a significant increase in the levels of EEA1-positive endosomes as compared to untransfected, neighboring cells. HEK293T cells transiently transfected with constitutively active TFEBS211A also showed an increased level of EEA1 expression. (c and d) HEK293T cells transiently overexpressing TFEBS211A showed increased CAV2 and CLTA/B protein levels. Bar graph represents a quantitative evaluation of the indicated relative protein levels. (e) Overexpression of TFEB-GFP increased the number of dextran-tetramethylrhodamine (dextran-TMR)-positive puncta indicating increased rates of endocytosis, panels on the right show magnifications of the outlined areas in merged images. The bar graph represents quantitative dextran-TMR uptake assays assessing TMR fluorescence intensities in cells. Note that TFEB-overexpression, 50 µM chloroquine (CQ) for 2 h, 1 µM Torin1 for 2 h and 2-h amino acid starvation all potently increased dextran-TMR uptake. (f) In dextran-TMR uptake assays for cellular endocytosis, TFEB-deficient HEK293T cells show a lower rate of uptake compared to control cells, in both fed and 2-h amino acid-starved conditions. Panels on the right are magnifications of the outlined areas in images of fed or starved cells. Bar diagram represents a quantitative assessment of dextran-TMR uptake in control or TFEB-knockdown cells under fed or starved conditions (compare average number of dextran-TMR puncta per cell in control vs TFEB-siRNA-treated cells). Note that amino acid starvation increases endocytic dextran-TMR uptake and is dependent on TFEB expression. Immunoblot analyses represent TFEB knockdown efficiency in HEK293T cells. The bar graph represents a quantitative evaluation of TFEB protein levels. Transient overexpression of TFEB increased and relocalized EGF-rhodamine and CAV2 (see Figure S1). Data are represented as mean ± SEM, n = 3, *p ≤ 0.05; **p ≤ 0.01; ANOVA, Scale bar: 10 μm. ACTB is used as loading control.](/cms/asset/31bcdd51-932c-421a-91e1-601f6fc33199/kaup_a_1511504_f0001_c.jpg)
We assessed the effect of TFEB overexpression, as well as starvation, on the localization of CAV2 proteins and the uptake of EGF (epidermal growth factor)-rhodamine. In amino acid-starved cells, membrane-bound EGF-rhodamine and CAV2 were efficiently internalized (Figure S1(a-c)), similar to cells expressing TFEB or TFEBS211A (Figure S1(d)). Amino acid starvation increased total intracellular CAV2 levels in a TFEB-dependent manner (Figure S1(e)). We further found that TFEB-GFP-expressing cells increased uptake of extracellular dextran-tetramethylrhodamine (TMR) as determined by quantification of fluorescence micrographs of relative fluorescence intensity and number of intracellular dextran-TMR particles ()). A similar increase of dextran-TMR uptake was observed in cells treated with the lysosomal inhibitor chloroquine, the MTOR inhibitor Torin1, or during prolonged starvation ()), all being conditions known to cause translocation of TFEB into the nucleus. Importantly, the increased endocytic uptake of dextran-TMR in amino acid-starved cells was dependent on TFEB expression. TFEB knockdown cells showed low levels of intracellular dextran-TMR signal when compared to control cells ()). Collectively, the results establish that TFEB regulates the expression of a number of endocytic genes needed to drive the activity of the endocytic pathway under starvation conditions.
Recent studies show that TFEB-mediated transcription of RRAGD promotes MTORC1 activity and tumor growth [Citation26]. As endocytosis plays a crucial role in the activation of many signaling pathways [Citation16,Citation17], we examined whether TFEB might have a consequence on the formation of signaling endosomes and for lysosomal delivery of crucial components of the nutrient sensing complex to activate MTORC1. To investigate this hypothesis, HEK293T cells transfected either with control scrambled or siRNA specific to TFEB were starved of amino acids for up to 6 h then used in endolysosomal fractionation assays. These cells were exposed to dialyzed FBS to allow for growth factor signaling. Cells starved of amino acids showed an increased quantity of LAMP1- and RAB5-positive organelles, endosomal p-AKT (p-Thr308), the MTORC1-tethering molecule RRAGD, and MTOR itself, whereas the MTOR inhibitor TSC2 was strongly reduced in dense lysosomal fractions. Cells depleted of TFEB and starved for the same amount of time did not show these changes, indicating that formation of MTORC1-positive endolysosomes was dependent on TFEB expression ()).
Figure 2. Overexpression of TFEB induces the formation of signaling endosomes to assemble the LYNUS complex. (a) HEK293T cells transfected either with control scrambled or TFEB-specific siRNA were starved of amino acids for up to 6 h and used in endosomal fractionation assays. All cells were exposed to the same concentration of dialyzed FBS to allow for growth factor signaling. Input shown on the left indicates that equal protein amounts were used in fractionation assays (shown on the right). Starved cells showed an increased quantity of LAMP1- and RAB5-positive organelles, endosomal phospho-AKT (p-Thr308), the MTORC1 tethering molecule RRAGD, and MTOR itself, while TSC2 was strongly reduced in denser lysosomal fractions. This starvation-induced effect was not observed in TFEB-depleted cells (TFEB siRNA-labeled lanes). Bar graphs present quantification of protein levels in input and indicated fractions. (b) TFEB-overexpressing (OE) HEK293T cells used in identical fractionation assays mimicked long-term starvation conditions showing accumulation of organelles positive for LAMP1, RAB5, p-AKT, RRAGD, and MTOR, while being deficient in TSC2. Bar graphs represent protein levels in input and fractions. (c) Overexpression of TFEB induced the formation of AKT-PH-GFP-positive endosomes in NIH-3T3 fibroblasts. The otherwise plasma membrane-bound or cytoplasmic bioprobe AKT-PH-GFP relocalized to RAB5-positive endosomes in TFEB-overexpressing fibroblasts (yellow arrowheads), indicating an increase in PtdIns(3,4,5)P3 levels and activation of AKT. Bar graph represents a quantitative evaluation of AKT-PH-GFP colocalization with RAB5. Scale bar: 10 μm. (d) Localization of the MTOR-tethering molecule RRAGD to RAB5Q79L-positive endosomes was increased with the expression of TFEB-Flag. Diagrams represent a quantitative evaluation of MTOR or RRAGD colocalization with RAB5Q79L-DsRed endosomes. Scale bar: 10 μm. Data are represented as mean ± SEM, n = 3, *p ≤ 0.05; **p ≤ 0.01; ANOVA.
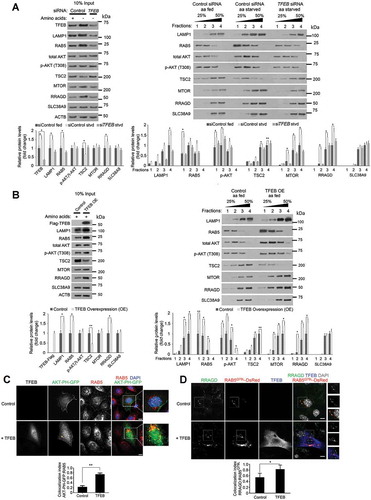
OptiPrep-fractions of TFEB-expressing cells showed increased amounts of LAMP1- and RAB5-positive organelles, increased levels of endosomal p-AKT (p-Thr308), RRAGD and MTOR while showing a reduction of TSC2 when compared to controls (compare ) vs 2A). Levels of the arginine transporter SLC38A9 were only slightly changed in endosomal fractions of TFEB-overexpressing cells. No significant difference in p-AKT (p-Thr308) and SLC38A9 could be detected in the whole-cell, pre-fractionation lysates of starved and TFEB-overexpressing when compared to control cells (, 10% input), whereas LAMP1, RAB5, and RRAGD levels were increased, and TSC2 protein levels decreased, in starved cells in a TFEB-dependent manner or in cells fed and overexpressing TFEB. Further, confocal microscopy was used to assess whether TFEB overexpression induces the formation of endosomes carrying the active form of AKT by imaging cells expressing the AKT-Pleckstrin-homology-domain (PH)-GFP bioprobe [Citation27] that specifically binds to phosphatidylinositol 3,4,5-trisphosphate (PtdIns[Citation3–Citation5]P3). In baseline conditions, the probe remains cytoplasmic and/or plasma membrane-associated. Overexpression of TFEB-Flag strongly relocates AKT-PH-GFP to endocytic compartments that also colocalize with RAB5 indicating an increase in endosomal PtdIns(3,4,5)P3 levels and increased binding of AKT to these lipids through its PH-domain, which is considered a necessary step in the activation of AKT [Citation28]. To determine endosomal localization of the MTOR-tethering protein RRAGD, cells expressing RAB5Q79L-DsRed were imaged by confocal microscopy. A characteristic morphological feature of these cells is the formation of enlarged endosomes making it possible to localize proteins to the endosomal membranes. We confirmed the localization of RRAGD on endosomal membranes that was further increased upon TFEB-Flag overexpression ()). Together, these data show that TFEB activity potently increased the formation of p-AKT-RRAGD-MTOR-positive endosomes.
Cellular endocytosis and endocytic trafficking are necessary for MTORC1 reactivation during prolonged starvation
During periods of long starvation, reactivation of MTORC1 precedes induction of autophagic lysosome reformation that is necessary for replenishing lysosome quantity and maintaining lysosome homeostasis [Citation29–Citation32]. Previous studies suggested that degradation of autolysosomal content is sufficient to reactivate MTORC1, while recent findings have shown that other factors contribute to MTORC1 reactivation [Citation31,Citation33]. Current models of MTORC1 reactivation during prolonged starvation have not linked endocytic trafficking as an essential step in activating MTORC1 [Citation29–Citation32]. To elucidate the role of endocytosis and retrograde trafficking during MTORC1 reactivation, we assessed MTORC1 activity during amino acid deprivation in cells having perturbed DNM (dynamin) or dynein function (). Withdrawal of amino acids from the medium of normal cells induced a marked and rapid suppression of MTORC1 activity for at least 2 h. This decrease in MTORC1 activity was followed by a restoration of activity 4–6 h after amino acid withdrawal. In contrast to DMSO-treated cells, MTORC1 signaling remained strongly inhibited in cells treated with dynasore (a specific inhibitor of DNM GTPase)- or ciliobrevin A (an inhibitor of the dynein motor protein)-containing medium and subsequently deprived of amino acids for 6 h (compare relative phosphorylated RPS6KB1 [p-RPS6KB1/p-p70S6K] or p-ULK1 protein levels in )). Phosphorylation of RPS6KB1 and ULK1 are well-established markers for MTORC1 activity, thus indicating that MTORC1 signaling remained inhibited in cells pharmacologically blocked from completing endocytosis.
Figure 3. Recovery of MTORC1 activity during prolonged starvation occurs in a TFEB-driven endocytosis-dependent manner. (a) MTORC1 activity was assessed in amino acid (leucine and glutamine)-starved HEK293T cells for the indicated time points. Relative p-RPS6KB1 (p-Thr389) as well as relative p-ULK1 (p-Ser757) levels were assessed by immunoblots indicative of changes in MTORC1 activity. Reactivation of MTORC1 was observed after 6 h of starvation in DMSO-treated control cells but remained suppressed in dynasore- or ciliobrevin A-treated and starved cells. Bar graphs represent a quantitative evaluation of relative p-RPS6KB1 and p-ULK1 protein levels. (b) Faster recovery of MTORC1 signaling was observed in HEK293T cells overexpressing WT DNM2, whereas the overexpression of the dominant negative form of DNM2 efficiently inhibited MTORC1 reactivation during starvation (compare DNM2WT- and DNM2K44A-expressing cells to those expressing an empty vector control). Arrows indicate specific p-RPS6KB1 bands. Bar graphs represent the quantitative analyses of relative p-RPS6KB1 protein levels. (c and d) Depletion of endogenous TFEB inhibits MTORC1 reactivation, whereas overexpression of Flag-TFEB increased basal MTORC1 activity and promoted faster recovery of MTORC1 signaling during prolonged starvation in a DNM-dependent manner. An empty vector control is shown in the first lane and used for comparison to TFEB knockdown or overexpression samples. Bar graphs represent a quantitative evaluation of relative p-RPS6KB1 and p-ULK1 protein levels. Gray bars in (d) show relative p-RPS6KB1 levels adjusted for transfection efficiency of the Flag-TFEB vectors. Data are represented as mean ± SEM, n = 3, ns denotes ‘no significant difference’, *p ≤ 0.05; **p ≤ 0.01; ***p ≤ 0.001; ANOVA.
As an alternative approach to target DNM-mediated endocytosis in MTORC1 reactivation, HEK293T cells were transiently transfected with WT (DNM2 [dynamin 2]) or dominant-negative forms (DNM2K44A) followed by prolonged amino acid deprivation. In control cells, MTORC1 activity was inhibited within 1 h of starvation and recovery of activity was observed after 4 h of amino acid deprivation, whereas cells expressing WT DNM2 did not fully inhibit MTORC1 activity at any of the investigated time points ()). In contrast, cells expressing DNM2K44A showed an overall low MTORC1 activity, and MTORC1 activity was not restored even following prolonged starvation (); see DNM2K44A panel), further linking the importance of endocytic trafficking in MTORC1 signaling.
Since TFEB increased both cellular endocytosis and assembly of the LYNUS complex, we set out to determine whether modulation of TFEB expression would affect recovery of MTORC1 activity during long-term starvation. We utilized central adrenergic tyrosine hydroxylase-expressing-a-differentiated (CAD) cells stably expressing a doxycycline-inducible WT TFEB-Flag. These cells were cultured in nutrient-rich medium with or without doxycycline for 24 h after which MTORC1 activity was assessed by determining phosphorylation levels of MTORC1 substrates, including RPS6KB1. Doxycycline-treated CAD cells showed a 2-fold increase in p-RPS6KB1 protein levels compared to the untreated controls (Figure S2), suggesting that increased levels of TFEB promote upregulation of MTORC1 activity. To validate our observations in CAD cells, we transiently expressed TFEB in HEK293T cells, a commonly used and largely unrelated cell line. Overexpression of TFEB in HEK293T cells likewise promoted basal levels and faster recovery of MTORC1 activity upon amino acid withdrawal, whereas depletion of endogenous TFEB in HEK293T cells inhibited reactivation of MTORC1 ()). Notably TFEB-mediated activation of MTORC1 required functional endocytosis (compare relative p-RPS6KB1 levels in TFEB-overexpressing cells [)] vs TFEB-overexpressing cells treated with dynasore [)]). These data identify a role for endocytosis, and more specifically for TFEB-mediated endocytosis, in MTORC1 reactivation during prolonged starvation.
Endocytic trafficking controls TFEB-induced MTORC1 activity and promotes lysosomal biogenesis
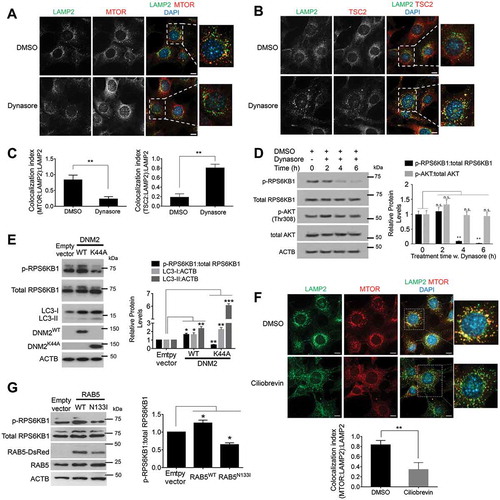
Because the inhibition of endocytic trafficking prevented MTORC1 activity during starvation, we asked if endocytosis and retrograde trafficking generally control MTORC1 signaling under normal nutrient conditions. When cells were cultured in hypertonic sucrose medium to inhibit all forms of cellular endocytosis, MTORC1 dissociated from lysosomes, whereas TSC2 localized to lysosomal membranes (Figure S3(a,b)). Treating cells with dynasore () or ciliobrevin A ()) for 2 or 4 h, respectively, similarly resulted in MTORC1 localization to the cytosol, whereas TSC2 was associated with lysosomes (LAMP2 staining). In addition, phosphorylation of RPS6KB1, a standard readout for MTOR1 activity, was inhibited upon attenuation of endocytosis and vesicular trafficking by culturing in sucrose (Figure S3(c)), treatment with dynasore ()), overexpression of DNM2K44A ()), treatment with ciliobrevin A (, S3(e)), or overexpression of dominant negative RAB5N133I ()) under nutrient-rich conditions. Note that overexpression of WT DNM2 or WT RAB5 increased relative p-RPS6KB1 levels indicating increased MTORC1 activity (. Localization of components of the LYNUS other than MTOR confirmed effective treatment with the used compounds (see Figure S3(d) showing decreased lysosomal localization of the arginine transporter SLC38A9 in dynasore-treated cells, indicating reliance on the endocytic pathway for transport of this protein).
Figure 4. Endocytic trafficking controls MTORC1 tethering and signaling. (a-c) Pharmacological inhibition of DNM GTPase with dynasore under fed conditions disperses MTORC1 into the cytosol while TSC2, the negative regulator of MTORC1, relocalizes to lysosomes. NIH-3T3 fibroblasts were treated with 80 μM of dynasore for 4 h followed by colocalization analyses of MTOR or TSC2 with the lysosomal LAMP2 protein. The bar graph in (c) represents a quantitative evaluation of lysosomal MTORC1 or TSC2 shown in (a and b). Scale bars: 10 μm. (d) Dynasore treatment inhibits MTORC1 activity under fed conditions and has no significant effect on relative p-AKT (Thr308) protein levels. NIH-3T3 fibroblasts were subjected to hydroxyl-dynasore treatment for the indicated time points followed by p-RPS6KB1 immunoblot analyses for MTORC1 activity. Bar graph represents a quantitative analysis of relative protein levels of p-RPS6KB1 and p-AKT (Thr308). (e) Competitive inhibition of DNM2 with a dominant-negative form of DNM2 (DNM2K44A) reduced MTORC1 activity, whereas overexpression of the wild-type form increased MTORC1 signaling in HEK293T cells. An increasing LC3-II level, indicative of autophagy induction and buildup of autophagosomes, were observed in DNM2K44A-overexpressing cells. Bar graph represents the quantitative analyses of relative protein levels of p-RPS6KB1, LC3-I and LC3-II. (f) Pharmacological inhibition of the dynein motor protein, hence retrograde trafficking, with ciliobrevin A dissociates MTOR from lysosomal membranes. NIH-3T3 fibroblasts were treated with 100 μM of ciliobrevin A for 2 h followed by colocalization analyses of MTOR with lysosomal LAMP2 protein. Scale bar: 10 μm. Bar graph represents quantitative analyses of colocalization of MTOR and LAMP2 signals. (g) Competitive inhibition of RAB5 with a dominant-negative form of RAB5N133I reduced MTORC1 activity whereas the wild-type form increased MTORC1 signaling in HEK293T cells. Bar graph represents the quantitative analyses of relative protein levels of p-RPS6KB1. Inhibition of cellular endocytosis with hypertonic sucrose media and pharmacological inhibition of dynein motor proteins also inhibited MTORC1 signaling (see Figure S3). Data are represented as mean ± SEM, n = 3, p ≤ 0.05; **p ≤ 0.01; ***p ≤ 0.001; ANOVA.
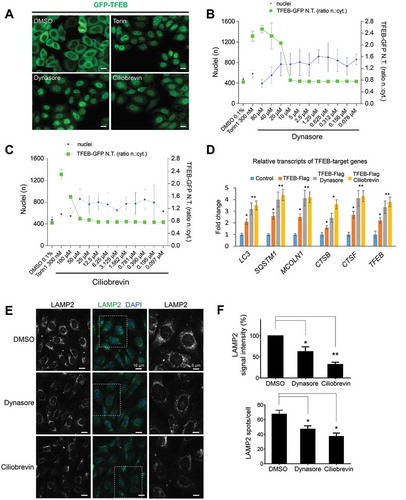
Because attenuation of TFEB-mediated signaling inhibits MTORC1 activity, we assessed cellular localization of TFEB as well as transcription of a number of TFEB target genes. Inhibition of DNM or dynein-mediated endocytic trafficking for up to 1 h resulted in translocation of TFEB-GFP to the nucleus in P8B11-HeLa cells ( and a correlated increase in transcription of TFEB-target genes, including MAP1LC3/LC3, SQSTM1, MCOLN1, CTSB, CTSF, and TFEB ()). In addition, long-term inhibition of endocytic trafficking for 16–24 h efficiently reduced total LAMP2 signal intensity as well as the total number of lysosomes per cell (). Interestingly, whereas inhibition of the endocytic pathway promoted nuclear TFEB translocation and transcription of target genes, these activities alone were insufficient to increase the number of lysosomes in individual cells.
Figure 5. Inhibition of endosomal trafficking translocates TFEB into the nucleus and reduces the quantity of LAMP2-positive vesicles. (a-c) Inhibition of DNM or dynein with dynasore or ciliobrevin A relocalizes TFEB to the nucleus. A plasmid expressing GFP-TFEB was transiently transfected into HeLa cells followed by dynasore (a and b) or ciliobrevin A treatment (A and C) with the indicated concentrations overnight. Nuclear TFEB was assessed by confocal microscopy and quantitatively represented in the graphs in (b and c). Scale bar: 10 μm. (D) Quantitative RT-PCR analyses of ciliobrevin A- and dynasore-treated cells showed increased transcription of TFEB target genes (LC3, SQSTM1, MCOLN1, CTSB, CTSF, and TFEB) after inhibition of endocytosis with dynasore or inhibition of retrograde trafficking with ciliobrevin A. Bar graphs represent fold change in mRNA levels. (e and f) NIH3T3 cells treated with dynasore or ciliobrevin A overnight showed a strong reduction of the intensity of LAMP2-immunoreactivity and number of LAMP2-positive spots per cell, indicative of the number of lysosomes. Right panels are magnifications of outlined areas. Bar graphs represent the quantitative analysis of the LAMP2 signal intensity and an average number of LAMP2 puncta per cell in both conditions. Scale bar: 10 μm. Data are represented as mean ± SEM, n = 3; *p ≤ 0.05; **p ≤ 0.01; ANOVA.
Inhibition of DNM and dynein disrupts endolysosomal acidification and autophagy flux
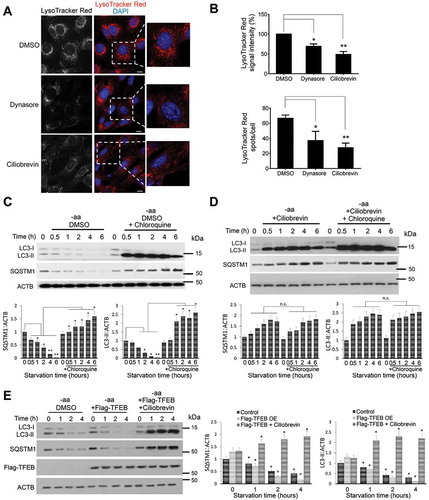
Autophagy flux is characterized by the biogenesis of autophagosomes, their fusion with lysosomes to form autolysosomes, and their subsequent degradation [Citation7,Citation34,Citation35]. Because reactivation of MTORC1 is a critical step preceding lysosomal restoration and autophagy flux, we investigated whether TFEB-mediated endocytosis regulates lysosomal homeostasis, acidification, and autophagy flux. Cells exposed to dynasore or ciliobrevin A were found to contain fewer acidic vesicles () suggestive of possible connections among endocytosis, MTORC1 targeting/activation, and control of autophagic flux. Post-translational modification of LC3-I to LC3-II through phosphatidylethanolamine conjugation to LC3-I and degradation of SQSTM1/p62 are widely accepted markers for detecting autophagy flux in experiments conducted in the presence and absence of lysosomal inhibitors such as chloroquine [Citation34,Citation36,Citation37]. The levels of these autophagy flux markers were examined in cells cultured in an amino acid-free medium containing either DMSO ()) or ciliobrevin A ()). During starvation, in DMSO-treated cells, LC3-II and SQSTM1 levels decreased over time ()), whereas in cells treated with ciliobrevin A, LC3-II and SQSTM1 proteins accumulated over time (compare ; cells expressing DNM2K44A ()) or after treatment with dynasore (data not shown) displayed a similar phenotype. To address the impact of TFEB-mediated endocytosis on autophagy flux, the levels of LC3-II and SQSTM1 in cells overexpressing TFEB-Flag before and after pharmacological inhibition of endocytic trafficking were determined by quantitative immunoblots. TFEB-expressing cells showed a rapid decline of LC3-II and SQSTM1 levels during starvation, whereas inhibition of dynein-mediated trafficking with ciliobrevin A abolished this effect ()). This result provides additional evidence underlining the importance of endocytosis and endocytic trafficking for appropriate TFEB-mediated endolysosomal signaling and autophagy.
Figure 6. Inhibition of endocytic trafficking attenuates number and acidification of endolysosomes to halt autophagy flux. (a and b) Inhibition of endocytic trafficking in fibroblasts, with either dynasore or ciliobrevin A, consequently reduces the number of acidic vesicles indicated by LysoTracker Red fluorescence staining. Scale bar: 10 μm. Bar graphs in (b) represent the quantitative analysis of the LysoTracker Red fluorescence intensity and an average number of puncta per cell in both conditions. (c) Autophagy flux assay of HEK293T cells treated with DMSO and starved of amino acids for the indicated time points. Normal autophagy flux is indicated by the gradual decrease in the levels of LC3-II and SQSTM1 during starvation and their accumulation when the lysosomal function is inhibited by chloroquine. Bar graphs represent a quantitative analysis of the relative SQSTM1 and LC3 protein levels during starvation. (d) Autophagy flux was impaired in cells treated with either dynasore or ciliobrevin A. HEK293T Cells were pre-incubated with dynasore for 4 h or ciliobrevin A for 2 h prior to amino acid starvation for the indicated time points. Compared to controls (c), LC3-II protein levels did not decrease, but rather increased over time indicating an impaired autophagy flux due to lysosomal inhibition. Bar graphs represent a quantitative analysis of the relative SQSTM1 and LC3 protein levels during starvation. (e) Autophagic markers LC3 and SQSTM1 were decreased in cells overexpressing Flag-TFEB in an endocytic trafficking-dependent manner. Inhibition of dynein-dependent trafficking with ciliobrevin A strongly increased LC3-II and SQSTM1 protein levels. Bar graphs represent a quantitative analysis of the relative SQSTM1, LC3 and Flag-TFEB protein levels during starvation. A significant change relative to the control at the time point 0 h is given. Treatment with dynasore or ciliobrevin A did not affect fusion of autophagosomes with lysosomes (Figure S4). Data are represented as mean ± SEM, n = 6; ns denotes no significant difference, *p ≤ 0.05; **p ≤ 0.01; ***p ≤ 0.001; ANOVA.
Discussion
We recently showed that TFEB transcriptional activity is required for MTORC1 signaling [Citation26] and in particular that TFEB induces transcription of RRAGD eventually leading to MTORC1 lysosomal tethering. In this report, we present data that uncovers a novel function of TFEB activity in coordinating endocytic trafficking of essential components of LYNUS to mediate MTORC1 signaling, autophagy flux, and lysosomal biogenesis. TFEB induces expression of a number of core endocytic genes including CAV2, CLTA, EEA1, RAB5, and others, which results in increased endocytic rates under baseline and amino acid starvation conditions (, Tables S1-S3). TFEB-induced endocytosis is required for proper assembly of the MTORC1-tethering complex on RAB5- and LAMP1-positive organelles containing RRAGD, MTOR, and p-AKT while lacking the MTOR inhibitor TSC2 (). Further we document that TFEB-induced endocytosis promotes activation of MTORC1 as well as trafficking of proteins required for tethering, including RRAGD and active p-AKT, that are required to phosphorylate and inactivate TSC2 ().
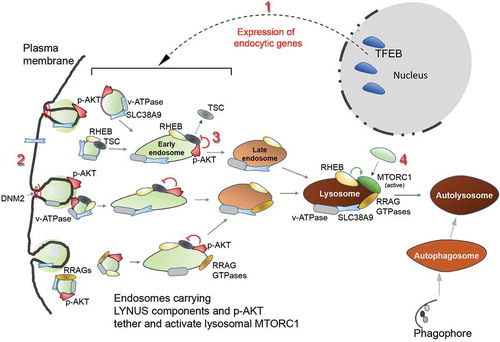
TFEB-mediated endocytosis is critical for assembly and activation of MTORC1 during both long-term starvation () and normal nutrient conditions (). Previous studies showed that MTORC1 activation is associated with anterograde shuttling of lysosomes to the periphery where plasma membrane-bound activators, including activated growth factor receptors, interact and activate MTORC1 [Citation38]. Other studies suggested that autophagic flux is sufficient to reactivate MTORC1, while recent findings have shown that other factors contribute to MTORC1 reactivation [Citation30,Citation31,Citation33]. Our study extends the current models with the demonstration that TFEB promotes endocytic trafficking of MTORC1 activators to the lysosome () in an autophagy-independent manner [Citation26]. Re-activation of MTORC1 during long periods of starvation is required for the induction of autophagic lysosome reformation and therefore lysosomal homeostasis [Citation29–Citation32]. We find that TFEB-triggered endocytosis is required for re-activation of MTORC1 and autophagy. Inhibition of endocytosis for up to 6 h with 80 µm dynasore or 50 µm ciliobrevin A did not affect fusion of autophagosomes with lysosomes during starvation (Figure S4) indicating that starvation-induced endocytosis is required for autophagic flux by maintaining lysosomal function rather than negatively affecting vesicle fusion. In addition to extending knowledge on TFEB functionality and MTORC1 activation, our data provide a framework for understanding the integration of multiple events and signaling pathways, from the nucleus to the periphery, driving lysosomal reformation and autophagic flux. Briefly, starvation-induced inhibition of MTORC1 promotes nuclear TFEB signaling leading to the formation of endosomes with attached RRAGD and tethering MTORC1. p-AKT phosphorylates and releases TSC2 from endolysosomes, consequently activating MTORC1 during prolonged amino acid starvation (). Thus, TFEB functions as a coordinator of cellular endocytosis driving assembly of LYNUS machinery that tethers and reactivates MTORC1 during starvation to promote autophagy.
Figure 7. TFEB-mediated endocytosis activates MTORC1 by coordinating the sorting of LYNUS components on endosomal membranes. Starvation-induced inhibition of MTORC1 promotes nuclear TFEB activity (1) that triggers expression of endocytic genes driving random formation of endosomes that shuttle LYNUS components including active p-AKT and RRAG GTPases (2), en route to lysosomes to inhibit TSC2 (via AKT-mediated phosphorylation that targets TSC2) (3), tether MTORC1 (4) and eventually promote autophagy flux.
Materials and methods
Materials
The following primary antibodies were used for immunoblotting and immunostaining: RAB5 (Cell Signaling Technology, C8B1), EEA1 (Sigma-Aldrich, N19), CLTA/B (ThermoFisher, 3F133), CAV2 (BD Transduction, 610,059), SLC38A9 (Sigma-Aldrich, HPA043785), MTOR (Cell Signaling Technology, 2983), TSC2 (Cell Signaling Technology, 4308), phospho-RPS6KB1 (Thr389; Cell Signaling Technology, 9205), RPS6KB1/p70S6K (Cell Signaling Technology, 2708), phospho-ULK1 (Ser757; Cell Signaling Technology, 14,202), ULK1 (Cell Signaling Technology, 8054), mouse LAMP2 (Developmental Studies Hybridoma Bank [DSHB], ABL-93), LAMP1 (Cell Signaling Technology, 9091), human LAMP2 (DSHB, H4B4), LC3A/B (Cell Signaling Technology, 4108), SQSTM1 (Abcam, ab56416), mCherry (BioVision, 5993–100), HA (Sigma-Aldrich, H9658), Flag (Sigma-Aldrich, F3165), phospho-AKT (Thr308; Cell Signaling Technology, 2965), pan-AKT (Cell Signaling Technology, 4691), ACTB/β-Actin (DSHB, JLA20). Secondary antibodies coupled to either infrared dyes (IRDye 680 and IRDye 800, LICOR, 926–68,072 and 926–32,213, respectively), or to HRP (Jackson Immunoresearch, 711–035-152, 705–035-147, 715–035-151) were used for immunoblotting analysis, and those coupled to fluorochromes (Jackson Immunoresearch, 711–165-152, 715–175-151) were used for immunostaining. Amino acids were reconstituted in water or 1 M hydrochloric acid followed by a neutralization with sodium hydroxide. Stock solutions were diluted in respective culture media to obtain the stated amino acid concentrations. All amino acid starvation experiments were carried out as previously described [Citation11]. RPMI medium without leucine and L-glutamine was supplied by United States Biological (R899912). The amino acid L-leucine was supplied by Sigma-Aldrich (L800). Other materials used for cell culture and culture treatments include HBSS 10X (Life Technologies, 14,065–056), hydroxyl-dynasore (Sigma-Aldrich, SML0340), ciliobrevin A (Sigma-Aldrich, 4529), Dulbecco’s modified Eagle’s medium (Sigma-Aldrich, D5671), fetal bovine serum (FBS; Life Technologies, 10,438), dialyzed FBS (dFBS; Life Technologies, 26,400,044), chloroquine (Sigma-Aldrich, C6628), Torin 1 (Tocris, 4247), and BioT transfection reagent (Bioland Scientific, B01-00).
Cell culture
CAD cells are a variant of a central nervous system-derived catecholaminergic cell line established from a neuroblastoma in a transgenic mouse harboring WT SV40 T antigen [Citation39]. CAD cells lack the immortalizing oncogene and have been used in our laboratory to stably express TFEB-Flag as described previously by Khayati et al. [Citation12]. HeLa, NIH-3T3 fibroblasts and HEK293T cells (ATCC, CCL-2, CRL-1658, and CRL-3216, respectively) were cultured in Dulbecco’s modified Eagle’s medium (DMEM) supplemented with 10% FBS and glutamine.
Amino acid-deprivation assay
Cells were first plated and allowed to stabilize in RPMI 1640 containing 10% dFBS along with both leucine and glutamine. For leucine and glutamine deprivation, the media was replaced with 10% dFBS in RPMI1640 without leucine and glutamine for the indicated time points. For dynasore and ciliobrevin A drug treatments, cells were first plated and allowed to stabilize in complete RPMI medium containing 10% dFBS and leucine/glutamine. These cells were pre-incubated with the indicated concentrations of dynasore and ciliobrevin A for 2 h in complete RPMI medium before starting the leucine and glutamine deprivation experiments for the indicated time points. For dynasore and ciliobrevin A treatments under conditions of leucine and glutamine deprivation, stabilized cells were incubated with the indicated concentrations of DMSO and ciliobrevin A in leucine- and glutamine-free RPMI medium containing 10% dFBS for the indicated time points. For DNM2 plasmid transfections and leucine and glutamine deprivation, cells were first transfected with the indicated plasmids before incubating them in leucine- and glutamine-free RPMI medium containing 10% dFBS for the indicated time points.
Plasmid DNA and transfections
WT DNM2-mCherry was a gift from Christien Merrifield (Addgene, 27,689), dominant negative DNM2K44A-GFP was a gift from Pietro De Camilli (Addgene, 22,301). pcDNA3-AKT-PH-GFP was a gift from Craig Montell (Addgene, 18,836). WT TFEB-Flag was cloned in our laboratory by amplifying human TFEB cDNA with the following PCR primers: TFEB_for: GAA TTC GCC ACC ATG GCG TCA CGC ATA GGG T and TFEB-Flag_rev: TCT AGA TCA CTT GTC ATC GTC GTC CTT GTA GTC CAG CAC ATC GCC CTC CTC. The TFEB-Flag amplicon was cloned into the pCS2+ vector backbone (a gift from Dr. D. Turner [Citation40],) using EcoRI and XbaI restriction sites. TFEBS211A-Flag point mutation was generated using the QuikChange Lightning Site-Directed Mutagenesis Kit, following the manufacturer’s instructions (Agilent Technologies, 210,518). All constructs were transfected using the BioT plasmid transfection protocol (Bioland Scientific, B01-00). For knockdown experiments, the following siRNA reagents were used: ONTARGET plus SMARTpool siRNA for CLTB (M-004003–00), siRNA for TFEB (D-009798–03), and control (scrambled) siRNA were purchased from GE Dharmacon. siRNAs were transfected as described using the BioT reagent protocol (Bioland Scientific, B01-00), and the knockdown efficiency of gene expression was validated by immunoblot.
Microarray analysis
Total RNA was extracted from HeLa cells stably expressing TFEB-GFP and WT HeLa cells grown under normal fed conditions. Whole gene RNA transcriptome profiling was performed using Affymetrix GeneChip Hybridization. Affymetrix Probe Set IDs are reported for genes identified in Table S3.
Immunostaining
Cells grown on FN1 (fibronectin 1; Sigma-Aldrich, F1141)-coated coverslips were rinsed in phosphate-buffered saline (PBS; Sigma-Aldrich, D5652) once and fixed in 4% paraformaldehyde at 37⁰C for 10 min and for 5 min at room temperature. Cultures were rinsed in PBS and blocked in 5% normal goat serum (Rockland, D204-00–0100), 0.5% BSA (Amresco, 0332), and 0.5% Triton X-100 (Sigma-Aldrich, T9284) in PBS for 45 min at room temperature. Primary antibody working solutions were made in blocking buffer and incubated overnight at 4⁰C. Cultures were rinsed in PBS and placed in secondary antibodies for 45 min. The specimens were rinsed and mounted. Confocal images were obtained using a Cell Observer spinning disk confocal microscope (Zeiss, Thornwood, NY).
SDS-PAGE and immunoblot analysis
Cell lysates were prepared with lysis buffer (10% glycerol [Columbus Chemical, 243,500], 1% NP-40 [Sigma-Aldrich, 74,385], 20 mM Tris, pH 7.4, 2.5 mM EDTA, pH 8, 2.5 mM EGTA, pH 8, including protease inhibitor cocktail [Roche, 04693116001]). Lysates were spun down at 17,000 rpm for 15 min at 4°C. The cleared supernatant was collected, and protein concentration assayed using the BCA method and run on 10–12% SDS-PAGE gels. The protein was transferred onto PVDF (Immobilon; Millipore, IPFL00010) membranes. The membranes were blocked in 5% milk, 0.1% Triton X-100 in TBS (Bioland Scientific, TBS01-02) for 1 h. After incubation with primary antibodies (overnight) and secondary antibodies (45 min), the membranes were washed and analyzed using either the LI-COR Odyssey system or developed with ECL (Pierce, 32,106).
Dextran-TMR uptake assay and LysoTracker staining
Cells were first plated in 24-well plates and allowed to stabilize in a complete DMEM medium containing 10% FBS, penicillin-streptomycin and supplemented with L-glutamine. These cells were pre-incubated with the indicated drugs for 2 h before addition of dextran-tetramethylrhodamine (dextran-TMR; Life Technologies, D1816) or EGF-rhodamine (ThermoFisher, E3481) for 2–4 h at 37⁰C, 5% CO2. Cells were either fixed and prepared for confocal microscopy analyses, or trypsinized with 0.05% trypsin-EDTA (Life Technologies, 25,300,062), spun down (200 x g, 5 min), and resuspended in PBS, pH 7.4. Resuspended cells were counted, transferred into a 96-well plate and analyzed using a Promega GloMax plate reader to measure signal intensity of internalized dextran-TMR. For LysoTracker staining, cells on coverslips were treated with dynasore or ciliobrevin A for up to 6 h and subsequently incubated in pre-warmed medium containing diluted LysoTracker Red DND-99 reagent (1:1000; ThermoFisher, L7528) at 37°C and 5% CO2 for 10 min. Cells were washed twice with PBS and fixed with 4% paraformaldehyde in PBS for 15 min at room temperature. Coverslips containing fixed and stained cells were mounted and used in confocal microscopy as described above. Signal intensity per field of view was assessed using ImageJ, as described below. For further verification, LysoTracker Red-positive spots per cell were manually counted.
Quantitative assessment of microscopy data
For assessment of TFEB localization, nuclear or cytoplasmic localization of TFEB-GFP in stably expressing HeLa cells was assessed using the OPERA system (Perkin Elmer). TFEB-GFP-expressing cells were grown on plates that were treated with the indicated compounds overnight and monitored using a 20x water immersion objective. The OPERA system acquires >6 fields/well using 2 exposures (laser 405 nm for Hoechst and laser 488 nm for TFEB-GFP) and blindly assesses for nuclear vs cytoplasmic localization expressed as a ratio of an average nuclear GFP intensity and the average cytosol GFP intensity in cells.
Colocalization index of 2 fluorescent signals to each other, such as immunolabeled RAB5 with AKT-PH-GFP, was determined by taking the measured intensity of AKT-PH-GFP fluorescence divided by RAB5 signal intensity relative to total RAB5 intensity per imaged cell using ImageJ software as previously described [Citation11,Citation12]. Analyses of colocalization were further validated using Coloc 2 plugin of ImageJ that performs pixel intensity correlation using the Manders’ colocalization coefficient, in which a value of 1 represents a complete overlap of both signals, whereas a value of 0 represents no overlap. The colocalization of other proteins to each other was determined in the same way.
Cell fractionation
Endosomal cell fractionation was carried out using synthetic OptiPrep (iodixanol; Sigma-Aldrich, D1556) density gradient ultracentrifugation for separation of organelles, a method preferred over sucrose density gradient centrifugation because of its iso-osmotic properties [Citation41,Citation42]; the method was carried out following the manufacturer’s instructions. Cells were seeded in 6-well plates with a doxycycline (Sigma-Aldrich, D9891)-containing nutrient-rich medium for 24 h. Cells were harvested in 1x TNE buffer (50 mM Tris-HCl, pH 7.4, 100 mM NaCl, 0.1 mM EDTA without protease inhibitors) and spun down at 400 g for 5 min. The cell pellet was collected and spun in 300 μl of 1X TNE buffer containing protease and phosphatase inhibitors (Thermo Fisher, A32961) and sheared by pipetting through a 25-G needle (40 strokes); 200 μl of the cell suspension was transferred into a fresh microcentrifuge tube containing 200 μl of 1X TNE buffer (containing protease and phosphatase inhibitors and 2% Triton X-100) followed by a 30-min incubation in 4°C with gentle agitation. An aliquot (30 μl) of the sheared cell suspension was transferred to a new tube and used as 10% input. After incubation, the 400 μl of sheared cell suspension was mixed with 700 μl of 60% OptiPrep solution and gently pipetted to the bottom of a 3.5-ml centrifuge tube and layered with 600 μl of 40%, 30%, 20%, and 15% OptiPrep solutions prepared with 1X TNE buffer containing protease and phosphatase inhibitors to produce OptiPrep gradients. The prepared samples were spun at 55,000 g for 4 h at 4°C using a Sorvall ultracentrifuge and SW 55 Ti rotor. A total of 17 fractions (200 μl each) were collected and used in immunoblot analyses.
Quantitative PCR analyses
For RNA isolation, CAD cells were plated at 75% confluency and grown overnight with or without doxycycline to induce expression of TFEB-Flag. DMSO, dynasore, or ciliobrevin A were added to the cells the following morning for up to 6 h prior to lysis and preparation of total RNA using TRIZOL (Life Technologies, 15596018), chloroform and absolute ethanol for precipitation. Total RNA (2 µg) were used for cDNA synthesis (SuperScript IV First-Strand Synthesis System; ThermoFisher, 18091050), and cDNA was diluted 10-fold and used for qPCR analyses using SYBRgreen (ThermoFisher, 4344463) and the Roche Lightcycler 480. The following primer sequences (PGA-PrimerBank) were used for the presented analyses: LC3_for: CGC TTG CAG CTC AAT GCT AAC, LC3_rev: CTC GTA CAC TTC GGA GAT GGG; SQSTM1_for GAA CTC GCT ATA AGT GCA GTG T, SQSTM1_rev: AGA GAA GCT ATC AGA GAG GTG G;
TFEB_for: GCA GCC ACC TGA ACG TGT A; TFEB_rev: TGT TAG CTC TCG CTT CTG AGT; MCOLN1_for: GCG CCT ATG ACA CCA TCA A; MCOLN1_rev: TAT CCT GGA CTG CTC GAT;
CTSF_for: ACG CCT ATG CAG CCA TAA AG; CTSF_rev: CTT TTG CCA TCT GTG CTG AG; CTSB_for TTA GCG CTC TCA CTT CCA CTA cc; CTSB_rev: TGC TTG CTA CCT TCC TCT GGT TA;
ACTB_for: TTG CTG ACA GGA TGC ACG AAG, ACTB_rev: CCA CCG ATC CAC ACA GAG TA.
Statistics
The results are represented as the mean ± SEM. Statistical analyses were performed with Microsoft Excel using the two-tailed Student’s t-test or ANOVA as appropriate. Significant differences of means are indicated as * ≤ 0.05, ** ≤ 0.01, and *** ≤ 0.005.
Supplemental Material
Download Zip (11.9 MB)Acknowledgments
We thank Craig Montell for the AKT-PH-GFP (Addgene, 18836), Christien Merrifield for DNM2-mCherry (Addgene, 27689), Pietro De Camilli for DNM2K44A-GFP (Addgene, 22301), Richard Pagano for DsRed-Rab5N133I (Addgene, 13051), and the members of our laboratory for their helpful comments. This work was supported by the National Institutes of Health under Grant R25GM096161 to I.C.N.; Alzheimer Association under Grant NIRG-305325 to R.D.; and American Federation for Aging Research under Grant RAG13447 to R.D.
Disclosure statement
No potential conflict of interest was reported by the authors.
Supplementary Material
Supplemental data for this article can be accessed here.
Additional information
Funding
Related Research Data
References
- Laplante M, Sabatini DM. MTOR signaling in growth control and disease. Cell. 2012;149:274–293. PMID: 22500797.
- Nnah IC, Khayati K, Dobrowolski R. Cellular metabolism and lysosomal mTOR signaling. Cell Death Ther. 2015;1:11–22.
- Betz C, Hall MN. Where is mTOR and what is it doing there? J Cell Biol. 2013;203:563–574. PMID: 24385483.
- Dibble CC, Manning BD. Signal integration by mTORC1 coordinates nutrient input with biosynthetic output. Nat Cell Biol. 2013;15:555–564. PMID: 23728461.
- Peña-Llopis S, Vega-Rubin-de-Celis S, Schwartz JC, et al. Regulation of TFEB and V-ATPases by mTORC1. EMBO J. 2011;30:3242–3258. PMID: 21804531.
- Palmieri M, Impey S, Kang H, et al. Characterization of the CLEAR network reveals an integrated control of cellular clearance pathways. Hum Mol Genet. 2011;20:3852–3866. PMID: 21752829.
- Sardiello M. Transcription factor EB: from master coordinator of lysosomal pathways to candidate therapeutic target in degenerative storage diseases. Ann N Y Acad Sci. 2016;1371:3–14. PMID: 27299292.
- Luzio JP, Hackmann Y, Dieckmann NMG, et al. The biogenesis of lysosomes and lysosome-related organelles. Cold Spring Harb Perspect Biol. 2014;6:a016840. PMID: 25183830.
- Napolitano G, Ballabio A. TFEB at a glance. J Cell Sci. 2016;129:2475–2481. PMID: 27252382.
- Sardiello M, Palmieri M, di Ronza A, et al. A gene network regulating lysosomal biogenesis and function. Science. 2009;325:473–477. PMID: 19556463.
- Reddy K, Cusack CL, Nnah IC, et al. Dysregulation of nutrient sensing and CLEARance in presenilin deficiency. Cell Rep. 2016;14:2166–2179. PMID: 26923592.
- Khayati K, Antikainen H, Bonder EM, et al. The amino acid metabolite homocysteine activates mTORC1 to inhibit autophagy and form abnormal proteins in human neurons and mice. FASEB J. 2017;2:598–609. PMID: 28148781.
- Komatsu M, Waguri S, Chiba T, et al. Loss of autophagy in the central nervous system causes neurodegeneration in mice. Nature. 2006;441:880–884. PMID: 16625205.
- Lipinski MM, Zheng B, Lu T, et al. Genome-wide analysis reveals mechanisms modulating autophagy in normal brain aging and in Alzheimer’s disease. Proc Natl Acad Sci U S A. 2010;107:14164–14169. PMID: 20660724.
- Nixon R. The role of autophagy in neurodegenerative disease. Nat Med. 2013;19:983–997. PMID: 23921753.
- Dobrowolski R, De Robertis EM. Endocytic control of growth factor signalling: multivesicular bodies as signalling organelles. Nat Rev Mol Cell Biol. 2012;13:53–60. PMID: 22108513.
- Sorkin A, von Zastrow M. Endocytosis and signalling: intertwining molecular networks. Nat Rev Mol Cell Biol. 2009;10:609–622. PMID: 19696798.
- Taelman VF, Dobrowolski R, Plouhinec JL, et al. Wnt signaling requires sequestration of glycogen synthase kinase 3 inside multivesicular endosomes. Cell. 2010;143:1136–1148. PMID: 21183076.
- Platta HW, Stenmark H. Endocytosis and signaling. Curr Opin Cell Biol. 2011;23:393–403. PMID: 21474295.
- Blitzer JT, Nusse R. A critical role for endocytosis in Wnt signaling. BMC Cell Biol. 2006;7:28. PMID: 16824228.
- Tsukazaki T, Chiang TA, Davison AF, et al. SARA, a FYVE domain protein that recruits Smad2 to the TGFbeta receptor. Cell. 1998;95:779–791. PMID: 9865696.
- Grimes ML, Zhou J, Beattie EC, et al. Endocytosis of activated TrkA: evidence that nerve growth factor induces formation of signaling endosomes. J Neurosci. 1996;16:7950–7964. PMID: 8987823.
- Settembre C, Fraldi A, Medina DL, et al. Signals from the lysosome: a control centre for cellular clearance and energy metabolism. Nat Rev Mol Cell Biol. 2013;14:283–296. PMID: 23609508.
- Medina DL, Fraldi A, Bouche V, et al. Transcriptional activation of lysosomal exocytosis promotes cellular clearance. Dev Cell. 2011;21:421–430. PMID: 21889421.
- Settembre C, Di Malta C, Polito VA, et al. TFEB links autophagy to lysosomal biogenesis. Science. 2011;332:1429–1433. PMID: 21617040.
- Di Malta C, Siciliano D, Calcagni A, et al. Transcriptional regulation of RagD GTPase controls mTORC1 activity. Science. 2017;356:1188–1192. PMID: 28619945.
- Kwon Y, Hofmann T, Montell C. Integration of Phosphoinositide- and Calmodulin-mediated regulation of TRPC6. Mol Cell. 2007;25:491–503. PMID: 17317623.
- Ebner M, Lučić I, Leonard TA, et al. PI(3,4,5)P3 engagement restricts Akt activity to cellular membranes. Mol Cell. 2017;65:416–431.e6. PMID: 28157504.
- Chen Y, Yu L. Autophagic lysosome reformation. Exp Cell Res. 2013;319:142–146. PMID: 22999865.
- Rong Y, Liu M, Ma L, et al. Clathrin and phosphatidylinositol-4,5-bisphosphate regulate autophagic lysosome reformation. Nat Cell Biol. 2012;14:924–934. PMID: 22885770.
- Yu L, McPhee CK, Zheng L, et al. Termination of autophagy and reformation of lysosomes regulated by mTOR. Nature. 2010;465:942–946. PMID: 20526321.
- Zhang J, Zhou W, Lin J, et al. Autophagic lysosomal reformation depends on mTOR reactivation in H2O2-induced autophagy. Int J Biochem Cell Biol. 2016;70:76–81. PMID: 26589722.
- Rong Y, McPhee CK, Deng S, et al. Spinster is required for autophagic lysosome reformation and mTOR reactivation following starvation. Proc Natl Acad Sci U S A. 2011;108:7826–7831. PMID: 21518918.
- Hamasaki M, Furuta N, Matsuda A, et al. Autophagosomes form at ER-mitochondria contact sites. Nature. 2013;495:389–393. PMID: 23455425.
- Jiang P, Mizushima N. Autophagy and human diseases. Cell Res. 2014;24:69–79. PMID: 24323045.
- Yang Z, Klionsky DJ. Mammalian autophagy: core molecular machinery and signaling regulation. Curr Opin Cell Biol. 2010;22:124–131. PMID: 20034776.
- Kroemer G, Mariño G, Levine B. Autophagy and the integrated stress response. Mol Cell. 2010;40:280–293. PMID: 20965422.
- Korolchuk VI, Saiki S, Lichtenberg M, et al. Lysosomal positioning coordinates cellular nutrient responses. Nat Cell Biol. 2011;13:453–460. PMID: 21394080.
- Suri C, Fung BP, Tischler AS, et al. Catecholaminergic cell lines from the brain and adrenal glands of tyrosine hydroxylase-SV40 T antigen transgenic mice. J Neurosci. 1993;13:1280–1291. PMID: 7680068.
- Turner DL, Weintraub H. Expression of achaete-scute homolog 3 in Xenopus embryos converts ectodermal cells to a neural fate. Genes Dev. 1994;12:1434–1447. PMID: 7926743.
- Li X, Donowitz M. Fractionation of subcellular membrane vesicles of epithelial and nonepithelial cells by OptiPrepTM density gradient ultracentrifugation. In: Ivanov AI, editor. Exocytosis and endocytosis. Vol. 440, methods in molecular biology. Clifton (NJ): Humana Press; 2008. p. 97–110. PMID: 18369940.
- Uematsu M, Nishimura T, Sakamaki Y, et al. Accumulation of undegraded autophagosomes by expression of dominant-negative STX17 (syntaxin 17) mutants. Autophagy. 2017;13:1452–1464. PMID: 28598244.