
ABSTRACT
Phagocytosis and macroautophagy/autophagy are 2 processes involved in lysosome-mediated clearance of extracellular and intracellular components, respectively. Recent studies have identified the recruitment of the autophagic protein LC3 during phagocytosis of apoptotic corpses in what is now called LC3-associated phagocytosis (LAP). LAP is a distinct process from autophagy but it relies on some members of the autophagy pathway to allow efficient degradation of the phagocytosed cargo. We investigated whether both LC3/LGG-2 and GABARAP/LGG-1 are involved in phagocytosis of apoptotic corpses during embryonic development of Caenorhabditis elegans. We discovered that both LGG-1 and LGG-2 are involved in the correct elimination of apoptotic corpses, but that they have different functions. lgg-1 and lgg-2 mutants present a delay in phagocytosis of apoptotic cells but genetic analyses indicate that LGG-1 and LGG-2 act upstream and downstream of the engulfment pathways, respectively. Moreover, LGG-1 and LGG-2 display different cellular localizations with enrichment in apoptotic corpses and phagocytic cells, respectively. For both LGG-1 and LGG-2, subcellular localization is vesicular and dependent on UNC-51/ULK1, BEC-1/BECN1 and the lipidation machinery, indicating that their functions during phagocytosis of apoptotic corpses mainly rely on autophagy. Finally, we show that LGG-1 is involved in the exposure of the ‘eat-me signal’ phosphatidylserine at the surface of the apoptotic cell to allow its recognition by the phagocytic cell, whereas LGG-2 is involved in later steps of phagocytosis to allow efficient cell corpse clearance by mediating the maturation/degradation of the phagosome.
Introduction
Apoptosis is an essential process involved in the elimination of excessive or damaged cells during tissue remodeling and homeostasis. Cells undergoing apoptosis are efficiently recognized and eliminated through a process called phagocytosis, which is performed by professional and/or nonprofessional cells. Phagocytosis is a dynamic multistep process, starting with the recognition of ‘eat-me’ signals exposed on the surface of apoptotic cells by specific cell-surface receptors leading to the internalization of apoptotic cells by phagocytic cells. The engulfing vesicle containing apoptotic cells, also called a phagosome, undergoes a maturation process, which results in the degradation of the dead cells. Efficient phagocytosis avoids the release of harmful contents in the surrounding area preventing tissue injury, inflammation and autoimmune diseases [Citation1].
Recent studies have shown that autophagy, an intracellular degradation process, is involved in optimal clearance of apoptotic cells. In phagocytic cells, it has been shown that the autophagic protein LC3 rapidly decorates the phagosome formed upon engulfment of an apoptotic cell, facilitating the degradation of the internalized cell. This process termed LC3-associated phagocytosis (LAP) also occurs during phagocytosis of entotic cells and pathogens and modulates the immune response [Citation2–Citation4]. LAP shares common components with classical autophagy such as the class III phosphatidylinositol 3-kinase (PtdIns3K) complex and elements of the ubiquitin-like conjugation system (ATG5, ATG7) [Citation3–Citation5]. Despite some similarities, LAP is a distinct process from classical autophagy because it does not rely on the autophagy preinitiation complex ULK, and seems to require the production of reactive oxygen species via NADPH oxidase [Citation2,Citation6,Citation7]. LAP is also mechanistically different from classical autophagy, since for the former, LC3 is not associated to a double-membrane autophagosome, but recruited and lipidated to a single membrane phagosome [Citation7]. However, LC3 double-membrane-positive vesicles were sometimes observed to localize around and fuse with the phagosome during phagocytosis of apoptotic cells and the pathogens C. neoformans and M. marinum [Citation8,Citation9]. These observations suggest that LC3 could also be recruited by sequential fusion of autophagosomes with the phagosome arguing for a more complex scenario in which LAP and autophagy can be co-opted for efficient degradation of the internalized cargo. Therefore, the respective contribution of these processes in the degradation of internalized cargo is not well understood and could depend on the types of phagocytic cells.
LAP was identified by analyzing LC3 localization [Citation3], but nothing is known about the role of other mammalian orthologs of yeast Atg8 during LAP. The mammalian Atg8 ortholog family is composed of at least 7 members grouped in 2 subfamilies, LC3 and GABARAP, based on evolutionary considerations. LC3 and GABARAP proteins are involved in various intracellular processes [Citation10] and present specificities for cargo recognition [Citation11,Citation12]. To address the genetic and molecular functions of each of the 2 subfamilies, LC3 and GABARAP during phagocytosis of apoptotic cells, we used C. elegans, which possesses only one ortholog for each family, LGG-1/GABARAP and LGG-2/LC3 [Citation13]. Recent studies have shown that, in C. elegans, autophagy proteins are involved in apoptotic cell degradation during embryonic and post-embryonic development [Citation14–Citation16]. Based on localization analysis, LGG-1 has been hypothesized to play a role during phagocytosis of apoptotic cells in embryos and larvae [Citation2,Citation16]. However, the specific functions of LGG-1 and LGG-2 have not been characterized. Here, we show that LGG-1 is required in apoptotic cells for the surface exposure of phosphatidylserine, while LGG-2 is involved, in the phagocytic cell, in the fusion between phagosome and lysosome to promote the degradation of engulfed apoptotic cells. Our data thus reveal 2 distinct roles of autophagy, in apoptotic versus phagocytic cells, to allow the engulfment and degradation of apoptotic cells during embryogenesis.
Results
LGG-1 is enriched in apoptotic corpses and LGG-2 in phagocytic cells
In a previous study, concerning the characterization of the specific roles of LGG-1 and LGG-2 upon fertilization in the early C. elegans embryo [Citation13], we also have observed that the 2 proteins are expressed in apoptotic cells during late embryogenesis, which prompted us to further investigate their localization during cell death. In C. elegans, a large number of somatic cells die during embryonic development and these apoptotic cells are easily identified in living animals as highly refractive discs (hereafter called ACs, for Apoptotic Corpses) using differential interference contrast (DIC) microscopy [Citation17,Citation18].
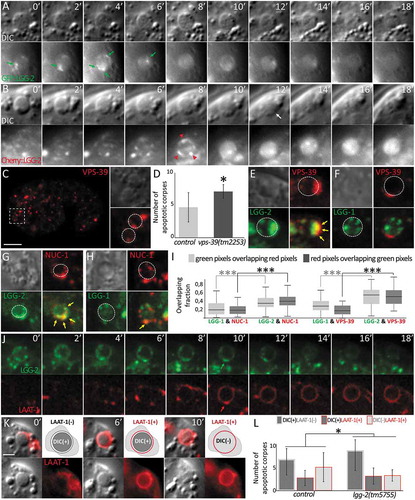
We first analyzed the localization of endogenous LGG-1 and LGG-2 proteins using specific antibodies and identified the membrane of the engulfing phagosome with a CED-1::GFP fusion protein (, the membrane of the AC with CED-8::GFP () and the nucleus of the AC with a GFP expression driven by the egl-1 promoter (Fig. S1A). Both LGG-1 and LGG-2 were detected in puncta present at ACs but they displayed different localization patterns (). In particular, LGG-2 appeared to be enriched at the phagosomal membrane rather than inside the ACs ()). However, because immunofluorescence, necessitating the use of fixed tissues, is incompatible with DIC analysis for scoring of ACs, we then analyzed functional GFP::LGG-1 and GFP::LGG-2 proteins in living embryos (–i) and S1B) [Citation13]. Using Plgg-1::GFP::LGG-1 and Plgg-2::GFP::LGG-2 transgenic strains, we confirmed that both LGG-1 and LGG-2 localize at embryonic ACs. LGG-1 and LGG-2 labeled 58% (n = 100) and 53% (n = 208) of ACs, respectively, but they presented different localization patterns. Indeed, GFP::LGG-1 localization was mostly detected in puncta inside AC () quantification in I), which was confirmed using mCherry::LGG-1 () and S1B). Conversely, although GFP::LGG-2 also formed puncta inside ACs, this protein was mainly present at the periphery of ACs forming a discontinuous ring () quantifications in I).
Figure 1. lgg-1 localizes in puncta inside asc while lgg-2 forms a peripheral discontinuous ring. (a) Schematic representation of phagocytic and apoptotic cells. Pced-8::CED-8::GFP fluorescence labels the plasma membrane of apoptotic cells and Pced-1::CED-1::GFP fluorescence decorates the phagosomal membrane within the phagocytic cell. (b to e) Confocal images of immunofluorescence staining of endogenous lgg-1 (b and d) or lgg-2 (c and e) in embryos expressing an apoptotic membrane GFP (CED-8) or the phagosomal protein CED-1::GFP. White arrows point to puncta present at asc. Insets are 6-fold magnifications of asc. lgg-1 puncta are mainly present inside asc and lgg-2 puncta are generally localized around phagosome. (f and g) Confocal images of live embryos expressing Plgg-1::GFP::lgg-1 (Fi and Fii) or Plgg-2::GFP::lgg-2 (Gi and Gii). Grayscale images are the corresponding DIC acquisitions. Insets (Fiii and Giii) are 3-fold magnifications of lgg-1- or lgg-2-positive asc and correspond to DIC, fluorescent and merge images. The dotted circles on fluorescence images show the outer limit of asc as determined by DIC. In the majority of cases, GFP::lgg-1 localizes in puncta (arrows) inside asc. GFP::lgg-2 is generally detected as a discontinuous ring around asc (53.2%). (h) Confocal images of Plgg-1::mCherry::lgg-1 forming puncta within asc. Pced-1::GFP::lifeact labels the actin-enriched halo formed during engulfment of asc. Insets are 3-fold magnifications. White arrows show puncta present in asc. (i) Quantitative analysis of the localization of GFP::lgg-1, GFP::lgg-2 at AC in control, ced-1(e1735) and ced-1(e1735) ced-5(RNAi) (n > 48) (white, black and gray boxes represent the percentages of dotted, peripheral ring and other patterns, respectively). Chi-squared test analysis *** P value < 0.0001. (j and k) Confocal and DIC images of Plgg-1::GFP::lgg-1 (J) and Plgg-2::GFP::lgg-2 (k) expressed in ced-1(e1735) embryos. Insets show an extruded AC, which outer limit (determined by DIC) is indicated by the dotted circle. Extruded cell corpses do not present GFP::lgg-2 peripheral rings but only internal puncta. (l and m) AC-driven expression using Pegl-1::GFP::lgg-1 (l) and Pegl-1::GFP::lgg-2 (m) shows no peripheral ring. White line shows the outer limit of asc as determined by DIC.
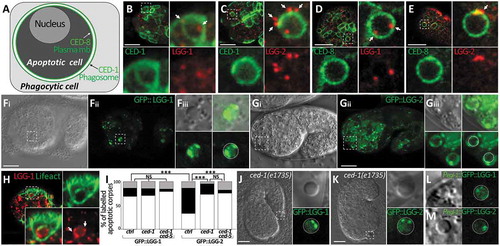
To confirm that LGG-1 puncta mainly localize inside ACs, and LGG-2 puncta around the phagosome, we examined whether GFP::LGG-1 and GFP::LGG-2 localizations are modified in ced-1(e1735) mutant and ced-1(e1735) ced-5(RNAi) animals [Citation19]. In the absence of CED-1, a receptor involved in apoptotic cell recognition, or CED-5, an ortholog of the human protein DOCK1/DOCK180, the phagocytosis of ACs is strongly affected and several non-engulfed corpses were found floating between the embryo and the eggshell (called extruded corpses). Our analysis of ced-1(e1735) and ced-1(e1735) ced-5(RNAi) embryos demonstrated that the localization of GFP::LGG-1 was not modify in internal and extruded corpses (,j) and S1C). However, the presence of the LGG-2 peripheral ring was strongly decreased in internal ACs and was not detected in extruded cell corpses (,k) and S1C), indicating that this particular localization corresponds to the phagosome formed during the phagocytosis of ACs. This conclusion was further supported by the finding that GFP::LGG-1 and GFP::LGG-2 expression driven specifically in apoptotic cells using the egl-1 promoter did not lead to formation of a peripheral ring in ACs (,m)).
LGG-1 and LGG-2 localization is dependent on the canonical autophagy pathway
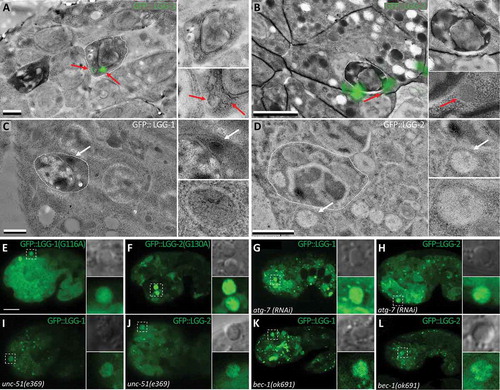
We then asked whether LGG-1 and LGG-2 localization is related to LAP or autophagy. First, to address whether LGG-1 and LGG-2 dots correspond to vesicles, we analyzed GFP::LGG-1 and GFP::LGG-2 localization using Correlative Light and Electron Microscopy (CLEM) ( and S2A-D) and immuno-EM ( and S2E,F). GFP::LGG-1 puncta within ACs could be associated with vesicular structures of about 200 nm (). However, ACs were very dense and dark and we were not able to determine whether these LGG-1-positive vesicles had 2 membranes. EM analysis of GFP::LGG-2 revealed vesicles around engulfed AC (). Second, we tested whether LGG-1 and LGG-2 localization is dependent on conjugation of these proteins to phosphatidylethanolamine, a lipid present in autophagic membranes. We used previously-characterized mutations of the glycine residue involved in lipidation [Citation13,Citation20] and observed that localization of GFP::LGG-1G130A (n = 30) and GFP::LGG-2G130A (n = 15) was largely diffuse and cytosolic in ACs (). This result indicates that LGG-1 and LGG-2 puncta are not aggregates, but rather correspond to vesicular localization. Third, we tested whether this vesicular localization was dependent of the autophagy pathway by depleting either ATG-7, a protein involved in LGG-1 and LGG-2 conjugation, or the UNC-51/ULK1 kinase and BEC-1/BECN1/Vps30/Atg6 which are involved in autophagy initiation. In atg-7(RNAi) embryos, LGG-1 (55%, n = 68) and LGG-2 (61%, n = 38) localization was diffuse in ACs (,h)). In unc-51(e369) embryos, a majority of ACs presented a fully diffuse localization of LGG-1 (51%, n = 33) and LGG-2 (63%, n = 16) and their localization pattern in other ACs showed very few puncta (,j)). In bec-1(ok691) embryos, a diffuse pattern was observed in 88% of LGG-1-positive ACs (n = 59) and 81% of LGG-2-positive ACs (n = 16) and no LGG-2 AC peripheral rings were detected (,l)). These observations indicate that LGG-1 and LGG-2 puncta localization in ACs is dependent on canonical autophagy.
Figure 2. lgg-1 and lgg-2 localization at AC is dependent on canonical autophagy. (a and b) CLEM of GFP::lgg-1 (a) and GFP::lgg-2 (b) at asc. A lgg-1-positive vesicle (red arrow) is present within the AC (dark roundish cell surrounded by white dotted line), while lgg-2-positive vesicles are outside the AC in the phagocytic cell. Scale bars: 1 µm. (c and d) Immuno-EM images of GFP::lgg-1 (c) and GFP::lgg-2 (d) at asc using an anti-GFP antibody. White arrows point to gold beads. Scale bars: 1 µm. (e and f) Confocal images of GFP::lgg-1G116A (e) and GFP::lgg-2G130A expressed in embryos (f). These mutated forms of lgg-1 and lgg-2 are unable to be conjugated. GFP is diffuse in asc and no rings are observed (insets are 3-fold magnifications). (g-l) Confocal images of Plgg-1::GFP::lgg-1 (g, i, k) and Plgg-2::GFP::lgg-2 (h, j, l) in atg-7(RNAi) (g and h), unc-51(e369) (i, j), and bec-1(ok691) (k,l) mutant embryos. Higher magnifications of AC are shown in insets. Both lgg-1 and lgg-2 localization is mainly diffuse and no peripheral ring is visible. Scale bar for E to F: 10 µm.
Altogether, these data show that, LGG-1 and LGG-2 localize in autophagic structures in ACs and at the phagosome, respectively, suggesting that LGG-1 and LGG-2 may exert different functions during apoptosis and phagocytosis of ACs.
LGG-1 and LGG-2 are required for the clearance of apoptotic corpses
To investigate the roles of LGG-1 and LGG-2 during AC formation and phagocytosis, we tested whether their loss of function affects the number and behavior of dying cells. Because embryonic apoptosis is perfectly stereotyped during C. elegans development, we decided to systematically score the number of ACs using DIC microscopy, at embryonic stages during which numerous cell death events occur (comma and 1.5 fold stages, 460 to 500 min after fertilization). In the null mutants, lgg-1(tm3489) and lgg-2(tm5755) [Citation13], an increased number of ACs was observed (; quantifications in E) but lgg-1;lgg-2 double-mutants did not display a more severe phenotype than single mutants. This indicates that LGG-1 and LGG-2 act in the same pathway for clearance of ACs, but are dispensable for induction of cell death. We confirmed that these phenotypes are directly linked to lgg-1 and lgg-2 mutations since expression of Plgg-1::GFP::LGG-1 and Plgg-2::GFP::LGG-2 transgenes was able to rescue the number of ACs (Fig. S1D). Then, to investigate whether the higher number of ACs in lgg-1 and lgg-2 mutants was due to an increase in cell death events or a delay in cell corpse clearance, we performed time lapse microscopy experiment and scored the total number of ACs formed during 200 min after the appearance of the first AC. During this period of time, we did not find any significant difference in the total number of ACs and the time of their appearance, in lgg-1, lgg-2 or double-mutant embryos compared to the wild type ()). In contrast, the mean duration of ACs was higher in lgg-1, lgg-2 and double-mutant embryos compared to the wild type ()). These findings indicate that LGG-1 and LGG-2 are not involved in the cell death process itself but are important for efficient clearance of ACs.
Figure 3. lgg-1 and lgg-2 are involved in the clearance of asc. (a to d) DIC images of the wild type (a), lgg-2(tm5755) (b), lgg-1(tm3489) (c) and lgg-1(tm3489);lgg-2(tm5755) (d) mutant embryos. Arrows indicate cell corpses. Scale bar: 10 µm. (e) Quantification of the mean number of AC visible in comma and 1.5 fold embryos corresponding respectively to 430 and 460 min of development after fertilization. Error bars represent standard deviation (n = 20). Wilcoxon Mann-Whitney test analysis * P value < 0.05, *** P value < 0.0005. (f) Four-dimensional analysis in wild-type, lgg-2(tm5755), lgg-1(tm3489) and lgg-1(tm3489);lgg-2(tm5755) embryos, of the number of cell death events occurring during the 200 min following the appearance of the first AC. The y-axis indicates the cumulative number of cell death events (average of 3 embryos for each genotype). The differences are not statistically significant. (g) The mean duration of 30 cell corpses was calculated for triplicates for each indicated genotype. Student t test analysis ** P value < 0.001, *** P value < 0.0001. (h) The mean number of persistent cell corpses was scored in double mutant embryos for lgg-1 or lgg-2 and membrane recruitment or actin rearrangement mutants and compared with that in single mutants. Error bars represent the standard deviation, n ≥ 15, Wilcoxon-Mann-Whitney test analysis * P value < 0.005, *** P value < 0.0005.
In order to assess whether LGG-1 and LGG-2 function specifically in AC engulfment, we analyzed the genetic interactions between lgg-1, lgg-2 and the engulfment pathways genes. Phagocytosis of ACs requires at least 2 molecular pathways, the CED-10/RAC1 and the CED-1/MEGF10 pathways, which regulate actin rearrangements and extension of the plasma membrane, respectively [Citation21]. Mutations in genes involved in each pathway result in an increased number of ACs with an additive effect when both pathways are affected. To determine if lgg-1 and lgg-2 functions could be placed in the engulfment cascade, we constructed double-mutant strains between engulfment genes (CED-10 and CED-1 pathways) and lgg-2(tm5755) or lgg-1(RNAi) and scored for the number of ACs ()). If lgg-1 or lgg-2 acts in the same genetic pathway with engulfment genes, we expected no additive effect on the number of ACs. Loss of lgg-1 enhanced the engulfment defects in all mutant backgrounds tested for both the CED-1 and CED-10 pathways, while loss of lgg-2 did not affect the number of ACs when either pathway was inhibited. These results suggest that LGG-1 acts upstream of both engulfment pathways, while LGG-2 functions through both pathways, in agreement with their respective localization in ACs and at the phagosome. Rescue experiments using specific promoters revealed that the expression of GFP::LGG-1 in ACs can rescue the number of ACs in the lgg-1(tm3489) mutant (Fig. S1D), while the expression of GFP::LGG-2 in phagocytic cells can partially rescue the number of ACs in lgg-2(tm5755) mutant (Zheng Zhou, personal communication).
Altogether, these results indicate that LGG-1 and LGG-2 are not involved in programmed cell death but they promote the phagocytosis or degradation of AC, by acting in the AC and in the phagocytic cell respectively.
LGG-1, but not LGG-2, is involved in phosphatidylserine exposure
DIC analyses of lgg-1 and lgg-2 null mutants revealed a moderate increase of ACs indicating that the clearance process might be slower than in the wild type but not blocked altogether (). To further characterize the aspect of ACs in embryos mutants for lgg-1 and lgg-2, we next performed transmission electron microscopy (TEM). Based on AC shape, the presence of an encircling membrane, and the aspect of the nucleus, we classified ACs in 3 categories: non-engulfed, engulfed-undegraded, degraded (, quantifications in D, Fig. S3). We first compared the wild type and well-characterized mutants of engulfment (ced-1;ced-5) [Citation22] or degradation (lst-4; snx-1) [Citation23]. As expected, TEM of the ced-1(e1735); ced-5(n1812) engulfment mutant shows a strong increase in the number of non-engulfed ACs. lst-4(tm2423); snx-1(tm847) mutant embryos do not present a significant increase of engulfed-undegraded ACs ()). In lgg-1(tm3489) embryos, a slight decrease in degraded ACs was observed, suggesting a global delay in the phagocytosis process. However, lgg-2 mutants accumulate engulfed ACs demonstrating that LGG-2 is dispensable for engulfment step of phagocytosis but involved in maturation of the phagosome ()).
Figure 4. lgg-1 but not lgg-2 is involved in phosphatidylserine exposure on AC. (a to c) Transmission electron microscopy images of cell corpses in embryos and their corresponding schematic representations (aii,bii,cii). aiii, biii, ciii are 3-fold magnifications of the boxed areas showing the membranes surrounding asc (white arrows). Not engulfed asc (a) are easily detected, presenting a dark nucleus, a single surrounding membrane and spaces between neighboring cells. Undegraded-engulfed asc (b) are surrounded by 2 membranes, the cell corpse membrane and the phagosomal membrane. Degraded asc (c) are irregular with a disorganized nucleus and one single surrounding membrane. Scale bar: 0.5 µm. (d) Quantification of the percentages of the 3 categories of asc in the wild-type as well as in the ced-1;ced-5 phagocytosis mutant (n = 45), lst-4;snx-1 lysosomal fusion mutant (n = 29), lgg-1 (n = 27) and lgg-2 (n = 47) mutant embryos. Fisher test analysis of the distribution of the 3 classes * P value < 0.07, ** P value < 0.005, *** P value < 0.0005. (e to h) Epifluorescence images of embryos expressing the GFP reporters of AC phagocytosis CED-1::GFP (e), ACT-5::YFP (f), GFP::2XFYVE (g) and GFP::RAB-7 (h). Arrows indicate cell corpse positive for the reporters and magnified in the insets. Scale bar: 10 µm. (i) Quantification of phagocytosis reporters expression levels in control, lgg-1(RNAi) and lgg-2 mutant embryos. Data represent the ratio between the number of GFP rings and the number of asc visible by DIC. Error bars represent the standard deviation (n ≥ 10). Wilcoxon Mann-Whitney test analysis * P value < 0.05, ** P value < 0.005, *** P value < 0.0005. (j to m) Epifluorescence images of PS fluorescent sensor reporters MFG-e8::mCherry (J,K), ANX::GFP (l) and GFP::Lact (m) in wild-type (j,l,m) and lgg-1(RNAi) (k) embryos. Fluorescent asc indicated by arrows are magnified in insets. (n and o) Quantification of PS fluorescent reporter recruitment in control, lgg-1(RNAi) or lgg-2 mutant (o) embryos. Data represent the ratio between the number of fluorescent rings and the number of asc as determined by DIC. Error bars represent the standard deviation (n ≥ 10). Wilcoxon Mann-Whitney test analysis * P value < 0.05, ** P value < 0.005. (p) Percentage of asc labelled by MFG-e8 with a continuous or discontinuous fluorescent ring in control and lgg-1(RNAi) embryos. n ≥ 30 cell corpses, Fisher test analysis *** P value < 0.0005.
Elimination of ACs by phagocytic cells involves 2 steps: first, rapid engulfment involving actin polymerization and membrane extension, and then slow maturation of the phagosome which involves the sequential recruitment of proteins at the membrane and fusion with the endo-lysosomal system resulting in the degradation of ACs [Citation24]. To confirm which step of the process is affected in lgg-1 and lgg-2 mutants, we used a series of fluorescent-based reporters, CED-1, ACT-5, 2XFYVE, and RAB-7, which decorate the phagosome at various stages of the phagocytic process (-h) and S4A-D, quantifications in I). A difference in the number of phagosomes labeled with these markers in the mutant vs. wild type gives an indication as to which step of phagocytosis is affected. The moderate reduction of endosomal markers in absence of LGG-2 suggested a maturation defect of the phagosomes. In contrast, in lgg-1 mutant embryos, we observed a strong reduction in the number of phagosomes labelled with endo-lysosomal markers, suggesting that the engulfment process was reduced. CED-1 and actin, which are transient markers of engulfment, were present in few phagosomes and the slight decrease observed in lgg-1 mutant embryos is not statistically significant ( quantifications in I). So, engulfment was further analyzed in lgg-1 mutant embryos by detection of the ‘eat-me’ signal phosphatidylserine (PS) at the surface of ACs. We used 3 well-characterized PS reporters, MFGE8/milk-fat-globule-EGF-E8 (MFGE8::mCherry) (,k)), ANXA5/annexin V (referred to as ANXV::GFP hereafter) ()), and the GFP::LactC1C2 which corresponds to 2 domains of mammalian MFGE8 fused to a synthetic signal sequence ()) [Citation25–Citation27]. In lgg-1 but not lgg-2 mutants, we observed significantly fewer PS reporter fluorescent rings than in the wild type, indicating a specific function of LGG-1 for PS exposure (,o) and S4E to J). Moreover, we observed that almost half of the ACs in lgg-1 but not in lgg-2 mutant embryos have a discontinuous MFG-e8::mCherry ring (), quantifications in P) supporting an abnormal PS exposure in absence of LGG-1.
Recent data have determined that the transmembrane protein CED-8/Xkr8 is essential for promoting PS externalization in ACs [Citation25,Citation28,Citation29]. To analyze if LGG-1 functions together with CED-8, we first examined CED-8::GFP expression in control and lgg-1(RNAi) embryos () and observed no differences, suggesting that LGG-1 is not involved in CED-8 localization at the plasma membrane of ACs. We then hypothesized that if LGG-1 mediates CED-8 activity, their depletion should result in a similar phenotype. ced-8(n1891) mutant embryos are characterized by less ACs with a majority of extruded corpses, while extruded ACs are not present in lgg-1(RNAi) embryos (. Moreover, the depletion of both CED-8 and LGG-1 results in a combination of ced-8 and lgg-1 phenotypes, with more ACs compared to ced-8(n1891), but the same ratio of extruded versus internal ACs (,h)). These data indicate that LGG-1 and CED-8 are acting in different pathways for engulfment of ACs.
Figure 5. lgg-1 function in AC is not dependent of CED-8. (a and b) Epifluorescence images of CED-8::GFP in control (a) and lgg-1(RNAi) embryos (b). White arrows indicate the ring localization of CED-8::GFP at the plasma membrane of an AC which is magnified in the insets. (c) Quantification of the mean number of asc in control (n = 13) and lgg-1(RNAi) (n = 23) embryos indicates that expressing CED-8::GFP does not affect the number of asc (compare with ). Wilcoxon Mann-Whitney test analysis *** P value < 0.0001. (d) Quantification of CED-8::GFP in control (n = 13) and lgg-1(RNAi) (n = 23) embryos indicates that the depletion of lgg-1 does not affect CED-8::GFP localization. Data represent the ratio between the number of GFP rings and the number of asc visible by DIC, Fisher test analysis. Error bars are standard deviation. (e to g) DIC images of ced-8(n1891) mutants (e), lgg-1(RNAi) (f) and ced-8(n1891);lgg-1(RNAi) (g) embryos. White arrows indicate cell corpses. White arrowheads indicate extruded cells. Scale bar: 10 μm. (h) Quantification of the mean number of asc and extruded cells in WT, lgg-1(RNAi), ced-8(n1891) and double ced-8(n1891);lgg-1(RNAi) 1.5 fold embryos (n = 13, 12 and 20 respectively). Depletion of lgg-1 does not modify the fraction of extruded asc of ced-8(n1891) (Chi-squared test). Error bars are standard deviation. Total number of asc have been analyzed by Wilcoxon Mann-Whitney test * P value < 0.05, *** P value < 0.0001.
Together, these findings show that LGG-1 and LGG-2 have distinct functions during the phagocytosis and degradation of ACs. LGG-1 appears to be involved in mediating PS exposure, allowing AC recognition by phagocytic cells, while LGG-2 may act at a later step of phagosomal maturation.
LGG-2 is involved in the fusion between lysosome and phagosome
To investigate the function of LGG-2, we performed time-lapse analysis of GFP::LGG-2 puncta in the phagocytic cell. The formation of GFP::LGG-2 puncta was observed concomitantly with the apparition of the characteristic button-like morphology of ACs visible by DIC () and Movie1). The puncta persisted for several minutes around the ACs and then disappeared (, 0 to 6 min). Because GFP fluorescence may be quenched by acidification of phagosomes during maturation, we also performed time-lapse analysis using an mCherry::LGG-2 () and Movie 2). mCherry::LGG-2 presented a punctate localization forming a discontinuous ring around the phagosome (, 8 min). Then, mCherry::LGG-2 became progressively diffuse within the phagosome (, 12 to 18 min), which correlated with the degradation of the AC, as observed by DIC. These data strongly suggested that LGG-2-positive vesicles were fusing with the membrane of the phagosome during its maturation and that mCherry was released in the phagosomal lumen. Next, we addressed the function of LGG-2 during late steps of maturation/degradation of the phagosome. We have previously demonstrated that during a selective autophagy process, LGG-2 mediates the fusion between autophagosomes and lysosomes via its interaction with VPS-39, a specific subunit of the homeotypic fusion and protein sorting complex [Citation13]. We investigated whether LGG-2 could have a similar function during phagosome maturation in phagocytic cells and at which precise step it could be involved. We first asked whether VPS-39 is recruited at ACs in 1.5 fold stage embryos. By using Pvps-39::VPS-39::mCherry transgenic strain, we observed localization of VPS-39 at 63.9% of ACs (n = 155) forming discontinuous rings with some dots at the level of phagosomes ()). To analyze if VPS-39 is involved in the degradation of ACs, we quantified the number of ACs visible by DIC in vps-39(tm2253) mutant and vps-39(RNAi) embryos. In both of these contexts, the number of ACs is higher compared to the control, showing that VPS-39 is involved in the degradation of ACs in C. elegans embryos ()). Because VPS-39 presents a similar localization pattern as LGG-2 around ACs, we then analyzed its colocalization either with LGG-2 or LGG-1 by crossing the Pvps-39::VPS-39::mCherry strain with either Plgg-2::GFP::LGG-2 or Plgg-1::GFP::LGG-1 strains and analyzing descendants using confocal microscopy. Analysis of ACs shows that colocalization was frequently detected between VPS-39 and LGG-2, but rarely between VPS-39 and LGG-1 (). Moreover, quantitative analysis of the colocalization using Manders coefficient, indicates that VPS-39 overlaps 2.8-fold more with LGG-2 than with LGG-1 ()). These results suggest that LGG-2 could be involved in the fusion between autophagosomes and lysosomes through an interaction with the HOPS protein VPS-39. Further verification of this hypothesis was carried out using a similar colocalization analysis between LGG-2 or LGG-1 and a specific marker of the lysosome, the intraluminal DNAse NUC-1. Analysis of ACs reveals that partial colocalization was often detected between NUC-1 and LGG-2, but less frequently between NUC-1 and LGG-1 (,h)). In addition, Manders quantification of the colocalization indicates that NUC-1 overlaps 2.0 fold more with LGG-2 than LGG-1 ()). We then analyzed the dynamic of LGG-2 recruitment concomitantly with LAAT-1 () and Movie 3), a transmembrane protein of the lysosome, which decorates the membrane of the phagosome upon fusion with lysosomes. The recruitment of LGG-2 puncta at the phagosome starts before the fusion of LAAT-1-positive lysosomes, but regions of colocalization are observed, suggesting a specific role for LGG-2 in the fusion between phagosomes and lysosomes. To check this hypothesis, we performed time lapse observations of LAAT-1::mCherry and DIC, to monitor the final maturation of the phagosomes () and Movie 4). Before interaction with lysosomes, ACs were visible by DIC as button-like structures without a LAAT-1 ring (category 1). ACs still visible by DIC but also decorated by LAAT-1 indicated early stages of phagosome-lysosome fusion (category 2). Finally, in a third category, ACs were no longer visible by DIC due to their degradation by lysosomal enzymes, but phagosomes were labelled with LAAT-1. We quantified the 3 categories in control and lgg-2 mutant embryos ()). In absence of LGG-2, we observed an increase in the first category and a decrease of the third category, indicating that late maturation of the phagosome was delayed. These data demonstrate that LGG-2 is involved in the fusion between phagosome and lysosome, which is necessary for the degradation of ACs.
Figure 6. lgg-2 is involved in the interaction between phagosomes and lysosomes. (a and b) Time-lapse analysis of Plgg-2::GFP::lgg-2 (a) and Plgg-2::mCherry::lgg-2 (b) distribution around embryonic asc. Green arrows point to GFP::lgg-2 puncta observed first around the AC then disappearing. mCherry::lgg-2 is first observed as puncta that form a discontinuous ring around the AC (red arrows 8 min) and finally as a diffuse signal inside the phagosome (12 to 18 min). Apparition of the diffuse mCherry signal is concomitant with the degradation of the AC as observed by DIC (white arrow). Images are excerpted from Movies 1 and 2. (c) Confocal images of mCherry::VPS-39 expressed in live embryos. Insets are 2.5-fold magnifications of asc in DIC and mCherry fluorescence. White dotted lines in mCherry inset delimit the contours of asc as determined by DIC. Scale bar: 10 µm. (d) Quantification of the mean number of asc in control and vps-39(tm2253) embryos (n = 10 for control and n = 19 for vps-39). Error bars are standard deviation. Wilcoxon Mann-Whitney test analysis (P value * < 0.05). (e to h) Confocal images of asc showing the localization of VPS-39::mCherry (e,f) or NUC-1::mCherry (g,h) and that of either GFP::lgg-2 (e,g) or GFP::lgg-1 (F,H) at the level of the same asc. In the fluorescent images, white dotted lines represent the outer limits of asc as determined by DIC, and yellow arrows point to colocalization. (i) Box-plots of the colocalization between lgg-1 and NUC-1 (n = 67), lgg-2 and NUC-1 (n = 66), lgg-1 and VPS-39 (n = 27), lgg-2 and VPS-39 (n = 42). Overlapping fractions between green and red pixels correspond to Manders coefficients. Welch Two Sample t test analysis (P value *** < 0.001). (j) Time-lapse analysis of a GFP::lgg-2 and LAAT-1::mCherry-positive AC. The formation of a GFP::lgg-2 discontinuous ring is detected first and overlaps with the recruitment of LAAT-1::mCherry (6 min). Images are excerpted from Movie 3. (k) Time-lapse analysis of a LAAT-1::mCherry-positive AC. The AC is first visible in DIC and negative for LAAT-1::mCherry (0 min), then visible in DIC and positive for LAAT-1::mCherry (6 min) and finally the AC disappears in DIC but remains positive for LAAT-1::mCherry (10 min). For each category, top left image is the merge and bottom pictures are split DIC and mCherry. Images are excerpted from Movie 4. Scale bar: 2 µm. (l) Quantification of the 3 categories of AC in control or lgg-2(tm5755) embryos. Chi-squared test analysis (P value * < 0.05).
Discussion
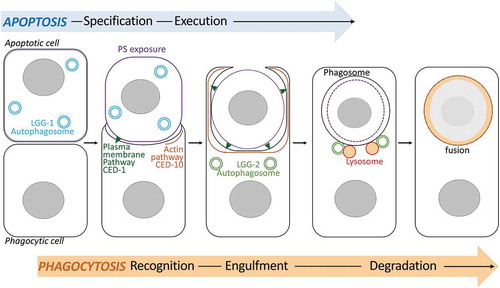
Our study revealed that in the C. elegans embryo, autophagy plays different and successive roles in the process of phagocytosis of ACs and revealed functional specificities for LGG-1/GABARAP and LGG-2/LC3 ortholog families of yeast Atg8 (). LGG-1 and LGG-2 are enriched within the AC or at the phagosome, respectively, both localizations are being dependent on the canonical autophagy pathway. Our data demonstrate that in the apoptotic cell, LGG-1 is involved in the exposure of PS in parallel to CED-8, which is essential for recognition by engulfing cells. In the phagocytic cell, LGG-2 autophagosomes are implicated in the interaction between lysosomes and the phagosomal membrane, to allow efficient AC clearance.
Figure 7. Schematic model of the dual role of autophagy during phagocytosis of apoptotic cells. The model illustrates the involvement of lgg-1 and lgg-2-positive autophagosomes during the phagocytosis of asc in C. elegans embryos. lgg-1 is enriched in the apoptotic cell and is involved in the exposition of PS at the plasma membrane. In the phagocytic cell, lgg-2 autophagosomes are implicated in the fusion between the phagosome and lysosomes to allow efficient AC clearance.
In C. elegans larvae, a previous study reported that GFP::LGG-1 was detected at the phagosome during phagocytosis of ACs, but the consequence of depleting LGG-1 was not addressed [Citation16]. We did not observe such recruitment in the embryo but it is possible that the process differs, depending on the stage of development and the phagocytic cells. Our genetic approach using mutants and RNAi demonstrates a role for LGG-1 in PS exposure, but we cannot exclude a later contribution that could be masked by its early function. Interestingly, a similar role for autophagy on PS exposure has also been described during mouse development [Citation30,Citation31] and in human microvascular endothelial cells [Citation32]. Studies on mice raised the hypothesis that autophagy allows the production of an energy supply essential for switching PS in the plasma membrane. Our observation indicates that involvement of autophagy in death signal exposure is a feature common to various species. However, in C. elegans, blocking autophagy delays the degradation of AC but does not result in a severe defect, suggesting that compensatory mechanisms exist during the process.
Conversely, our results on LGG-2/LC3 are consistent with those of other studies performed in mammals showing that the recruitment of LC3 allows efficient acidification of phagosomes containing ACs or pathogens [Citation2–Citation4]. To our knowledge, no individual characterization of members of LC3 and GABARAP families has been reported. We describe here a specific role for LGG-2/LC3 during phagosomal maturation and propose that it participates to the interaction between 3 compartments, the phagosomal membrane, the autophagosome and the lysosome. LGG-2-positive autophagosomes colocalize with lysosomal vesicles at the vicinity of the phagosome, and depletion of LGG-2 delays the maturation of the phagosome. Our data indicate that autophagosomes interact with the phagosomal membrane, but we cannot exclude that autophagosomes are also fusing with lysosomes before the interaction with the phagosome. The interaction between LGG-2 and VPS-39 has already been implicated in the formation of autolysosomes during mitophagy [Citation13], suggesting that this tethering function could be a general feature of LGG-2.
The localization of LGG-2 at the single membrane of the phagosome is reminiscent of the LAP process [Citation2,Citation3], but 2 lines of evidence do not support that the process observed here is LAP. First, LGG-2 is not forming a regular ring at the phagosome but rather a discontinuous dotted pattern consistent with the fusion of LGG-2-positive vesicles. Second, the phagosomal localization of LGG-2 is dependent on the autophagy proteins UNC-51, ATG-7, and BEC-1. In regards to recent publications, LAP appears to cover rather heterogeneous processes [Citation33]. The localization of LC3 proteins on the phagosomal membrane could result from direct recruitment by lipid conjugation or fusion with LC3-positive vesicles. For instance, Kageyama and colleagues, have first observed a localization of LC3 as puncta and then in a fluorescent ring on single membrane vesicles containing Salmonella [Citation34]. These puncta do not seem to be autophagosomes because they are formed independently of ATG9A, RB1CC1/FIP200 or PtdIns3K. Very recently, autophagy dependent LC3-positive puncta fusing with phagosomes have been described in mouse kidney cells [Citation35]. The complete sequestering of a phagosome by autophagosomes has also been reported. Because of the complexity of the LAP process which could in certain conditions act in collaboration with autophagy, the identification of membrane compartments by EM remains essential. Our analyses in C. elegans confirmed the presence of a single membrane phagosome around the ACs and support a model of fusion of LGG-2-positive autophagosomes with the phagosomal membrane.
There are still some questions to address concerning the precise role of LGG-2/LC3 and autophago-lysosome during phagocytosis of ACs in C. elegans. In particular, it would be of interest to identify whether specific signaling pathways are involved during this process. LC3-associated phagocytosis has been mainly studied in specialized phagocytic cells, where it implicates a signaling dependent on Toll-like receptors and nitrogen oxide NOX [Citation4,Citation7]. In C. elegans phagocytosis is performed by non-specialized phagocytic cells and no true CYBB/NOX2 homolog is present [Citation36]. One possibility is that a coordinated recruitment of autophagosomes and lysosomes is important to degrade efficiently the particularly large AC-containing phagosome.
Materials and methods
C. elegans strains
Nematode strains were grown on nematode growth media (NGM) plates (50 mM NaCl [Sigma-Aldrich, 60,142], 0.25% bactopeptone [Becton-Dickinson, 211677], 5 µg/ml cholesterol [Sigma-Aldrich, C8667], 2% bacto agar [Becton-Dickinson, 214010] autoclaved and supplemented with 1 mM CaCl2 [Sigma-Aldrich, C3306], 1 mM MgSO4 [Sigma-Aldrich, M5921], 20 mM KH2PO4 [Sigma-Aldrich, P5655] 1 M, 3.3 mM K2HPO4 [Sigma-Aldrich, 60356]) and fed with Escherichia coli strain OP50 (Caenorhabditis Genetic Center) [Citation37]. The C. elegans Bristol N2 strain was used as a wild-type strain. Genotypes of all the strains used in this study are listed in Table S1. To score ACs labelled with ANXV::GFP or GFP::LACTC1C2, embryos were grown at 20°C and then incubated at 33°C for 45 min followed by a recovery at 20°C for 2 h. The quantification is the ratio between the number of DIC corpses and the fluorescent rings regardless of cell morphology.
Plasmid constructions and transgenic strains
To generate the Pegl-1::gfp::lgg-1 and Pegl-1::gfp::lgg-2 fusion constructs, the genomic sequence of gfp::lgg-1 from pPD117.01 and gfp::lgg-2 from pRD117 [Citation20] were placed under the control of the regulatory region of egl-1 from the pBC99 plasmid (gift from Zheng Zhou). The Plgg-1::mCherry::lgg-1 construct was generated by polymerase chain reaction amplification of the mCherry sequence from PID02 [Citation13] and replacement of the gfp sequence by this mCherry sequence in PPD117 vector. The plasmids containing Pegl-1::gfp::lgg-1, Pegl-1::gfp::lgg-2 and Plgg-1::mCherry::lgg-1 were injected into N2 worms together with the dominant roller injection marker pRF4 [rol-6(su1006)] to generate extrachromosomal transgenic lines. The Plgg-1::gfp::lgg-1G116A construct was obtained by site-directed mutagenesis. Transgenic integrated lines were generated by microparticle bombardment of unc-119(ed3) worms [Citation13]. The RD372 (lgg-2(pp112)[mCherry::lgg-2]) strain was obtained by a CRISPR-CAS9 (Clustered Regularly Interspaced Short Palindromic Repeats-CRISPR-associated 9) approach, using a dpy-10 co-CRISPR protocol [Citation38]. mCherry was inserted in-frame 13 nucleotides after the beginning of exon 1 and the insertion was verified by sequencing.
RNA-mediated interference
RNAi by feeding was performed as described previously [Citation39,Citation40]. Fourth-larval stage (L4) animals or embryos were raised on NGM plates containing 1 mM isopropyl-D-b-thiogalactopyranoside (Sigma-Aldrich, EU0008-CIPTG dioxane free; IPTG) and 25 µg/mL carbenicillin (Euromedex, 1039) and seeded with bacteria (E. coli HT115[DE3]) carrying the empty vector L4440 (pPD129.36) as a control or the bacterial clones from the J. Ahringer library, Open Biosystem (vps-39: JA:TO8G5.5, lgg-1: JA:C32D5.9, lgg-2: JA:ZK593.6, atg-7: JA:M7.5). RNAi phenotypes of F1 generation embryos were scored one day after the beginning of egg laying by F0 adults.
Immunofluorescence
Embryos were prepared for antibody staining by freeze–fracture and methanol fixation at −20°C (30 min) as described previously [Citation41]. After a saturation step with 1X PBS (0.137 M NaCl, 0.27 mM KCl [VWR, 26764.298], 0.1 mM final Na2HPO4-12H2O [Sigma-Aldrich, 50876], 0.180 mM KH2PO4, containing 5% milk [‘Régilait’]) and 0.5% Tween20 (Sigma-Aldrich, P9416) for 40 min and 2 washing steps in 1X PBS Tween 20 0.5%, samples were incubated in 1X PBS, Tween 20 0.5% buffer overnight at 4°C (or 2 h at room temperature [20°C]) with primary antibodies. After 2 30-min washing steps in 1X PBS 0.5% Tween 20, samples were incubated in the same buffer for 90 min at room temperature (20°) with secondary antibodies and a DNA labeling agent. Final mounting was carried out in DABCO 70% glycerol (1.25 g de DABCO [Sigma-Aldrich, D2522] in 15 ml of PBS 1X supplemented with 35 ml ultrapure glycerol [Prolabo, PC0252], mixed during 2 h at least and stored at −20°C). Primary antibodies used in this study: mouse monoclonal anti-GFP at 1:250 (Roche, 1814460), rabbit anti-LGG-1 at 1:100 [Citation42], rabbit anti-LGG-2 at 1:250 [Citation42]. As secondary conjugated antibodies, Alexa Fluor 488 (Thermo Fisher Scientific, A11034) and Alexa Fluor 568 (Thermo Fisher Scientific, A11036) were used at a dilution of 1:500. DNA was labelled using Hoechst at 1:500 (Life Technologies, 33342).
Light microscopy imaging
Routinely, embryos were observed on an Axioskop 2 Plus microscope (Carl Zeiss; Oberkochen Germany) equipped with Nomarski (differential interference contrast, DIC) optics coupled to a camera (Roper Scientific; Cool SNAP Photometrics Lisses, France). Epifluorescence images were captured on an AxioImager M2 microscope (Carl Zeiss; Oberkochen Germany) equipped with Nomarski optics coupled to a camera (Carl Zeiss; AxioCam506mono). Confocal images were captured on a confocal Leica TCS SP8 microscope (Leica Microsystems; Wetzlar Germany). Colocalisation were quantified by the Manders coefficient calculated using the ImageJ JACoP plugin [Citation43].
To quantify the number of cell corpses, embryos at comma and 1.5 fold stages corresponding to 430 and 460 min after fertilization, respectively, were mounted on 2% agarose (Invitrogen, 16,500–500) pads in M9 (42 mM Na2HPO4, 22 mM KH2PO4, 86 mM NaCl, 1 mM MgSO4). ACs were visualized as refractive discs using DIC microscopy and scored with the AxioImager M2 microscope. For each embryos, serial z sections of 1 µm were acquired. Images were analyzed using the ImageJ Cell Counter plugin (http://imagej.nih.gov/ij). Total AC counting was performed as follows. Adult worms were dissected and 2-cell embryos were placed at 20°C for 180 min. Then, embryos were placed on agar pads in M9 and sealed with petroleum jelly and viewed at 20°C using an AxioObserver compound microscope (Carl Zeiss; Oberkochen Germany). 60 to 80 serial z sections at 0.5 µm/section were captured every 3 min for 200 min and images were analyzed beginning with the appearance of the first cell corpse (200 min after fertilization) and ending at the comma stage (460 min after fertilization).
To perform the time-lapse microscopy experiments in , embryos at the comma stage were placed in M9 on agar pads and then visualized at 20°C, by DIC and fluorescence, using the AxioImager M2 microscope. For Plgg-2::gfp::lgg-2 and Plgg-2::mCherry::lgg-2 embryos, images were taken with serial z sections of 0.5 µm centered around one apototic corpse, every 2 min during 20 to 60 min. GFP::LGG-2 images were acquired with an exposure time of 200 ms (27% of lamp power, binning 2 × 2), and mCherry::LGG-2 images with an exposure time of 1000 ms (42% of lamp power, binning 2 × 2). For Pced1::laat-1::mCherry embryos, 25 z sections with a 0.75-µm step were imaged every 2 min during 60 min, with an exposure time of 600 ms (42% of lamp power, binning 3 × 3).
Spinning disc dynamic approaches on RD396 were performed by imaging embryos every 2 min during 60 min and serial z sections of 0.75 µm, with laser power and exposure time of 4% and 300ms for GFP::LGG-2 and 2% and 300 ms for LAAT-1::mCherry, using a Nikon Eclipse Ti E inverted microscope (Nikon instruments Europe BV, Amsterdam, Netherlands) equipped with a CSU-X1-A1 spinning disc module (Yokogawa Electric Corporation, Kanazawa, Japan) and Prime 95B camera (Photometrics, Tucson, AZ, USA) .
Electron microscopy
Embryos at comma and 2-fold stages were transferred to M9 20% BSA (Sigma-Aldrich, A7030) on 200 µm-deep flat carriers (Leica Biosystems) (before use, the carriers were incubated a few minutes in a solution of 1% phosphatidylcholine (Sigma-Aldrich,61755) in chloroform) followed by cryo-immobilization in the EMPACT-2 HPF apparatus (Leica Microsystems; Vienna Austria) and cryo-substitution with Automated Freeze-substitution System (AFS2) with integrated binocular lens and incubating chamber (Leica Microsystems, Vienna Austria) with acetone as described [Citation44]. Blocks were further infiltrated in 100% EPON (Agar Scientific, R1165) and then embedded in fresh EPON. Blocks were cut in a pyramidal shape and surfaces were smoothened using a glass knife. Ultrathin sections of 80 nm were cut on a ultramicrotome (Leica Microsystems, EM UC7, Vienna Austria) using an ultra 35° knife (Diatome) and were collected on a formvar and carbon-coated copper grid (Agar Scientific, S162). Sections were contrasted with 2% uranyl acetate (Merck, 8473) for 15 min and 0.08 M lead citrate (Sigma-Aldrich, 15326) for 8 min. Sections were observed with a Jeol 1400 Transmission Electron Microscope (TEM) (Tokyo, Japan) at 80 kV and images are acquired with a Gatan 11 Mpixels SC1000 Orius CCD camera. For correlative and immuno-EM, samples were frozen with an EMPACT-2 HPF and prepared as described previously [Citation45]. Cryosubstitution was performed at −90°C in 0.01% osmium (Electron Microscopy Sciences, 19190) in acetone. Sample dehydratation was performed in 0.1% uranyl acetate in 95% acetone:5% water. Solvent was exchanged for glycol methacrylate resin (SPI Supplies, 02630-AA) (68.1 ml glycol methacrylate supplemented with 30 ml of butyl methacrylate, 3 ml of H2O and 600 mg of benzoyl peroxide, mixed during 1 h at 4°C and stored at −20°C) (30–70-100%) in 95% ethanol:5% water at −30°C. Resin polymerisation was performed at −30°C with an N,N-dimethyl-p-toluidine (Sigma-Aldrich, D9912). Thin sections of 200 nm were cut using a knife for histology (Diatome, DH4560) and collected on 200-mesh copper finder grids (Agar Scientific, G2761C). Photonic images of 200-nm sections were acquired with an epifluorescence microscope Axioskop2Plus equipped with an EMCCD camera. For immuno-electron microscopy, ultrathin sections of CLEM samples (80 nm) on formvar-carbon-coated Nickel 75-mesh grids (Agar Scientific, S162N6) were sequentially treated, using an Immunogold labelling system (IGL, Leica microsystem, Vienna Austria), for 10 min with 0.5% Tween 20 in PBS and then for 5 min, 2 times, with glycine (Sigma-Aldrich, G7403) 50 mM in PBS and then for 5 min, 2 times, with 0.1% BSAc (Aurion, 60613/2) in PBS. Samples were then labelled during 1 h with the primary rabbit anti-GFP antibody (Abcam, ab6556; 1:10 dilution in 0.1% BSAc in PBS), washed 4 times for 2 min with PBS, and twice for 5 min with 0.1% BSAc in PBS. Samples where then labelled during 30 min with the secondary goat anti-rabbit antibody coupled to 10-nm colloidal gold particles (Aurion, GAR30503/2) at 1:20 dilution in 0.1% BSAc in PBS. Sections were washed 3 times 2 min in PBS and 12 times for 2 min in water, then contrasted for 8 min with 0.05% Oolong tea extract (Ted Pella, 19483) and for 2 min with 0.08 M lead citrate. Sections were observed with a Jeol 1400 TEM at 120 kV and images acquired with a Gatan 11 Mpixels SC1000 Orius CCD camera (Roper Industries, Lakewood Ranch, USA).
Statistics
All statistical analyses were performed by using the R software (www.r-project.org). The error bars represent the standard deviation (SD). The Shapiro-Wilk test was used to evaluate the normal distribution of the values and the Hartley Fmax test for similar variance analysis. Data derived from different genetic backgrounds were compared by the Wilcoxon-Mann-Whitney test or the Student t test. The Fisher exact test and Chi-squared test were used for nominal variables. Manders’ coefficients data were compared using the Welch two sample t test.
Abbreviations
| AC | = | apoptotic corpse |
| ACT-5 | = | ACTin 5 |
| ANXA5 | = | annexin v |
| ATG | = | autophagy related |
| BEC-1 | = | BEClin (human autophagy) homolog 1 |
| CED | = | cell death abnormal |
| CLEM | = | correlative light electron microscopy |
| DIC | = | differential interference contrast |
| EM | = | electron microscopy |
| FYVE | = | fab1, yotb, vac1 and eea1 |
| GABARAP | = | GABA type A receptor-associated protein |
| GFP | = | green fluorescent protein |
| LAAT-1 | = | Lysosome Associated Amino acid Transporter 1 |
| LactC1C2 | = | Lactadherin C1C2 domains |
| LAP | = | LC3-associated phagocytosis |
| LST-4 | = | Lateral Signaling Target 4 |
| MFGE8 | = | milk fat globule-EGF factor 8 protein |
| NUC-1 | = | abnormal NUClease 1 |
| PBS | = | phosphate-buffered saline |
| PS | = | phosphatidylserine |
| RNAi | = | ribonucleic acid-mediated interference |
| SNX-1 | = | Sorting NeXin 1 |
| TEM | = | transmission electron microscopy |
| ULK1 | = | unc-51 like autophagy activating kinase 1 |
| UNC-51 | = | UNCoordinated 51 |
| VPS-39 | = | related to yeast Vacuolar Protein Sorting factor 39 |
Supplemental Material
Download Zip (27.8 MB)Acknowledgments
The authors would like to thank Shohei Mitani, Xiaochen Wang, Ding Xue, Robert Horvitz Julie Plastino, Janet Richmond and the Caenorhabditis Genetic Center which is funded by the NIH National Center for Research Resources (NCRR), for providing reagents. We thank Zheng Zhou for sending strains and sharing unpublished data on Pced-1::GFP:: LGG-2. We are grateful to Emmanuel Culetto, François Agnès and Anne-Marie Pret for critical reading of the manuscript and helpful discussions. The present work has benefited from the core facilities of Imagerie‐Gif, (http://www.i2bc.paris‐saclay.fr), member of IBiSA (http://www.ibisa.net), supported by “France‐BioImaging” (ANR‐10‐INBS‐04‐01), and the Labex “Saclay Plant Science” (ANR‐11‐IDEX‐0003‐02). This work was supported by the Agence Nationale de la Recherche (project EAT, ANR-12-BSV2-018) and the Association pour la Recherche contre le Cancer (SFI20111203826). CJ received fellowships from the “Actions IDEX Paris-Saclay 2012 - Initiative Doctorale Interdisciplinaire” and the Association pour la Recherche contre le Cancer. VS received a fellowship from of the Ligue Nationale contre le Cancer. None of the authors of this work have a financial interest related to this work.
Disclosure statement
No potential conflict of interest was reported by the authors.
Supplementary Material
Supplemental data can be accessed here.
Additional information
Funding
Related Research Data
References
- Savill J, Gregory C, Haslett C. Cell biology. Eat Me Die Science. 2003;302:1516–1517.
- Florey O, Kim SE, Sandoval CP, et al. Autophagy machinery mediates macroendocytic processing and entotic cell death by targeting single membranes. Nat Cell Biol. 2011;13:1335–1343.
- Martinez J, Almendinger J, Oberst A, et al. Microtubule-associated protein 1 light chain 3 alpha (LC3)-associated phagocytosis is required for the efficient clearance of dead cells. Proc Natl Acad Sci U S A. 2011;108:17396–17401.
- Sanjuan MA, Dillon CP, Tait SWG, et al. Toll-like receptor signalling in macrophages links the autophagy pathway to phagocytosis. Nature. 2007;450:1253–1257.
- Henault J, Martinez J, Riggs JM, et al. Noncanonical autophagy is required for type I interferon secretion in response to DNA-immune complexes. Immunity. 2012;37:986–997.
- Kim J-Y, Zhao H, Martinez J, et al. Noncanonical autophagy promotes the visual cycle. Cell. 2013;154:365–376.
- Martinez J, Malireddi RKS, Lu Q, et al. Molecular characterization of LC3-associated phagocytosis reveals distinct roles for Rubicon, NOX2 and autophagy proteins. Nat Cell Biol. 2015;17:893–906.
- Lerena MC, Colombo MI. Mycobacterium marinum induces a marked LC3 recruitment to its containing phagosome that depends on a functional ESX-1 secretion system. Cell Microbiol. 2011;13:814–835.
- Nicola AM, Albuquerque P, Martinez LR, et al. Macrophage autophagy in immunity to Cryptococcus neoformans and Candida albicans. Infect Immun. 2012;80:3065–3076.
- Shpilka T, Weidberg H, Pietrokovski S, et al. Atg8: an autophagy-related ubiquitin-like protein family. Genome Biol. 2011;12:226.
- Behrends C, Sowa ME, Gygi SP, et al. Network organization of the human autophagy system. Nature. 2010;466:68–76.
- von Muhlinen N, Akutsu M, Ravenhill BJ, et al. LC3C, bound selectively by a noncanonical LIR motif in NDP52, is required for antibacterial autophagy. Mol Cell. 2012;48:329–342.
- Manil-Ségalen M, Lefebvre C, Jenzer C, et al. The C. elegans LC3 acts downstream of GABARAP to degrade autophagosomes by interacting with the HOPS subunit VPS39. Dev Cell. 2014;28:43–55.
- Cheng S, Wu Y, Lu Q, et al. Autophagy genes coordinate with the class II PI/PtdIns 3-kinase PIKI-1 to regulate apoptotic cell clearance in C. elegans. Autophagy. 2013;9:2022–2032.
- Huang S, Jia K, Wang Y, et al. Autophagy genes function in apoptotic cell corpse clearance during C. elegans embryonic development. Autophagy. 2013;9:138–149.
- Li W, Zou W, Yang Y, et al. Autophagy genes function sequentially to promote apoptotic cell corpse degradation in the engulfing cell. J Cell Biol. 2012;197:27–35.
- Gumienny TL, Lambie E, Hartwieg E, et al. Genetic control of programmed cell death in the Caenorhabditis elegans hermaphrodite germline. Development. 1999;126:1011–1022.
- Sulston JE, Schierenberg E, White JG, et al. The embryonic cell lineage of the nematode Caenorhabditis elegans. Dev Biol. 1983;100:64–119.
- Denning DP, Hatch V, Horvitz HR. Programmed elimination of cells by caspase-independent cell extrusion in C. elegans. Nature. 2012;488:226–230.
- Alberti A, Michelet X, Djeddi A, et al. The autophagosomal protein LGG-2 acts synergistically with LGG-1 in dauer formation and longevity in C. elegans. Autophagy. 2010;6:622–633.
- Yu X, Odera S, Chuang C-H, et al. C. elegans dynamin mediates the signaling of phagocytic receptor CED-1 for the engulfment and degradation of apoptotic cells. Dev Cell. 2006;10:743–757.
- Ellis RE, Jacobson DM, Horvitz HR. Genes required for the engulfment of cell corpses during programmed cell death in Caenorhabditis elegans. Genetics. 1991;129:79–94.
- Lu N, Shen Q, Mahoney TR, et al. Three sorting nexins drive the degradation of apoptotic cells in response to PtdIns(3)P signaling. Mol Biol Cell. 2011;22:354–374.
- Kinchen JM, Doukoumetzidis K, Almendinger J, et al. A pathway for phagosome maturation during engulfment of apoptotic cells. Nat Cell Biol. 2008;10:556–566.
- Chen Y-Z, Mapes J, Lee E-S, et al. Caspase-mediated activation of Caenorhabditis elegans CED-8 promotes apoptosis and phosphatidylserine externalization. Nat Commun. 2013;4:2726.
- Mapes J, Chen Y-Z, Kim A, et al. CED-1, CED-7, and TTR-52 regulate surface phosphatidylserine expression on apoptotic and phagocytic cells. Curr Biol. 2012;22:1267–1275.
- Venegas V, Zhou Z. Two alternative mechanisms that regulate the presentation of apoptotic cell engulfment signal in Caenorhabditis elegans. Mol Biol Cell. 2007;18:3180–3192.
- Stanfield GM, Horvitz HR. The ced-8 gene controls the timing of programmed cell deaths in C. elegans. Mol Cell. 2000;5:423–433.
- Suzuki J, Denning DP, Imanishi E, et al. Xk-related protein 8 and CED-8 promote phosphatidylserine exposure in apoptotic cells. Science. 2013;341:403–406.
- Mellén MA, de la Rosa EJ, Boya P. The autophagic machinery is necessary for removal of cell corpses from the developing retinal neuroepithelium. Cell Death Differ. 2008;15:1279–1290.
- Qu X, Zou Z, Sun Q, et al. Autophagy gene-dependent clearance of apoptotic cells during embryonic development. Cell. 2007;128:931–946.
- Muller C, Salvayre R, Nègre-Salvayre A, et al. HDLs inhibit endoplasmic reticulum stress and autophagic response induced by oxidized LDLs. Cell Death Differ. 2011;18:817–828.
- Green DR, Oguin TH, Martinez J. The clearance of dying cells: table for two. Cell Death Differ. 2016;23:915–926.
- Kageyama S, Omori H, Saitoh T, et al. The LC3 recruitment mechanism is separate from Atg9L1-dependent membrane formation in the autophagic response against Salmonella. Mol Biol Cell. 2011;22:2290–2300.
- Brooks CR, Yeung MY, Brooks YS, et al. KIM-1-/TIM-1-mediated phagocytosis links ATG5-/ULK1-dependent clearance of apoptotic cells to antigen presentation. EMBO J. 2015;34:2441–2464.
- Johnston AD, Ebert PR. The redox system in C. elegans, a phylogenetic approach. J Toxicol. 2012;2012:546915.
- Brenner S. The genetics of Caenorhabditis elegans. Genetics. 1974;77:71–94.
- Paix A, Folkmann A, Rasoloson D, et al. High efficiency, homology-directed genome editing in caenorhabditis elegans using CRISPR-Cas9 ribonucleoprotein complexes. Genetics. 2015;201:47–54.
- Kamath RS, Ahringer J. Genome-wide RNAi screening in Caenorhabditis elegans. Methods. 2003;30:313–321.
- Timmons L, Fire A. Specific interference by ingested dsRNA. Nature. 1998;395:854.
- Legouis R, Gansmuller A, Sookhareea S, et al. LET-413 is a basolateral protein required for the assembly of adherens junctions in Caenorhabditis elegans. Nat Cell Biol. 2000;2:415–422.
- Al Rawi S, Louvet-Vallée S, Djeddi A, et al. Postfertilization autophagy of sperm organelles prevents paternal mitochondrial DNA transmission. Science. 2011;334:1144–1147.
- Bolte S, Cordelières F. A guided tour into subcellular colocalization analysis in light microscopy. J Microsc. 2006;224:213–232.
- Kolotuev I, Schwab Y, Labouesse M. A precise and rapid mapping protocol for correlative light and electron microscopy of small invertebrate organisms. Biol Cell. 2010;102:121–132.
- Watanabe S, Richards J, Hollopeter G, et al. Nano-fEM: protein localization using photo-activated localization microscopy and electron microscopy. J Vis Exp JoVE. 2012;70:e3995.