
ABSTRACT
The involvement of macroautophagy/autophagy proteins in B-cell receptor (BCR) trafficking, although suspected, is not well understood. We show that ATG5 (autophagy related 5) contributes to BCR polarization after stimulation and internalization into LAMP1 (lysosomal-associated membrane protein 1)+ and major histocompatibility complex class II (MHC-II)+ compartments. BCR polarization is crucial in the context of immobilized antigen processing. Moreover, antigen presentation to cognate T cells is decreased in the absence of ATG5 when the model antigen OVAL/ovalbumin is provided in an immobilized form in contrast to the normal presentation of soluble OVAL. We further show that ATG5 is required for centrosome polarization and actin nucleation in the immune synapse area. This event is accompanied by an increased interaction between ATG16L1 (autophagy related 16-like 1 [S. cerevisiae]) and the microtubule-organizing center-associated protein PCM1 (pericentriolar material 1). In the human B cell line BJAB, PCM1 is required for BCR polarization after stimulation. We thus propose that the ATG12 (autophagy related 12)–ATG5-ATG16L1 complex under BCR stimulation allows its interaction with PCM1 and consequently facilitates centrosome relocalization to the immune synapse, optimizing the presentation of particulate antigens.
Abbreviations: ACTB: actin beta; ACTR2/3: ARP2/3 actin-related protein 2/3; APC: antigen-presenting cells; ATG: autophagy-related; BCR: B cell receptor; BECN1/Beclin 1: beclin 1, autophagy related; CDC42: cell division cycle 42; Cr2: complement receptor 2; CSFE: carboxyfluorescein succinimidyl ester; DAPI: 4ʹ,6-diamidino-2-phenylindole dihydrochloride; EEA1: early endosome antigen 1; ELISA: enzyme-linked immunosorbent assay; FITC: fluorescein isothyocyanate; GC: germinal center; GJA1/CX3: gap junction protein, alpha 1; Ig: immunoglobulin; LAMP1: lysosomal-associated membrane protein 1; LAP: LC3-associated phagocytosis; LM: littermate; MAP1LC3/LC3: microtubule-associated protein 1 light chain 3; MAPK/ERK: mitogen activated protein kinase; MHC-II: major histocompatibility complex class II; MIIC: MHC class II compartment; OVAL: ovalbumin; PBS: phosphate-buffered saline; PCM1: pericentriolar material 1; PtdIns3K: phosphatidylinositol 3-kinase; PTPRC/CD45RB/B220; Protein tyrosine phosphatase, receptor type, C; SYK: spleen tyrosine kinase; TBS: Tris-buffered saline; TCR: T cell receptor; ULK1: unc-51 like kinase 1
Introduction
Macroautophagy, hereafter called autophagy, is a catabolic process targeting cytoplasmic content to lysosomes through the formation of double-membrane autophagosomes. Autophagy plays multiple roles in the immune system, regulating inflammation, participating in the degradation of microorganisms and modulating adaptive immunity through its impact on lymphocyte homeostasis and activation [Citation1,Citation2]. Autophagy is a major actor in T lymphocyte homeostasis and activation [Citation3]. This process is also decisive in B cell lineage, as it is involved in the survival of the B-1a subtype [Citation4,Citation5], memory B cells [Citation6,Citation7] and plasma cells [Citation8,Citation9].
Most of the previously published work suggested no major involvement of autophagy during the first steps of B cell activation. In different settings, early IgG responses against model antigens or generated after viral infection are not affected by ATG5 or ATG7 (autophagy related 7) deficiency [Citation6]. Only T cell-independent responses against pneumococcal antigens are altered at early time points. Defects reported in this latter situation could be directly related to decreased plasma cell survival [Citation9]. Altogether, these first studies suggest that autophagy-related proteins of the core machinery play no major role in terminal B cell differentiation, taking place in germinal centers (GC) [Citation6,Citation9].
Although autophagic activity is indeed required at later stages of B cell life, i.e. for survival of long-lived cell as are memory B cells and plasma cells, a recent study shows that a non-canonical form of autophagy is necessary for GC formation [Citation10], i.e. during early B cell activation. Such a role for autophagy molecules is likely, because after stimulation internalized BCR colocalizes with autophagic compartments, or at least with vesicles containing molecules of the autophagy machinery [Citation11,Citation12]. This finding suggests that BCR endocytosis and trafficking could be regulated by ATG proteins with consequences on B cell activation in particular contexts. It has first been observed that autophagy allows relocalization of endocytosed BCR toward TLR9 (toll-like receptor 9)-positive endosomes, thus enhancing BCR signaling in response to nucleic acid-containing antigens. The study by Martinez-Martin and colleagues suggests a role for autophagy-related proteins in homeostasis during terminal B cell differentiation [Citation10]. We addressed here the question of whether autophagy proteins play a role in BCR endocytosis and trafficking and whether it affects B cell activation through antigen presentation.
Results
BCR trafficking is disturbed in the absence of ATG5
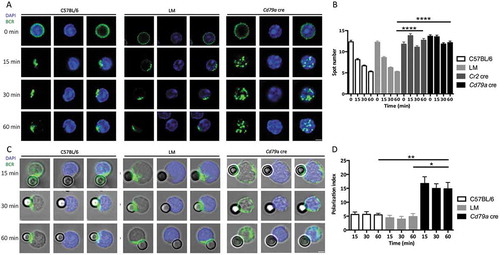
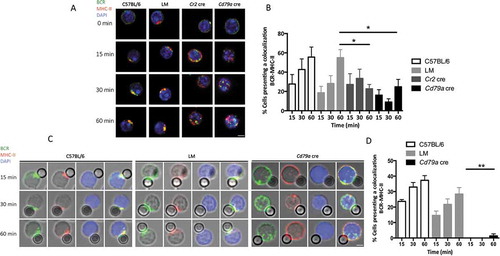
We first aimed to follow BCR trafficking in the absence of ATG5, a protein of the core autophagy machinery involved in both canonical autophagy and non-canonical forms linked to endocytosis. B cells were purified from wild-type C57BL/6 mice and from 2 mouse models with cre-mediated, pro-B cell- and B cell-specific Atg5 deletion, as previously described [Citation13]. One model allows conditional knockout (cKO) of Atg5 early during development of B cells (‘pro-B cell Atg5 cKO’, where cre activity is under control of the Cd79a/Mb1 promoter [cre Atg5f/- mice, Cd79a cre]) while in the other Atg5 is deleted only in mature B cells (‘B cell Atg5 cKO’, where cre activity is under control of the Cr2 (complement receptor 2)/Cd21 promoter [cre Atg5f/- mice, Cr2 cre]). B cells were also purified from littermate (LM) mice, which are Cre-expressing mice, heterozygous for Atg5 with one wild-type allele and one deleted allele, obtained from the same breeding as the Cr2 cre or Cd79a cre mice. Low amounts of ATG12–ATG5 conjugates and MAP1LC3/LC3 (microtubule-associated protein 1 light chain 3) processing in B cells from Cr2 cre and Cd79a cre mice indicated efficient Atg5 genetic invalidation as described in our previous study [Citation13]. We then cross-linked the BCR with a polyclonal anti-IgM antibody F(ab’)2 fragment linked to a fluorophore ( and S1 and video S1). In control (C57BL/6 and LM) B cells, as described earlier by others [Citation14], we observed by confocal microscopy an increased concentration of internalized BCR at a single pole of the cell, probably in response to the ‘capping’ of the receptor triggered by a high avidity cross-linker [Citation15]. In contrast, no such clustering at one cellular polarity was observed in either Cr2 cre or Cd79a cre Atg5-cKO B cells, although BCR molecules were internalized. (, S1 and video S2). Quantification of this trafficking pattern revealed a high number of BCR spots in Cr2 cre and Cd79a cre B cells in contrast to control B cells, reflecting the absence of a unique cluster (). We also performed B cell stimulation by beads covalently linked with anti-IgM antibody F(ab’)2 fragment (anti-IgM beads), to mimic stimulation by a particulate antigen. We observed a deficient BCR polarization at the focal point contacting the bead in the absence of ATG5 (). Polarization indexes calculated after stimulation by anti-IgM beads revealed that internalized BCR remains scattered in ATG5-deficient B cells, but not in control cells where it relocates at one cellular polarity in contact with the beads (). To confirm the role of ATG5 in BCR relocalization we performed RNA silencing by infecting the BJAB human lymphoblastoid cell line with lentiviruses driving small hairpin (sh)RNA expression. We first validated the silencing efficacy by immunoblot showing a decreased ATG5 expression associated with a concomitant decline in LC3-I conversion into LC3-II (Figure S2A and B). We then stimulated ATG5-silenced B cells by anti-human IgM antibody and compared BCR relocalization to control shRNA-expressing cells. In control cells, as for mouse B cells, internalized BCR concentrated at one pole of the cell (Figure S2C). ATG5 silencing led to less intense BCR clustering and polarization. We verified whether BCR polarization defects could be due to altered BCR signaling, by stimulating purified control or Atg5-cKO B cells with anti-IgM antibody. Atg5-cKO B cells exhibit no defect in proximal BCR signaling (SYK [spleen-associated tyrosine kinase] phosphorylation, Figure S3A and B) or downstream pathway (MAPK1/ERK2-MAPK3/ERK1 [mitogen activated protein kinase 1-mitogen activated protein kinase 3] phosphorylation, Figure S3C and D). Thus, BCR polarization impairment in the absence of ATG5 is not linked to major signaling defects.
Figure 1. ATG5 participates in BCR clustering and polarization. (a) Representative images obtained for the analysis of BCR localization after various times of stimulation (T = 0; 15; 30; 60 min) with a soluble anti-mouse IgM in control (C57BL/6 and LM) or Atg5-cKO (Cd79a cre) B cells. Images taken with x63 objective on a confocal setup. (b) Quantification of the amount of BCR spots detected after stimulation in control (C57BL/6 and LM) or Atg5-cKO (Cr2 cre and Cd79a cre) B cells, at various time points after BCR engagement. Bars represent mean values per cell ±SEM; ****P < 0.0001 Student t test, N = 100 cells. (c) Representative images obtained for the analysis of BCR localization after various stimulation times with beads conjugated to anti-mouse IgM (T = 15; 30; 60 min) in control (C57BL/6 and LM) or Atg5-cKO (Cd79a cre) B cells. Images were taken with x63 objective on a confocal setup. (d) Polarization index of the BCR after stimulation in control (C57BL/6 and LM) or Atg5-deficient (Cr2 cre and Cd79a cre) B cells with beads conjugated with anti-mouse IgM. This index is the relative angle formed between the center of mass of the cell and the extremes of the staining distribution. Bars represent mean values per individual experiment ±SEM; **P < 0.001, *P < 0.01 Mann-Whitney U test. N = 5, no statistical difference between control mice (C57BL/6 and LM) were revealed. Scale bar: 2 µm.
ATG5-dependent polarization is not linked to general defects in surface receptor mobility, and relies on class III phosphatidylinositol 3 kinase (Ptdins3K) activity
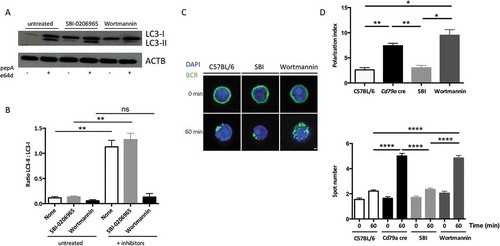
We aimed at understanding if mobility of another membrane-associated molecule involved in B cell-related synapse formation was impacted by Atg5-cKO. We focused on MHC-II molecules that form a cluster during crosstalk with T cells [Citation16]. We cross-linked MHC-II molecules at the B cell surface (Figure S4A), which is known to induce their capping and endocytosis in dendritic cells [Citation17]. Atg5-cKO does not impact MHC-II molecule clustering (Figure S4B). Thus, Atg5-cKO does not lead to general defects in surface molecule relocalization. We then investigated which known-autophagy induction pathways are mandatory for BCR clustering. Interestingly, we found that inhibiting PtdIns3K activity by wortmannin decreased B cell basal autophagic activity ( and (b)). Moreover, wortmannin treatment recapitulated in wild-type cells the BCR polarization defects observed in Atg5-cKO B cells, reflected by increased polarization index and BCR-positive spot numbers ( and (d)). In contrast, ULK1 (Unc51-like autophagy activating kinase 1) inhibition by SBI-0206965 [Citation18] had no effect, leading us first to conclude that basal autophagy in B cells is mainly linked to the BECN1/Beclin 1 (beclin 1, autophagy related)-PtdIns3K axis. Moreover, BCR clustering necessitates ATG5 and is dependent on the PtdIns3K pathway and not relying on ULK1 activation. This type of non-canonical activation is reminiscent of what is observed for LC3-associated phagocytosis (LAP) which is BECN1-dependent and ULK1-independent.
Figure 2. BCR clustering depends on PtdIns3K activity. (a) Immunoblot showing LC3 expression in purified B cells isolated from C57BL/6 mice at steady state or after treatment with the ULK1 inhibitor SBI-0206965, or wortmannin for 3 h. Lysosomal protease inhibitors pepstatin A and E64d were added (+) or not (-) for 4 additional hours in the culture to monitor autophagic flux. ACTB staining was used as a loading control. (b) Histograms representing LC3-II:LC3-I staining intensity ratios in 4 independent experiments performed. Means are shown, and errors bars stand for SEM, **P < 0.01 Mann-Whitney U test, N = 4. (c) Representative images obtained for the analysis of BCR localization before and after 60 min stimulation with a soluble anti-mouse IgM in B cells isolated from C57BL/6 or CD79a cre mice, after treatment with the ULK1 inhibitor SBI-0206965, or wortmannin, for 3 h. Representative images taken with x100 objective are shown. (d) BCR polarization index and spot numbers after stimulation in conditions described in (b). The polarization index is the relative angle formed between the center of mass of the cell and the extremes of the staining distribution (Bars represent mean values per individual experiments ±SEM; ****P < 0.0001, **P < 0.01, *P < 0.05 Student test and Mann-Whitney U test. N = 100 and N = 5 respectively. Scale bar: 2 µm.
Autophagy machinery is mobilized upon BCR stimulation
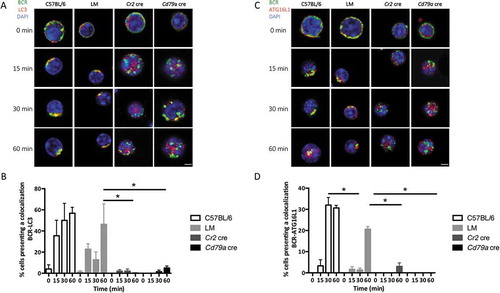
BCR relocalizes into putative autophagic compartments [Citation11] or into vesicles containing proteins of the autophagy machinery [Citation12]. We assessed in our settings if the stimulated BCR is recruited to vesicles that contain the autophagy-related proteins LC3 and ATG16L1. We thus stimulated B cells as described in the previous experiments and performed costaining with anti-LC3 () or anti-ATG16L1 antibodies (). We observed a corecruitment of LC3 and ATG16L1 together with the BCR into a polarized cluster in control and LM B cells. Quantitative analyses show the progressive increase in LC3 () and ATG16L1 () colocalization with the internalized BCR in control B cells. In opposition, Atg5-cKO B cell from both Cr2 cre and Cd79a cre mice show a low colocalization of autophagy proteins ATG16L1 and LC3 with the internalized BCR. Thus, the BCR is internalized and integrated into polarized clusters that contain LC3 and ATG16L1 molecules, and this relocalization is ATG5-dependent.
Figure 3. Autophagy-related proteins colocalize with the internalized BCR. (a) Representative images obtained for the analysis of BCR-LC3 colocalization after BCR engagement with a soluble anti-IgM antibody at the indicated times (T = 0; 15; 30; 60 min) in control (C57BL/6 or Littermate) or ATG5-deficient B cells (Cr2 cre and Cd79a cre). Images were taken with x63 objective on a confocal setup. (b) Quantification of BCR and LC3 colocalization in control or ATG5-deficient B cells at indicated time points after BCR engagement (T = 0; 15; 30; 60 min). Colocalization was determined by considering the percentage of cells with a Pearson correlation coefficient comprised between 0.5 and 1, in each independent experiment. Bars represent mean values ±SEM; *P < 0.05 Mann-Whitney U-test, N = 4. (c) Representative images obtained for the analysis of BCR-ATG16L1 colocalization after various times of BCR engagement (T = 0; 15; 30; 60 min) in control (C57BL/6 or LM) or ATG5-deficient (Cr2 cre and Cd79a cre) B cells. Images were taken with x63 objective on a confocal setup. (d) Quantification of BCR-ATG16L1 colocalization in control or in ATG5-deficient B cells after BCR engagement at indicated time points (T = 0; 15; 30; 60 min). Colocalization was determined by considering the percentage of cells presenting a Pearson correlation coefficient comprised between 0.5 and 1, in each independent experiment. Bars represent mean values ±SEM; *P < 0.05 Mann-Whitney U test, (T = 0; 15; 30; 60 min). N = 4, concerning LC3-BCR colocalization, no statistical difference between control mice (C57BL/6 and LM) were revealed. Scale bar: 2 µm.
ATG5 is necessary for the relocalization of lysosomal vesicles to the immune synapse
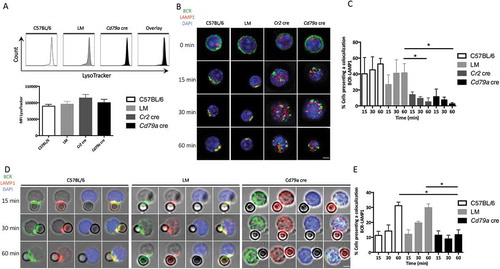
BCR polarization is necessary for the relocalization of lysosomes toward the immunological synapse and contributes to the extraction of particulate antigens from antigen presenting cells (APC)s. LAMP1 is also expressed in the MHC class II compartment (MIIC) reflecting the acidic nature of these vesicles, necessary for antigen processing. We thus evaluated LAMP1+ vesicle trafficking after BCR stimulation with anti-IgM beads. We first wanted to verify if lysosomal activity was affected by ATG5 deficiency. The absence of difference in LysoTracker-Deep Red staining intensity () excludes global lysosomal defects in ATG5-deficient B cells. We then performed LAMP1 staining after BCR cross-linking at different time points. The absence of ATG5 correlates with a reproducible decrease in BCR-LAMP1 colocalization after soluble or particulate anti-IgM stimulation ( and respectively, quantified in and ). This shows that LAMP1+ compartments were more dispersed in both Cr2 cre and Cd79a cre B cells, while they concentrated in the BCR cluster area in control B cells. This shows that ATG5 deficiency compromises the relocalization and polarization of LAMP1+ vesicles toward the polarized BCR cluster.
Figure 4. ATG5 participates in the recruitment of LAMP1+ compartments to the immune synapse. (a) Evaluation of lysosomal load in spleen B cells (PTPRC/B220+ and TCRB−) by LysoTracker Deep-Red staining from control (C57BL/6 and LM) and Cd79a cre mice, analyzed by flow cytometry. Representative histograms are shown for each genotype. Summary of mean fluorescence intensities (MFI) obtained on 5 independent mice is shown in histograms. Error bars show SEM. N = 5. (b) Representative images obtained for the analysis of BCR-LAMP1 colocalization after BCR engagement with a soluble anti-IgM antibody at indicated times (T = 0; 15; 30; 60 min) in control (C57BL/6 or Littermate) and ATG5-deficient (Cr2 cre and Cd79a cre) B cells. Images were taken with x63 objective on a confocal setup. (c) Histogram representing quantification of BCR-LAMP1 colocalization in control (C57BL/6) or ATG5-deficient B cells at various time points after BCR engagement with a soluble anti-IgM antibody (T = 15; 30; 60 min). The percentage of colocalization was determined by considering the percentage of cells presenting a Pearson correlation coefficient between 0.5 and 1. Bars represent mean values ±SEM; *P < 0.05 Mann-Whitney U test. N = 3. (d) Representative images obtained for the analysis of BCR-LAMP1 colocalization after various times of BCR engagement by anti-IgM beads (T = 15; 30; 60 min) in B cells from control (C57BL/6, LM) mice or ATG5-deficient B cells (Cd79a cre). Representative cells from 4 independent experiments are shown. Images were taken with x63 objective on a confocal setup. (e) Quantification of BCR-LAMP1 colocalization in control (C57BL/6 and LM) or ATG5-deficient (Cd79a cre) B cells after BCR engagement with a soluble anti-IgM antibody at various time points (T = 15; 30; 60 min). The percentage of colocalization was determined by considering the percentage of cells presenting a Pearson correlation coefficient between 0.5 and 1. Bars represent mean values ±SEM; *P < 0.05 Mann-Whitney U test. N = 4 (C57BL/6), 3 (LM), and 4 (Cd79a cre), no statistical difference between control mice (C57BL/6 and LM) were revealed. Scale bar: 2 µm.
ATG5 plays a role in the relocalization of internalized BCR to MHC-II containing vesicles
BCR clustering at the vicinity of LAMP1+ compartments is necessary for immobilized antigen extraction and/or processing. Antigens captured by the BCR are known to relocate to MIIC positive for LAMP1 expression. Peptides derived from these antigens can then be processed and presented for help to cognate CD4+ T cells. Previous work shows a potential role for autophagy in the presentation of citrullinated epitopes from exogenous antigens captured via the BCR [Citation12]. We therefore assessed BCR trafficking toward MHC-II-containing compartments after B cell stimulation by anti-IgM. We observed MHC-II molecule clustering together with the internalized BCR in control and LM B cells (). This phenomenon is reminiscent of what happens during the formation of the immune synapse between B cells and APCs necessary for the acquisition of particulate antigens [Citation19]. In the latter study, Batista and colleagues suggest that the intense BCR clustering induced by polyclonal anti-IgM antibodies mimics B cell polarization occurring during their interaction with APCs. In our settings, stimulation of control B cells by soluble anti-IgM also leads to a polarized cluster containing both BCR and MHC-II molecules (). After stimulation with soluble anti-IgM, some colocalization of MHC-II molecules with internalized BCR is detected in the absence of ATG5 but remained lower than in control B cells ( and (b)). In contrast, stimulation with anti-IgM beads leads to a very low BCR-MHC-II colocalization in our settings ( and (d)). Thus, ATG5 is involved in the coclustering and polarization of internalized BCR and MHC class II molecules that occurs during the formation of the immune synapse. We then wanted to verify if BCR endocytosis occurred efficiently without ATG5. Stimulation with anti-IgM beads showed that control B cells focus EEA1 (early endosome antigen 1)+ early endosomes that strongly colocalize with the BCR, at the contact site with the beads (Figure S5A and B). B cells isolated from Cd79a cre mice also efficiently internalize the BCR when stimulated with an immobilized antigen mimic, as shown by the positive EEA1 staining of internalized vesicles. This internalization is however not polarized. A significantly lower EEA1-BCR colocalization compared with control B cells is only observed 30 min after stimulation, maybe reflecting different internalization kinetics. Under stimulation with a soluble antigen mimic BCR-EEA1 colocalization is slightly lower in Atg5-cKO B cells compared to controls, (Figure S5C and D). Endocytosis is however still observable and BCR-EEA1 colocalization follows the same decreasing pattern from 15 to 60 min compared with control B cells. Thus, ATG5 is not mandatory for BCR endocytosis either with soluble or adsorbed antigen stimulation. It appears however crucial for polarization of internalized vesicles and their relocalization towards compartments containing MHC-II molecules after stimulation with immobilized antigen. We thus hypothesize that ATG5 is necessary for optimal transport of immobilized antigens to MIIC and for their processing.
Figure 5. ATG5 is necessary for MHC class II molecule polarization during an interaction with particulate antigens. (a) Representative images for the analysis of BCR-MHC-II colocalization after various time of BCR engagement by soluble anti-IgM antibodies (T = 0; 15; 30; 60 min) in control (C57BL/6 and LM) or ATG5-deficient (Cr2 cre or Cd79a cre) B cells. Images were taken with x63 objective on a confocal setup. (b) Quantification of BCR and MHC-II colocalization in control or ATG5-deficient B cells, at the indicated time points after BCR engagement by a soluble anti-IgM antibody (T = 15; 30; 60 min). Colocalization was determined by considering the percentage of cells presenting a Pearson correlation coefficient between 0.5 and 1. Bars represent mean values ±SEM; *P < 0.05 Mann-Whitney U test. N = 5. (c) Representative images obtained for the analysis of BCR-MHC-II colocalization after BCR engagement by beads conjugated to anti-IgM antibodies, at various times points, (T = 15; 30; 60 min) in control (C57BL/6 and LM) or ATG5-deficient (Cd79a cre) B cells. Images were taken with x63 objective on a confocal setup. N = 4 (d) Quantification of BCR and MHC-II colocalization in control or ATG5-deficient B cells at the indicated time points after BCR engagement with anti-IgM beads (T = 15; 30; 60 min). Colocalization was determined by considering the percentage of cells presenting a Pearson correlation coefficient between 0.5 and 1. Bars represent mean values ± SEM; **P < 0.01 Mann-Whitney U test. N = 4, no statistical difference between control mice (C57BL/6 and LM) were revealed. Scale bar: 2 µm.
ATG5 is involved in the presentation of particulate antigens
Considering the dysfunctional BCR recruitment into LAMP1+ and MHC-II+ compartments in ATG5-deficient B cells, we wanted to assess their presentation capacity regarding antigens acquired after BCR internalization. We first stimulated purified B cells with either a soluble or an adsorbed FITC (fluorescein isothiocyanate)-conjugated anti-IgM. We then collected cells to evaluate the fluorescence amount that reflect the antigen uptake efficiency. As shown in Figure S6, no difference in antigen uptake was observed between control and ATG5-deficient B cells. These results are in accordance with the detectable BCR endocytosis observed without ATG5, after immobilized anti-IgM stimulation (Figure S5). ATG5 deficiency could impact on antigen processing and presentation. We thus produced anti-IgM F(ab’)2 fragment molecules covalently linked with the model antigen ovalbumin (anti-IgM–OVAL). Treatment with this compound allows antigen acquisition after binding to the BCR and consecutive internalization. Cells were then cocultured with OT-II T cells expressing a transgenic TCR (T cell receptor) specific to an OVAL-derived epitope. We performed two types of stimulations: one with anti-IgM–OVAL immobilized on a high-adsorption-capacity plate and the other with the same conjugate provided in its soluble form. We could then mimic both the acquisition of particulate and soluble antigens [Citation20]. The measurement of OT-II cell proliferation showed that control and LM B cells were equally competent at presenting OVAL after BCR cross-linking in either its adsorbed or soluble form ( and (b)). ATG5-deficient B cells were able to present antigens as efficiently as controls when anti-(IgM–OVAL) was delivered in a soluble form. This shows that T-B cell interaction occurs efficiently in the absence ATG5 as previously suggested by the normal MHC-II clustering in ATG5-deficient B cells (Figure S4). However, antigen presentation by ATG5-deficient B cells was reproducibly lower than control cells when the antigen was adsorbed to the plate ( and (b)). This means that under soluble anti-IgM stimulation, the detectable BCR translocation to MHC-II-containing vesicles described in previous experiments is sufficient to process the antigen for presentation to T cells. In contrast, ATG5 is required for the acquisition and/or processing of the adsorbed antigen. This is consistent with the very low BCR-MHC-II colocalization previously observed in this context. We then assessed ATG5 requirement for in vivo antigen presentation by immunizing control, Cr2 cre, or Cd79a cre mice with 3-µm beads covalently conjugated with OVAL. These beads cannot be endocytosed by B cells and require antigen extraction from the particle and local processing. In consideration of the specific IgG production, we and others showed that the immunization efficiency with a soluble antigen was in the short term ATG5-independent [Citation6,Citation13]. We thus confirmed the low impact of ATG5 deficiency on immunization with a T-dependent soluble antigen such as OVAL (). In contrast, when OVAL is delivered conjugated to particles, mice with ATG5-deficient B cells produce lower levels of anti-OVAL IgG and IgM compared to controls. Altogether these results show that ATG5 is required for optimal particulate antigen presentation but is dispensable for soluble antigen processing.
Figure 6. ATG5 is necessary for particulate antigen presentation to T cells. (a) Co/culture with control (C57BL/6 or LM) or Atg5-cKO B cells (Cr2 cre and Cd79a cre) and CFSE-stained OT-II cells were performed. Proliferation was assessed by measuring the dilution of the fluorescent signal by flow cytometry after 3 days of culture. Cells were gated on CFSE+ and TCRB+ cells and CD44 staining was performed to ensure that the decrease of CFSE staining correlated to the activation of OT-II cells. B cells are stimulated either by plate-adsorbed antigen at different concentrations (Fab’2 anti-IgM-OVAL, 10, 5, 2.5 µg/mL; on the left) or by a soluble antigen (F(ab’)2 anti-IgM-OVAL, 10 µg.mL−1; on the right). (b) Percentages of proliferating cells obtained on n = 11 independent experiments (11 C57BL/6, 11 LM, 9 Cr2 cre, 6 Cd79a cre) with different conjugate concentrations (10, 5, 2.5 µg/ml for the adsorbed antigen mimic and 10 µg/mL for the soluble antigen mimic. Bars represent mean values ±SEM; **P < 0.01, *P < 0.05 paired Student t test. (c) Measurement at D15 of anti-OVAL IgM and IgG antibody titers by ELISA, in serum from animals immunized either by soluble OVAL, or OVAL-conjugated with latex beads, in the presence of alum. Each point represents individual anti-OVAL antibody titer. Bars represent the mean ± SEM. *P < 0.05 Mann-Whitney U test, no statistical difference between control mice (C57BL/6 and LM) were revealed. N = 2 to 5.
ATG5 is involved in cytoskeleton mobilization towards the immune synapse
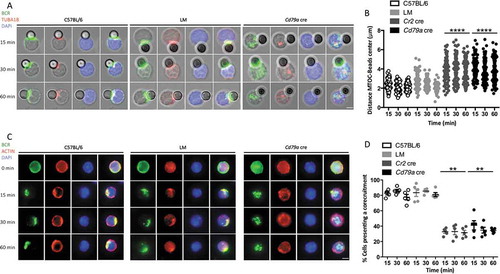
We next aimed at understanding the underlying defects in cytoskeleton mobilization that could explain the abnormal immune synapse formation in the context of ATG5 deficiency. We stimulated B cells with anti-IgM beads and measured in each cell the distance from the center of the bead to the centrosome. In control B cells, the centrosome is relocated at the proximity of the immune synapse in control B cells (, (b) and S7A), as previously described. In contrast, ATG5-deficient B cells fail to relocate the centrosome, which could explain the abnormal synapse formation in these cells. Actin cytoskeleton has also been shown to participate in the formation of the immune synapse and in the recruitment of the MIIC [Citation21–Citation23]. After stimulation, the actin network and BCR molecules indeed concentrate at a focal point of the cell in control B cells (, (d) and S7B) contrary to ATG5-deficient B cells as confirmed by the lower colocalization index. We thus hypothesize that ATG5 participates in the focal recruitment of MHC-II-containing vesicles at the synapse through mobilization of the centrosome and the actin cytoskeleton.
Figure 7. ATG5 is involved in cytoskeleton mobilization near the immune synapse. (a) Representative images obtained for the analysis of BCR and TUBA1B localization after various times of BCR engagement by anti-IgM beads (T = 15; 30; 60 min) in control (C57BL/6 and LM) or ATG5-deficient (Cd79a cre) B cells. Images taken with x63 objective on a confocal setup. (b) Quantification of centrosome relocalization in control (C57BL/6 and LM) or ATG5-deficient (Cr2 cre and Cd79a cre) B cells, at various time points after BCR engagement (T = 15; 30; 60 min). The distance between the center of mass of the bead and the centrosome was calculated for each cell, for which individual value is plotted. Bars represent mean values ±SEM; ****P < 0.0001, Mann-Whitney U test. N = 5 individual experiments. (c) Representative images for the analysis of BCR and actin corecruitment, at indicated times following BCR engagement by anti-IgM antibody (T = 0; 15; 30; 60 min), in control (C57BL/6 and (LM) or ATG5-deficient (Cd79a cre) B cells. Images were taken with x63 objective on a confocal setup. (d) Quantification of BCR and actin network corecruitment in control (C57BL/6 and LM) or ATG5-deficient (Cr2 cre and Cd79a cre) B cells, at various time points after BCR engagement (T = 15; 30; 60 min). Percentages of cells with Pearson coefficient >0.5 in each independent experiment are plotted. Bars represent mean values ±SEM; **P < 0.01, Mann-Whitney U test no statistical difference between control mice (C57BL/6 and LM) were revealed. N = 5. Scale bar: 2 µm.
Identifications of ATG partners necessary for synapse formation
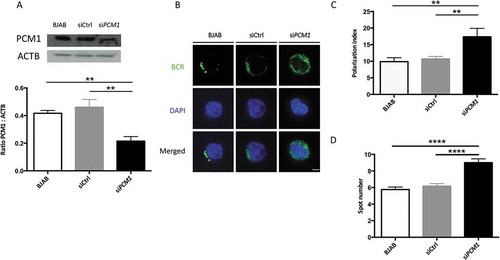
It has recently been shown that actin nucleation around the centrosome is lost upon BCR activation which allows its concentration at the synapse along with centrosome relocalization. This mechanism is linked to the presence of ACTR2 (ARP2 actin-related protein 2)-ACTR3 complex at the centrosome. We therefore wanted to identify potential ATG protein partners and the dynamics of the related complex upon activation. We performed ATG16L1 immunoprecipitation and identified its partners by a label-free mass spectrometry approach (Spectral Count quantification). We first identified ATG5 and to a lesser extent ATG12 in the precipitated complex. Their absence in the control precipitation demonstrates the specificity of the process in the context of murine cells (, Table S1). We reproducibly identified the centrosome-associated protein PCM1 in the complex, under steady-state conditions. Interestingly, after stimulation, the interaction gained in intensity. We confirmed ATG16L1-PCM1 interaction and its increase after stimulation in the BJAB human B cell line ( and Table S1). To confirm PCM1 involvement in BCR trafficking, we silenced its expression in BJAB cells using sequences validated in the article by Joachim et al [Citation24]. PCM1 expression was reproducibly decreased compared with the control condition (). In PCM1-silenced BJAB cells, we found an impaired BCR polarization () reflected both by index calculation () and spot number quantification (). Thus, we can conclude that, in a similar way to ATG5, PCM1 contributes to BCR polarization. It is likely that some components of the autophagy machinery, namely ATG5 and ATG16L1, cooperate with centrosome-associated molecules like PCM1 to form the immune synapse. This might allow centrosome relocalization to the synapse, local actin nucleation, and convergence with the antigen-processing machinery.
Figure 8. ATG proteins recruit the centrosome-associated protein PCM1, after BCR engagement. ATG16L1 was immunoprecipitated by a label-free method. Partners have been identified by spectrum number counting. The table shows the number of identified spectra for the indicated proteins on the left, in the following conditions: control (CTRL) immunoprecipitation with beads only (IP), IP-ATG16L1, for 3 independent biological and experimental replicates. In each case, non-stimulated (NS) or BCR-stimulated (S) conditions were evaluated. For each experiment, the ratio of spectra numbers between stimulated and non-stimulated conditions is indicated.
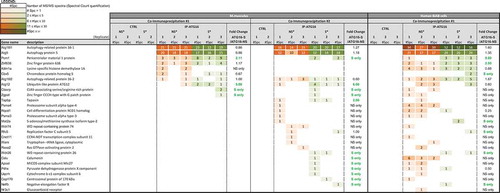
Figure 9. PCM1 is required for B cell polarization after BCR engagement. (a) BJAB cells were transfected with control siRNA, or siRNA targeting PCM1. Transfected and non-transfected BJAB cells were lysed. Top: PCM1 expression was assessed by immunoblot and loading control with ACTB staining was performed. Bottom: PCM1:ACTB intensity ratios were calculated. Means are shown in corresponding histograms, with bars standing for SEM. **P < 0.01 Mann-Whitney U test, N = 4). (b) Representative images obtained for the analysis of BCR localization stimulation by a soluble anti-human IgM at 60 min in non-transfected BJAB cells, or cells transfected with control siRNA (siCtrl) or siRNA directed against PCM1 (siPCM1). Images taken with x100 objective. (c) Polarization index of the BCR staining after stimulation in BJAB cells, or cells transfected with control siRNA (siCtrl) or siRNA directed against PCM1 (siPCM1). This index is the relative angle formed between the center of mass of the cell and the extremes of the staining distribution (Bars represent mean values per individual experiments ±SEM; **P < 0,001, Mann-Whitney U test. N = 4. (d) Quantification of the amount of BCR spots formed after stimulation in BJAB cells, or cells transfected with control siRNA (siCtrl) or siRNA directed against PCM1 (siPCM1). Bars represent mean values per cell ±SEM; ****P < 0.0001 Student test. N = 100 cells. Scale bar: 2 µm.
Discussion
In this work, we demonstrate that autophagy is integral to B cell polarization after BCR engagement. In line with previous reports [Citation11,Citation12], we confirm that the autophagy machinery is intimately linked to BCR trafficking. Although not conclusive about the precise nature of the vesicle, our work supports a role for the autophagy machinery in BCR trafficking, as ATG16L1 and LC3 localize with the internalized BCR in an ATG5-dependent manner. ATG5 is involved in several mechanisms distinct from canonical autophagy. Noteworthy in this context, endocytic processes in some settings such as LAP require part of the canonical autophagy machinery. We found that ATG5-dependent BCR polarization relies on the BECN1-PtdIns3K pathway and is independent of ULK1-dependent signaling. These results are in line with ATG5 involvement in a non-canonical form of autophagy, as observed for LAP. Electron microscopy observations as well as silencing experiments of LAP-specific components could be helpful to distinguish if autophagy per se regulates BCR trafficking or if ATG5 role is rather linked to endocytic events involving LC3 and ATG16L1.
BCR internalization allows the transport of cognate antigens to MIIC constituting an important step in B cell activation [Citation25]. Antigens are then processed and loaded onto MHC-II molecules to be potentially presented to cognate T cells that will provide help for final B cell differentiation [Citation26]. A role for autophagy in the presentation of certain types of antigens acquired through BCR engagement has been shown for citrullinated epitopes internalized after BCR engagement [Citation12]. It has been postulated that autophagy allows the relocation of the antigen internalized together with the BCR to peptidylarginine deaminase-containing compartments, where peptide citrullination occurs. Pharmacological inhibition of autophagy in B cells limits the presentation of citrullinated epitopes. However, a small unexplained decrease in antigen presentation has also been observed for non-modified epitopes. It thus seems that autophagy is important for the presentation of certain types of antigens, possibly through the modulation of BCR trafficking. This finding implies that in certain cases ATG5 would be required in vivo for the presentation of antigens to T cells and thus for GC formation. This is in opposition with reports published earlier, using mice with conditional deletion of Atg5 or Atg7 in B cells [Citation7,Citation9]. In these settings autophagy plays no role in GC formation, rendering unlikely a contribution of ATG in the processing and presentation of antigens acquired via the BCR. However, the first report indicates the use of T cell-dependent soluble antigens, which could explain the absence of any effect on GC formation related to antigen presentation. The second study also indicates the use of soluble antigens and integrates experimental infection by influenza virus reaching the same conclusion. We could thus still argue that in both immunization protocols the formation of an immune synapse is not necessary for the acquisition and processing of these types of antigens.
Some antigens cannot be internalized through pinocytosis or cannot reach secondary lymphoid organs without transport by APC. It is proposed that in several humoral immune reactions a significant part of antigens are presented in secondary lymphoid organs as immobilized complexes at the surface of APCs [Citation27]. In that case, B cells have to engage an immune synapse with the APC to efficiently process MHC class II-associated antigens. Antigen recognition by the BCR triggers synapse formation associated with lysosome and MHC-II molecule polarization at the cell-cell contact area [Citation19,Citation28]. Polarized B cells then release lysosomal content in the intercellular space, which facilitates antigen degradation before internalization and loading onto MHC class II molecules[Citation28]. Alternatively, or complementary to this, the synapse formation allows a sufficient mechanic force to untether the antigen from the surface. Our results indicate that in the case of antigens covalently linked with beads too large to be internalized, ATG5 deficiency in B cells leads to a reduction of specific IgG production. In contrast, immunization with soluble antigens leads a normal IgG response. These results suggest an impairment of GC formation in response to particulate antigens in the absence of ATG5. As mentioned above, a role for non-canonical autophagy in B cell homeostasis during GC formation has been demonstrated [Citation10]. We propose a role for ATG5-dependent trafficking pathways in GC formation after particulate antigen stimulation through synapse formation between B cells and APCs.
ATG5 activity contributing to the presentation of large particulate antigens could be linked to its involvement in B cell polarization necessary to efficiently process immobilized antigens. As a matter of fact, the proximity of MHC-II-containing vesicles with the contact site on the APC is thought to contribute to the efficacy of immobilized antigen loading after acquisition by the BCR. Although ATG5 is required for BCR clustering together with MIIC and lysosomes at one pole of the cell, stimulation with soluble antigens revealed efficient BCR internalization and partial colocalization with MHC-II molecules in ATG5-deficient B cells. BCR relocalization in this context is efficient enough for antigen access to MIIC. In contrast, there is little BCR-MHC-II colocalization when stimulating with particulate antigens, while BCR is indeed internalized. This confirms that BCR polarization is important for immobilized antigen processing and shows a major role for ATG5 in these settings. In the light of our results, this function is not linked to particulate antigen uptake per se, BCR endocytosis, lysosome exocytosis and/or optimization of traction forces. We rather speculate that ATG5 allows recruitment of the antigen processing machinery to BCR-containing vesicles. ATG5 expression is in contrast not mandatory for processing of soluble antigens that gain access to MIIC without requirement for B cell polarization.
ATG5 implication in immobilized antigen processing can be put in line with a report showing that partitioning defective 3 protein, a multidomain scaffolding protein required for the spatial organization of several important signaling proteins involved in B cell polarization, participates in the presentation of immobilized antigens, contrary to the ones internalized by pinocytosis [Citation29]. Other proteins are involved in BCR polarization as reviewed in [Citation27]. Among them, the small GTPase CDC42 (cell division cycle 42) allows the relocalization of lysosomes to the immune synapse [Citation28]. A recent article showed the major importance of CDC42 in B cell biology [Citation30]. Among the numerous defects observed, CDC42-deficient B cells are unable to present particulate antigens to T cells, which is linked to a polarization impairment. Interestingly, CDC42 is also involved in the polarization of osteoclasts [Citation31]. As for B cells, lysosomal secretion in osteoclasts occurs at one pole of the cell. In these specialized bone-resorbing cells this pole is in contact with the bone surface. Lysosomal secretion at this border requires the autophagy proteins ATG5, ATG7, ATG4B (autophagy related 4B, cysteine peptidase), LC3 and RAB7 (RAB7, member RAS oncogene family) [Citation32]. It thus seems that, at least in osteoclasts, polarization driven by CDC42 is linked to lysosomal exocytosis mediated by autophagic proteins. GJA1/CX43 (gap junction protein, alpha 1) also interacts with ATG16L1 at the plasma membrane to modulate autophagy [Citation33]. In B cells, GJA1 is activated upon BCR stimulation and facilitates B cell spreading [Citation34]. It is thus tempting to speculate that autophagy proteins such as ATG16L1 might be recruited via GJA1 to facilitate lysosomal and/or MIIC trafficking to the immune synapse. As we showed that antigens acquired through BCR internalization gain access to early endosomes in the absence of ATG5 and are endocytosed as efficiently as in normal cells, ATG5 might play a role downstream of BCR internalization. We propose that ATG5 links BCR endocytosis and centrosome recruitment.
In line with this, we identified in PCM1 a potential ATG protein partner in the context of B cell activation. A recent study showed that PCM1 regulates the recruitment of members of the GABARAP (gamma-aminobutyric acid receptor associated protein) family to form autophagosomes under starvation conditions [Citation24]. Thus, PCM1 could bridge centrosome components and some parts of the autophagy machinery. Before this study, PCM1 is already described as an LC3 interacting protein [Citation35] and is shown to allow actin nucleation around the centrosome together with ACTR2/3 complex [Citation36]. Of note, the ACTR2/3 complex has also been shown to interact with the centrosome under B cell steady state. After activation, this interaction is lost which allows actin nucleation at the synapse. We found that PCM1 loss in a human B cell line recapitulates BCR polarization defects observed in the absence of ATG5. We thus propose that autophagy proteins bridge the BCR internalization with actin nucleation around the relocalized centrosome. Without ATG5, PCM1-dependent centrosome relocalization is lost, leading to impaired actin nucleation at the synapse, which compromises polarization. It is also tempting to speculate about the role of autophagy proteins implicating PCM1 in the degradation of proteins linked to the localization of the centrosome. It has been shown during the formation of the primary cilium that under starvation the protein OFD1 (OFD1, centriole and centriolar satellite protein) is degraded through autophagy allowing centrosome relocalization to the plasma membrane and then the generation of the cilium [Citation35]. Interestingly LC3 in this context interacts with PCM1 and OFD1. Such a movement of the centrosome in B cells, necessary for synapse formation, could be dependent on autophagic degradative mechanisms. An important issue would be to clarify how the autophagy machinery regulates centrosome movements. PCM1 interactome should be assessed in this context and new studies are necessary to identify other partners involved in vesicle trafficking at the later stages of synapse formation.
In summary, ATG5, and possibly other members of the autophagy machinery, are involved in BCR trafficking and in the recruitment of lysosomes and MIIC in polarized B cells. This phenomenon is integral to the acquisition and presentation of particulate antigens. These findings suggest that autophagy proteins are important factors controlling B cell terminal activation steps, particularly those required for an efficient humoral immune response against particulate antigens.
Materials and methods
Mice
Cr2 cre Atg5flox/- (Cr2 cre) and Cd79a cre Atg5flox/- (Cd79a cre) mice have been described previously [Citation13]. In the absence of ATG5, and except for a minor decrease in peripheral B-cell subtypes, these mice present a normal B-cell development. Control mice consist of wild type C57BL/6 mice and LM mice i.e. from the same breeding as Cr2 cre or Cd79a cre which are Cre-expressing mice, heterozygous for Atg5 with one wild-type allele and one deleted allele. Results obtained with LM mice were pooled for analysis. Atg5 allele was identified in Cr2 cre and Cd79a cre transgenes as described in [Citation13]. OT-II mice, expressing a transgenic TCR specific for a peptide derived from OVAL loaded on MHC-II, were purchased from Harlan. All mice were bred and maintained in accordance with guidelines of the local Institutional Animal Care and Use Committee (CREMEAS, authorization number AL/07/078/02/13).
Cell culture and isolation
Spleen cells were collected from C57BL/6, LM, B6 Atg5flox/- Cr2 cre and B6 Atg5flox/- Cd79a cre mice. B cells were purified by negative selection using the Pan B cell isolation Kit (Miltenyi Biotec, 130–095–813) according to the manufacturer’s instructions. Resulting T cell receptor beta chain TCRB− and PTPRC/B220+ mouse B cell preparations were >95% pure as controlled by flow cytometry. Splenic OT-II cells were purified by negative selection using the Dynal T cell Negative Isolation Kit (Dynal-Life Technologies, 114-13D) according to the manufacturer’s instructions. Resulting TCRB+ and PTPRC/B220− mouse T cell preparations were >95% pure as determined by flow cytometry. We also used the BJAB human Burkitt lymphoma cell line. All cultures were performed at 37°C, 5% CO2 in RPMI 1640 medium (Lonza BioWhittaker, 12–702) supplemented with 10% fetal calf serum (FCS), 10 µg/mL gentamicin (Lonza BioWhittaker, BE02-012E), 10 mM 4-(2-hydroxyethyl)-1-piperazineethanesulfonic acid, pH = 7.4 (Lonza BioWhittaker, CC-5024) and 0.05 mM β-mercaptoethanol (Gibco, 31350010).
ATG5 and PCM1 silencing in BJAB human B cell line
We used the pTRIP.CMV.GFP lentiviral vector for short hairpin RNA (shRNA) stable expression. The constructions of pTRIP-shATG5, and pTRIP-shCtrl were kindly provided by Prof. Christian Münz (Institute of Experimental Immunology-University of Zurich). Lentiviral particles were produced by transient 293T cell transfection with an encapsidation plasmid and a vesicular stomatitis virus (VSV) envelope expression plasmid together with the pTRIP vectors. Viruses were then used to transduce 3.105 BJAB cells in the presence of polybrene (Sigma Aldrich, TR-1003). GFP-positive BJAB human B cells were sorted by flow cytometry with a FACS Aria cell sorter (BD Biosciences, Franklin Lakes, NJ, USA). Alternatively, BJAB cells were transfected using the Amaxa 4D-Nucleofector kit (Lonza, V4XP-3024) following supplier recommendations. siRNA were obtained from Dharmacon Inc. using sequences previously described [Citation24].
Flow cytometry
All antibodies used for flow cytometry analyses were purchased from BD Biosciences: allophycocyanin-cyanine 7-labeled anti-mouse TCRB (TRB in humans)/TCR-β (clone H57-597, 553171), allophycocyanin-labelled anti-mouse CD44 (clone IM7, 559250), or allophycocyanin-labelled anti-mouse PTPRC/B220/CD45RB (clone RA3-6B2, 553092). Cells were incubated with fluorochrome-conjugated antibodies and in the case of mouse cell staining, rat anti-mouse FCGR3 and FCGR2B (CD16 and CD32) monoclonal antibody (clone 2.4G2, 553142) was used to block Fc receptors, for 15 min at 4°C in phosphate-buffered saline (PBS; Lonza, 17-516F) pH 7.4 containing 2% (v:v) FCS. For proliferation assays, cells were stained with carboxyfluorescein succinimidyl ester (CFSE; Sigma-Aldrich, 51888) before stimulation. For lysosome staining, cells were incubated with 50 nm LysoTracker Deep Red (L12492, ThermoFischer) for 30 min at 37°C. Data were collected on a Gallios flow cytometer (Beckman Coulter, Brea, CA, USA) and analyzed using FlowJo software (Tree Star, Ashland, OR, USA).
Western immunobloting
The antibodies used for western immunoblotting are specific for ACTB (Santa Cruz Biotechnology, clone C4, sc-47778), LC3 (MBL, clone 51–11, ref M115–3), ATG5 (Novus, NB-110–53818), phospho-MAPK1/ERK2-MAPK3/ERK1, MAPK1/3, phospho-SYK, SYK, PCM1, phospho-ULK1 and ULK1 (Cell Signaling Technology, 9101, 9102, 2710, 2712, 5213, 6888, 8054, respectively). In some conditions, lysosomal protease inhibitors E64d and pepstatin A (Sigma-Aldrich, P5318 and E8640) were added at 5 µg/mL each. When indicated, cells were treated with goat anti-IgM F(ab’)2 fragment (5 µg/mL; Jackson Immunoresearch, 115–006–020). To evaluate the autophagosomal membrane load, whole cell proteins were extracted from cultured cells using Laemmli buffer (125 mM Tris-HCl, pH 6.8, 2% [w:v] sodium dodecyl sulfate, 10% [v:v] glycerol, 5% [v:v] β-mercaptoethanol). Cell lysates were separated on 4–20% gradient gels (Bio-Rad, 4561096) and then transferred onto a polyvinylidene difluoride membrane. Membranes were blocked with PBS containing 0.1% (v:v) Tween 20 (PBS-T; Sigma-Aldrich, P2287) and 3% (w:v) nonfat dry milk for 1 h and then incubated overnight at 4°C with 1 μg/mL anti-LC3 antibody in PBS-T containing 1% (w:v) nonfat dry milk, or for 1 h at room temperature (RT) with 1 µg/mL anti-ATG5 antibody in PBS-T containing 1% nonfat dry milk. After washing with PBS-T, membranes were incubated for 30 min at RT with goat anti-mouse IgG antibody (Southern Biotech, 1030–05). Signal was generated using enhanced chemiluminescence detection reagents (Immobilon Western Millipore, WBKLS0500).
Pharmacological inhibition of autophagy
Sorted B cells (2.106 cells/mL) were treated with the PtdIns3K inhibitor wortmannin (Sigma-Aldrich, W1628) or the ULK1 inhibitor SBI-0206965 (Sigma-Aldrich, SML1540) at 10 μM and 300 nM, respectively, for 3 h at 37°C, 5% CO2. Pepstatin A and E64d lysosomal inhibitors were added in some conditions during the culture in doses described above.
Anti-IgM–OVAL conjugate generation
Anti-IgM F(ab’)2–OVAL conjugates (anti-IgM F[ab’]2–OVAL) were obtained by coupling a goat anti-mouse IgM F(ab’)2 with OVAL (Sigma-Aldrich, A5503) using the ‘Protein-Protein Conjugation kit’ (Solulink, S-9010–1). Coupling is performed according to the manufacturer’s protocol and led to stable and covalent bis-arylhydrazone bonds between the two molecules.
Antigen presentation assays
F(ab’)2 goat anti-mouse IgM (100 μL, 10 μg/mL), OVAL (10 μg/mL) or anti-(IgM F[ab’2]–OVAL) (at variable concentrations) were adsorbed in wells of a MaxiSorp plate (Thermo Scientific Nunc, 44–2404–21). For experiments with soluble anti-(IgM F[ab’]2–OVAL), conjugates are directly added in culture medium with B cells at a concentration of 10 μg/mL. Purified B cells (100 μL, 106 cells/mL) are added and incubated in RPMI medium for 4 h at 37°C. OT-II T cells previously stained with CFSE accordingly to the manufacturer’s protocol are added in each well with anti-CD28 antibody (5 μg/mL; clone, BD Bioscience, 37.51). OT-II cell activation and proliferation are assessed 3 days later by flow cytometry. Antigen uptake experiments were realized with a similar protocol using an anti-mouse IgM conjugated with FITC (10 μg/mL; Jackson Immunoresearch, 115–096–020).
Anti-IgM–OVAL bead conjugation
3 μm latex NH2-beads (Polyscience, 17145–5) were activated overnight with 8% (v:v) glutaraldehyde. Beads were washed with PBS and incubated overnight with an OVAL solution. Conjugation efficacy is evaluated by measuring the absorbance of OVAL solution at 280 nm before and after the conjugation process. NH2-remaining groups are then blocked by addition of ethanolamine (Sigma-Aldrich, E9508).
Immunization
Eight- to twelve-week-old mice were injected intraperitoneally (i.p.) on days 0 and 10 and bled at day 15 after the first immunization. Mice were injected with 5 µg soluble OVAL or with an OVAL-bead suspension with equivalent protein load (5 µg) in alum (Sigma-Aldrich, 202614).
Antibody detection by enzyme-linked immunosorbent assays (ELISA)
IgG or IgM titers were measured in serum from immunized mice. Measurement of anti-OVAL specific antibodies was performed in 96-wells ELISA Maxisorp plates coated with OVAL (10 µg/mL) in 50 mM sodium carbonate buffer, pH 9.6. Wells were blocked with 0.1% (w:v) Tween 20 5% (w:v) nonfat milk in PBS for 1 h at 37°C and incubated with diluted sera for 1 h at 37°C. Horseradish peroxidase-conjugated anti-mouse isotype-specific antibodies (Jackson Immunoresearch, 115–035–020 and 115–035–003) were used for detection. Absorbance was measured at 450 nm after addition of tetramethylbenzidine (Sigma-Aldrich, T0440) to the wells and reaction stop with 1 M HCl (Sigma-Aldrich, 35328). Titers were determined as the last dilution corresponding to an absorbance equal or superior to 0.2.
Immunostaining
Lab-Tek chamber slides (Thermo Scientific Nunc, 154453) are coated with a poly-L-Lysine solution (Sigma-Aldrich, P8920) diluted in ultrapure water (Lonza, BE17-724F) 0.02% (v:v) to enhance cellular adhesion. Spleen cells (500,000) are added in each chamber before slide incubation at 37°C for 30 min. BCR is then stimulated with an F(ab’)2 anti-IgM coupled to Alexa Fluor 647 (5 μg/mL; donkey anti-mouse polyclonal antibody; Jackson Immunoresearch, 115–606–020). Cells are fixed in 2% (v:v) paraformaldehyde in PBS and washed in Tris-buffered saline (TBS; 50 mM Tris, 150 mM NaCl, pH 7.4) before incubation in a permeabilization solution (0.05% [v:v] Triton X-100 (GE Healthcare, 17–1315–01), 2% (w:v) bovine serum albumin [BSA; Euromedex, 04–100–812-E] in TBS for 1 h at RT. Primary anti-LAMP1 antibodies (2.5 μg/mL; rabbit anti-mouse polyclonal antibody; Abcam, ab24170), anti-LC3 (1 μg/mL rabbit anti-mouse polyclonal antibody; MBL International Corporation, NB100-2220), anti-ATG5 (2.5 μg/mL; rabbit anti-mouse polyclonal antibody; Novus, NB110-53818), anti-ATG16L1 (5 μg/mL; rabbit anti-mouse polyclonal antibody; Novus, NB110-53818), biotinylated anti-I-A/I-E (2 μg/mL; mouse anti-mouse; BD Bioscience, 553622), anti-EEA1 (1 μg/mL; rabbit anti-mouse monoclonal antibody; Cell signaling Technology, 3288), anti-TUBA1B coupled with an Alexa Fluor dye (647) (1 μg/mL; rabbit anti-mouse monoclonal antibody; Cell signaling Technology, 2125) and Texas-red phalloidin (Sigma-Aldrich, T7471) are added in some conditions to cell suspensions in 1% (w:v) BSA TBS buffer, overnight at 4°C. Staining is finalized by adding secondary antibodies (2 μg/mL; goat anti rabbit coupled with an Alexa Fluor dye [488 or 555]; Molecular Probes, A-11070 and A-21430, respectively) or streptavidin (2 μg/mL; coupled with an Alexa Fluor dye [488 or 546], Molecular Probes, S-11223 and S-11225, respectively). DAPI (4',6-diamidino-2-phenylindole dihydrochloride) is used for DNA staining (50 μg/mL; Molecular Probes, D1306) for 30 min at RT. Slides are then mounted in Dako fluorescence mounting medium (Dako North America Inc., S3023) and observed under a confocal microscope: Zeiss Axio Observer Z1 with Zeiss LSM 700, 780 or Yokogawa spinning disk confocal heads with adapted settings (Yokogawa Spinning Disk, Zeiss).
Quantification of spot numbers, polarization and colocalization
Cell images were acquired using a 63x Plan Apochromat oil immersion NA1.4 objective and using a 7x zoom or a 100x Plan Apochromat oil immersion NA1.4 objective on a spinning disk system. All pictures were acquired under the same conditions (laser power and amplification gain). The focus was done at the median plane. Cells and spots were segmented using ImageJ Auto Threshold tools. This allowed individualizing cells and estimating the number of spots per cell. We used ImageJ macro and java languages to systemize this analysis.
Each cell was divided in 72 parts (each making an angle of 5 degrees) centered on the geometrical center of the cell. The sum of gray levels was done in each part for the staining of interest giving a list of 72 values that were then normalized by the sum of gray values in the whole cell. List of each cell was then centered to have the maximum intensity in the part 37 (middle part). This process was systematized in java language in ImageJ. Centered lists of comparable cells corresponding to each condition could then be added altogether. We obtained a graph for each condition and could then fit these data to a Gaussian curve, which indicates the extreme angles of staining distribution and then a polarization index.
We used the colocalization finder plugin in ImageJ for each cell. We determined the minimum and maximum gray values of spots for each channel and used these extreme values to calculate the Pearson coefficient. Cells with a Pearson coefficient above 0.5 were considered as showing colocalization.
BCR and actin corecruitment was quantified as follows: cells were acquired using a 63x Plan Apochromat oil immersion objective and a 7x zoom on a fluorescence microscope (Axiovert 200M, Zeiss Oberkochen, Germany). Pictures were acquired under the same conditions (laser power and amplification gain). Each cell was divided in 36 parts of 10 degrees centered on the geometrical center of the cell. Like previously, the sum of gray levels was done in each part for both actin and BCR staining. Then we determined a Pearson coefficient for each cell and considered cells positive when Pearson coefficient >0.5.
For experiments involving stimulation with beads, we specifically removed the fluorescent signal from the beads themselves in order to avoid interference of these signals with quantifications. To do so we segmented the beads in the bright field channel and removed the signal from these masks in the fluorescent channels
MHC-II crosslinking
Sorted B cells, beforehand adsorbed on poly-L treated lab-Tech chamber slides, were incubated with an anti-I-A I-E antibody (2 μg/mL) for 20 min at 4°C in PBS. I-A I-E crosslinking was achieved by the addition of a secondary antibody (2 μg/mL; ThermoFisher, A21208) coupled with Alexa Fluor 488, diluted in pre-heated RPMI medium for 1 h at 37°C, 5% CO2. Cells were fixed and stained by DAPI as previously described and observed under a confocal microscope.
ATG16L1 coimmunoprecipitation and mass spectrometry analysis
ATG16L1 endogenous protein was immunoprecipitated from murine B cells and human BJAB cells using magnetic microparticles (MACS purification system; Miltenyi Biotech, 130–092–947) according to the manufacturer’s instructions and as previously described [Citation37]. Briefly, µMACS protein A/G microbeads were coated with a monoclonal ATG16L1 antibody (NB110-53818, Novus), whereas controls were designed as magnetic beads coated with Protein A/G only. Coimmunoprecipitation experiments were carried out in triplicates, on nonstimulated and stimulated cells. Proteins were eluted out of the magnetic stand with the SDS-loading buffer from the kit.
Samples were prepared for mass spectrometry analyses as described in [Citation38]. Briefly, proteins were precipitated with 0.1 M ammonium acetate in methanol. After a reduction-alkylation step (5 mM dithiothreitol, 10 mM Iodoacetamide), proteins were digested overnight with 200 ng of modified sequencing-grade trypsin (Promega, V5111) in 50 mM ammonium bicarbonate. Resulting peptides were vacuum dried in a SpeedVac concentrator and resuspended in water containing 0.1% (v:v) FA (solvent A) before being injected on nanoLC-MS/MS (EASY-nanoLC-1000 coupled to a QExactive+mass spectrometer, Thermo Electron, Waltham, MA, USA). Peptides were eluted from the C-18 analytical column (75 μm ID x 15 cm, PepMap 100, Thermo) with a 5–40% acetonitrile gradient (solvent B) for 160 min. Data were acquired under discovery mode and searched against the M. musculus and H. sapiens taxonomies from the UniprotKB database with a decoy strategy. Peptides were identified with the Mascot algorithm (version 2.5, Matrix Science, London, UK) and data were further imported in Proline 1.4 software (http://proline.profiproteomics.fr/). Proteins were validated on Mascot pretty rank equal to 1, and 1% false-discovery rate on both peptide spectrum matches (PSM score) and protein sets (Protein Set score). Proteins were considered as partners according to the following rule: absence from the unstimulated and stimulated controls and sorted by decreasing number of spectra.
Statistical analyses
All data were analyzed with Prism software (GraphPad, San Diego, CA) using two-tailed Student t tests when Gaussian distribution could be assumed. When sample number was too small to ensure about normality, the Mann Whitney U Test was performed. For colocalization and corecruitment experiments, a two-tailed Pearson correlation coefficient was calculated for each cell. We defined effective colocalization or corecruitment as cells presenting a Pearson correlation coefficient superior to 0.5. Error bars represent SEM.
Supplemental Material
Download Zip (17 MB)Acknowledgments
We thank Prof. Noboru Mizushima for the gift of Atg5f/f mice and Prof. Christian Münz for the gift of pTRIP-shAtg5, pTRIP-shCtrl. We thank Dr Christopher Mueller and Delphine Bouis for careful reading of the manuscript and valuable advice. This work was funded by the French Centre National de la Recherche Scientifique, the Laboratory of Excellence Medalis (ANR-10-LABX-0034) and the EquipEx program I2MC (ANR-11-EQPX-022), Initiative of Excellence (IdEx), Strasbourg University, the “Fondation Arthritis Courtin”, and the “Ligue Contre le Cancer”. It was also supported by grants from EU-funded (ERDF) project INTERREG V “RARENET”. Johan Arnold was a recipient of predoctoral fellowships from the Ministère de la Recherche et de l’Enseignement Supérieur and from the Association de Recherche Contre le Cancer; Diane Murera of a predoctoral fellowship from the Fond National de Recherche of Luxembourg; Florent Arbogast of a predoctoral fellowship from the Ministère de la Recherche et de l’Enseignement Supérieur. The mass spectrometry instrumentation was funded by the University of Strasbourg, IdEx “Equipement mi-lourd” 2015. We thank Jerome Mutterer for his plugin adaptation.
Disclosure statement
No potential conflict of interest was reported by the authors.
Supplementary Material
Supplementary data can be accessed here
Additional information
Funding
Related Research Data
References
- Deretic V, Saitoh T, Akira S. Autophagy in infection, inflammation and immunity. Nat Reviews Immunol. 2013 Oct;13(10):722–737. PubMed PMID: 24064518.
- Gros F, Muller S. Pharmacological regulators of autophagy and their link with modulators of lupus disease. Br J Pharmacol. 2014 Oct;171(19):4337–4359. PubMed PMID: 24902607; PubMed Central PMCID: PMC4209143.
- He MX, McLeod IX, Jia W, et al. Macroautophagy in T lymphocyte development and function. Front Immunol. 2012;3:22. PubMed PMID: 22566906; PubMed Central PMCID: PMC3342206.
- Miller BC, Zhao Z, Stephenson LM, et al. The autophagy gene ATG5 plays an essential role in B lymphocyte development. Autophagy. 2008 Apr;4(3):309–314. PubMed PMID: 18188005; eng.
- Clarke AJ, Riffelmacher T, Braas D, et al. B1a B cells require autophagy for metabolic homeostasis and self-renewal. J Exp Med. 2018 Feb 5;215(2):399–413. PubMed PMID: 29326381; PubMed Central PMCID: PMC5789411.
- Chen M, Hong MJ, Sun H, et al. Essential role for autophagy in the maintenance of immunological memory against influenza infection. Nat Med. 2014 May;20(5):503–510. PubMed PMID: 24747745; PubMed Central PMCID: PMC4066663.
- Chen M, Kodali S, Jang A, et al. Requirement for autophagy in the long-term persistence but not initial formation of memory B cells. J Immunology. 2015 Feb 11 PubMed PMID: 25672753. DOI:10.4049/jimmunol.1403001.
- Conway KL, Kuballa P, Khor B, et al. ATG5 regulates plasma cell differentiation. Autophagy. 2013 Apr;9(4):528–537. PubMed PMID: 23327930; PubMed Central PMCID: PMCPmc3627668. eng.
- Pengo N, Scolari M, Oliva L, et al. Plasma cells require autophagy for sustainable immunoglobulin production. Nat Immunol. 2013 Mar;14(3):298–305. PubMed PMID: 23354484.
- Martinez-Martin N, Maldonado P, Gasparrini F, et al. A switch from canonical to noncanonical autophagy shapes B cell responses. Science (80-). 2017 Feb 10;355(6325):641–647. (New York, NY). PubMed PMID: 28183981.
- Chaturvedi A, Dorward D, Pierce SK. The B cell receptor governs the subcellular location of Toll-like receptor 9 leading to hyperresponses to DNA-containing antigens. Immunity. 2008 Jun;28(6):799–809. PubMed PMID: 18513998; PubMed Central PMCID: PMC2601674.
- Ireland JM, Unanue ER. Autophagy in antigen-presenting cells results in presentation of citrullinated peptides to CD4 T cells. J Exp Med. 2011 Dec 19;208(13):2625–2632. PubMed PMID: 22162830; PubMed Central PMCID: PMCPmc3244027. eng.
- Arnold J, Murera D, Arbogast F, et al. Autophagy is dispensable for B-cell development but essential for humoral autoimmune responses [Original Paper]. Cell Death Differ. 2016 May;23(5):853–864. PubMed PMID: 26586568; PubMed Central PMCID: PMCPMC4832104.
- Taylor RB, Duffus WP, Raff MC, et al. Redistribution and pinocytosis of lymphocyte surface immunoglobulin molecules induced by anti-immunoglobulin antibody. Nat New Biol. 1971 Oct 20;233(42):225–229. PubMed PMID: 20480991.
- Schreiner GF, Unanue ER. Opinions: capping and the Lymphocyte: models for membrane reorganization. J Immunol. 1977 November 1;119(5):1549–1551.
- Fooksman DR. Organizing MHC class II presentation. Front Immunol. 2014;5:158. PubMed PMID: 24782863; PubMed Central PMCID: PMCPMC3989578. eng.
- Furuta K, Ishido S, Roche PA. Encounter with antigen-specific primed CD4 T cells promotes MHC class II degradation in dendritic cells. Proc Natl Acad Sci USA. 2012 Nov;109(47):19380–19385. PubMed PMID: 23129633; PubMed Central PMCID: PMCPMC3511074. eng.
- Egan DF, Chun MG, Vamos M, et al. Small molecule inhibition of the autophagy kinase ULK1 and identification of ULK1 substrates. Mol Cell. 2015 Jul;59(2):285–297. PubMed PMID: 26118643; PubMed Central PMCID: PMCPMC4530630. eng.
- Batista FD, Iber D, Neuberger MS. B cells acquire antigen from target cells after synapse formation. Nature. 2001 May 24;411(6836):489–494. PubMed PMID: 11373683.
- Batista FD, Neuberger MS. B cells extract and present immobilized antigen: implications for affinity discrimination. EMBO J. 2000 Feb 15;19(4):413–520.
- Vascotto F, Lankar D, Faure-Andre G, et al. The actin-based motor protein myosin II regulates MHC class II trafficking and BCR-driven antigen presentation. J Cell Biol. 2007 Mar 26;176(7):1007–1019. PubMed PMID: 17389233; PubMed Central PMCID: PMCPMC2064085.
- Treanor B, Depoil D, Bruckbauer A, et al. Dynamic cortical actin remodeling by ERM proteins controls BCR microcluster organization and integrity. J Exp Med. 2011 May 09;208(5):1055–1068. PubMed PMID: 21482698; PubMed Central PMCID: PMCPMC3092358.
- Fleire SJ, Batista FD. Studying cell-to-cell interactions: an easy method of tethering ligands on artificial membranes. Methods Mol Biol. 2009;462:145–154. PubMed PMID: 19160666.
- Joachim J, Razi M, Judith D, et al. Centriolar satellites control GABARAP Ubiquitination and GABARAP-Mediated Autophagy. Curr Biol. 2017 Jul;27(14):2123–2136.e7. PubMed PMID: 28712572; PubMed Central PMCID: PMCPMC5526835. eng.
- Avalos AM, Ploegh HL. Early BCR events and antigen capture, processing, and loading on MHC class II on B cells. Front Immunol. 2014;5:92. PubMed PMID: 24653721; PubMed Central PMCID: PMCPMC3948085. eng.
- Mitchison NA. T-cell-B-cell cooperation. Nat Reviews Immunol. 2004 Apr;4(4):308–312. PubMed PMID: 15057789.
- Yuseff MI, Pierobon P, Reversat A, et al. How B cells capture, process and present antigens: a crucial role for cell polarity. Nat Reviews Immunol. 2013 Jul;13(7):475–486. PubMed PMID: 23797063.
- Yuseff MI, Reversat A, Lankar D, et al. Polarized secretion of lysosomes at the B cell synapse couples antigen extraction to processing and presentation [Research Support, Non-U.S. Gov’t]. Immunity. 2011 Sep 23;35(3):361–374. PubMed PMID: 21820334.
- Reversat A, Yuseff MI, Lankar D, et al. Polarity protein Par3 controls B-cell receptor dynamics and antigen extraction at the immune synapse. Mol Biol Cell. 2015 Apr 1;26(7):1273–1285. PubMed PMID: 25631815.
- Burbage M, Keppler SJ, Gasparrini F, et al. Cdc42 is a key regulator of B cell differentiation and is required for antiviral humoral immunity. J Exp Med. 2015 January 12;212(1):53–72.
- Ito Y, Teitelbaum SL, Zou W, et al. Cdc42 regulates bone modeling and remodeling in mice by modulating RANKL/M-CSF signaling and osteoclast polarization. J Clin Invest. 2010 Jun;120(6):1981–1993. PubMed PMID: 20501942; PubMed Central PMCID: PMCPMC2877929. eng.
- DeSelm CJ, Miller BC, Zou W, et al. Autophagy proteins regulate the secretory component of osteoclastic bone resorption. Dev Cell. 2011 November 4;21(5):966–974. PubMed PMID: PMC3244473.
- Bejarano E, Yuste A, Patel B, et al. Connexins modulate autophagosome biogenesis [Article]. Nat Cell Biol. 2014;16(5):401–414. 05//print.
- Machtaler S, Dang-Lawson M, Choi K, et al. The gap junction protein Cx43 regulates B-lymphocyte spreading and adhesion. J Cell Sci. 2011 Aug 1;124(Pt 15):2611–2621. PubMed PMID: 21750189.
- Tang Z, Lin MG, Stowe TR, et al. Autophagy promotes primary ciliogenesis by removing OFD1 from centriolar satellites. Nature. 2013 Oct 10;502(7470):254–257. PubMed PMID: 24089205; PubMed Central PMCID: PMCPMC4075283.
- Farina F, Gaillard J, Guerin C, et al. The centrosome is an actin-organizing centre. Nat Cell Biol. 2016 Jan;18(1):65–75. PubMed PMID: 26655833; PubMed Central PMCID: PMCPMC4880044.
- Stoetzel C, Bar S, De Craene JO, et al. A mutation in VPS15 (PIK3R4) causes a ciliopathy and affects IFT20 release from the cis-Golgi. Nat Commun. 2016 Nov 24;7:13586. PubMed PMID: 27882921; PubMed Central PMCID: PMCPMC5123056.
- Chicher J, Simonetti A, Kuhn L, et al. Purification of mRNA-programmed translation initiation complexes suitable for mass spectrometry analysis. Proteomics. 2015 Jul;15(14):2417–2425. PubMed PMID: 25914180.