
ABSTRACT
Human Atg4 homologs are cysteine proteases, which play key roles in the macroautophagy/autophagy process by cleaving Atg8 homologs for conjugation to lipid membranes and for deconjugation of Atg8 homologs from membranes. Expression of ATG4B is significantly increased in colorectal cancer cells compared to normal cells, suggesting that ATG4B may be important for cancer biology. Inhibition of ATG4B may reduce the autophagy activity, thereby sensitizing cancer cells to therapeutic agents. Thus, developing specific and potent ATG4B inhibitors for research as well as for potential therapeutic uses is highly needed. In this study, we integrated in silico screening and in vitro assays to discover a potent ATG4B inhibitor, named S130, from a noncommercial library. This chemical binds to ATG4B with strong affinity and specifically suppresses the activity of ATG4B but not other proteases. S130 did not cause the impairment of autophagosome fusion, nor did it result in the dysfunction of lysosomes. Instead, S130 might attenuate the delipidation of LC3-II on the autolysosomes to suppress the recycling of LC3-I, which normally occurs after LC3-II cleavage by ATG4B. Intriguingly, S130 induced cell death, which was accompanied with autophagy stress and could be further exacerbated by nutrient deprivation. Such cytotoxicity could be partially reversed by enhancing ATG4B activity. Finally, we found that S130 was distributed in tumor tissues in vivo and was also effective in arresting the growth of colorectal cancer cells. Thus, this study indicates that ATG4B is a potential anticancer target and S130 might be a novel small-molecule candidate for future cancer therapy.
Introduction
Autophagy is an evolutionarily conserved and stress-responsive catabolic process, whereby cellular components and damaged organelles are sequestered within autophagosomes for lysosomal degradation [Citation1]. It is now widely accepted that autophagy plays crucial roles in cellular and tissue homeostasis, metabolism, development, and immunity. Complete or partial dysregulation of the autophagic functions can exacerbate tumorigenesis, infectious diseases, and neurodegenerative disorders. Therefore, autophagy has been highlighted as a novel therapeutic target with a wide range of beneficial effects on human diseases [Citation2–Citation5]. There is increasing evidence that autophagy promotes cell survival in solid tumors that undergo nutrient deprivation or chemotherapy. On the contrary, inhibition of autophagy has the potential to limit tumor progression and increase the efficacy of chemotherapeutic agents [Citation1,Citation6,Citation7].
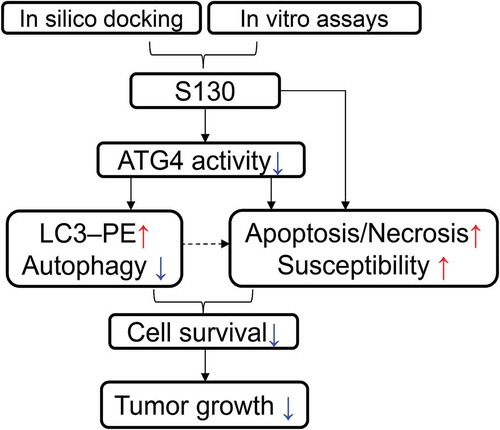
Figure 9. Illustration of the screening strategy for ATG4B inhibitors and the proposed anti-tumor mechanisms of S130.
Autophagy is a multi-step process. Autophagosome biogenesis requires 2 ubiquitin-like conjugation systems: the Atg12–Atg5 and the Atg8–phosphatidylethanolamine (PE) systems. Atg4 is a cysteine protease containing an Atg8-interacting motif (referred to as an LC3-interacting region in mammals). This protease plays an important role in preparing Atg8 for conjugation to lipid membranes, as well as for the deconjugation of Atg8 from autophagosomes in yeast [Citation8]. The latter step is necessary for reusing Atg8 upon autophagy completion and affects membrane formation on the phagophore (the autophagosome precursor) membrane [Citation9]. There is only one Atg4 protein in yeast, and deletion of ATG4 impairs the autophagy process [Citation10]. In mammals, there are 4 Atg4 homologs (ATG4A, ATG4B, ATG4C, and ATG4D) [Citation8], and at least 7 human Atg8 homologs including 2 subfamilies: the MAP1LC3/LC3 (microtubule associated protein 1 light chain 3) subfamily and the GABARAP (GABA type A receptor-associated protein) subfamily [Citation11]. Of the 4 cysteine proteases, ATG4B is 1500-fold more catalytically efficient for LC3B activation than the other ATG4 homologs, whereas ATG4A is most selective toward GABARAPL2/GATE16 (GABA type A receptor associated protein like 2) [Citation12]. The delipidation of Atg8 by Atg4 from the autophagosomal membrane or other types of membranes with lipidated Atg8 has been suggested as a possible regulatory step for both efficient autophagosome formation and maturation [Citation13,Citation14]. Deletion of ATG4B, or expression of a dominant-negative mutant, arrests autophagy as measured by the increased level of SQSTM1/p62 and the lack of lipidated LC3 [Citation15,Citation16]. Furthermore, overexpression of ATG4B also leads to arrested autophagy flux due to enhanced LC3–PE deconjugation [Citation17]. In addition, lipidated LC3 can also be accumulated by silencing of ATG4B in HCT116 cells [Citation18]. Although the genetic deletion of ATG4B results in a notable defect in autophagy, Atg4b-knockout (KO) mice are viable and fertile without obvious physiological and biochemical alteration. This is likely due to the redundant presence of other ATG4 homologs [Citation19,Citation20]. Inhibition of ATG4A and ATG4B activity, by reactive oxygen species (ROS) that mainly target the delipidation process, blocks starvation-induced autophagy [Citation21]. Therefore, the genetic or pharmacological inhibition of ATG4B may lead to an autophagy defect with a distinct pattern of LC3.
Recent studies have shown that human ATG4B plays crucial roles in cancer development. In the case of solid tumors, an enhanced autophagy capability is required for tumor cells to escape hypoxia, nutrient deprivation, and therapeutic stresses [Citation22]. Hence, inhibition of ATG4B can result in the reduction of autophagy, thereby sensitizing cancer cells to therapeutic agents. Expression of ATG4B is significantly increased in colorectal cancer cells compared to normal cells, suggesting that ATG4B may function as an oncogene [Citation18]. However, whether tumorigenesis depends on the activity of ATG4B or ATG4B-induced autophagy has not been fully described. Akin et al. showed that ATG4B knockdown in the osteosarcoma cell line Saos-2 and breast cancer cell line MDA-MB468 reduces starvation-induced autophagy. Saos-2 cells lacking ATG4B fail to survive in amino acid-starvation conditions and also fail to grow as xenografted tumors in mice [Citation23]. In addition, ATG4B knockdown can reduce autophagy, attenuate the cell viability of chronic myeloid leukemia stem cells, and enhance cell death of prostate cancer cells [Citation24]. Not only this but the suppression of ATG4B inhibits G1/S phase transition of the cell cycle in colorectal cancer cell lines as well [Citation18]. In addition, tumor suppression via silencing ATG4B is independent of autophagic flux, suggesting the complex function of ATG4B in tumorigenesis.
Due to the increasingly important roles of ATG4B in autophagy and cancer biology, more potent ATG4B inhibitors are needed for the study of the autophagy mechanism and potential therapeutic strategies. High-throughput methods have been developed for screening ATG4B inhibitors using commercial compound libraries [Citation11]. Most of the discovered inhibitors were only tested in vitro without counter screening and in vivo testing [Citation23,Citation25–Citation28]. So far, only one chemical compound (NSC185058) was reported to be able to inhibit ATG4B and suppress tumor growth in vivo [Citation23]. However, its target selectivity and in vivo inhibitory efficacy have not be established. To develop more potent and effective ATG4B inhibitors for cancer studies, it is necessary to broaden the selection of chemical compounds using multiple screening approaches, and to better define their mechanisms on autophagy and in vivo capability of ATG4B inhibition.
In this study, we identified a novel small molecule, S130, by in silico docking and in vitro FRET assay using a custom library. S130 had a high potency and selectivity for ATG4B. We found suppression of ATG4B by S130 mainly affected the turnover of autolysosomes. S130 was further shown to significantly attenuate the growth of xenografted colorectal cancer cells, especially when it was combined with caloric restriction. The anti-tumor effect of S130 might be due to the suppression of autophagy, activation of apoptosis, and increased susceptibility to stress. Taken together, S130 might be a promising pharmacological ATG4B inhibitor for autophagy inhibition and tumor suppression.
Results
Discovery of small molecules to inhibit ATG4B activity
To study the function of ATG4B in the processes of autophagy and cell death, we aimed to identify small molecules that directly target the ATG4B protein with a potent inhibitory effect. We first searched for potential docking sites using different software. Site 5, which is composed of Thr10, Leu11, Ala14, Asn261, Ser262, His264, Tyr276, Asp278, His280 and Cys306, was finally defined as the best pocket. Site 5 was close to but not identical to the catalytic pocket of ATG4B, thus avoiding irreversible interaction with Cys74. Subsequently, 7,249 chemicals with diverse structures from a custom-made compound library were used to perform one-step virtual screening (Figure S1A). The top 500 hits determined by Discovery Studio 2.5.5 were selected for further analysis using a FRET assay as previously reported [Citation29]. The IC50 of 6 compounds were found to be below 10 µM. Among those chemicals, S130 exhibited the strongest inhibition with IC50 of 3.24 µM (). Based on molecular docking, we found that S130 could fit into site 5 and strongly interact with ATG4B through 4 hydrogen bonds ( and S1B).
Figure 1. S130 efficiently inhibits ATG4B activity. (A) Structure and IC50 calculation of S130 for ATG4B from fitted curve by FRET assay. (B) Docking mode of S130 at site 5 of ATG4B simulated by Discovery Studio. Yellow dotted lines represent hydrogen bonds between S130 and relevant residues of ATG4B. (C) ATG4B (0.75 μg/ml) was incubated with or without S130 (10 μM) at 37°C for 30 min, FRET-GABARAPL2 was then added and incubated at 37°C for another 30 min. The inhibitory effect of S130 was detected by SDS-PAGE according to the cleavage of FRET substrates. (D) The diagram of the cleavage of LC3 fused with GST by endogenous ATG4B. (E) WT HeLa or ATG4B KO HeLa cells expressing LC3-GST were treated with S130 as indicated for 24 h. The protein level of full-length LC3-GST and cleaved GST were detected by immunoblot. Then the inhibition of ATG4B activity was quantified based on the cleavage of LC3-GST. Data are presented as mean ± SEM from 3 individual experiments.
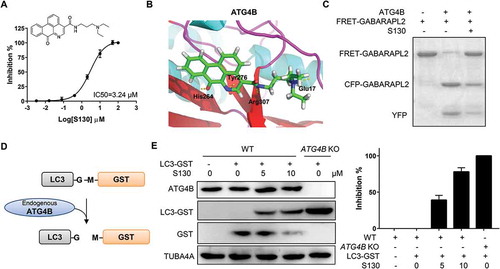
Next, a gel-based assay was performed to evaluate the activity of ATG4B using substrate FRET-GABARAPL2, which could be efficiently cleaved by ATG4B [Citation11]. As shown in , the cleavage activity of ATG4B could be strongly suppressed by S130, indicating that S130 was a potent ATG4B inhibitor. In order to validate whether S130 could block the cleavage of LC3 (human LC3B, GenBankTM accession number NP_073729) by ATG4B in cells, we generated ATG4B-deficient HeLa cells employing the CRISPR/Cas9 system (Figure S1C) and performed an ex vivo assay. As shown in , the construct LC3-GST was transfected into HeLa cells. The cleavage of overexpressed LC3-GST was monitored to evaluate the activity of endogenous ATG4B. As expected, S130 displayed obvious inhibitory effects on ATG4B. Approximately 79% of the cleavage of full-length LC3-GST was suppressed by S130 at the concentration of 10 µM, while no substrates were processed in ATG4B KO cells (). Overexpression of ATG4B in 293 cells also showed higher cleavage activity using LC3-GST as substrate (Figure S1D). Thus, the mentioned data obtained from multiple methods indicated that the small molecule S130 could function as a novel and potent compound capable of inhibiting ATG4B activity in vitro as well as ex vivo.
S130 specifically binds to and interacts with the ATG4B protein
In order to understand the mode of action of S130, we tested whether S130 could bind to ATG4B directly and if the mutation of Cys74, at the catalytic pocket, affects its binding affinity. The equilibrium dissociation constants of S130 were determined by surface plasmon resonance (SPR). First, S130 at a range of concentrations and a blank reference were injected simultaneously into the protein array (). Then the equilibrium dissociation constant was determined by using equilibrium analysis. S130 exhibited a strong binding affinity for both full-length ATG4B and ATG4BC74S with the dissociation constant at equilibrium (Kd) of 4.00 µM and 5.75 µM, respectively (). These results suggested that S130 directly bound to ATG4B and that the mutation of Cys74 of ATG4B did not affect the binding capacity of S130.
Figure 2. Identification of the specificity and binding affinity of S130 to ATG4B. (A) Surface plasmon resonance measurements were carried out to evaluate the binding affinities of S130 to wild-type or mutant ATG4B. The Kd values of S130 to each protein were calculated based on the fitted curves. (B) Target selectivity of S130 was tested against a panel of cysteine proteases (CASP3, CASP8, CASP9), aspartate proteases (CTSD, CTSE), and serine proteases (F2/thrombin, factor Xa, plasmin, and KLK/kallikrein), respectively. (C) Measurement of the IC50 of S130 for ATG4A from fitted curve by FRET assay. (D) Docking analysis and binding mode of S130 with ATG4A (PDB code: 2P82), yellow dotted lines represent hydrogen bonds between S130 and relevant residues of ATG4A. Data are presented as mean ± SEM from 3 individual experiments. (E) The inhibition type of S130 as an ATG4B inhibitor was determined by using the double reciprocal plot.
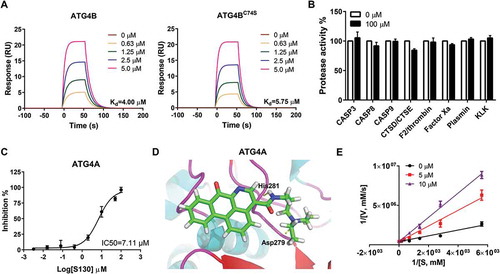
Because selectivity is a key parameter for enzyme inhibitors, we tested whether S130 could also inhibit other proteases. As shown in , even at the concentration of 100 µM, S130 had no inhibitory effects on cysteine proteases such as CASP3 (caspase 3), CASP8 (caspase 8) and CASP9 (caspase 9), or aspartic proteases such as CTSD (cathepsin D) and CTSE (cathepsin E), or serine proteases such as F2/thrombin, factor Xa, plasmin, and KLK (kallikrein). Moreover, S130 may also have no inhibition on cysteine proteases USP10, USP13 [Citation30], and USP14 [Citation31], because the substrates of those USPs, BECN1/Beclin1 and TP53, were not altered as shown in figure S2A. However, we found that S130 could also inhibit the activity of ATG4A with an IC50 of 7.11 µM using the FRET assay (). The molecular docking study confirmed that S130 could bind to ATG4A (PDB: 2P82) at a similar site to that of ATG4B with 2 hydrogen bonds (). S130 could inhibit ATG4B in a competitive manner () without conformational change based on fluorescent spectra (Figure S2B). To better characterize S130, we also synthesized a well-studied ATG4B inhibitor, NSC185058 [Citation23]. Compared to S130, NSC185058 also showed a good binding affinity (3.28 µM); however, the inhibitory efficiency (IC50 > 100 µM) was significantly lower than that of S130 (IC50 = 3.24 µM), shown by the FRET assay (Figure S2C). Taken together, S130 could bind to ATG4B with a strong affinity and inhibit the activity of Atg4 homologs with a high specificity.
S130 suppresses autophagy flux
To determine the impact of S130 on the process of autophagy, we used HeLa and mouse embryonic fibroblasts (MEFs) expressing GFP-LC3. We found that S130 could efficiently induce GFP-LC3 puncta in both a dose-dependent and time-dependent manner (-B and S3A-B). In contrast, S130 had no effects on GFP-LC3 translocation in Atg5-, Atg7-, and Rb1cc1/Fip200-deficient MEFs, suggesting that S130-induced LC3-II was autophagy-dependent ( and S3C). We then performed autophagy flux analysis and found that S130 could not further enhance LC3-II accumulation induced by CQ or Baf. ( and S3D-E). In addition, S130 could significantly attenuate the degradation of the autophagic substrate SQSTM1 () and increased the lipidated LC3 in MEF cells (Figure S3F). These results suggested, although not as strong as CQ or Baf, S130 could still inhibit autophagy significantly.
Figure 3. S130 inhibits autophagic flux without affecting the initiation steps of autophagy. (A) HeLa, WT MEFs and atg5 KO MEFs expressing GFP-LC3 were treated with complete medium (CM) or S130 (10 μM) for 6 h. The distribution of GFP-LC3 was examined. (B) HeLa cells treated with 0–20 μM of S130 for 6 h were analyzed by immunoblot. The ratio of LC3-II:TUBA4A was calculated based on the band density. (C) HeLa cells treated with S130 (10 μM) for 6 h in the presence or absence of CQ (40 μM) as indicated were analyzed by immunoblot. The ratio of SQSTM1:TUBA4A and LC3-II:TUBA4A was calculated based on the band density. (D) HeLa cells were treated with S130 (10 μM) or Baf (0.5 μM) for 6 h and the accumulation of SQSTM1 was measured by immunostaining. The number of SQSTM1-positive dots was quantified. (E) HeLa cells were treated with S130 (10 μM) or/and Rap (1 μM) for 6 h, followed by immunostaining of the early stage marker of autophagy, ATG16L1 and ULK1. (F) Immunoblot analysis of WT HeLa or ATG4B KO HeLa cells cultured in CM or starvation medium (EBSS) for 2 h. The bands in ATG4B KO HeLa cells indicate the pro-LC3. The ratio of SQSTM1:TUBA4A was calculated. Data are presented as mean ± SEM from 3 individual experiments. ***P < 0.001, NS, not significant. Arrows indicate ATG16L1- or ULK1-positive structures.
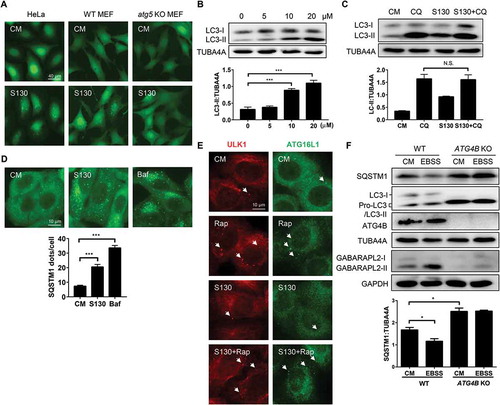
To clarify whether S130 had any effects on the initiation steps of autophagy, we examined 2 early phagophore markers, ULK1 and ATG16L1, by immunostaining. We found that neither ULK1 puncta, nor ATG16L1 puncta, both of which represent phagophores, were induced by S130, but were, however, induced by rapamycin (Rap). S130 also could not suppress those puncta induced by Rap (). The results suggested that S130 did not contribute to the step of autophagy induction. We subsequently measured the response of cells with or without ATG4B to starvation. Compared to wild-type HeLa cells, which had a lower level of SQSTM1, the degradation of SQSTM1 in ATG4B KO HeLa cells, cultured in either complete medium or EBSS medium, was strongly blocked (). The full-length form of LC3 (pro-LC3), instead of processed LC3 (LC3-I and LC3-II), was found in ATG4B KO cells because no pro-LC3 could be cleaved into LC3-I without ATG4B. In SDS-PAGE, pro-LC3 usually has a similar appearance to LC3-II in human cells [Citation32]. On the contrary, the conversion of GABARAPL2 could still be detected. Similarly, GFP-LC3 puncta failed to accumulate in ATG4B KO cells (Figure S3G). When ATG4B KO cells were used, only pro-LC3 proteins were left even when cells were treated with other autophagy inducers or inhibitors (Figure S3H). Because of the close migration of pro-LC3 and LC3-II (lipidated LC3), we then detected the cleavage of pro-LC3 and lipidated-LC3 (LC3-II) by PLD (phospholipase D) according to a previous study [Citation33]. As shown in figure S3I, the bands of ATG4B KO cells should be pro-LC3 proteins, which could not be processed by PLD. On the contrary, the bands of WT HeLa cells with a slower migration compared to pro-LC3 should be LC3-II, which could be hydrolyzed by PLD to produce more LC3-I (Figure S3I). All the data suggest that the deficiency of ATG4B or inhibition of ATG4B by S130 would lead to similar outcomes of autophagy suppression at the early LC3 priming step or late autolysosome degradation stage.
S130 accumulates autolysosomes with more lipidated LC3
The tandem RFP-GFP-LC3 construct has been used for autophagy flux analysis [Citation34]. Normal degradation leads to the reduction of the green fluorescence in an acidic lysosome environment, leaving only red fluorescence to be detected due to its resistance to low pH [Citation34]. Indeed, treatment with Rap resulted in greater red-only fluorescent puncta than the treatment with Baf and S130 (). This is consistent with the notion that Rap promotes autophagy flux. In contrast, there was a higher level of yellow puncta, indicative of the presence of both GFP- and RFP-positive structures, in S130-treated cells. Such GFP+ RFP+ structures represent both autophagosomes and autolysosomes due to impaired degradation steps (e.g., increased pH or impaired protease activity in lysosomes).
Figure 4. S130 accumulates lipidated LC3 in autolysosomes. (A) HEK293A cells expressing GFP-RFP-LC3 were treated with S130 (10 μM) and Rap (1 μM) for 6 h. The colocalization of GFP and RFP puncta was examined and quantified. (B) HeLa cells were treated with S130 (10 μM) or Baf (0.5 μM) for 4 h, followed by staining with LysoTracker Red (LTR, 50 ng/ml) or acridine orange (AO, 0.5 μg/ml) for 30 min. For the DQ-BSA assay, HeLa cells were pre-incubated with DQ-BSA (10 μg/ml) for 1.5 h and then treated with S130 (10 μM) or Baf (0.5 μM) for 4 h. Fluorescence images of live cells were recorded without fixation. (C) LTR staining of MEF cells expressing GFP-LC3 treated as (B), the colocalization of GFP and LTR was measured and quantified. (D) Representative images of transmission electron microscopy (TEM) depicting ultrastructure of HeLa cells treated with or without S130 (10 μM) for 6 h. Data are presented as mean ± SEM from 3 individual experiments. ***P < 0.001. Green arrows indicate GFP- or LC3-positive structure, yellow arrows indicate the colocalization of GFP and RFP, or LTR (red), red arrows indicate normal autolysosome structures.
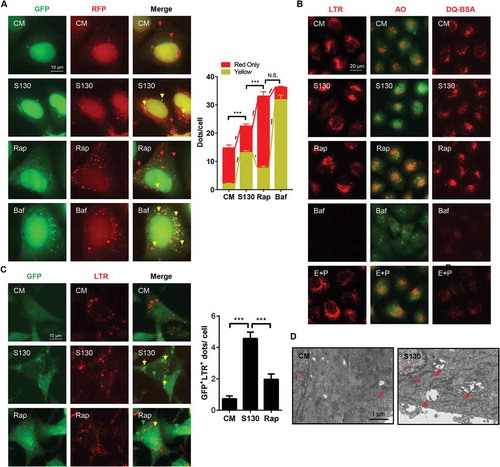
The increase of LC3-II caused by S130 could be due to the impairment of the disposal of autophagosomes or autolysosomes by dysfunctional lysosomes. It could also be due to the defective fusion between autophagosomes and lysosomes. To examine whether S130 could cause lysosome dysfunction, we first evaluated the lysosomal pH using LysoTracker Red (LTR) and acridine orange (AO), which could stain acidic compartments, such as lysosomes. Similar to the non-treatment group, the red fluorescence signal of LTR or AO in S130-treated cells was stable, whereas that in Baf-treated cells was quenched significantly (), suggesting that S130 did not change the pH of the lysosomes.
The main function of lysosomes is to degrade cargos originating from different sources including those from the autophagy pathway and those from the endocytosis pathway. We thus monitored the lysosomal activity in processing DQ-BSA, which is taken into cells by endocytosis. Normal lysosomal functions cause the degradation of DQ-BSA, releasing the dequenched red signal. In contrast to the weak red signal in Baf and E64D plus pepstatin A treatment, cells with S130 retained a red signal of DQ-BSA (), suggesting that the proteolytic activity of the lysosomes was not affected significantly by S130.
To further determine where the accumulated LC3 was located after S130 treatment, GFP-LC3 was examined for its spatial relationship with the lysosome marker LTR or LAMP1. The result showed that GFP-LC3 signals were mainly located at the lysosomal structure ( and S4A). On the contrary, less colocalization of lysosomes and GFP puncta was detected in Rap-treated cells ( and S4A). This spatial relationship was confirmed for endogenous LC3 (Figure S4B and S4C). Further analysis by TEM also indicated that more autolysosomes, instead of autophagosomes were accumulated in S130-treated cells (). Besides, ATG4B KO cells transfected with plasmids encoding full-length GFP-LC3 or GFP-LC3[G120] (GFP-LC3 mutant that already contained the terminal glycine residue necessary for lipidation that does not require the initial priming cleavage by ATG4B), demonstrated a different phenotype (Figure S4D). No GFP puncta were found in ATG4B KO cells transfected with the GFP-LC3 construct due to the defective cleavage of GFP-LC3 to GFP-LC3-I. Conversely, cells with GFP-LC3[G120] had more dots because the lipidation process was intact. The puncta level of the S130 group was still lower than that of Rap and Baf due to the lack of autophagy induction and lysosome inhibition. Overall the data indicate that S130 did not block the fusion between autophagosomes and lysosomes, and that the elevated LC3 signals were accumulated mainly in the autolysosomes.
These data could suggest that S130 resulted in the accumulation of undigested autolysosomes. Because we had not found that S130 could affect the lysosome degradation function, an alternative explanation was that the recycling of LC3, or delipidation of LC3-PE on the surface of autophagosomal structures, was defective due to the inhibition of ATG4B by S130. This explanation allows us to link the molecular effects of S130 with the phenotype it caused in cells.
Inhibition of ATG4B activity induces cell death of cancer cells
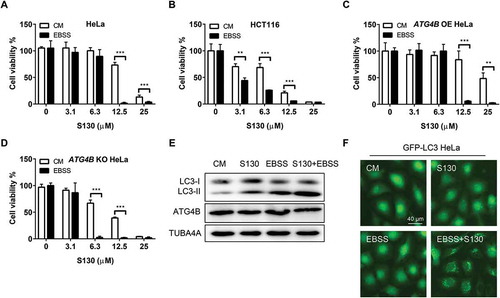
We sought to know whether the ATG4B inhibitor S130 had the potential to affect the growth of cancer cells due to its autophagy inhibition effect. At a dose higher than 6.3 µM, S130 had significant cytotoxic effects on adherent cells, such as HeLa (IC50 = 16.1 µM) and HCT116 (IC50 = 9.0 µM), as well as on cells in suspension, such as HL60 (IC50 = 4.7 µM) ( and S5A). Such cytotoxicity could not be suppressed by 20 µM necrostatin-1 (IC50 = 15.3 µM), a selective inhibitor of necroptosis (), suggesting that S130 might not cause cell death through necroptosis. The pan-caspase inhibitor Z-VAD-FMK (IC50 = 19.1 µM) could partially suppress the cytotoxicity of S130 at 12.5 µM (). Meanwhile, cleaved CASP3 was increased at a longer incubation of S130 (Figure S5C), indicating that apoptosis could be induced by S130, but suppression of apoptosis could not completely reverse the cell death caused by this compound. In addition, inhibition of autophagy either by CQ (IC50 = 11.3 µM) or by genetic deletion of Atg5 (IC50 = 5.3 µM compared to 7.8 µM with WT MEFs) or ATG4B (IC50 = 9.8 µM) could further reduce cell viability (,B and S5D), indicating that autophagy could play a protective role in these cells.
Figure 5. S130 induces cell death through inhibiting the activity of ATG4B. (A) HeLa cells were treated with 0–25 μM of S130 in the presence or absence of 40 μM necrostatin-1, 10 μM of Z-VAD-FMK or 10 μM of CQ for 48 h, and cell viability was measured with CCK8. (B) Cell viability analysis of ATG4B KO HeLa, WT HeLa and ATG4B OE HeLa cells treated with 0–25 μM of S130 for 48 h. (C) Immunoblot analysis of WT HeLa and ATG4B KO HeLa cells treated with S130 (10 μM) for 24 h. (D) Cell viability analysis of ATG4B KO HeLa cells expressing ATG4B, empty vector, ATG4BC74S, or ATG4A treated with 0–25 μM of S130 for 48 h. (E-F) Immunoblot analysis of ATG4B KO HeLa cells overexpressing empty vector or ATG4B with quantification of the protein level of LC3-I and C-CASP3(E), or ATG4BC74S and ATG4A (F) treated with or without S130 (10 μM) for 24 h. The bands in ATG4B KO HeLa cells indicate the pro-LC3. Data are presented as mean ± SEM from 3 individual experiments. *P < 0.05, **P < 0.01, ***P < 0.001.
Then, HeLa or HEK293T cells with different levels of ATG4B were analyzed and we found that cells with lower amounts of ATG4B (IC50 = 25.7 µM of HeLa) were more sensitive to S130 than cells with higher amounts of ATG4B (, S5E). Decreased cell viability and increased cleaved CASP3 levels were identified in ATG4B KO cells (); however, no growth arrest was seen when cells were cultured in normal medium, (Figure S5F). In addition, overexpression of ATG4B (IC50 = 16.6 µM) would be beneficial for ATG4B KO cell survival under the treatment of S130. Interestingly, no significant improvement was observed for ATG4B KO cells overexpressing ATG4BC74S (IC50 = 9.1 µM) and ATG4A (IC50 = 9.4 µM) (), suggesting a protective role of ATG4B, but not for ATG4A, that depends on its specific enzymatic activity. Similarly, ATG4B-deficient cells that exhibited a higher apoptotic level could also be partially rescued by restoring ATG4B expression (). Restored expression of ATG4B caused corresponding changes to the level of LC3-I and a lower level of apoptosis with less cleaved CASP3. Conversely, overexpression of both ATG4BC74S and ATG4A failed to rescue the death of ATG4B-deficient cells ( and ). Moreover, the overexpression of ATG4B instead of ATG4B mutant or ATG4A could reverse the accumulation of SQSTM1 and LC3-II caused by S130 (Figure S5G). Meanwhile, overexpression of ATG4B was found to suppress autophagy flux (Figure S5H), suggesting that the regulatory trend of ATG4B in cell growth and autophagy might not be the same.
Overall, these findings demonstrated that by inhibiting ATG4B by S130 autophagy is suppressed and apoptosis is activated, leading to enhanced cytotoxicity, which could be considerably rescued by the enzymatic activity of ATG4B.
Nutrient deprivation enhances S130-induced cytotoxicity
Cancer cells are usually able to tolerate an insufficient supply of nutrients by regulating their energy metabolism. Whether S130-mediated autophagy inhibition could affect cancer cell survival under nutrient starvation was unclear. As shown in , the IC50 of HeLa cells in nutrient-deprived medium reduced to 8.1 µM compared with 16.1 µM, in complete medium. The same pattern was also found in HCT116 (IC50 = 4.2 µM compared to 9.0 µM in complete medium) and MEFs (IC50 = 2.1 µM compared to 7.8 µM in complete medium) ( and S6A). In addition, Rap (IC50 = 13.4 µM) could also reduce the cell viability of S130-treated HeLa cells (Figure S6B). We wondered whether a higher expression of ATG4B could enhance cell viability in a S130-containing starvation medium. Indeed, cell viability was increased significantly in cells overexpressing ATG4B (IC50 = 9.2 µM) but decreased greatly in ATG4B-deficient cells (IC50 = 3.7 µM) (). Greater amounts of LC3-II and GFP-LC3 puncta were accumulated in the wild type () instead of ATG4B-deficient cells (Figure S6C-D) treated with S130 and EBSS. One possible reason for this is that severe autophagy activation by EBSS or Rap turned into ‘autophagy stress’ when the degradation of autophagosomes were further blocked, such as by S130. The other possibility was that the lower activity of ATG4B enhanced the susceptibility of cells to exogenous stresses, such as starvation and S130.
Figure 6. Nutrient starvation sensitizes S130-induced cell death. (A-D) HeLa (A), HCT116 (B), ATG4B OE HeLa (C), and ATG4B KO HeLa (D) cells were treated with 0–25 μM of S130 in CM or EBSS for 48 h, cell viability was measured with CCK8. (E) Immunoblot analysis of HeLa cells cultured in CM or EBSS treated with or without S130 for 3 h. (F) HeLa cells expressing GFP-LC3 were cultured in CM or EBSS treated with or without S130 for 3 h, and the distribution of GFP-LC3 was photographed. Data are presented as mean ± SEM from 3 individual experiments. **P < 0.01, ***P < 0.001.
S130 suppresses tumor growth
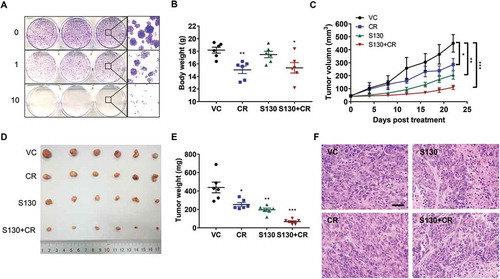
Before evaluating the efficacy of ATG4B inhibitor S130 on in vivo tumor growth, the colony formation assay was first performed. S130 strongly reduced the number of colonies (). Meanwhile, HCT116 cells transfected with different ATG4B constructs were compared for their expression and cell viability. The distribution of LC3-II was quite similar to that of HeLa cells (Figure S7A). Importantly, the cell viability of cells with shATG4B (IC50 = 3.4 µM) was much lower than that of the control cells (IC50 = 8.0 µM) (Figure S7B). Subsequently, HCT116 cells were xenografted into immune-deficient nude mice. After tumors reached approximately 50 mm3 13 d later, the mice were randomized and administered a vehicle control (VC), caloric restriction (70% food intake, CR), S130, and S130 plus CR. After 3 wk of treatment, the body weights of mice decreased in both in CR and S130 plus CR groups, compared to that of the vehicle group, while that of the S130 group was stable (). The tumor volume and mass increased dramatically in the vehicle group compared to S130-treated mice (), suggesting that S130 was able to suppress tumor growth. In this in vivo study, we also found CR not only reduced the tumor size and weight, but also further promoted the antitumor effects of S130. The H&E staining of the tumor sections showed that the abnormal cell arrangement and necrotic areas were significantly increased when treated with S130 or S130 plus CR (), supporting the notion that S130 exacerbated cell death in the tumor tissue.
Figure 7. S130 arrests tumor growth of colorectal cancer cells. (A) HeLa cells were treated with the indicated concentrations of S130. Colony formation assay was monitored by crystal violet staining. (B-E) Effects of the indicated treatments (VC, vehicle; S130, 20 mg/kg i.p. daily; CR, caloric restriction with 70% food intake; S130+ CR, combined treatment) on the growth of HCT116 xenografts (n = 6 mice per group). Bodies were weighed after the final injection (B). Tumor volume (C), tumor images (D), and tumor weight (E) were recorded. (F) Tumor tissues were sectioned and subjected to H&E staining for histological morphology evaluation. Scale bar: 50 µm. Data are presented as mean ± SEM. *P < 0.05, **P < 0.01, ***P < 0.001 vs VC.
The weight index of the liver increased in all treated groups, while there was no change for that of the heart, spleen, kidney, and lung (Figure S7C). There was a slight congestion in hepatic central veins, and reduced bronchial epithelial cells in the lung tissue were identified (Figure S7D). Together, S130 shows an efficient in vivo antitumor effect with a sound safety on vital organs.
The in vivo pharmacokinetic study of S130 shown in Table S1 indicated that S130 was absorbed rapidly at an early stage and underwent a rapid metabolic process throughout the recorded time. The elimination half-life (t1/2) of S130 in the plasma was 4.40 h, and the apparent volume of distribution (V/F) was 20.11 L/kg, suggesting S130 was widely distributed and might be a good candidate for oral drug development.
S130 inhibits autophagy and activates apoptosis in the process of tumor suppression
To circumvent the mistargeting of chemicals in different tissues, it is necessary to define the efficacy of S130 on ATG4B inhibition and cell death in vivo. Consistent with the aforementioned in vitro results, S130 instead of CR inhibited autophagy significantly with the accumulation of LC3-II and SQSTM1 (). Accordingly, cleaved CASP3 accumulated in both S130 and S130 plus CR groups (). Importantly, the ATG4B activity of colon tumor tissue in the S130-treated groups decreased greatly using the FRET assay (). Similar to the immunoblot results, tumor tissues and other vital organs were examined by immunohistochemistry and found to contain an increased level of SQSTM1 after S130 treatment ( and S8A). Meanwhile, the accumulation of cleaved CASP3 and apoptotic cells were also detected in the S130-treated tumor by immunoblot and TUNEL assays ( and ).
Figure 8. S130 inhibits ATG4B activity of tumor tissue instead of liver tissue. (A) Immunoblot analysis of tumor tissues treated with VC, CR, S130, and S130 plus CR as in . The protein level of SQSTM1 and LC3-II was analyzed. (B) Quantitative analysis of the ATG4 activity of different tumor tissues by FRET assay. (C) Tumor tissues were sectioned and subjected to TUNEL assay and immunohistochemical staining for SQSTM1 and cleaved CASP3. Scale bar: 50 µm. (D) Immunoblot analysis of mice liver tissues from different groups as in (A). (E) Quantitative analysis of the ATG4 activity of different liver tissues by FRET assay. (F) In vivo distribution of total S130 in the liver and tumor tissues from VC and S130 groups as shown in was determined. Data are presented as mean ± SD, *P < 0.05. (G) TEM analysis of the ultrastructure of the representative tumor tissues. Red arrows indicate autolysosomes and red arrowheads indicate mitochondria. Data are presented as mean ± SEM from 3 individual experiments. N.S., not significant, **P < 0.01.
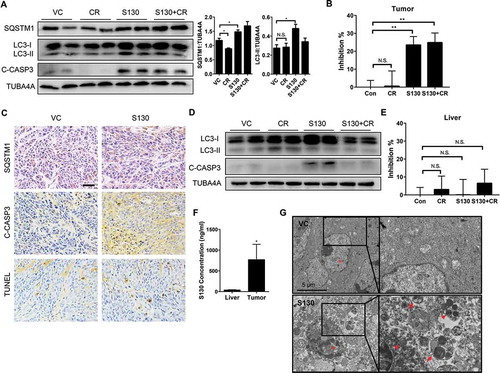
We also investigated whether S130 inhibited autophagy and ATG4B activity in the liver. Interestingly, the protein level of LC3-II in liver tissues did not increase as much as that seen in tumor tissues; meanwhile, cleaved CASP3 was slightly elevated after S130 treatment (). However, the cleaved CASP3 decreased once S130 was administered in combination with CR, suggesting that CR might attenuate S130-induced apoptosis in the liver. Importantly, no significant inhibition of ATG4B activity was detected in the liver tissue (), although the basal level of ATG4B activity in the liver was similar to that in tumor (Figure S8B). This suggested that the cytotoxicity and the inhibition of ATG4B activity of S130 might be more specific to tumor tissues than to normal liver tissue.
We also measured the distribution of S130 in different tissues. After 3 wk of multiple administration, the total concentration of S130 was much higher in tumors compared to the liver tissues (). Similarly, the single administration of S130 in the xenograft model indicated that after 24 h, S130 could still apparently accumulate in tumors rather than in other mouse tissues (Figure S8C-E). The t1/2 of S130 in the tumor tissue was 8.3 h, which was also much longer than that in the liver (Table S2), suggesting that S130 has excellent properties to accumulate in tumors but not in the liver or other tissues.
Finally, we determined whether S130 suppressed autophagy and promoted apoptosis within the tumor tissue by electron microscopy ( and S8F). Tumors from the vehicle group contained normal mitochondria and less autophagic vacuoles. In contrast, S130-treated tumor cells presented with an increased amount of autophagic vacuoles (especially autolysosomes), condensed mitochondria, and nuclei with chromatin marginalization. Thus, these results indicated that by targeting ATG4B, S130 could inhibit autophagy and activate apoptosis in colon cancer cells.
Discussion
Autophagy has been highlighted as a novel therapeutic target with a wide range of beneficial effects on cancer, diabetes, and neurodegenerative diseases [Citation2]. Considering the molecular machinery involved in autophagy induction, the targeting of autophagy-specific proteins becomes very important when designing the therapeutic interventions that specifically treat a variety of autophagy-associated disorders. Because there is a general lack of efficient activity assays and high-throughput methods for chemical screening, only a limited number of inhibitors that specifically target autophagy molecules, such as LYN-1604 and Spautin-1 for ULK1 and BECN1, respectively, have been identified for successful in vitro and in vivo studies [Citation30,Citation35]. However, based on the structural information of human ATG4 proteases, more standardized and easily implementable assays have been set up. Among the 4 mammalian Atg4 homologs, ATG4B is functionally dominant during the regulation of autophagy in that ATG4B cleaves all human Atg8 homologs [Citation12]. For this reason, ATG4B has been proposed as an attractive target for inhibitor discovery.
Recently, a number of small-molecule agents discovered through FRET-based assay [Citation25], LC3B-PLA2 assay [Citation27], and SDS-PAGE assay [Citation23,Citation26] have been reported as inhibitors of ATG4B. However, some of them failed to be validated by gel-based assays using substrate LC3-GST, due to their overestimation of the indirect screening approach or the possibility of non-specific covalent bond formation with nucleophilic residues [Citation26]. Unlike these compounds, S130 is screened out first by molecular docking using a new docking site, and then confirmed by FRET assays and gel-based assays using both GABARAPL2 and LC3B as substrates [Citation12,Citation29]. The combination of several validated assays ensured the efficient inhibition and binding affinity of S130 for ATG4B. Because the catalytic pocket space of ATG4B is quite limited, we found that site 5 might be suitable for use in docking design, which is close but not identical to the site of NSC185058 (IC50 > 50 µM) [Citation23]. One fluoromethylketone (FMK)-based covalent ATG4B inhibitor, FMK-9a, with high potency (IC50 < 100 nM), was recently reported [Citation28]. However, this FMK analog also inhibits a few other types of cysteine proteases such as CTSB and CAPN (calpain) that have IC50 values less than 1 µM due to the universal irreversible reactivity of the FMK group. Compared to FMK-9a, S130 is a moderately active compound with an IC50 less than 4 µM but more specific to ATG4 homologs that have a strong binding affinity. It rarely inhibits other cysteine proteases, aspartate proteases or serine proteases. Interestingly, S130 could also inhibit ATG4A in vitro owing to its high degree of similarity to protein structures of ATG4A and ATG4B; hence S130 might be the first potent inhibitor studied that has dual inhibition of ATG4B and ATG4A. Although studies have implicated roles of ATG4 proteases in cancer biology, few ATG4B inhibitors have been considered for potential cancer therapy. Thus, S130 might serve as an excellent pharmacological tool to better define the role of ATG4B in autophagy and in the treatment of cancer biology.
ATG4B plays crucial roles in the delipidation of LC3, which is necessary for the autophagy process [Citation36]. For this reason this activity is expected to be tightly regulated. It has been reported that oxidant H2O2 directly targets and inhibits ATG4B and causes accumulation of LC3–PE. Furthermore, this regulation mainly blocks the delipidation process [Citation21]. In addition, silencing ATG4B in HCT116 also increased LC3–PE due to induced autophagic flux [Citation18]. However, the small molecule compound NSC185058, which inhibits ATG4B activity in vitro, was shown to reduce the formation of LC3 puncta in Saos-2 cells [Citation23]. These controversial findings suggested that the role of ATG4B on LC3 lipidation and delipidation might be context dependent. Distinct from NSC185058, the new ATG4B inhibitor S130 caused accumulation of SQSTM1 and LC3 puncta without affecting the early markers of autophagy. It is known that deficiency of ATG4B can significantly block the formation of both LC3-I and LC3-II, even under starvation conditions. Because ATG4B has a dual function promoting LC3 lipidation and delipidation, inhibition of ATG4B may affect the delipidation function greater than the lipidation function, leading to a net increase in LC3-II in some circumstance.
GFP+ RFP+ structures usually indicate autophagosomes or autolysosomes with intact lipidated LC3 on the surface in the tandem RFP-GFP-LC3 assay. Unlike Rap, both S130 and Baf induced more GFP+ RFP+ structures suggesting either autophagosomes or autolysosomes were accumulated. Furthermore, we ruled out the possibility of a fusion defect, which can cause the increase of LC3-II and SQSTM1, because accumulated LC3 in the presence of S130 was mainly colocalized with the lysosome. Dysfunction of lysosomes was also excluded because lysosome degradation was not clearly affected by S130. We hypothesize that LC3 molecules on the internal membrane of the autophagosome are degraded due to the lysosomal acidic environment, while the LC3 molecules on the outer membrane of the autophagosome, which are normally removed by ATG4B, are stabilized when ATG4B is inhibited. Accumulated LC3 molecules in the outer membranes of the autolysosome may inhibit the turnover of the autolysosomes, resulting in their accumulation as revealed by the TEM study. In addition, ATG4B also acts to maintain a reservoir of unlipidated LC3 by recycling the LC3–PE located on inappropriate membranes, which is required for intrinsic defects in the lipidation system during autophagosome formation at the phagophore assembly site [Citation13]. The high degree of overlap between endogenous LC3 and lysosomes suggest that S130 may mainly modulate autophagic vesicles instead of improper organelles by suppression of ATG4B. Thus, S130 could be a good tool to disturb the process of LC3 delipidation through ATG4B inhibition.
Although the complicated relationship between ATG4B and tumor progression has not been fully described, studies have shown that ATG4B might be a favorable drug target to reduce drug resistance in cancer therapy. Knockdown of ATG4B by siRNA impairs the survival of CML stem cells and sensitizes them to imatinib mesylate treatment [Citation24]; it also enhances lupulone derivative-induced apoptosis in prostate cancer cells [Citation37]. Moreover, blocking autophagy by inhibiting ATG4B sensitizes several types of resistant carcinoma cell lines to radiation therapy [Citation38]. In this study, the inhibition of ATG4B by S130 also reduced the cell viability significantly. However, suppression of necroptosis or apoptosis could not fully reverse the toxicity of S130 suggesting that there might be other types of cell death, such as necrosis induced by S130. Recent studies have showed that ATG4B might play an autophagy-independent role on cell proliferation in colorectal cancer [Citation18]. However, the reduced cell viability caused by S130 could be further exacerbated by the downregulation of ATG4B or the blockade of autophagy flux, suggesting that the role of autophagy in cell growth influenced by ATG4B, may vary significantly. Meanwhile, S130-triggered apoptosis was decreased when a higher level of ATG4B was expressed, indicating the potential anti-apoptosis effects of ATG4B in response to S130. In addition, the catalytic activity, rather than the protein level of ATG4B or ATG4A, was responsible for the resistance to S130-induced apoptosis and cytotoxicity. We noticed that the growth rates of cultured HeLa cells that expressed different levels of ATG4B were almost identical in complete medium because of the redundancies among ATG4 proteases. However, cells with low ATG4B expression were more susceptible to S130. This may be because the complementary signals for ATG4B such as ATG4A, were also seriously suppressed by S130, meaning that cell death, promoted by S130, could be alleviated by ATG4B-mediated functional autophagy and proteolytic activity.
It has been shown that compounds that promote autophagy induction while simultaneously impairing the function of lysosomal degradation, could be relatively useful as standalone agents for cancer therapy due to autophagy stresses [Citation39]. Our study demonstrated that nutrient-starvation, which mimics the tumor environment, further enhanced the susceptibility of HeLa cells to S130-induced cell death regardless of the protein level of ATG4B. This might be due to the combination of autophagy inhibition by S130 and autophagy initiation by starvation. Meanwhile, in line with the enhanced autophagy stress levels, the apoptotic process increased as well. Therefore, the suppression of ATG4B by S130, with or without nutrient-starvation, might be an efficient way to induce cell death. Regardless, further studies are required to clarify the detailed crosstalk between ATG4B activity and the different forms of cell death.
To date, very few detailed studies have been performed that demonstrate the complex relationship between ATG4B and tumor progression. The downregulation of ATG4B by shRNA attenuates the cell proliferation in colorectal cancer in an autophagy-independent manner [Citation18]. Meanwhile, on osteosarcoma xenografts, the anti-tumor activity of the ATG4B antagonist NSC185058 on osteosarcoma xenografts is due to its efficacy in inhibiting autophagy [Citation23]. These mentioned in vivo studies indicate that ATG4B might be a suitable therapeutic target for inducing tumor regression. However, the signaling pathways that cause tumor suppression through ATG4B inhibition seem to be different.
In this study, we found that the administration of the ATG4B inhibitor S130 clearly attenuated the tumor growth apparently without obvious toxicity to most vital organs. Minor injury to liver caused by S130 was alleviated by CR. This was achieved by lowering the apoptotic level without reducing the effects of S130 on tumor suppression. Intriguingly, from our detailed pharmacokinetic studies, S130 seems to preferentially distribute in tumor tissues, which is relevant to its effects on ATG4B inhibition, autophagy modulation, and tumor suppression.
Altogether, we have identified a novel ATG4B inhibitor, which can potently suppress the activity of ATG4B and autophagy in vitro as well as in vivo. We also demonstrated that lower ATG4B activity might increase the susceptibility to stress of the cells. Hence, S130 could efficiently suppress the growth of xenografted HCT116 cells in vivo due to defective autophagy and enhanced sensitivity to stress. Furthermore, such an anti-tumor effect could be enhanced by the additional caloric restriction (). ATG4B is not only an important regulator of autophagy, but can also be a promising target for cancer therapy. Based on the data we have shown in this study, the tissue specificity and potency of S130 seem to be adequate to qualify it for further in-depth anti-tumor related studies.
Materials and methods
Antibodies and reagents
Antibodies used in this study were as follow: ATG4A (Sangon Biotech, D161325), ATG4B (MBL, M143), ATG16 (Cell Signaling Technology, 2011), ULK1 (Sigma-Aldrich, A7481), LC3B (MBL, PM036), LC3B (Sigma, L7543), GABARAPL2/GATE16 (MBL, PM038). SQSTM1/p62 (MBL, PM045), cleaved CASP3 (Cell Signaling Technology, 9664), GST (Cell Signaling Technology, 2625), TUBA4A/α-tubulin (Sigma-Aldrich, T6074), GAPDH (Santa Cruz Biotechnology, sc-365062), GFP (Santa Cruz Biotechnology, sc-9996), BECN1 (Cell Signaling Technology, 3495), TP53 (Proteintech, 10442–1-AP), LAMP1 (DSHB, H4A3). Secondary antibodies conjugated with Dylight-488, −594 or horseradish peroxidase were from Thermo Fisher Scientific (35503, 35511, 35553, and 35561).
Chloroquine (CQ; A506569) was from Sangon Biotech. Bafilomycin A1 (Baf; B-1080) and rapamycin (Rap; ASW-125) were from LC Laboratories. 3-methyladenine (3-MA; S2767) and Z-VAD-FMK (S7023) were from Selleckchem. LysoTracker Red (LTR; L12492), dequenched-BSA (DQ-BSA) Red (D12051), and Lipofectamine 2000 (11668–019) were from Life Technologies. Acridine orange (AO) (A6014) and puromycin (P8833) were from Sigma-Aldrich. KLK (kallikrein) (Sangon Biotech, A600545), factor Xa (Aglyco, AG00-0102), F2/thrombin (Jingke, PRO-447), and plasmin (Biovision, 4089) were used for serine protease assay. Peptides S2765, S2266, S2251, and S2238 were customized by GL Biochem. Substrates Ac-DEVD-AFC (CASP-048), Ac-IETD-pNA (CASP-090), and Ac-LEHD-AFC (CASP-088) for CASP3, CASP8, and CASP9 were from Chinese Peptide Company, Mca-Gly-Lys-Pro-Ile-Leu-Phe-Arg-Leu-Lys(Dnp)-D-Arg-NH2 (BML-P145-0001) for CTSD and CTSE were all from Enzo Life Sciences. PLD (BML-SE301-0025) was from Enzo Life Sciences.
The plasmids encoding flag-ATG4A, flag-ATG4B, and flag-ATG4BC74S were described previously [Citation12]. The shRNA control and shATG4B were gifts from Dr. Shu (Kaohsiung Veterans General Hospital, Kaohsiung, Taiwan) [Citation18]. The plasmid encoding LC3-GST in pcDNA3.1(+) (Addgene, V790-20) was generated and stored in our lab. Briefly, cDNA fragments encoding LC3B and GST were introduced into the vector pcDNA3.1(+) for the expression of exogenous LC3-GST in mammalian cells.
Cell culture and transfection
HeLa, ATG4B-deficient HeLa (ATG4BKO-HeLa), HCT116, HL60, HEK293T, MEF, atg5 KO MEF, and rb1cc1 KO MEF cells were cultured in DMEM (Thermo Fisher Scientific, 11965092) supplemented with 10% (v:v) fetal bovine serum (Gibco, 10270) and 10 U/ml of penicillin-streptomycin (Gibco, 15140–122) at 37ºC in a humidified 5% CO2 incubator. Earle’s balanced salt solution (EBSS; Sigma-Aldrich, E2888) without other supplements was used for starvation medium. For transient expression, cells were split in 6-well plates and were transfected with freshly prepared plasmids using Lipofectamine 2000 and protein level was analyzed 24–48 h later.
Preparation of ATG4B knockout HeLa cells
The design of gRNAs was based on recommendations from the Zhang laboratory website (http://crispr.mit.edu/). To construct the gRNA expression plasmid, complementary oligonucleotides encoding gRNAs were annealed and cloned into BsmBI (Thermo Fisher Scientific, ER0451) sites in lentiCRISPRv2 (Addgene, 98291; Brett Stringer lab). Target GFP sgRNA sequences were 5ʹ-GTGAACCGCATCGAGCTGAA-3ʹ. Target ATG4B sgRNA sequences were 5ʹ-CAGTATCCAAACGGGCTCTG-3ʹ. Lentiviral particles were generated by transfection of HEK293T cells with lentiCRISPRv2-gRNA construct psPAX2 (Addgene, 12259; Didier Trono Lab) and pMD2.G (Addgene, 12260: Didier Trono lab) at a ratio of 4:3:1, respectively. Viral supernatants were collected 48–72 h following transfection and concentrated using the centrifugal filter (Millipore, UFC901008) according to the manufacturer’s protocol. HeLa cells were seeded at 40% confluency. Then cells were transduced with lentivirus via spinfection in 12-well plates for 24 h. Then cells were detached with TrypLE (Thermo Fisher Scientific, 12604021) and split at low density, and 1 μg/ml of puromycin was added after 3 h. Four days later, cells were harvested for extraction of genomic DNA for T7 endonuclease I (T7E1) assay (New England Biolabs, M0302s). ATG4B-deficient clones were identified by western blot.
Molecular docking and in silico screening
A custom chemical library containing 7,249 non-commercial chemicals was used in the screening study. The crystal structure of human ATG4B (PDB code: 2CY7) at a resolution of 1.9 Å was used for the virtual screening. Because there was no co-crystallized small molecule ligands with ATG4B, a molecular docking instead of a pharmacophore model were applied. Protein structure preparation for the docking suite included water deletion, hydrogen-atom addition and protonation-state adjustment, and the optimal docking pocket was confirmed with the Accelrys Discovery Studio 2.5.5 software (Accelrys, San Diego, CA, USA). Ligands were prepared by MOE.2010 conformations model to obtain energy-minimized 3D structures, which were then docked into the ligand-binding pocket of 2CY7 with the Accelrys Discovery Studio Client 2.5.5 molecular-docking program. Compounds were scored in 50 different conformations into the selected active pocket with output of total scores and orientations. Compounds (500) with appropriate binding patterns and highest docking scores were tested for further validating. Structures of ATG4B and ATG4A and compound docking models were obtained using PyMOL software (DeLano Scientific, Palo Alto, CA, USA).
Screening of ATG4B inhibitors by FRET assay
A FRET assay for ATG4B activity was performed as described previously [Citation29]. Briefly, ATG4B (0.75 µg/ml) was incubated with 10 µM of compounds in Tris-buffer (20 mM, pH 7.4) in 384-well plates at 37ºC for 30 min. Substrate FRET-GABARAPL2 (50 µg/ml) [Citation29] was then added to a total volume of 50 µl. The relative fluorescence units (RFUs) ratio of 527nm:477nm at the end of 30 min were determined. The relative cleavage activity of ATG4B was calculated as described previously [Citation29]. For a given compound, the concentration-response curves were plotted by the percentage of the inhibition, and the IC50 values were calculated by Graphpad 6.0 (GraphPad Software, La Jolla, CA, USA).
Chemical synthesis of S130 and NSC185058
A solution of phenanthraquinone (1.0 eq, 50 mM; Macklin, P815831) and methoxyamine hydrochloride (1.0 eq, 50 mM; Heowns, M-70420) in EtOH (150 ml) was refluxed for 3 h. After cooling, the crude product was concentrated under reduced pressure and used for next reaction without further purification. The crude product was used as starting material for synthesis of S130 via a 4-step transformation according to a previous study [Citation40]. The residue was purified with silica gel chromatography and eluted with 5% MeOH in dichloromethane to give the product S130 which was fully characterized by 1H- and 13C-NMR, and LC-MS.
2-aminopyridine (2.06 g, 1.1 eq.; Heowns, A-794634), elemental sulfur (1.92 g, 3.0 eq.; Energy Chemical, E0808471000), and 2-methylpyridine (1.95 ml, 1.0 eq.; Energy Chemical, W330007) were mixed in the inert atmosphere. The mixture was heated at 160°C for 18 h. Then the mixture was extracted with ethyl acetate and water. The combined organic layer was washed with brine (Energy Chemical, E0103685000), dried over anhydrous Na2SO4 and concentrated under reduced pressure. The crude reaction mixture was purified by flash silica gel column chromatography (1:40 ethyl acetate:petroleum ether) to generate the NSC185058, which was fully characterized by 1H- and 13C-NMR, and LC-MS.
Surface plasmon resonance (SPR) analysis
SPR measurements were performed on a ProteOn XPR36 Protein Interaction Array system (Bio-Rad Laboratories, Hercules, CA, USA). Briefly, purified ATG4B and ATG4BC74S (50 μg/ml, pH 3.0) were immobilized (~ 10,000 RU) on a ProteOn GLH Sensor Chip (Bio-Rad Laboratories) according to a standard amine coupling procedure. PBST (10 mM Na3PO4, 150 mM NaCl, 0.01% Tween 20 [Genstar, VA29901], pH 7.4) was used as the running buffer for immobilization. After immobilization, the solution of S130 and NSC185058 was prepared with running buffer through serial dilutions of stock solution. Five concentrations (0, 0.625, 1.25, 2.5, and 5 μM) were injected simultaneously at a flow rate of 30 μl/min for 60 sec of association phase, followed by 120 sec of disassociation phase at 25°C. The GLH chip was regenerated with a short injection of 0.85% H3PO4 between consecutive measurements. The final graphs were obtained by subtracting blank sensorgrams. Experimental data was collected with ProteOn manager software and was analyzed to fit to an appropriate binding model to obtain the equilibrium dissociation constant (Kd).
Immunoblot and immunofluorescence assays
For immunoblot assay, 20–30 µg of total protein were usually separated by SDS-PAGE to avoid saturation and transferred to PVDF membranes (Millipore, ISEQ00010). Primary antibodies were used, followed by HRP-conjugated secondary antibodies. Specific proteins were detected using enhanced chemiluminescence developing agents (Millipore, WBULS0500). Densitometry was performed with an ImageQuat LAS 4000 mini (GE, Uppsala, Sweden), a detection system that has a wider linear dynamic range, and the companion software. The density of LC3-II was first normalized to the loading control. Then the ratio of LC3-II:TUBA4A is converted to numbers relative to that of the control treatment.
Immunofluorescence staining was carried out as described previously [Citation41]. Briefly, HeLa cells were cultured and treated with different chemicals on a 3-cm Petri dish, then 4% paraformaldehyde was used to fix the cells for 15 min followed by permeabilization (0.1% Triton X100 [Sangon Biotech., T0694]) and blocking in phosphate-buffered saline (PBS; Boster Biological Technological Technology, AR0030) containing 5% BSA (Guangzhou XiangBo Biological technology, XB-A-0332). Primary antibodies (1:150) and Alexa Fluor 488/594-conjugated secondary antibodies (1:500; Thermo Fisher Scientific, OB183340, NJ176689, or OC183338) were applied sequentially. Fluorescence images were taken using EVOS FL Auto (Life Technologies, Bothell, WA, USA). At least 50 cells per experimental condition were analyzed for quantification.
Protease activity assay
HeLa cells were treated with 1 µM of staurosporine (Selleckchem, S1421) for 5 h to induce cell apoptosis. Five µg of the cell lysates were incubated with 100 µM of S130 in Tris-buffer (20 mM, pH 7.4) in 384-well plates at 37ºC for 30 min. The fluorogenic substrates Ac-DEVE-AFC (25 µM) for CASP3, Ac-LEHD-AFC (25 µM) for CASP9 or the colorimetric substrate Ac-IETD-pNA (50 µM) for CASP8 were then added to a total volume of 50 µl. The cysteine proteases activity was measured at 37ºC for 1 h using a spectrophotometer with excitation of 400 nm and emission of 505 nm for the fluorescence substrate AFC, and the free pNA was quantified at 37ºC using a spectrophotometer (λ = 400 nm). Two µg of cell lysates were incubated with 100 µM of S130 for 30 min, then the substrates Mca-Gly-Lys-Pro-Ile-Leu-Phe-Phe-Arg-Leu-Lys (Dnp)-D-Arg-NH2 was added for aspartate protease assays of CTSD and CTSE. For serine protease activity, 100 µM of S130 was mixed with 100 IU/ml of F2/thrombin, 0.08 mg/ml of plasmin, 0.05 mg/ml of KLK (kallikrein), or 0.01 U/ml of factor Xa for 30 min, then 0.3 mM of substrates S2238, S2251, S2266, or S2765 were added to the above mixture separately. The colorimetric change of enzymatic products was recorded at the end of a 30 min reaction by spectrophotometer.
Lysosomal function analysis
Lysosomal acidity of HeLa cells was examined by incubating cells with LTR (50 nM) or AO (0.5 μg/ml) for 20 to 30 min at 37ºC in HBSS medium followed by washing with PBS. The fluorescence intensity was then measured by fluorescence microscopy. To determine the lysosomal degradation capacity, cells were incubated with 10 μg/ml of DQ-BSA Red in EBSS medium for 1.5 h at 37ºC. Then new medium with or without 10 µM of S130 was added for another 4 h. The degradation capacity of lysosomes was measured by monitoring the appearance of red fluorescence due to the degradation of DQ-BSA Red, which was then quantified.
Cell viability assay
Cells were seeded in 96-well plates (5 × 10³ cells per well) and incubated overnight before being treated with different concentrations of compounds for 48 h. Cell viability was measured by adding 10% CCK-8 (Bimake, B34304) for an additional 1–2 h. Absorbance was measured at 450 nm. Cell viability was calculated from 3 independent experiments and normalized to the absorbance of wells containing medium only (100%) and that of wells containing untreated cells (0%).
GFP-LC3 translocation analysis
Cells stably expressing GFP-LC3 were treated with compounds at the indicated concentrations for different time points prior to fixation. Fluorescence images were taken using EVOS FL Auto. The number of GFP-LC3 dots was counted from at least 100 cells from randomly placed fields within each sample.
Clonogenic assay
HeLa Cells were seeded in 6-well plates at a density of 800 cells per well and incubated overnight. The cells were cultured for 2 weeks, with the medium changed every 3 d in the presence or absence of 0–10 µM of S130. The cell colonies were fixed with 4% paraformaldehyde and stained with 0.2% crystal violet (in 10% formalin) for 15 min at room temperature. The stained cells were washed with PBS and the numbers of cell colonies were counted. Colonies over 1 mm were counted in at least 3 independent experiments.
TUNEL assay
Paraffin-embedded tumor sections were de-paraffinized in xylene, and rehydrated with decreasing concentrations of ethanol. Apoptosis was detected by in situ TUNEL using the TACS2 TdT DAB in situ apoptosis detection kit (Trevigen, 4810–30-K). In brief, tumor sections were treated with 50 µl of a proteinase K solution for 20 min and quenched in freshly prepared 3% hydrogen peroxide in methanol for 5 min at room temperature. Then sections were washed in PBS and labeled with the TdT reaction mix at 37ºC for 1 h in a humidified chamber. Chromogenic detection was developed with streptavidin-HRP solution for 10 min, followed by incubation with DAB solution for 5 min at room temperature. Tissues were counterstaining with 1% methyl green and mounted with Clarion mounting medium (Vector Laboratories, 3304767). Cells were counted in 3 visual fields containing more than 500 cells.
Tumor xenograft studies
Four-weeks-old BALB/c nude female mice were kept in a pathogen-free environment at the Experimental Animal Center in Sun Yat-Sen University. The animal experiments were approved by the Research Ethics Committee of Sun Yat-Sen University. Approximately 2 × 10⁶ HCT116 cells were injected into the dorsal flank on the right side of the animals. Thirteen days later, when the tumor volume was approximately 50 mm3, the mice were randomly divided into 4 groups (n = 6 per group): Vehicle control (VC) (normally fed, receiving daily intraperitoneal [i.p.] PBS); S130 (normally receiving daily i.p. 20 mg/kg of S130); caloric restriction (CR; fed with 70% of their normal food intake, receiving daily i.p. PBS); S130+ CR (caloric restriction mice receiving daily i.p. 20 mg/kg of S130). Tumor growth was monitored by calipers, and volume was calculated with the equation V = (larger diameter) × (smaller diameter)2/2. Body weight during the course of the study was also monitored. At the end of the experiments (5 wks after tumor implantation), the mice were sacrificed and tumors were dissected and weighed. Additionally, heart, liver, spleen, lung and kidney were harvested and weighed.
Histology and immunohistochemistry
The colorectal tumor tissues and important organs of mice were fixed with 4% paraformaldehyde at room temperature for 48 h. Then, the selected samples were embedded in paraffin, sectioned and stained with hematoxylin and eosin. Nonspecific immunoglobulin binding was blocked with 3% BSA for 30 min at room temperature. Slides were then incubated at room temperature for 30 min with primary antibodies: cleaved CASP3 (1:800) or SQSTM1 (1:1000). After incubation, the sections were washed and incubated with horseradish peroxidase-conjugated secondary antibodies for 30 min followed by incubation with diaminobenzidine substrate kit and counterstained using Harris hematoxylin (Sigma-Aldrich, HHS128). The remainders of the frozen sections were utilized for hematoxylin and eosin (H&E) staining to examine basic lesion morphology.
Transmission electron microscopy
Electron microscopy was performed as described previously [Citation42]. Briefly, cells in 6-well plates or tumor tissues were fixed in 2.5% glutaraldehyde (Sigma-Aldrich, G5882) in 0.1 M phosphate buffer (pH 7.4) for 2 h, and then dehydrated in a graded ethanol series and embedded. Ultrathin sections were mounted on copper grids. The samples were then stained and visualized using electron microscope Tecnai G2 20 Twin (FEI, USA).
Pharmacokinetic studies
BALB/c nude female mice with HCT116 xenograft tumor were randomly divided into 13 groups, 5 mice per group. S130 was administered by i.p. at 20 mg/kg. Plasma and tissue samples were collected at 2, 5, 15, 30, 60, 75, and 90 min, and 2, 5, 8, 12, and 24 h following the injection.
S130 concentrations in plasma and tissue samples were determined using the UHPLC coupled with a TSQ Ultra triple-quadrupole mass spectrometer (Thermo Fisher Scientific Inc., Boston, MA, USA). Sample preparation was performed using a liquid-liquid extraction. Sample (100 µl) and 10 μl of IS solution (50 ng/ml; Aladdin, L129223) were mixed for 60 sec. Then, extraction solvent (methyl tert-butyl ether:ethyl acetate, 4:1, v:v) for plasma (500 μl) and for tissue samples (1000 μl) was added followed by vortexing for 3–5 min and centrifugation at 14,000 x g at 4°C for 10 min. The supernatant was evaporated. Finally, the resultant residue was dissolved into 100 μl of acetonitrile: 0.1% formic acid water solution mixture (78:22, v:v) with vortex-mixing for 2 min and then were centrifuged at 14,000 x g at 4°C for 5 min. Samples were separated on an JADE-PAK CB-C18 Column (2.1 mm × 100 mm with 3-μm particle size, Techway, CN, USA).
Pharmacokinetic analysis of the plasma and tissue concentration data were performed by non-compartmental analysis in Phoenix WinNonlinTM (version 7.0. USA, Pharsight), using actual elapsed time from dosing to estimate pharmacokinetic parameters. The main calculated PK parameters were shown as follows: the time of the maximum plasma concentration (Tmax), maximum of plasma concentration (Cmax), terminal elimination half-life (t1/2), the area under the concentration-time curve 0 to time (AUC0-t), the area under the concentration-time curve 0 to infinity (AUC0-∞), apparent volume of distribution (V/F), elimination rate constant (ke), apparent total body clearance (CL/F) and mean resident time 0 to time infinity (MRT).
Statistical analysis
All results were expressed as means ± SEM/SD of at least 3 independent experiments. Statistical analyses were determined using the Student 2-tailed t test. Values of *P < 0.05 were considered as being significant.
Abbreviations
| 3MA | = | 3-methyladenine; |
| AO | = | acridine orange; |
| ATG4B | = | autophagy related 4B cysteine peptidase; Baf, bafilomycin A1; |
| CASP | = | caspase; |
| CM | = | complete medium; |
| CQ | = | chloroquine; |
| CR | = | caloric restriction; |
| CTS | = | cathepsin; |
| DQ-BSA | = | dequenched bodipy-conjugated BSA; |
| FMK | = | fluoromethylketone; |
| FRET | = | fluorescence resonance energy transfer; |
| GABARAP | = | GABA type A receptor-associated protein; |
| GABARAPL2/GATE16 | = | GABA type A receptor associated protein like 2; |
| HTS | = | high throughput screening; |
| KO | = | knockout; |
| LTR | = | LysoTracker Red; |
| MEFs | = | mouse embryonic fibroblasts; |
| PE | = | phosphatidylethanolamine; |
| PLA2 | = | phospholipase A2; |
| PLD | = | phospholipase D; |
| Rap | = | rapamycin; |
| SPR | = | urface plasmon resonance; |
| ROS | = | reactive oxygen species; |
| SQSTM1 | = | sequestosome 1 |
Supplemental Material
Download Zip (89.8 MB)Acknowledgments
We thank Dr. N Mizushima (University of Tokyo, Japan) for Atg5-deficient MEFs, Dr. Jun-Lin Guan (University of Cincinnati, Cincinnati, OH, USA) for Rb1cc1/Fip200-deficient MEFs. We thank Dr. Chih-Wen Shu for the shRNA constructs. We thank Dr. Haibin Luo and Dr. Ruibo Wu for their computer docking assistance. We thank Dr. Lianquan Gu, Dr. Min Huang, and Dr. Jun Xu for their contributions on the custom construction of a chemical library.
Disclosure statement
No potential conflict of interest was reported by the authors.
Supplementary material
Supplemental data for this article can be accessed here.
Additional information
Funding
Related Research Data
References
- Jiang P, Mizushima N. Autophagy and human diseases. Cell Res. 2014 Jan;24(1):69–79. PMID: 24323045.
- Choi AM, Ryter SW, Levine B. Autophagy in human health and disease. N Engl J Med. 2013 May 09;368(19):1845–1846. PMID: 23656658.
- Levine B, Packer M, Codogno P. Development of autophagy inducers in clinical medicine. J Clin Invest. 2015 Jan;125(1):14–24. PMID: 25654546.
- Galluzzi L, Bravo-San Pedro JM, Levine B, et al. Pharmacological modulation of autophagy: therapeutic potential and persisting obstacles. Nat Rev Drug Discov. 2017 Jul;16(7):487–511. PMID: 28529316.
- Nagelkerke A, Bussink J, Geurts-Moespot A, et al. Therapeutic targeting of autophagy in cancer. Part II: pharmacological modulation of treatment-induced autophagy. Semin Cancer Biol. 2015 Apr;31:99–105. PMID: 24933034.
- Amaravadi RK, Lippincott-Schwartz J, Yin XM, et al. Principles and current strategies for targeting autophagy for cancer treatment. Clin Cancer Res. 2011 Feb 15;17(4):654–666. PMID: 21325294.
- White E. Deconvoluting the context-dependent role for autophagy in cancer. Nat Rev Cancer. 2012 Apr 26;12(6):401–410. PMID: 22534666.
- Marino G, Uria JA, Puente XS, et al. Human autophagins, a family of cysteine proteinases potentially implicated in cell degradation by autophagy. J Biol Chem. 2003 Feb 07;278(6):3671–3678. PMID: 12446702.
- Nair U, Yen WL, Mari M, et al. A role for Atg8-PE deconjugation in autophagosome biogenesis. Autophagy. 2012 May 01;8(5):780–793. PMID: 22622160.
- Kirisako T, Ichimura Y, Okada H, et al. The reversible modification regulates the membrane-binding state of Apg8/Aut7 essential for autophagy and the cytoplasm to vacuole targeting pathway. J Cell Biol. 2000 Oct 16;151(2):263–276. PMID: 11038174.
- Li M, Fu Y, Yang Z, et al. Measurement of the activity of the Atg4 cysteine proteases. Methods Enzymol. 2017;587:207–225. PMID: 28253956.
- Li M, Hou Y, Wang J, et al. Kinetics comparisons of mammalian Atg4 homologues indicate selective preferences toward diverse Atg8 substrates. J Biol Chem. 2011 Mar 04;286(9):7327–7338. PMID: 21177865.
- Nakatogawa H, Ishii J, Asai E, et al. Atg4 recycles inappropriately lipidated Atg8 to promote autophagosome biogenesis. Autophagy. 2012 Feb 01;8(2):177–186. PMID: 22240591.
- Yu ZQ, Ni T, Hong B, et al. Dual roles of Atg8-PE deconjugation by Atg4 in autophagy. Autophagy. 2012 Jun 8;6:883–892. PMID: 22652539. DOI:10.4161/auto.19652.
- Mizushima N, Yoshimori T, Ohsumi Y. The role of Atg proteins in autophagosome formation. Annu Rev Cell Dev Biol. 2011;27:107–132. PMID: 21801009.
- Fujita N, Hayashi-Nishino M, Fukumoto H, et al. An Atg4B mutant hampers the lipidation of LC3 paralogues and causes defects in autophagosome closure. Mol Biol Cell. 2008 Nov;19(11):4651–4659. PMID: 18768752.
- Kabeya Y, Mizushima N, Yamamoto A, et al. LC3, GABARAP and GATE16 localize to autophagosomal membrane depending on form-II formation. J Cell Sci. 2004 Jun 01;117(Pt13):2805–2812. PMID: 15169837.
- Liu PF, Leung CM, Chang YH, et al. ATG4B promotes colorectal cancer growth independent of autophagic flux. Autophagy. 2014 Aug;10(8):1454–1465. PMID: 24991826.
- Read R, Savelieva K, Baker K, et al. Histopathological and neurological features of Atg4b knockout mice. Vet Pathol. 2011 Mar;48(2):486–494. PMID: 20634410.
- Marino G, Fernandez AF, Cabrera S, et al. Autophagy is essential for mouse sense of balance. J Clin Invest. 2010 Jul;120(7):2331–2344. PMID: 20577052.
- Scherz-Shouval R, Shvets E, Fass E, et al. Reactive oxygen species are essential for autophagy and specifically regulate the activity of Atg4. EMBO J. 2007 Apr 04;26(7):1749–1760. PMID: 17347651.
- Zhang L, Li J, Ouyang L, et al. Unraveling the roles of Atg4 proteases from autophagy modulation to targeted cancer therapy. Cancer Lett. 2016 Apr 01;373(1):19–26. PMID: 26805760.
- Akin D, Wang SK, Habibzadegah-Tari P, et al. A novel ATG4B antagonist inhibits autophagy and has a negative impact on osteosarcoma tumors. Autophagy. 2014;10(11):2021–2035. PMID: 25483883.
- Rothe K, Lin H, Lin KB, et al. The core autophagy protein ATG4B is a potential biomarker and therapeutic target in CML stem/progenitor cells. Blood. 2014 Jun 05;123(23):3622–3634. PMID: 24755409.
- Vezenkov L, Honson NS, Kumar NS, et al. Development of fluorescent peptide substrates and assays for the key autophagy-initiating cysteine protease enzyme, ATG4B. Bioorg Med Chem. 2015 Jul 01;23(13):3237–3247. PMID: 25979376.
- Cleenewerck M, Grootaert MO, Gladysz R, et al. Inhibitor screening and enzymatic activity determination for autophagy target Atg4B using a gel electrophoresis-based assay. Eur J Med Chem. 2016 Nov 10;123:631–638. PMID: 27517808.
- Shu CW, Madiraju C, Zhai D, et al. High-throughput fluorescence assay for small-molecule inhibitors of autophagins/Atg4. J Biomol Screen. 2011 Feb;16(2):174–182. PMID: 21245471.
- Qiu Z, Kuhn B, Aebi J, et al. Discovery of fluoromethylketone-based peptidomimetics as covalent ATG4B (Autophagin-1) inhibitors. ACS Med Chem Lett. 2016 Aug 11;7(8):802–806. PMID: 27563406.
- Li M, Chen X, Ye QZ, et al. A high-throughput FRET-based assay for determination of Atg4 activity. Autophagy. 2012 Mar 8;3:401–412. PMID: 22302004. DOI:10.4161/auto.18777.
- Liu J, Xia H, Kim M, et al. Beclin1 controls the levels of p53 by regulating the deubiquitination activity of USP10 and USP13. Cell. 2011 Sep 30;147(1):223–234. PMID: 21962518.
- Xu D, Shan B, Sun H, et al. USP14 regulates autophagy by suppressing K63 ubiquitination of Beclin 1. Genes Dev. 2016 Aug 1;30(15):1718–1730. PMID: 27542828.
- Wang W, Chen Z, Billiar TR, et al. The carboxyl-terminal amino acids render pro-human LC3B migration similar to lipidated LC3B in SDS-PAGE. PLoS One. 2013;8(9):e74222. PMID: 24040206.
- Tanida I, Sou YS, Ezaki J, et al. HsAtg4B/HsApg4B/autophagin-1 cleaves the carboxyl termini of three human Atg8 homologues and delipidates microtubule-associated protein light chain 3- and GABAA receptor-associated protein-phospholipid conjugates. J Biol Chem. 2004 Aug 27;279(35):36268–36276. PMID: 15187094.
- Kimura S, Noda T, Yoshimori T. Dissection of the autophagosome maturation process by a novel reporter protein, tandem fluorescent-tagged LC3. Autophagy. 2007 Sep-Oct;3(5):452–460. PMID: 17534139.
- Li H, Ban F, Dalal K, et al. Correction to discovery of small-molecule inhibitors selectively targeting the DNA-binding domain of the human androgen receptor. J Med Chem. 2017 Feb 09;60(3):1225. PMID: 28118004.
- Till A, Subramani S. A balancing act for autophagin. J Clin Invest. 2010 Jul;120(7):2273–2276. PMID: 20577044.
- Mouratidis PX, Colston KW, Charolidi N, et al. Differential role of apoptosis and autophagy associated with anticancer effect of lupulone (hop beta-acid) derivatives on prostate cancer cells. Anticancer Agents Med Chem. 2014;14(8):1169–1178. PMID: 24954859.
- Apel A, Herr I, Schwarz H, et al. Blocked autophagy sensitizes resistant carcinoma cells to radiation therapy. Cancer Res. 2008 Mar 01;68(5):1485–1494. PMID: 18316613.
- Li M, Yang Z, Vollmer LL, et al. AMDE-1 is a dual function chemical for autophagy activation and inhibition. PLoS One. 2015;10(3):e0122083. PMID: 25894744.
- Tang H, Wei YB, Zhang C, et al. Synthesis, biological evaluation and molecular modeling of oxoisoaporphine and oxoaporphine derivatives as new dual inhibitors of acetylcholinesterase/butyrylcholinesterase. Eur J Med Chem. 2009 Jun;44(6):2523–2532. PMID: 19243862.
- Li M, Khambu B, Zhang H, et al. Suppression of lysosome function induces autophagy via a feedback down-regulation of MTOR complex 1 (MTORC1) activity. J Biol Chem. 2013 Dec 13;288(50):35769–35780. PMID: 24174532.
- Gao Y, Liu YJ, Hong L, et al. Golgi-associated LC3 lipidation requires V-ATPase in noncanonical autophagy. Cell Death Dis. 2016 Aug 7. PMID: WOS:000382077800017.