
ABSTRACT
Macroautophagy/autophagy is one of the major responses to stress in eukaryotic cells and is implicated in several pathological conditions such as infections, neurodegenerative diseases and cancer. Interestingly, cancer cells take full advantage of autophagy both to support tumor growth in adverse microenvironments and to oppose damages induced by anti-neoplastic therapies. Importantly, different human oncogenes are able to modulate this survival mechanism to support the transformation process, ultimately leading to ‘autophagy addiction’. Still, oncogenic signaling events, impinging on the control of autophagy, are poorly characterized, limiting our possibilities to take advantage of these mechanisms for therapeutic purposes. Here, we screened a library of activated kinases for their ability to stimulate autophagy. By this approach, we identified novel potential regulators of the autophagic process and, among them, the IKBKE oncogene. Specifically, we demonstrate that this oncoprotein is able to stimulate autophagy when overexpressed, an event frequently found in breast tumors, and that its activity is strictly required for breast cancer cells to support the autophagic process. Interestingly, different oncogenic pathways typically involved in breast cancer, namely ERBB2 and PI3K-AKT-MTOR, also rely on IKBKE to control this process. Ultimately, we show that IKBKE-dependent autophagy is necessary for breast cancer cell proliferation, suggesting an important supporting role for this oncogene and autophagy in these tumors.
Abbreviations: AAK1: AP2 associated kinase 1; AMPK: 5ʹ-prime-AMP-activated protein kinase; AKT1: AKT serine/threonine kinase 1; BAF: bafilomycin A1; CA: constitutively activated; CDK17: cyclin dependent kinase 17; CDK18: cyclin dependent kinase 18; CHUK: conserved helix-loop-helix ubiquitous kinase; EGF: epidermal growth factor; ERBB2: erb-b2 receptor tyrosine kinase 2; FGF: fibroblast growth factor; FM: full medium; GALK2: galactokinase 2; IKBKB: inhibitor of nuclear factor kappa B kinase subunit beta; IKBKE: inhibitor of nuclear factor kappa B kinase subunit epsilon; IKK: IκB kinase complex; KD: kinase dead; MAP1LC3B/LC3B: microtubule associated protein 1 light chain 3 beta; MAPK1: mitogen-activated protein kinase 1; MAPK15: mitogen-activated protein kinase 15; MTORC1: mammalian target of rapamycin kinase complex 1; myr: myristoylation/myristoylated; NFKBIA: NFKB inhibitor alpha; PDGF: platelet derived growth factor; PFKL: phosphofructokinase, liver type; PRKAA1: protein kinase AMP-activated catalytic subunit alpha 1; PRKCD: protein kinase C delta; SQSTM1: sequestosome 1; TBK1: TANK binding kinase 1; TNBC: triple-negative breast cancer; TSC2: TSC complex subunit 2; WB: western blot; WT: wild-type.
Introduction
Cell metabolism has recently emerged for its central relevance in a growing panel of human diseases. In this context, autophagy has become interesting because, together with proteasomal degradation, it is the main pathway for cell catabolism. Macroautophagy (herein referred to as autophagy) is an evolutionarily conserved cellular degradation process that targets cytoplasmic materials including long-lived cytosolic macromolecules and old/damaged organelles [Citation1]. As such, autophagy represents a physiologically relevant survival mechanism for all eukaryotic cells to respond to environmental adversities, especially starvation, while continuously exerting protein and organelle quality control, and whose failure has been demonstrated to associate to neurodegenerative disease, inflammation and cancer [Citation1]. Specifically, there is increasing evidence that autophagy is necessary for tumor growth in multiple cancer types, by supporting the highly demanding metabolic needs of tumors, as well as promoting resistance by coping with the stress induced by multiple therapeutic approaches [Citation2]. Particularly, breast tumors have shown a clear tumor-promoting role for autophagy while this process has been involved in resistance to both classical and more innovative therapies [Citation3].
Despite tremendous progresses made in the last 2 decades, our understanding of autophagy is still relatively limited. Particularly, very little is known about the signaling proteins coordinating responses to distinct intracellular and extracellular stimuli. In order to individuate new proteins regulating autophagy, possibly representing relevant targets for pharmacological modulation in human cancer, we decided to examine protein kinases, as they are known to be more easily ‘druggable’ compared to other proteins or enzymes.
We, therefore, took advantage of the availability of a library of myristoylated, constitutively active kinases [Citation4], to screen for their ability to modulate the autophagic process, by monitoring the amount of lipidated LC3B, the most used marker for autophagosomes [Citation5]. Using this approach, we identified an oncogenic kinase, IKBKE (inhibitor of nuclear factor kappa B kinase subunit epsilon), as a positive modulator of the autophagic process. IKBKE and TBK1 (TANK binding kinase 1; 67% amino acid identity with IKBKE) have been defined as non-canonical IκB kinases (IKK), based on sequence similarities with the 2 canonical IKKs, i.e. CHUK/IKKα/IKBKA and IKBKB/IKKβ, but their dispensability for nuclear factor of kappa light polypeptide gene enhancer in B-cells inhibitor alpha, NFKBIA/IκBα phosphorylation [Citation6]. IKBKE, in particular, has been described to impact on inflammatory and metabolic diseases as well as on cell proliferation and transformation [Citation6]. Importantly, IKBKE is frequently amplified or overexpressed in a number of human cancers, in particular of the breast, and is implicated in their tumorigenic process [Citation4,Citation7], overall being considered an important human oncogene.
Results
Screening of a library of myristoylated, constitutively active kinases to identify regulators of the autophagic process
In order to identify novel genes controlling cellular autophagy, we screened a library of myristoylated, constitutively active kinases (Table S1) [Citation4]. Indeed, expression of myristoylated (myr) isoforms of human kinases leads to membrane recruitment, often resulting in their activation [Citation8,Citation9]. According to this information, Hahn’s lab has created and made available a library of 170 kinases that are recruited to cytoplasmic membranes through a ‘myr’ sequence [Citation4]. By expressing these ‘myr’ kinases, they already identified new oncogenes, by analyzing the ability of cells to grow in an anchorage-independent manner and to form tumors in immunodeficient animals [Citation4].
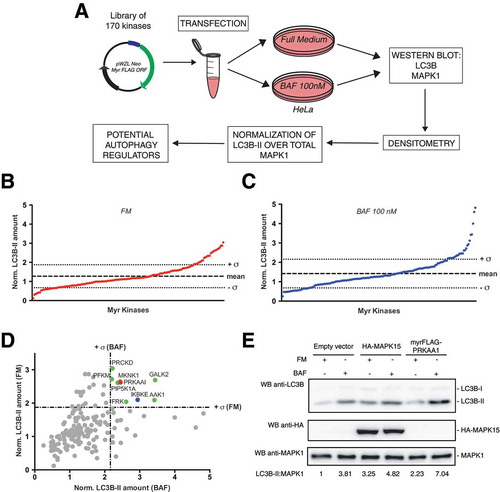
We, therefore, decided to take advantage of this ‘platform’ to discover autophagy-regulating kinases, by transfecting HeLa cells with constructs from Hahn’s library [Citation4] and next analyzing the amount of autophagosomal vesicles, by scoring the levels of the lipidated form of LC3B, LC3B-II, by western blot (WB) analysis [Citation5]. To improve predictability of our autophagy-inducing assay, we also tested, in the same experiments, LC3B-II levels in corresponding kinase-stimulated samples treated with a lysosomal protease inhibitor, namely bafilomycin A1 (BAF), to analyze the autophagic flux [Citation5]. Indeed, while an increase in LC3B-II level in steady state conditions (full medium, FM) corresponds to an increase in the amount of autophagosomes in cells, this may be due to activation or late inhibition of the autophagic process. Therefore, in order to distinguish between these opposite circumstances, it is necessary to compare LC3B-II levels in FM with those of the corresponding samples treated with lysosomal protease inhibitors: if autophagic flux is increased, the amount of LC3B-II will be higher in presence of inhibitors (the autophagic process is active) while, if the autophagic process is inhibited, the amount of LC3B-II will not increase in presence of inhibitors (the flux is blocked) [Citation5]. Specifically, we performed multiple experiments each including 5 MYR kinases, a negative control (empty vector, to monitor the effect of transient transfection on basal autophagy) and a positive control, i.e. MAPK15 [Citation10] ()). Each sample was monitored both with and without BAF. Next, for each kinase and controls, LC3B-II and MAPK1 protein levels were quantified and LC3B-II amount was normalized on MAPK1, used as a housekeeping protein ()). Normalized LC3B-II amounts were ultimately expressed as fold induction relative to corresponding negative controls treated or not with BAF (Table S2). From this list, kinases showing normalized LC3B-II values higher than + σ in both FM ()) and BAF ()) conditions were considered potential inducers of autophagy ()). Confirming the strength of the experimental approach used for our screening, the protein kinase AMP-activated catalytic subunit alpha 1 (PRKAA1), was also identified among our best hits (). This protein indeed represents the catalytic subunit of the 5ʹ-prime-AMP-activated protein kinase (AMPK), a master regulator of metabolism, inducing autophagy (among other catabolic processes) during metabolic stress [Citation11]. Importantly, this trimeric enzyme needs to be localized to membranes by a MYR signal present in its β regulatory subunit [Citation11].
Figure 1. Screening of a library of MYR kinases to identify regulators of the autophagic process. (a) Schematic representation of the experimental approach used to perform the screening of 170 constitutively active kinases for their ability to modulate the autophagic process, in HeLa cells. (b) Normalized LC3B-II levels, obtained by western blot (WB) analysis, of samples transfected with each activated kinase, in Full Medium (FM) conditions. The graph shows also the mean value of the screening and its standard deviation (σ). (c) Same as in (b), but after 1 h of 100 nM bafilomycin A1 (BAF) treatment. (d) Integration of results shown in (b) and (c), to show potential positive regulators of the autophagic flux, identified as kinases inducing normalized LC3B-II values higher than + σ in both FM and BAF conditions (in colors). (e) WB analysis to evaluate autophagic flux of HeLa cells upon myrFLAG-PRKAA1 overexpression. Transfection with an empty vector was used as a negative control. Transfection with HA-MAPK15 was used as a positive control for activation of the autophagic flux. Where indicated, 1 h treatment with 100 nM BAF was performed. Densitometric analysis of LC3B-II levels, normalized by the corresponding MAPK1 levels (used as loading control), is also shown. Results from one experiment, representative of 3 independent experiments (n = 3) are shown.
Ultimately, kinases with LC3B-II amounts lower than -σ in FM and BAF, e.g. CDK17/PCTK2 and CDK18/PCTK3 (Figure S1), were considered potential inhibitors of autophagy but were not studied further in this work.
Overexpression of the breast cancer human oncogene IKBKE induces autophagy
Based on our interest on the ‘promoting’ role of autophagy in cancer [Citation12,Citation13], among our positive ‘hits’, we decided to further investigate the role of IKBKE, a well-established human oncogene [Citation4,Citation6,Citation14], in the autophagic process. First, we confirmed the result regarding this kinase obtained in the screening, by independent autophagic flux analysis in HeLa cells, upon overexpression of this MYR kinase ()). Then, as most tumors with alterations of IKBKE show amplifications and overexpression of the wild-type (WT) gene (Figure S2 and [Citation4,Citation7]), we also investigated if the natural occurring oncogenic alteration (overexpression of the WT protein) was sufficient to stimulate the autophagic flux, in our cellular system. Therefore, we overexpressed a wild-type IKBKE (IKBKE [WT]) in HeLa cells and observed strong induction of autophagy ()), excluding the possibility of non-specific effects on this process due to the MYR signal and consequent post-translational modification present in the artificial myristoylated IKBKE (myrIKBKE) construct used for the screening. Based on this, we decided to use the wild-type IKBKE construct for following experiments.
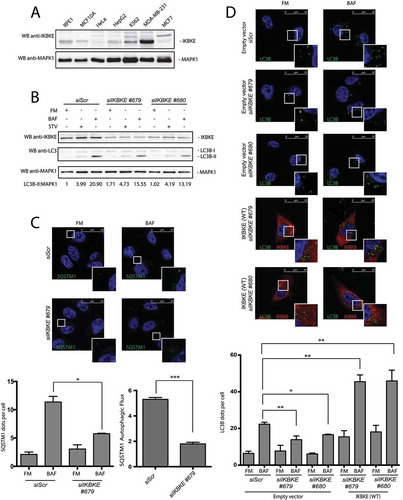
Figure 2. The IKBKE human oncogene induces autophagy. (a) WB analysis to evaluate autophagic flux of HeLa cells upon myrFLAG-IKBKE overexpression. Transfection with an empty vector was used as a negative control. Transfection with HA-MAPK15 was used as a positive control. Where indicated, 1 h treatment with 100 nM BAF was performed. Densitometric analysis of LC3B-II levels, normalized by the corresponding MAPK1 levels, is also shown. Results from one experiment, representative of 3 independent experiments (n = 3) are shown. (b) WB analysis to evaluate autophagic flux of HeLa cells upon IKBKE (WT) overexpression. Transfection with an empty vector was used as a negative control. Where indicated, 1 h treatment with 100 nM BAF was performed. Densitometric analysis of LC3B-II levels, normalized by the corresponding MAPK1 levels, is also shown. Results from one experiment, representative of 3 independent experiments (n = 3) are shown. (c) Confocal microscopy analysis of HeLa cells, to evaluate autophagic flux upon IKBKE (WT) overexpression. HeLa cells, stably expressing the indicated plasmids (empty vector and IKBKE [WT]), were subjected to immunofluorescence analysis. Where indicated, 1-h treatment with 100 nM BAF was performed. In these representative images, LC3B is visualized in green, IKBKE (WT) in red, and DAPI-stained nuclei in blue. LC3B-positive dots were counted using a specific protocol by Volocity software (see graph in the lower panel). Scale bars: 25 μm. Results from one experiment, representative of 3 independent experiments (n = 3) are shown. (d) Confocal microscopy analysis of HeLa cells, to evaluate autophagic flux upon IKBKE (WT) overexpression. HeLa cells, expressing the indicated plasmids (Empty vector and IKBKE [WT]), were subjected to immunofluorescence analysis. Where indicated, 24 h treatment with 100 nM BAF was performed. In these representative images, SQSTM1 is visualized in green, IKBKE (WT) in red, and DAPI-stained nuclei in blue. SQSTM1-positive dots were counted using a specific protocol by volocity software (see graph in the lower panel). Scale bars: 25 μm. Results from one experiment, representative of 3 independent experiments (n = 3) are shown.
![Figure 2. The IKBKE human oncogene induces autophagy. (a) WB analysis to evaluate autophagic flux of HeLa cells upon myrFLAG-IKBKE overexpression. Transfection with an empty vector was used as a negative control. Transfection with HA-MAPK15 was used as a positive control. Where indicated, 1 h treatment with 100 nM BAF was performed. Densitometric analysis of LC3B-II levels, normalized by the corresponding MAPK1 levels, is also shown. Results from one experiment, representative of 3 independent experiments (n = 3) are shown. (b) WB analysis to evaluate autophagic flux of HeLa cells upon IKBKE (WT) overexpression. Transfection with an empty vector was used as a negative control. Where indicated, 1 h treatment with 100 nM BAF was performed. Densitometric analysis of LC3B-II levels, normalized by the corresponding MAPK1 levels, is also shown. Results from one experiment, representative of 3 independent experiments (n = 3) are shown. (c) Confocal microscopy analysis of HeLa cells, to evaluate autophagic flux upon IKBKE (WT) overexpression. HeLa cells, stably expressing the indicated plasmids (empty vector and IKBKE [WT]), were subjected to immunofluorescence analysis. Where indicated, 1-h treatment with 100 nM BAF was performed. In these representative images, LC3B is visualized in green, IKBKE (WT) in red, and DAPI-stained nuclei in blue. LC3B-positive dots were counted using a specific protocol by Volocity software (see graph in the lower panel). Scale bars: 25 μm. Results from one experiment, representative of 3 independent experiments (n = 3) are shown. (d) Confocal microscopy analysis of HeLa cells, to evaluate autophagic flux upon IKBKE (WT) overexpression. HeLa cells, expressing the indicated plasmids (Empty vector and IKBKE [WT]), were subjected to immunofluorescence analysis. Where indicated, 24 h treatment with 100 nM BAF was performed. In these representative images, SQSTM1 is visualized in green, IKBKE (WT) in red, and DAPI-stained nuclei in blue. SQSTM1-positive dots were counted using a specific protocol by volocity software (see graph in the lower panel). Scale bars: 25 μm. Results from one experiment, representative of 3 independent experiments (n = 3) are shown.](/cms/asset/5d2024fd-47ce-4ef3-8602-1172dada1374/kaup_a_1517855_f0002_c.jpg)
Indirect immunofluorescence microscopy, scoring the formation of punctate intracellular vacuoles stained for LC3B, is a key assay to monitor autophagy and to understand its dynamics [Citation5]. Therefore, in order to confirm our previous results and to expand their biological significance, we next performed indirect immunofluorescence analysis in HeLa cells overexpressing the IKBKE oncogene, aimed at scoring an increase in vesicles positive for endogenous LC3B. Overexpression of IKBKE in full medium or upon BAF treatment (which allows the detection of each autophagosome formed in the time-lapse between addition of the drug to cells and harvesting), led to a strong increase of autophagic flux, as compared to empty vector transfected cells ()).
To confirm the nature of the autophagic vesicles detected by anti-LC3B immunofluorescence, we also investigated autophagic flux by taking advantage of a different but equally specific autophagosomal marker, SQSTM1/p62 [Citation5]. Indeed, in HeLa cells, SQSTM1 shows a cytoplasmic distribution in basal conditions while, although degraded at increased rate, it is relocalized to autophagic vesicles upon activation of autophagy [Citation10]. By counting the number of SQSTM1-positive vesicles, we ultimately showed increased SQSTM1 autophagic relocalization in full medium and upon BAF treatment ()), overall confirming an accelerated autophagic flux induced by overexpression of the IKBKE oncogene.
Depletion of endogenous IKBKE expression in triple-negative breast cancer cells reduces their autophagic flux
IKBKE has been clearly indicated as a breast cancer oncogene, and breast cancer cell lines overexpressing this kinase show ‘oncogenic addition’ to it for proliferation and survival [Citation4,Citation7]. Indeed, triple-negative breast cancer (TNBC) MDA-MB-231 cells showed high expression levels of the oncogene, as compared to non-tumorigenic MCF10A cells [Citation4,Citation7,Citation15], and to immortalized and cancer cell lines from other tissues (RPE1, HeLa and K562 cells) ( and S3), overall supporting a pathogenic role of the kinase in breast cancer.
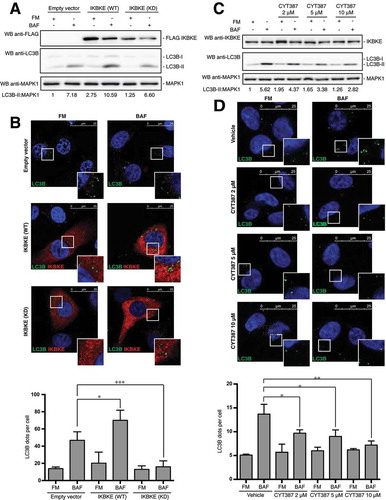
Figure 3. The IKBKE human oncogene induces autophagy in MDA-MB-231 breast cancer cells. (a) Endogenous IKBKE protein levels were tested in indicated cell lines, by WB analysis. (b) Autophagic flux was evaluated in MDA-MB-231 breast cancer cells, upon downregulation of endogenous IKBKE protein levels by transfection of appropriate siRNA (scrambled siRNA as negative controls, and 2 unrelated specific siRNA against human IKBKE, #679 and #680). Where indicated, samples were treated with 400 nM BAF or with starvation medium (STV) for 5 h. Densitometric analysis of LC3B-II levels, normalized by the corresponding MAPK1 levels, is also shown. Results from one experiment, representative of 3 independent experiments (n = 3) are shown. (c) Autophagic flux was evaluated in MDA-MB-231 breast cancer cells by confocal microscopy analysis of MDA-MB-231 breast cancer cells, upon downregulation of endogenous IKBKE protein levels by transfection of appropriate siRNA (scrambled siRNA as negative controls, and unrelated specific siRNA against human IKBKE, #679). Where indicated, samples were treated with 400 nM BAF for 24 h. In these representative images, SQSTM1 is visualized in green and DAPI-stained nuclei in blue. SQSTM1-positive dots were counted using a specific protocol by volocity software (see graph in the lower panel). Scale bars: 25 μm. Results from one experiment, representative of 3 independent experiments (n = 3) are shown. (d) Autophagic flux was evaluated in in MDA-MB-231 cells transfected with Scr siRNA and siRNA specific for IKBKE, Followed by rescue with IKBKE (WT) overexpression. Where indicated, 4 h treatment with 400 nM BAF was performed. In these representative images, LC3B is visualized in green, IKBKE (WT) in red, and DAPI-stained nuclei in blue. LC3B-positive dots were counted using a specific protocol by volocity software (see graph in the lower panel). Scale bars: 25 μm. Results from one experiment, representative of 3 independent experiments (n = 3) are shown.
As autophagy supports human tumorigenesis in breast cancer [Citation2,Citation16], we decided to take advantage of MDA-MB-231 cells as a model to study the role of endogenous IKBKE in controlling cellular autophagy. To this purpose, IKBKE expression was silenced in these cells using specific siRNA. By using these tools, we observed a consistent reduction of autophagic flux (ratio between the value obtained by the amount of autophagic vesicles in basal condition, FM, and upon protease inhibition, BAF) when scored by both LC3B-II WB assay ()) and immunofluorescence analysis scoring the number of SQSTM1-positive vesicles ()).
Ultimately, we confirmed the role of endogenous IKBKE in controlling the rate of autophagic flux in MDA-MB-231 cells also by counting LC3B-positive autophagic vesicles, using the immunofluorescence analysis approach. Indeed, IKBKE knockdown obtained by our specific siRNA significantly reduced autophagic flux ()). In addition, in this experiment we also confirmed the specificity of the siRNA used to knock down IKBKE, by demonstrating full rescue of autophagic flux upon overexpression of IKBKE in MDA-MB-231 cells transfected with each individual siRNA (Figures S4 and (d)). As an additional control, another TNBC cell line, MDA-MB-468, also showed strong inhibition of autophagic flux upon knockdown of IKBKE expression (Figure S5). Altogether, these data supported a role for endogenous IKBKE in positively controlling the rate of cellular autophagy in breast cancer cells.
The catalytic activity of IKBKE is required for its ability to control autophagy
We next asked if IKBKE kinase activity was involved in the control of autophagy, by first using a kinase-dead (KD) IKBKE mutant, IKBKE (KD) (encoding a point mutation that changes lysine 38 to alanine) [Citation17], and scoring its effect on autophagy by different approaches. To this aim, we used MDA-MD-231 cells stably expressing the IKBKE (KD) mutant and, as controls, the same cells stably transfected with the empty vector or with the IKBKE oncogene. By scoring the increase of LC3B-II protein levels in these cells, we clearly established that, while overexpression of the IKBKE (WT) protein was able to further increase autophagic flux, the ‘kinase dead’ oncogene was unable to do so ()). These data were further confirmed by immunofluorescence microscopy, scoring the number of LC3B-positive vesicles ()) and SQSTM1 puncta (Figure S6), overall suggesting that kinase activity was necessary for IKBKE to induce autophagy. Importantly, full activation of IKBKE (WT) and inactivity of the IKBKE (KD) mutant were confirmed in the MDA-MB-231 cell context, by testing their ability to induce phosphorylation of the endogenous NFKBIA protein (Figure S7).
Figure 4. The catalytic activity of IKBKE is required for its ability to control autophagy. (a) WB analysis to evaluate autophagic flux of MDA-MB-231 cells stably expressing IKBKE (WT) and IKBKE kinase dead (KD). Cells stably expressing an empty vector were used as a negative control. Where indicated, 4-h treatment with 400 nM BAF was performed. Densitometric analysis of LC3B-II levels, normalized by the corresponding MAPK1 levels (used as loading control), is also shown. Results from one experiment, representative of 3 independent experiments (n = 3) are shown. (b) Confocal microscopy analysis of MDA-MB-231 cells expressing IKBKE (WT) and IKBKE (KD), to evaluate autophagic flux. Cells were subjected to immunofluorescence analysis. Where indicated, 4-h treatment with 400 nM BAF was performed. In these representative images, LC3B is visualized in green, IKBKE (WT or KD) in red, and DAPI-stained nuclei in blue. LC3B-positive dots were counted using a specific protocol by volocity software (see graph in the lower panel). Scale bars: 25 μm. (c) Time course experiment to analyze the autophagic flux in MDA-MB-231 treated with the CYT387 drug, by WB analysis. Cells were treated with different concentrations of the drug (2, 5 and 10 μM) and treated or not with 400 nM BAF for 2 h. Densitometric analysis of LC3B-II levels, normalized by the corresponding MAPK1 levels (used as loading control), is also shown. Results from one experiment, representative of 3 independent experiments (n = 3) are shown. (d) Confocal microscopy analysis of MDA-MB-231 cells treated with CYT387, to evaluate the autophagic flux. Cells were treated with different concentrations of the drug (2, 5 and 10 μM) and treated or not with 400 nM BAF for 2 h. Then, cells were subjected to immunofluorescence analysis. In these representative images, LC3B is visualized in green, endogenous IKBKE in red, and DAPI-stained nuclei in blue. LC3B-positive dots were counted using a specific protocol by volocity software (see graph in the lower panel). Scale bars: 25 μm. Results from one experiment, representative of 3 independent experiments (n = 3) are shown. Asterisks were attributed as follows: *P < 0.05, **P < 0.01, ***P < 0.001.
To support these data with a different approach, we also investigated the effect of IKBKE chemical inhibition on autophagy induced by the endogenously overexpressed kinase, in MDA-MB-231 cells. Specifically, we decided to use the CYT387 inhibitor, whose efficacy on TNBC cells viability has been directly correlated to its ability to specifically inhibit IKBKE activity [Citation7]. To establish a role for endogenous IKBKE kinase activity in controlling autophagy, we therefore scored autophagy upon treatment of MDA-MB-231 cells with the IKBKE inhibitor, with or without BAF. As shown in ), autophagic flux of these cells was strongly reduced, in a dose-dependent manner, upon treatment with the inhibitor, as scored by LC3B-II WB. Also, these data were confirmed by the alternative and complementary anti-LC3B immunofluorescence approach, observing a significant dose-dependent reduction in the number of autophagic vesicles upon treatment of MDA-MB-231 with increasing concentrations of the CYT387 inhibitor ()), mirroring results observed with IKBKE siRNA ()). Importantly, consistent results were obtained by using the CYT387 inhibitor on TNBC MDA-MB-468 cells (Figure S8). Ultimately, we decided to test additional IKBKE inhibitors for their ability to inhibit autophagy in MDA-MB-231 cells, to confirm that results obtained with CYT387 are due to its effect on this kinase and not to any other off-target effect, such as inhibition of JAK kinases by CYT387 [Citation18]. Specifically, we used Amlexanox [Citation19] and IKK-3 Inhibitor IX [Citation20] which, although still inhibiting IKBKE, present a different set of other targets, ultimately excluding that we were following specific off-target effects. Indeed, both of these inhibitors reduced autophagic flux in TNBC cells (Figure S9), overall confirming that results obtained by using CYT387 were attributable to inhibition of IKBKE, as also previously demonstrated both in vitro and in vivo [Citation7]. Altogether, these data therefore supported a role for IKBKE kinase activity in the control of autophagy, in TNBC cells.
IKBKE is required for induction of autophagy by transforming pathways commonly activated in breast cancer
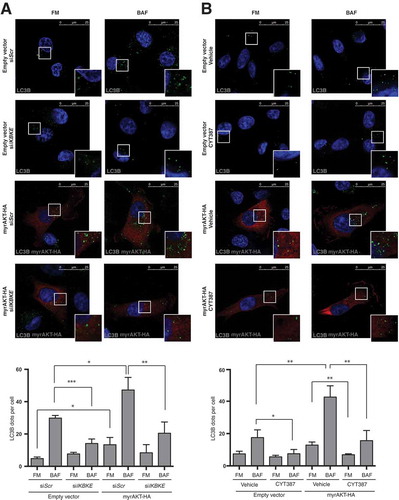
The PI3K-AKT-MTOR pathway is the predominant oncogenic pathway altered in breast cancer [Citation21]. Importantly, Boehm and coll. specifically have identified IKBKE as a kinase that replaces myristoylated (activated) AKT (myrAKT) in breast cancer cell transformation and, specifically, establishes a requirement for IKBKE in AKT-dependent tumorigenesis [Citation4]. Interestingly, in response to growth factors, AKT directly phosphorylates multiple sites on TSC2, suppressing the inhibitory effect of TSC2 toward MTORC1, therefore inhibiting autophagy [Citation22]. Still, a constitutively active, myristoylated AKT mutant does not inhibit autophagy but, actually, induces it in mammary epithelial cells [Citation23], allowing to hypothesize a specific autophagic response of mammary cells upon AKT activation and a positive role of this process in breast cancer. We, therefore, set up to investigate a role for IKBKE in autophagy induced by activated AKT, in breast cells. First, by taking advantage of the anti-LC3B immunofluorescence approach to score autophagy, we demonstrated that interfering with IKBKE expression by specific IKBKE siRNA strongly reduced autophagic flux induced by myrAKT-HA ()). Then, we also proved that it was possible to interfere with autophagy induced by activated AKT, by pharmacologically inhibiting IKBKE, using the CYT387 inhibitor on myrAKT-HA-overexpressing MDA-MB-231 cells ()).
Figure 5. IKBKE is required for autophagy induced by the AKT transforming pathway. (a) Evaluation of autophagic flux by confocal microscopy analysis of MDA-MB-231 cells over-expressing an activated form of the AKT protein (myrAKT-HA) upon downregulation of endogenous IKBKE expression. Cells were subjected to immunofluorescence analysis. IKBKE downregulation was obtained by transfection of appropriate siRNA (scrambled siRNA as a negative control and a specific siRNA against human IKBKE, #679). Where indicated, samples were treated with 400 nM BAF for 4 h. In these representative images, LC3B is visualized in green, myrAKT-HA in red, and DAPI-stained nuclei in blue. LC3B positive dots were counted using a specific protocol by Volocity software (see graph in the lower panel). Scale bars: 25 μm. Results from one experiment, representative of 3 independent experiments (n = 3) are shown. (b) Evaluation of autophagic flux by confocal microscopy analysis of MDA-MB-231 cells over-expressing an activated form of the AKT protein (myrAKT-HA) upon pharmacological inhibition of IKBKE activity by the CYT387 drug (2 μM, 2 h). Cells were subjected to immunofluorescence analysis. Where indicated, samples were treated with 400 nM BAF for 2 h. In these representative images, LC3B is visualized in green, myrAKT-HA in red, and DAPI-stained nuclei in blue. LC3B-positive dots were counted using a specific protocol by Volocity software (see graph in the lower panel). Scale bars, 25 μm. Results from one experiment, representative of 3 independent experiments (n = 3) are shown. Asterisks were attributed as follows: *P < 0.05, **P < 0.01, ***P < 0.001.
‘Autophagy addiction’ observed in breast cancer has been proposed as a potential therapeutic target for these tumors [Citation3]. Importantly, ‘autophagy addiction’ has been already demonstrated upon activation of strong oncogenic insults such as HRAS or BCR-ABL1 [Citation12,Citation24]. Interestingly, about 20 to 25% of breast tumors show amplification or overexpression of ERBB2/HER2, an oncogenic ligand-orphan receptor tyrosine kinase often associated with tumor aggressiveness [Citation25]. In this context, agents that target ERBB2 are among the most successful cancer therapeutics in the clinic: still, primary or acquired resistance has limited the outcomes in patients [Citation21]. Thus, to extend potential applications of our results beyond tumors overexpressing the IKBKE oncogene, we asked if also ERBB2 oncogenic signaling was able to stimulate autophagy in breast cancer cells through an IKBKE-dependent pathway. Interestingly, a constitutively active form of this protein, ERBB2 (CA) [Citation26] strongly activated autophagic flux of MDA-MB-231 cells (ERBB2-negative in their parental state) [Citation7], while IKBKE inhibition by both genetic (IKBKE siRNA, )) and pharmacological (CYT387, )) approaches strongly reduced this effect, suggesting that an IKBKE inhibitor may be used to counteract autophagy and, through this, tumor development not only in triple negative but, also, in ERBB2-positive breast cancers. Importantly, as an additional proof of the specificity of our approach to score the autophagic flux in our cellular systems, we also confirmed that ‘physiological’ activation of different tyrosine kinase receptors (as opposed to constitutive, oncogenic activation of mutated ERBB2) by their cognate ligands reduced autophagic flux in the same cells (Figure S10), as expected from their activation of MTORC1 that, in turn, represses autophagy [Citation27].
Figure 6. IKBKE is required for autophagy induced by the ERBB2 breast oncogene. (a) Evaluation of autophagic flux by confocal microscopy analysis of MDA-MB-231 cells overexpressing an activated form of ERBB2 (ERBB2 [CA]) upon downregulation of endogenous IKBKE expression. Cells were subjected to immunofluorescence analysis. IKBKE downregulation was obtained by transfection of appropriate siRNA (scrambled siRNA as a negative control and a specific siRNA against human IKBKE, #679). Where indicated, samples were treated with 400 nM BAF for 4 h. In these representative images, LC3B is visualized in green, ERBB2 (CA) in red, and DAPI-stained nuclei in blue. LC3B-positive dots were counted using a specific protocol by Volocity software (see graph in the lower panel). Scale bars: 25 μm. Results from one experiment, representative of 3 independent experiments (n = 3) are shown. (b) Evaluation of autophagic flux by confocal microscopy analysis of MDA-MB-231 cells overexpressing an activated form of ERBB2 (ERBB2 [CA]) upon pharmacological inhibition of IKBKE activity by CYT387 (2 μM, 2 h). Cells were subjected to immunofluorescence analysis. Where indicated, samples were treated with 400 nM BAF for 2 h. In these representative images, LC3B is visualized in green, ERBB2 (CA) in red, and DAPI-stained nuclei in blue. LC3B-positive dots were counted using a specific protocol by Volocity software (see graph in the lower panel). Scale bars: 25 μm. Results from one experiment, representative of 3 independent experiments (n = 3) are shown. Asterisks were attributed as follows: *P < 0.05, **P < 0.01, ***P < 0.001.
![Figure 6. IKBKE is required for autophagy induced by the ERBB2 breast oncogene. (a) Evaluation of autophagic flux by confocal microscopy analysis of MDA-MB-231 cells overexpressing an activated form of ERBB2 (ERBB2 [CA]) upon downregulation of endogenous IKBKE expression. Cells were subjected to immunofluorescence analysis. IKBKE downregulation was obtained by transfection of appropriate siRNA (scrambled siRNA as a negative control and a specific siRNA against human IKBKE, #679). Where indicated, samples were treated with 400 nM BAF for 4 h. In these representative images, LC3B is visualized in green, ERBB2 (CA) in red, and DAPI-stained nuclei in blue. LC3B-positive dots were counted using a specific protocol by Volocity software (see graph in the lower panel). Scale bars: 25 μm. Results from one experiment, representative of 3 independent experiments (n = 3) are shown. (b) Evaluation of autophagic flux by confocal microscopy analysis of MDA-MB-231 cells overexpressing an activated form of ERBB2 (ERBB2 [CA]) upon pharmacological inhibition of IKBKE activity by CYT387 (2 μM, 2 h). Cells were subjected to immunofluorescence analysis. Where indicated, samples were treated with 400 nM BAF for 2 h. In these representative images, LC3B is visualized in green, ERBB2 (CA) in red, and DAPI-stained nuclei in blue. LC3B-positive dots were counted using a specific protocol by Volocity software (see graph in the lower panel). Scale bars: 25 μm. Results from one experiment, representative of 3 independent experiments (n = 3) are shown. Asterisks were attributed as follows: *P < 0.05, **P < 0.01, ***P < 0.001.](/cms/asset/2df3f778-13fe-43af-baad-704237a83293/kaup_a_1517855_f0006_c.jpg)
Autophagy is required for IKBKE-mediated cellular transformation in TNBC
Based on our genetic and pharmacological approaches, we have demonstrated the ability of the IKBKE human breast oncogene to control the rate of autophagic flux in TNBC cells. Based on these data, we therefore set up to investigate whether IKBKE-dependent autophagy, might also support the tumorigenic process, as already suggested for other important human oncogenes in different tumors, e.g., HRAS and BCR-ABL1 [Citation12,Citation24]. Supporting this hypothesis, Thorburn and coll. already have demonstrated [Citation3], by a RNA-interfering approach, autophagy-dependency for TNBC cells, suggesting that autophagy inhibition might represent a potential therapeutic strategy for these tumors. Therefore, we investigated if downregulation of IKBKE expression phenocopied the antiproliferative effects provoked by downregulation of autophagy genes in these cells. Indeed, in both MDA-MB-231 ( and S11) and MDA-MB-468 ( and S11) TNBC cells, 2 IKBKE-specific siRNA strongly reduced cell proliferation similarly to siRNA recognizing key autophagy genes, namely ATG5 and ULK1.
Figure 7. A role for autophagy in IKBKE-dependent normal breast epithelial cell transformation and TNBC proliferation. (a) Proliferation assay of MDA-MB-231 cells upon downregulation of endogenous IKBKE, ATG5, ULK1 protein levels by transfection with the indicated siRNA (scrambled siRNA as negative controls, and unrelated specific siRNA against human IKBKE, #679, #680 and siRNA for ATG5 and ULK1). Cell viability was evaluated 72 h post-transfection by counting cells in triplicate with a Z2 Coulter Counter. Data were processed in Prism 6 software. Results from one experiment, representative of 3 independent experiments (n = 3) are shown. (b) Same as in (a), but using MDA-MB-468 TNBC cells. (c) Cell count of 1-7HB2 cell stably expressing IKBKE (WT), evaluating cell proliferation, by counting cells in triplicate with a Z2 Coulter Counter, upon downregulation (72 h post-transfection) of endogenous ATG5 and ULK1 with specific siRNA. A scrambled siRNA was used as a negative control. Data were processed with Prism 6 software. Results from one experiment, representative of 3 independent experiments (n = 3) are shown. (d) Proliferation assay of 1-7HB2 cell stably expressing IKBKE (WT) upon pharmacological inhibition of autophagic activity by SAR-405 (10 μM) and Spautin-1 (100 μM). Cell proliferation was evaluated after 72-h treatment by counting cells in triplicate with a Z2 Coulter Counter. Data were processed with Prism 6 software. Results from one experiment, representative of 3 independent experiments (n = 3) are shown.
Interestingly, studies using knockdown of autophagy genes have already documented that this process supports cellular transformation of immortalized mammary cells induced by oncogenic HRAS or PI3K [Citation23,Citation28]. Therefore, we decided to use a similar approach to demonstrate that autophagy also supports IKBKE-dependent transformation in breast cancer. To this aim, we first established a model of immortalized mammary 1-7HB2 cells transformed by stable IKBKE expression (Figure S12) and then demonstrated, by both genetic (ATG5 and ULK1 siRNA) ( and S13) and pharmacological (autophagy inhibitors SAR405 and Spautin-1) [Citation29,Citation30] ()) approaches, that also IKBKE-dependent cell proliferation was dependent on proficient autophagy. Overall, these data therefore suggest that the ability of IKBKE of controlling autophagy may affect the transformation process in TNBC and, importantly, that both autophagy inhibitors and drugs specifically restraining IKBKE activity may represent feasible approaches to these deadly tumors, which currently lack effective targeted treatments.
Discussion
Here, we performed an unbiased screening to identify novel activated kinases controlling the autophagic process and demonstrated, by genetic and pharmacological approaches, the ability of the IKBKE human breast oncogene to control the rate of autophagic flux and to be able to mediate the effect of additional breast oncogenic pathways in corresponding cancer cells. Still, additional kinases have been also identified through our unbiased screening. Among them, PRKCD/PKCδ and, especially, the catalytic subunits of AMPK, have already been described to positively control autophagy in different experimental conditions [Citation31,Citation32], supporting the effectiveness of our approach. Conversely, several among our positive ‘hits’ (e.g., GALK2, FRK, PIP5K1A) have never been demonstrated to directly affect this process, providing a starting point for the characterization of additional regulators of autophagy, ultimately representing a valuable resource for researchers interested in this process. Importantly, several among our novel autophagy-affecting kinases are involved in processes and pathways related to autophagy. Among them, i) GALK2 (galactokinase 2) is an enzyme that phosphorylates galactose and, to a greater extent, N-acetylgalactosamine (GalNac) and is implicated in a salvage pathway for the reutilization of free GalNac derived from the degradation of complex carbohydrates, to produce glucose in a stress-induced manner [Citation33]; ii) PFKL/PFK1 (phosphofructokinase, liver type), catalyzes one of the rate-limiting steps of the glycolysis [Citation34]; iii) AAK1 (AP2 associated kinase 1), is a regulator of clathrin-mediated endocytosis and interacts with LC3B [Citation35]. Interestingly, just below our stringent threshold (LC3B-II protein level higher than + σ in both FM and BAF conditions) for considering kinases as potential inducers of autophagy, other interesting kinases were also identified, possibly deserving further investigations, namely HK1 [Citation36] and MAP3K14/NIK, an IKK upstream kinase [Citation37].
Interesting kinases were also identified as potential inhibitors of the autophagic process, i.e. the 2 members of the cyclin-dependent kinase family, CDK17 and CDK18. Also in this case, although we decided not to pursue their specific characterization in this context, our results about their potential involvement in autophagy surely represent a valid hypothesis to re-evaluate them in further studies. Importantly, we acknowledge the possibility that myristoylation and membrane recruitment may not represent the appropriate mechanism for activation of all kinases of the library and, therefore, our screening may contain a number of false negative results. Nonetheless, we think that, when opportunely validated, our positive hits already represent a valuable resource for researchers interested in mechanisms controlling autophagy.
Based on the specific interest of our laboratory in cancer, among several noteworthy potential regulator of autophagy identified through the proposed screening, we decided to pursue deeper characterization and formal demonstration, according to most updated guidelines [Citation5] of the role of the IKBKE human oncogene in this process. Surprisingly, both canonical IKKs and TBK1 have been already involved in the control of autophagy [Citation23,Citation38,Citation39], while data regarding the involvement of IKBKE in the control of this process are, to date, completely missing, despite this kinase is currently the only member of this group considered as a bona fide oncogene, primarily in breast cancer [Citation14]. In this context, induction of autophagy dependent on IKBKE overexpression, an alteration frequently found in breast cancer, particularly TNBC [Citation4,Citation7] was necessary for cell proliferation and its downregulation phenocopied the anti-proliferative effect of interfering with key autophagy regulatory genes, namely ATG5 and ULK1. Our results therefore support the use of general inhibitors of autophagy and/or specific IKBKE inhibitors in tumors overexpressing this kinase, such as TNBC [Citation7]. Still, our data suggest that also breast tumors with normal IKBKE protein levels but activation of alternative transforming pathways, i.e. AKT or/and ERBB2, may take advantage of IKBKE signaling to induce autophagy to support cancer development. In this context, it is interesting to notice that previous work has already identified TBK1 as a therapeutic target for ERBB2-positive breast cancer [Citation40]. It is therefore tempting to speculate that both TBK1 and IKBKE may act downstream of ERBB2 to control autophagy and, through this, cancer. Ultimately, as TBK1 may form homodimers but also heterodimers with IKBKE [Citation41], the precise role of each of these 2 non-canonical IKK in the control of autophagy and cancer will warrant further investigation.
Additional advantages from inhibition of IKBKE and of the corresponding downstream autophagic process as adjuvant therapy may also improve sensitivity of specific tumors to standard antineoplastic approaches, based on the observation that autophagy increases the resistance of transformed cells to the cytotoxic effects of exogenous treatments, including conventional chemotherapeutics, targeted anticancer agents and ionizing radiation [Citation3,Citation21], although this concept is currently under strong debate [Citation42]. Our work will, therefore, surely benefit the search for novel therapeutic options for breast cancer, supporting the possibility of using both inhibitors of the autophagic process and IKBKE- or TBK1-targeted drugs for ‘primary’ and/or ‘adjuvant’ pharmacological approaches not only in tumors overexpressing IKBKE, often TNBC which currently lack efficacious targeted therapies, but, based on our results, also in ERBB2-positive breast tumors.
Materials and methods
Reagents and antibodies
Bafilomycin A1 (Santa Cruz Biotechnology, sc-201550), CYT387 (InvivoGen, inh-cy87), Amlexanox (Sigma Aldrich, 68302–57-8), IKK-3 INHIBITOR IX (Calbiochem, 401488), Spautin-1 (Selleckchem, S7888), and SAR405 (Selleckchem, S7682) were dissolved in DMSO. Hanks medium (ECB4007L), used as starvation medium, was purchased from Euroclone. The following growth factors were used: Human EGF (epidermal growth factor; HsEGF) (Sigma Aldrich, E9644), human PDGF (platelet derived growth factor)-AA (HsPDGF-AA) (Cell Signaling Technology, 8913) [Citation43], FGF (fibroblast growth factor) (Sigma Aldrich, 106096–93-9). The following primary antibodies were used for western blots: anti LC3B (Nanotools, 0231–100), anti-MAPK1 (Santa Cruz Biotechnology, sc-154), anti-FLAG (Sigma Aldrich, F1804), anti-IKBKE (Sigma Aldrich, I4907), anti-HA (Covance, MMS-101P), anti-ERBB2/HER2 (Cell Signaling Technology, 2165), anti-phospho-NFKBIA/IkBa (Ser32/36; Cell Signaling Technology, 9246S), anti-NFKBIA/IkBa (Santa Cruz Biotechnology, sc-371). For confocal microscopy experiments, the following primary antibodies were used: anti-HA (Roche, 11867423001), anti-LC3B (MBL, M152–3), anti-ERBB2 (Cell Signaling Technology, 2165) anti-IKBKE (Sigma Aldrich, I4907) and anti-SQSTM1 (BD Transduction Lab, 610833). The following secondary antibodies were used for western blot experiments: anti-mouse (Santa Cruz Biotechnology, sc-2004) and anti-rabbit (Santa Cruz Biotechnology, sc-2005) HRP-conjugated IgGs. The following secondary antibodies were used for confocal microscopy experiments: anti-mouse Alexa Fluor 488-conjugated (Life Technologies, A21202), anti-rabbit Alexa Fluor 555-conjugated (Life Technologies, A31572), anti-rat Alexa Fluor 594-conjugated (Life Technologies, A21209).
Expression vectors
The plasmids expressing myristoylated (as an N-terminal tag) kinases were a gift from William Hahn and Jean Zhao (Myristoylated Kinase Library; Addgene, 1000000012) [Citation4]. pCEFL myrAKT-HA was a gift from Silvio J. Gutkind [Citation44]. ERBB2 (CA) (HER2_CA V659E) was a gift from Mien-Chie Hung (Addgene, 16259) [Citation26]. pcDNA3 [IKBKE (WT)]-FLAG and pcDNA3 [IKBKEK38A (KD)]-FLAG were gifts from Tom Maniatis (Addgene, 26201 and 26202) [Citation17].
Cell culture and transfections
HeLa cells and MDA-MB-468 cells were maintained in Dulbecco modified Eagle medium (DMEM, Euroclone ECB7501L) supplemented with 10% fetal bovine serum (FBS; Euroclone, ECS0180L), 2 mM L-glutamine and 100 units/ml penicillin-streptomycin at 37°C in an atmosphere of 5% CO2:air. MDA-MB-231 cells were maintained in RPMI (Euroclone, ECB9006L) medium supplemented with 10% FBS, 2 mM L-glutamine and 100 units/ml penicillin-streptomycin at 37°C in an atmosphere of 5% CO2:air. 1-7HB2 cells were maintained in Dulbecco modified Eagle medium (DMEM; Euroclone ECB7501L) supplemented with 10% FBS, 2 mM L-glutamine, 5 μg/ml hydrocortisone (Sigma Aldrich, H08889), 10 μg/ml insulin (Sigma Aldrich, I1882) and 100 units/ml penicillin-streptomycin at 37°C in an atmosphere of 5% CO2:air. MDA-MB-231 cells and 1-7HB2 cells stably expressing pCDNA IKBKE-FLAG were created transfecting the cells with plasmid encoding pCDNA IKBKE-FLAG and selecting them with 1.5 mg/ml G418. For immunofluorescence experiments, 5 × 10⁴ MDA-MB-231 and 1-7HB2 cells were seeded on coverlips in 12-well plates and for western blot analysis, 3 × 10⁵ cells were seeded in 6-well plates. Transfection were performed with 1 µg DNA plasmid for HeLa cells and 2 µg DNA plasmid for MDA-MB-231 and 1-7HB2 cells, using lipofectamine LTX (Life Technologies, 15338500), a cationic lipid-based reagent. The cells were seeded to be 70% to 80% confluent, then DNA was diluted in 200 µl of DMEM with 10 mM HEPES for HeLa cells or in 200 µl of RPMI with 10 mM HEPES for MDA-MB-231. Lipofectamine LTX was next added to the complex (5 µl for HeLa, 6 µl for MDA-MB-231) to allow creation of complexes (30 min at RT). Ultimately, DNA-lipid complexes were added to cells.
RNA interference
HeLa, 1-7HB2, MDA-MB-231 and MDA-MB-468 cells were transfected with siRNA #678 IKBKE-A siRNA-27mer (5ʹ-GAUUCACAAGCUGGAUAAGGUGAA-3ʹ) (OriGene SR306417A) #679 IKBKE-B siRNA-27mer (5ʹ-ACCUUCAAGAAGUGGAAUAAAUGdTdG-3ʹ) (OriGene SR306417B), #680 IKBKE-C-siRNA-27mer (5ʹ-GACAGAAAGCAUAACAUACACUCdGdC-3ʹ) (OriGene SR306417C), and non-silencing siRNA (scrambled, Scr; target sequences 5ʹ-AATTCTCCGAACGTGTCACGT-3ʹ) (OriGene SR30004) ATG5 siRNA (Riboxx, NM-0048492_1, NM-0048492_2, NM-0048492_3, NM-0048492_4), ON-TARGET plus SMARTpool siRNA for human ULK1 (8408) (Dharmacon, L-005049–00-0005). Numbers correspond to position in ITT_CRL Oligo database. Cells were seeded to be 30 to 50% confluent in 6-well (1 × 10⁵ cells for each well). The day after seeding, cell medium was replaced and siRNA and Hiperfect reagents (Qiagen, 301707) were diluted in transfection medium (DMEM with 10 mM HEPES), briefly mixed on a vortex and, after 10 min, the complex was added drop wise to cells. RNAs were analyzed 48 to 72 h after transfection while proteins after 72 to 96 h.
Western blots
For western blot analysis, total lysates were obtained by resuspending cellular pellets in 1% NP40 lysis buffer, (20 mM HEPES, pH 7.5, 10 mM EGTA, 40 mM β-glycerophosphate, 1% NP-40, (Sigma-Aldrich, I3021), 2.5 mM MgCl2, 2 mM orthovanadate, 2 mM NaF, 1 mM DTT, Roche protease inhibitors cocktail (Roche, 05056489001). Lysates were resuspended in 5X Laemmli Buffer (50 mM Tris-HCl, pH 6.8, 50% [v:v] glycerol (Carlo Erba, 346161) 25% [v:v] β-mercaptoethanol, 10% [w:v] SDS, 0.1% [w:v] Bromophenol Blue) and incubated for 10 min at 95°C [Citation45]. Next, lysates were loaded on polyacrylamide SDS-PAGE gels with an appropriate concentration of acrylamide and resolved in a 90 min run at 120 V. Then, proteins were transferred to Immobilon-PVDF membrane (Millipore, IPVH00010) by wet transfer electrophoresis. A blocking solution of 0.1% Tween 20 (Sigma-Aldrich, P1379) in TBS (1 M Tris-HCl, pH 7.5, 5 M NaCl) (TBS-T) and 5% non-fat dry milk was used to saturate nonspecific binding sites. The membrane was probed with appropriate primary antibodies and with secondary antibodies against mouse or rabbit IgG conjugated with horseradish peroxidase (HRP). The proteins were revealed by enhanced chemoluminescence detection by incubating with ECL Prime (GE Healthcare, 29018904). Densitometric analysis of each protein level was performed with NIH ImageJ 1,47t (National Institute of Health). Graphs indicating quantifications of 3 different experiments corresponding to main figures are shown in Figure S14.
Immunofluorescence (IF)
Cells were fixed with 4% paraformaldehyde in phosphate-buffered saline (PBS; Oxoid, BR0014G) for 20 min, washed with PBS) and then permeabilized with digitonin solution (Life Technologies, BN2006) for 20 min. Then, the cells were washed 3 times in PBS. Cells were blocked for 30 min with a 1% BSA (Sigma-Aldrich, A2153) in PBS; after this time, cells were incubated with appropriate primary antibodies for 1 h, washed 3 times, and then incubated with appropriate Alexa Fluor secondary antibodies; subsequently cells were washed 3 times. Nuclei were stained with a solution of 6 μM of 4ʹ,6-diamidino-2-phenylindole (DAPI; Sigma Aldrich, D9542) in PBS for 10 min. Coverslips were mounted in fluorescence mounting medium (Dako, S3023). Samples were visualized on a TSC SP5 confocal microscope (Leica Microsystems, Germany, Mannheim, 5100000750) installed on an inverted LEICA DMI 6000CS (Leica Microsystems, Germany, Mannheim, 10741320) microscope and equipped with an oil immersion PlanApo 63 × 1.4 NA objective. Images were acquired using the LAS AF acquisition software (Leica, 10210).
RNA extraction and RT-PCR
HeLa and MDA-MB-231 cells were transfected with Scr and IKBKE siRNA and, then, total RNA was purified using QIAzol Reagent (Qiagen, 79306). Reverse transcription was performed with the QuantiTect Reverse Trascription Kit (Qiagen, 205313) as described previously [Citation46]. Real time PCR (RT-PCR) was performed with the FastStart SYBR Green Master Mix (Roche Applied Science, 04673484001) on a Rotor-Gene 6000 RT-PCR system (Corbett Life Science, Sydney, Australia).
Cell proliferation assays
MDA-MB-231, MDA-MB-468 and 1-7HB2 cells stably expressing IKBKE (WT) were seeded in 6-well plates in triplicate. After 24 h were transfected with Scr, IKBKE, ATG5 and ULK1 siRNA (MDA-MB-231 and MDA-MB-468) and with Scr, ATG5 and ULK1 siRNA [1-7HB2 cell stably expressing IKBKE (WT)] after 72 h and 120 h was evaluated the cell viability. Cell number of each sample was determined by counting cells in triplicate with a Z2 Coulter Counter (Beckman Coulter, (MI) Italy). Data were processed with Prism 6 (Graphpad software).
Cancer database query
Amplification frequency for IKBKE gene was analyzed in cancer databases from different studies consulting www.cbioportal.org (query: IKBKE) [Citation47,Citation48]. The data of amplification frequency in cancer were reported in the following studies: Prostate Cancer [Citation49], Breast Cancer A [Citation50], Breast Cancer B [Citation51], Breast Cancer C [Citation52], Breast Cancer D (TCGA Breast Invasive Carcinoma; raw data at the NCI), Lymphoid Neoplasm (TCGA Lymphoid Neoplasm Diffuse Large B-cell Lymphoma; raw data at the NCI), Cholangiocarcinoma (TCGA Cholangiocarcinoma; raw data at the NCI), Breast Cancer E [Citation53], Liver Carcinoma (TCGA Liver Hepatocellular Carcinoma; raw data at the NCI), Lung Cancer A [Citation54], Lung Cancer B (TCGA Lung Adenocarcinoma; raw data at the NCI), Pancreatic Cancer [Citation55], Melanoma (TCGA, TCGA Skin Cutaneous Melanoma; raw data at the NCI).
Dot count and statistical analysis
For the LC3B-positive dot count, we performed densitometric analysis of fluorescence using the Quantitation Module of Volocity software (PerkinElmer Life Science). Dot count was subjected to statistical analysis. Measures were obtained by analyzing at least 400 cells/sample from 3 different experiments. Significance (p value) was assessed by Student’s t test, using GraphPad Prism6 software. Asterisks were attributed for the following significance values: P > 0.05 (ns), P < 0.05 (*), P < 0.01 (**), P < 0.001 (***).
Supplemental Material
Download Zip (2.9 MB)Acknowledgments
This work was supported by specific funding from Regione Toscana to Istituto Toscano Tumori.
Disclosure statement
No potential conflict of interest was reported by the authors.
Supplementary material
Supplemental data for this article can be accessed here.
Additional information
Funding
Related Research Data
References
- Yin Z, Pascual C, Klionsky DJ. Autophagy: machinery and regulation. Microb Cell. 2016;3(12):588–596.
- Kimmelman AC, White E. Autophagy and tumor metabolism. Cell Metab. 2017;25(5):1037–1043.
- Maycotte P, Thorburn A. Targeting autophagy in breast cancer. World J Clin Oncol. 2014;5(3):224–240.
- Boehm JS, Zhao JJ, Yao J, et al. Integrative genomic approaches identify IKBKE as a breast cancer oncogene. Cell. 2007;129(6):1065–1079.
- Klionsky DJ, Abdelmohsen K, Abe A, et al. Guidelines for the use and interpretation of assays for monitoring autophagy (3rd edition). Autophagy. 2016;12(1):1–222.
- Verhelst K, Verstrepen L, Carpentier I, et al. IκB kinase ε (IKKε): a therapeutic target in inflammation and cancer. Biochem Pharmacol. 2013;85(7):873–880.
- Barbie TU, Alexe G, Aref AR, et al. Targeting an IKBKE cytokine network impairs triple-negative breast cancer growth. J Clin Invest. 2014;124(12):5411–5423.
- Klippel A, Reinhard C, Kavanaugh WM, et al. Membrane localization of phosphatidylinositol 3-kinase is sufficient to activate multiple signal-transducing kinase pathways. Mol Cell Biol. 1996;16(8):4117–4127.
- Kohn AD, Takeuchi F, Roth RA. Akt, a pleckstrin homology domain containing kinase, is activated primarily by phosphorylation. J Biol Chem. 1996;271(36):21920–21926.
- Colecchia D, Strambi A, Sanzone S, et al. MAPK15/ERK8 stimulates autophagy by interacting with LC3 and GABARAP proteins. Autophagy. 2012;8(12):1724–1740.
- Garcia D, Shaw RJ. AMPK: mechanisms of cellular energy sensing and restoration of metabolic balance. Mol Cell. 2017;66(6):789–800.
- Colecchia D, Rossi M, Sasdelli F, et al. MAPK15 mediates BCR-ABL1-induced autophagy and regulates oncogene-dependent cell proliferation and tumor formation. Autophagy. 2015;11(10):1790–1802.
- Rossi M, Colecchia D, Ilardi G, et al. MAPK15 upregulation promotes cell proliferation and prevents DNA damage in male germ cell tumors. Oncotarget. 2016;7(15):20981–20998.
- Shen RR, Hahn WC. Emerging roles for the non-canonical IKKs in cancer. Oncogene. 2011;30(6):631–641.
- Eddy SF, Guo S, Demicco EG, et al. Inducible IkappaB kinase/IkappaB kinase epsilon expression is induced by CK2 and promotes aberrant nuclear factor-kappaB activation in breast cancer cells. Cancer Res. 2005;65(24):11375–11383.
- Wei H, Wei S, Gan B, et al. Suppression of autophagy by FIP200 deletion inhibits mammary tumorigenesis. Genes Dev. 2011;25(14):1510–1527.
- Fitzgerald KA, McWhirter SM, Faia KL, et al. IKKepsilon and TBK1 are essential components of the IRF3 signaling pathway. Nat Immunol. 2003;4(5):491–496.
- Tyner JW, Bumm TG, Deininger J, et al. CYT387, a novel JAK2 inhibitor, induces hematologic responses and normalizes inflammatory cytokines in murine myeloproliferative neoplasms. Blood. 2010;115(25):5232–5240.
- Mowers J, Uhm M, Reilly SM, et al. Inflammation produces catecholamine resistance in obesity via activation of PDE3B by the protein kinases IKKε and TBK1. Elife. 2013;2e01119.
- Bamborough P, Christopher JA, Cutler GJ, et al. 5-(1H-Benzimidazol-1-yl)-3-alkoxy-2-thiophenecarbonitriles as potent, selective, inhibitors of IKK-epsilon kinase. Bioorg Med Chem Lett. 2006;16(24):6236–6240.
- Dey N, De P, Leyland-Jones B. PI3K-AKT-mTOR inhibitors in breast cancers: from tumor cell signaling to clinical trials. Pharmacol Ther. 2017;175:91–106.
- Inoki K, Li Y, Zhu T, et al. TSC2 is phosphorylated and inhibited by Akt and suppresses mTOR signalling. Nat Cell Biol. 2002;4(9):648–657.
- Chen N, Debnath J. IκB kinase complex (IKK) triggers detachment-induced autophagy in mammary epithelial cells independently of the PI3K-AKT-MTORC1 pathway. Autophagy. 2013;9(8):1214–1227.
- Guo JY, Chen HY, Mathew R, et al. Activated Ras requires autophagy to maintain oxidative metabolism and tumorigenesis. Genes Dev. 2011;25(5):460–470.
- Slamon DJ, Clark GM, Wong SG, et al. Human breast cancer: correlation of relapse and survival with amplification of the HER-2/neu oncogene. Science. 1987;235(4785):177–182.
- Li YM, Pan Y, Wei Y, et al. Upregulation of CXCR4 is essential for HER2-mediated tumor metastasis. Cancer Cell. 2004;6(5):459–469.
- Antonioli M, Di Rienzo M, Piacentini M, et al. Emerging Mechanisms in Initiating and terminating autophagy. Trends Biochem Sci. 2017;42(1):28–41.
- Lock R, Roy S, Kenific CM, et al. Autophagy facilitates glycolysis during Ras-mediated oncogenic transformation. Mol Biol Cell. 2011;22(2):165–178.
- Liu J, Xia H, Kim M, et al. Beclin1 controls the levels of p53 by regulating the deubiquitination activity of USP10 and USP13. Cell. 2011;147(1):223–234.
- Ronan B, Flamand O, Vescovi L, et al. A highly potent and selective Vps34 inhibitor alters vesicle trafficking and autophagy. Nat Chem Biol. 2014;10(12):1013–1019.
- Chen J-L, Lin HH, Kim K-J, et al. Novel roles for protein kinase Cδ-dependent signaling pathways in acute hypoxic stress-induced autophagy. J Biol Chem. 2008;283(49):34432–34444.
- Kim J, Kundu M, Viollet B, et al. AMPK and mTOR regulate autophagy through direct phosphorylation of Ulk1. Nat Cell Biol. 2011;13(2):132–141.
- Thoden JB, Holden HM. The molecular architecture of human N-acetylgalactosamine kinase. J Biol Chem. 2005;280(38):32784–32791.
- Ristow M, Vorgerd M, Möhlig M, et al. Deficiency of phosphofructo-1-kinase/muscle subtype in humans impairs insulin secretion and causes insulin resistance. J Clin Invest. 1997;100(11):2833–2841.
- Loi M, Müller A, Steinbach K, et al. Macroautophagy proteins control MHC Class I levels on dendritic cells and shape anti-viral CD8(+) T cell responses. Cell Rep. 2016;15(5):1076–1087.
- Roberts DJ, Miyamoto S. Hexokinase II integrates energy metabolism and cellular protection: akting on mitochondria and TORCing to autophagy. Cell Death Differ. 2015;22(2):248–257.
- Régnier CH, Song HY, Gao X, et al. Identification and characterization of an IkappaB kinase. Cell. 1997;90(2):373–383.
- Criollo A, Senovilla L, Authier H, et al. The IKK complex contributes to the induction of autophagy. EMBO J. 2010;29(3):619–631.
- Pilli M, Arko-Mensah J, Ponpuak M, et al. TBK-1 promotes autophagy-mediated antimicrobial defense by controlling autophagosome maturation. Immunity. 2012;37(2):223–234.
- Deng T, Liu JC, Chung PE, et al. shRNA kinome screen identifies TBK1 as a therapeutic target for HER2+ breast cancer. Cancer Res. 2014;74(7):2119–2130.
- Oakes JA, Davies MC, Collins MO. TBK1: a new player in ALS linking autophagy and neuroinflammation. Mol Brain. 2017;10(1):5.
- Galluzzi L, Bravo-San Pedro JM, Demaria S, et al. Activating autophagy to potentiate immunogenic chemotherapy and radiation therapy. Nat Rev Clin Oncol. 2017;14(4):247–258.
- Hoch RV, Soriano P. Roles of PDGF in animal development. Development. 2003;130(20):4769–4784.
- Murga C, Laguinge L, Wetzker R, et al. Activation of Akt/protein kinase B by G protein-coupled receptors. A role for alpha and beta gamma subunits of heterotrimeric G proteins acting through phosphatidylinositol-3-OH kinasegamma. J Biol Chem. 1998;273(30):19080–19085.
- Strambi A, Mori M, Rossi M, et al. Structure prediction and validation of the ERK8 kinase domain. PLoS One. 2013;8(1):e52011.
- Rossi M, Colecchia D, Iavarone C, et al. Extracellular signal-regulated kinase 8 (ERK8) controls estrogen-related receptor α (ERRα) cellular localization and inhibits its transcriptional activity. J Biol Chem. 2011;286(10):8507–8522.
- Cerami E, Gao J, Dogrusoz U, et al. The cBio cancer genomics portal: an open platform for exploring multidimensional cancer genomics data. Cancer Discov. 2012;2(5):401–404.
- Gao J, Aksoy BA, Dogrusoz U, et al. Integrative analysis of complex cancer genomics and clinical profiles using the cBioPortal. Sci Signal. 2013;6(269):pl1.
- Beltran H, Prandi D, Mosquera JM, et al. Divergent clonal evolution of castration-resistant neuroendocrine prostate cancer. Nat Med. 2016;22(3):298–305.
- Pereira B, Chin SF, Rueda OM, et al. The somatic mutation profiles of 2,433 breast cancers refines their genomic and transcriptomic landscapes. Nat Commun. 2016;711479.
- Eirew P, Steif A, Khattra J, et al. Dynamics of genomic clones in breast cancer patient xenografts at single-cell resolution. Nature. 2015;518(7539):422–426.
- Ciriello G, Gatza ML, Beck AH, et al. Comprehensive molecular portraits of invasive lobular breast cancer. Cell. 2015;163(2):506–519.
- Lefebvre C, Bachelot T, Filleron T, et al. Mutational profile of metastatic breast cancers: a retrospective analysis. PLoS Med. 2016;13(12):e1002201.
- Cancer Genome Atlas Research Network. Comprehensive molecular profiling of lung adenocarcinoma. Nature. 2014;511(7511):543–550.
- Witkiewicz AK, McMillan EA, Balaji U, et al. Whole-exome sequencing of pancreatic cancer defines genetic diversity and therapeutic targets. Nat Commun. 2015;66744.