
ABSTRACT
We describe a protocol for rapid and efficient enrichment of autophagosomes from various tissues of the GFP-LC3 mouse. In order to increase the number of autophagosomes, we block autophagy flux in the GFP-LC3 mouse tissue with a single intraperitoneal injection of leupeptin 4–5 h before tissue harvesting. We homogenize dissected tissue samples using a Dounce homogenizer followed by passing the slurry through needles of different sizes to dissociate the cells and disrupt their outer membranes. The post-nuclear supernatant fraction of the cell lysate is further centrifuged and the supernatant fraction is discarded to remove residual cytosolic GFP-LC3 that is not associated with autophagosomes. The pellet fraction is resuspended and incubated with magnetic microbeads coated with anti-GFP antibodies for 1 h on ice. The lysate-bead mixture is then applied to a column that is placed in a magnetic separator. After washes, the autophagosome fraction is eluted from the column for morphological and protein analysis.
Abbreviations: EDTA: ethylenediaminetetraacetic acid; GAPDH: glyceraldehyde 3-phosphate dehydrogenase; GFP: green fluorescent protein; HEPES: 4-(2-hydroxyethyl)-1-piperazineethanesulfonic acid; LC3: microtubule-associated protein 1 light chain 3 beta; MES: 4-morpholineethanesulfonic acid (MES); SQSTM1: sequestosome 1; TEM: transmission electron microscopy
Introduction
Macroautophagy (henceforth termed autophagy) is a highly conserved cellular catabolic process in which cytoplasmic materials, such as cellular proteins and organelles, are engulfed by double-membrane vesicles, named autophagosomes that later fuse with lysosomes for degradation and processing. Autophagy plays essential roles in maintaining cellular homeostasis, and is typically activated in response to starvation or other cellular stress stimuli [Citation1,Citation2]. Isolating autophagosomes in vivo and analyzing molecules associated with them or their content could be very helpful in understanding the mechanisms of autophagic degradation and what cellular contents are targeted for degradation under stress conditions.
Figure 1. Enrichment of autophagosome markers in autophagosomes isolated from GFP-LC3 mouse tissues. Immunoisolated autophagosome fractions from retina, brain, liver and lung of GFP-LC3 mice were compared with corresponding post-nuclear supernatant fractions of the cell lysates. Note the increase in the amount of autophagosome-related proteins, LC3 (endogenous and GFP-LC3), SQSTM1, and Ser403-phosphorylated-SQSTM1 in the autophagosome fraction (AP) versus the cell lysate. Note that the material for the lysate lanes are taken from the whole cell (post-nucleus removal) without discarding cytosolic LC3, whereas the immunoprecipitation products were from the pellet after removing the cytosolic LC3. As GFP-LC3 is very abundant in the whole cell lysate, the amount of protein loaded into the lysate versus AP lanes are different, so as not to oversaturate the lysate lane. Thus, it appears as if GFP-LC3 is not being enriched. The enrichment of the endogenous LC3, however, helps serve as an internal control for the enrichment. For the immunoblots, 8 µg protein of tissue lysate was loaded. The volume of enriched autophagosome (from a total volume of 50 µL in protocol step 3.3.8) loaded were: 8 µL for retina, 4 µL for brain, 6 µL for liver and 10 µL for lung. Antibodies: LC3A/B (1:1000; Cell Signaling Technology, 4108); SQSTM1 (1:1000; Novus Biologicals, NBP1-48320S); p-SQSTM1 (1:400; Gene Tex, GTX128171).
Figure 2. Fluorescence microscopy of enriched autophagosomes. Enriched autophagosomes from retina, brain, liver and lung were imaged by fluorescence microscopy. Red arrows point to ring-shaped vesicular structures, while the white arrows point to smaller, more punctate structures. Scale bar: 2 µm.
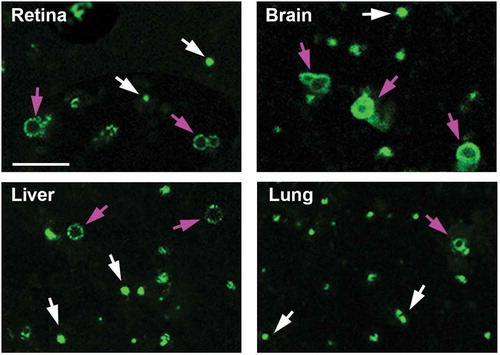
Figure 3. Morphology of autophagosomes isolated from GFP-LC3 mouse tissues. Immunoisolated autophagosomes were stained for TEM analysis. Lower and higher magnification TEM images confirmed double-membrane autophagosomes enriched from retina, brain, liver and lung of GFP-LC3 mice. Arrows in the higher magnification panels point to the double membranes seen on the isolated vesicles. Scale bar: 100 nm.
Figure 4. Increase in autophagosome markers under starvation conditions in immunoisolated autophagosomes. (a) Tissue lysate and immunoisolated autophagosomes from the liver of starved (24 h) and non-starved GFP-LC3 mice were compared by western blotting probed for LC3 and GAPDH. (b) Quantification of the band density, as shown in the histogram, shows the increased levels of autophagosome-related proteins after starvation, consistent with the increased level of autophagy. N = 4 mice; ** P < 0.01.
Figure 5. Intraperitoneal injection of leupeptin as a method to inhibit autophagy flux. (a) Immunoblot and (b) quantification of the levels of GFP-LC3, LC3-I, LC3-II, and GAPDH in the retina, brain, liver and lung of GFP-LC3 mice with a single intraperitoneal injection of leupeptin versus saline (as control). Samples are from the cell lysates and demonstrate the increase in LC3-II relative to LC3-I in the leupeptin sample. Protein levels are normalized to GAPDH levels. * P < 0.05; ** P < 0.01. For the immunoblots, 8 µg of protein was loaded per lane. Antibodies: LC3 (1:1000; Cell Signaling Technology, 4108); GAPDH (1:60,000; Ambion Applied Biosystems, AM4300).
Previously described methods for isolation of autophagosomes [Citation3–Citation7], require complex centrifugation protocols and demand relatively large amounts of starting material; for example, a single rat liver, which makes it very challenging for researchers who study organs in smaller animals such as mouse. Based on a study of immunoisolation of autophagosomes from GFP-LC3-transfected cultured cells [Citation8], we recently described a simple, fast and reproducible method to enrich for autophagosomes from retinas of GFP-LC3 mice by immunoprecipitation using superparamagnetic microbeads conjugated to an anti-GFP antibody [Citation9]. The purpose of this protocol paper is to provide step-by-step instructions for this procedure.
The basic premise of this technique is that because LC3 coats the phagophore and autophagosome, one can then immunoprecipitate the GFP-LC3-coated vesicles using antibodies against the GFP tag [Citation10,Citation11]. It has been shown that GFP-LC3 is overexpressed in almost all tissues of GFP-LC3 mouse, and overexpression of GFP-LC3 does not affect the endogenous autophagic process [Citation12,Citation13]. In this protocol, we present the details of the process we have previously developed for enrichment of autophagosomes from the retina. In addition, we demonstrate that the technique can be expanded to brain, liver and lung of GFP-LC3 mice.
Immunoisolated autophagosome fractions from a very small amount of tissue (2 mouse retinas or, for other organs, 2 to 4 mg of liver, brain or lung) are sufficient to allow for most protein work such as western blot analysis. The autophagosome membrane marker LC3-II and autophagic receptor SQSTM1 are detected by western blot (). Both GFP-LC3-II and endogenous LC3-II are highly enriched in the autophagosome fraction relative to the corresponding tissue homogenate. Curiously, we did see multiple bands at different sizes for SQSTM1 in some of the tissues, but not all. The multiple bands could be secondary to degradation of the protein, but this seems less likely, as the bands are very discreet. More likely is that we are detecting tissue-specific isoforms or some form of post-translational modifications such as phosphorylation. Importantly, though, we see that SQSTM1 phosphorylated at serine 403 is highly enriched in the autophagosome fraction, consistent with autophagy-targeted cargo [Citation14]. In addition, this enrichment technique can be performed very rapidly; with a typical enrichment time of less than 3 h. When assessing the enriched organelle fraction with fluorescence microscopy, we observe round structures coated with GFP, of a size consistent with autophagosomes (). We validate the double-membrane configuration of the isolated vesicles with transmission electron microscopy (TEM) using a rapid fixation negative staining process (). This technique is also included in this protocol. The major portion of the enrichment product appear to be mature double-membrane autophagosomes in various sizes, which are sometimes stacked together. Single-membrane vesicles were not detected by TEM. There are also double-membraned structures that did not appear to be complete vesicles, suggestive of the precursor phagophore structure. In order to validate that we are enriching for autophagy-relevant vesicles, we demonstrate, for the liver, that there is significantly increased GFP-LC3-II and endogenous LC3-II in enriched autophagosomes from mice starved for 24 h as compared to non-starved controls and this increase parallels the increase of these proteins detected by western blot (). Furthermore, to increase the amount of autophagosome available for enrichment, we inject leupeptin intraperitoneally to block autophagy flux. As shown in , this single injection results in increased amounts of LC3-II relative to LC3-I [Citation15].
The efficiency of this technique can greatly facilitate studies of the autophagosome and its content. We have used this enriched autophagosome fraction to perform a number of analyses on their contents. We have previously published the protein content of autophagosomes from retinas of the GFP-LC3 mouse (as analyzed by mass spectroscopy), as well as showing the difference in the levels of the visual transduction proteins ARR3 (arrestin 3, retinal) and transducin in the retinal autophagosomes of dark versus light-adapted mice [Citation9]. We have also demonstrated the differential level of proteasome subunits being consumed in the retinas of the P23H mouse model of hereditary retinal degeneration as compared to wild-type [Citation16]. Thus, we feel that this technique may be useful to other investigators wishing to explore the contents of the autophagosome under various conditions.
Several caveats to this protocol should be stated. First, the protocol listed is a general methodology. Optimization for particular experiments or for different tissues may need to be performed. For example, alternative methods for cell lysate preparation include the use of a nitrogen cavitation vessel (Parr Instrument 4635) [Citation17] or the Gentle MACS Dissociator (Miltenyi Biotec, 130–093-235). Additional processes for efficient dissociation of cells from different tissues may also need to be optimized, for example, the use of collagenase perfusion for isolation of liver cells [Citation3–Citation6]. Second, although it had been shown that GFP-LC3 localizes on autophagic membranes and not on other structures [Citation10], GFP-LC3 can be incorporated into protein aggregates independent of autophagy [Citation18–Citation20]. This can contribute to nonspecific binding and increased background signal on western blot or TEM. Additionally, transient transfection of GFP-LC3 often causes aggregation [Citation21,Citation22]. In these conditions, results of protein analysis should be carefully interpreted and, ideally, validated with other techniques. Finally, we should emphasize that TEM is a critical adjunct to the isolation technique to provide a confirmation of the double-membrane nature of the enriched vesicles.
Materials and reagents
Materials
(1) Needles and 1-mL BD syringe: 25-gauge needle (BD 305,125) and 30-gauge needle (BD 305,106).
(2) Dounce glass homogenizer (2 to 4 mL volume).
(3) LS column (MACS Miltenyi Biotec, 130–042-701).
(4) µMACS separator (MACS Miltenyi Biotec, 130–042-602).
(5) MµLtiStand (MACS Miltenyi Biotec, 130–042-303).
(6) 1.5 mL microcentrifuge tubes.
Equipment
(1) Cooled microcentrifuge such as Microfuge 22R Centrifuge (Beckman 22R, Indianapolis, IN, USA)
(2) Transmission electron microscope (JEOL 1400-plus TEM, Peabody, MA, USA), optional.
(3) Confocal microscope (Leica SP5, Leica Corp., Wetzlar, Germany)
Chemicals
(1) Separation buffer containing protease inhibitor: 250 mM sucrose (Sigma-Aldrich, S0389), 1 mM ethylenediaminetetraacetic acid (EDTA; Thermo Fisher Scientific, AM9262), 10 mM 4-(2-hydroxyethyl)-1-piperazineethanesulfonic acid (HEPES; Sigma-Aldrich, H3375), pH 7.4, complete protease inhibitor tablet (Roche, 11,697,498,001).
(2) µMACS anti-GFP magnetic microbeads supplied in the µMACS GFP Isolation Kit (Miltinyl Biotec, 130–091-125).
(3) LS column equilibration buffer: this is the lysis buffer in the µMACS GFP Isolation Kit. This lysis buffer is only used to prepare the LS column and will not be used as cell lysis buffer in this protocol as it contains 1% Triton X-100 which would break the membrane of autophagosomes.
(4) Trimethylamine (pH 11.8; Sigma-Aldrich, 243,205).
(5) 4-Morpholineethanesulfonic acid (MES; Sigma-Aldrich, M5287).
Animals and tissue collection
GFP-Lc3b mice (Riken Laboratories, Tsukuba, Japan) [Citation12] were used for autophagosome enrichment. All experiments conformed to the guidelines established by the University Committee on Use and Care of Animals of the University of Michigan. Mice were housed under standard 12-h light/12-h dark cycles at 20°C in the University of Michigan, Kellogg Eye Center animal facility with free (ad libitum) access to food and water. Animals were euthanized at the age of 2 months by cervical dislocation, and tissues were carefully dissected under a dissecting microscope (Olympus SZ30, NY, USA). Retina, liver, brain and lung were dissected, snap-frozen in liquid nitrogen, and then cut into small pieces that were kept at −80°C until processing for autophagosome enrichment. A total number of 12 male mice were used to in this study.
Methods
Induction of autophagy and blockage of autophagic flux in vivo
The induction of autophagy in tissues and organs, such as liver and heart can be achieved by starvation [Citation12], though the extent of this may vary across different tissue types.
In order to block autophagic flux in vivo, mice can be given one intraperitoneal injection of leupeptin [Citation15,Citation23] 40 mg/kg body weight (Sigma-Aldrich, L2884) 4 to 5 h before collecting tissue.
Homogenization of cells from GFP-LC3 mouse tissue
3.2.1. Euthanize mice and dissect small pieces (3 to 6 mg) of the tissue of interest. Place each piece of tissue in a Dounce hand homogenizer containing 1 mL cold separation buffer and homogenize tissue.
3.2.2. Transfer homogenate into a 1.5 mL microcentrifuge tube. Keep sample on ice.
3.2.3. Pass the lysate through needle attached to a 1mL syringe at a steady yet gentle pace: 3–5 times through a 25-gauge needle and 3 to 5 times through a smaller gauge needle depending on the size of specific cells.
Note: researchers need to optimize the homogenization conditions according to their samples, for example, we used different combinations of needles for different tissues: retina (25G x 5; 30G x 3), liver (25G x 3; 26G x 5), brain (25G x 5; 30G x 5), lung (25G x 5; 26G x 5)
3.2.4. Centrifuge the lysate at 1,000 x g for 10 min at 4°C to eliminate nuclei.
3.2.5. Transfer post-nuclear supernatant fraction to another 1.5 mL microcentrifuge tube and then centrifuge further at 17,000 x g for 20 min at 4°C
3.2.6. Discard supernatant fraction to remove residual cytosolic GFP-LC3
3.2.7. Further wash pellet twice with 1x phosphate buffered saline (Sigma Life Science, P4417)
Autophagosome immunoisolation
3.3.1. Resuspend the pellet fraction in 1 mL separation buffer and add 50 µL of µMACS anti-GFP magnetic microbeads, mix well.
3.3.2. Incubate lysate-bead mixture for 1 h on ice with occasional mixing
3.3.3. While incubating lysate-bead mixture, prepare µMACS Separator and place LS column in the magnetic holder of the separator.
3.3.4. Prepare column by applying 200 µL of lysis buffer containing in the kit to equilibrate column. Note, this is the only step that the lysis buffer in the kit is used.
3.3.5. Apply 200 µL of separation buffer to column and let it run through
3.3.6. Apply lysate-bead mixture to a LS column which was placed in a magnetic µMACS Separator
3.3.7. Wash column with 200 µL separation buffer 5 times. Note: the wash buffer included in µMACS GFP Isolation Kit should not be used as wash buffer for the column as it contains 0.1% SDS which may disrupt autophagosome membranes.
3.3.8. To elute the autophagosome fraction for protein analysis, apply 20 µL elution buffer in the µMACS GFP Isolation Kit to the column and incubate for 5 min. Then apply 50 µL elution buffer to the column and collect the eluate for analysis.
To elute the autophagosome fraction for TEM, elute the immunoprecipitate by pH shift using trimethylamine (pH 11.8; Sigma-Aldrich, 243,205) then neutralizing with 5 µL of 1 M MES.
Transmission electron microscopy (TEM)
3.4.1. Optional, if possible, pre-treat 200-mesh formvar-coated grids (Electron Microscopy sciences, CF200-CU) in a vacuum evaporator with a glow-discharge unit for approximately 90 sec. This step will ensure an unimpeded path between the metal source and the specimen surface, and will also increase the hydrophilicity of film-coated grids.
3.4.2. Deposit 5 µL of the sample on a pretreated grid and incubate at room temperature for 5 min.
3.4.3. Remove the excess liquid with a small piece of Whatman filter paper (Sigma-Aldrich, WHA10010155).
3.4.4. Apply 5 µL of 1% uranyl acetate on the sample and incubate for 5–10 s.
3.4.5. Remove the excess liquid with a Whatman filter paper
3.4.6. Place 3 water drops on parafilm for each sample and gently tap the grid onto the water drops to wash the grid 3 times.
3.4.7. Once the grid is dry, observe the sample with a transmission electron microscope (in the work presented here, a JEOL 1400-plus TEM [Citation9] was used).
3.4.8. Our images were recorded digitally using a High Mag Bottom Mount sCMOS camera (AMT-XR401L-B) using the AMT Capture Engine software.
Acknowledgements
We thank Alicia Withrow, PhD of Michigan State University for helping us optimize the negative staining protocol.
Disclosure statement
No potential conflict of interest was reported by the authors.
Additional information
Funding
References
- Yang Z, Klionsky DJ. Mammalian autophagy: core molecular machinery and signaling regulation. Curr Opin Cell Biol. 2010;22:124–131.
- Yoshimori T. Autophagy: a regulated bulk degradation process inside cells. Biochem Biophys Res Commun. 2004;313:453–458.
- Deter RL. Electron microscopic evaluation of subcellular fractions obtained by ultracentrifugation. In: Hayat MA, editor. Principles and techniques of electron microscopy. New York: Van Nostrand Reinhold Co; 1973. p. 199–235.
- Marzella L, Ahlberg J, Glaumann H. Isolation of autophagic vacuoles from rat liver: morphological and biochemical characterization. J Cell Biol. 1982;93:144–154.
- Strømhaug PE, Berg TO, Fengsrud M, et al. Purification and characterization of autophagosomes from rat hepatocytes. Biochem J. 1998;335:217–224.
- Seglen PO, Brinchmann MF. Purification of autophagosomes from rat hepatocytes. Autophagy. 2010;6:542–547.
- Chen X, Li LJ, Zheng XY, et al. Isolation of autophagosome subpopulations after induction of autophagy by calcium. Biochem Cell Biol. 2015;93:180–184.
- Gao W, Kang JH, Liao Y, et al. Biochemical isolation and characterization of the tubulovesicular LC3-positive autophagosomal compartment. J Biol Chem. 2010;285:1371–1383.
- Yao J, Jia L, Feathers K, et al. Autophagy-mediated catabolism of visual transduction proteins prevents retinal degeneration. Autophagy. 2016;12:2439–2450.
- Kabeya Y, Mizushima N, Ueno T, et al. LC3, a mammalian homologue of yeast Apg8p, is localized in autophagosome membranes after processing. Embo J. 2000;19:5720–5728.
- Mizushima N. Methods for monitoring autophagy. Int J Biochem Cell Biol. 2004;36:2491–2502.
- Mizushima N, Kuma A. Autophagosomes in GFP-LC3 transgenic mice. Meth Mol Biol. 2008;445:119–124.
- Mizushima N, Yamamoto A, Matsui M, et al. In vivo analysis of autophagy in response to nutrient starvation using transgenic mice expressing a fluorescent autophagosome marker. Mol Biol Cell. 2004;15:1101–1111.
- Matsumoto G, Wada K, Okuno M, et al. Serine 403 phosphorylation of p62/SQSTM1 regulates selective autophagic clearance of ubiquitinated proteins. Mol Cell. 2011;44:279–289.
- Haspel J, Shaik RS, Ifedigbo E, et al. Characterization of macroautophagic flux in vivo using a leupeptin-based assay. Autophagy. 2011;7:629–642.
- Yao J, Qiu Y, Frontera E, et al. Inhibiting autophagy reduces retinal degeneration caused by protein misfolding. Autophagy. 2018;14:1226–1238.
- Storrie B, Madden EA. Isolation of subcellular organelles. Methods Enzymol. 1990;182:203–225.
- Hara T, Nakamura K, Matsui M, et al. Suppression of basal autophagy in neural cells causes neurodegenerative disease in mice. Nature. 2006;441:885–889.
- Komatsu M, Waguri S, Ueno T, et al. Impairment of starvation-induced and constitutive autophagy in Atg7-deficient mice. J Cell Biol. 2005;169:425–434.
- Komatsu M, Waguri S, Chiba T, et al. Loss of autophagy in the central nervous system causes neurodegeneration in mice. Nature. 2006;441:880–884.
- Mizushima N, Kuma S. Autophagosomes in GFP-LC3 transgenic mice. Methods Mol Biol. 2008;445:119–124.
- Kuma A, Matsui M, Mizushima N. LC3, an autophagosome marker, can be incorporated into protein aggregates independent of autophagy; caution in the interpretation of LC3 localization. Autophagy. 2007;3:323–328.
- Esteban-Martinez L, Boya P. Autophagic flux determination in vivo and ex vivo. Methods. 2015;75:79–86.