
ABSTRACT
Understanding of the mechanism for myeloid differentiation provides important insights into the hematopoietic developmental processes. By using an ESC-derived myeloid progenitor cell model, we found that CSF2/GM-CSF triggered macrophage differentiation and activation of the MTOR signaling pathway. Activation or inhibition of the MTOR signaling enhanced or attenuated macrophage differentiation, respectively, suggesting a critical function. We further showed that macroautophagy/autophagy was inhibited with the addition of CSF2. Furthermore, pharmacological inhibition and genetic modification of autophagy enhanced macrophage differentiation and rescued the inhibitory effect on differentiation caused by MTOR inhibition. Thus, the MTOR signaling pathway regulates macrophage differentiation of myeloid progenitors by inhibiting autophagy. Our results provide new insights into the mechanisms for myeloid differentiation and may prove useful for therapeutic applications of hematopoietic and myeloid progenitor cells.
Abbreviations: 2-DG: 2-deoxy-D-glucose; ADGRE1/F4/80: adhesion G protein-coupled receptor E1; BM: bone marrow; CQ: chloroquine; ECAR: extracellular acidification rate; ESC: embryonic stem cell; CSF2/GM-CSF: colony stimulating factor 2; CSF3/G-CSF: colony stimulating factor 3; HPC: hematopoietic progenitor cell; ITGAM/CD11b: integrin alpha M; LPS: lipopolysaccharide; MFI: median fluorescence intensity; MTOR: mechanistic target of rapamycin kinase; RPS6KB1/p70S6K1: ribosomal protein S6 kinase, polypeptide 1; shRNA: short hairpin RNA; SQSTM1/p62: sequestosome 1.
Introduction
Macrophages are immune cells that provide innate immune surveillance for all tissues in the body. Macrophages can effectively remove the debris of aged and dead cells, clear the invading pathogens in the body, and activate other immune cells, so as to make an immune response to the pathogens and participate in tissue damage repair [Citation1–Citation4]. Macrophages are mainly derived from myeloid HPCs (hematopoietic progenitor cells) in the BM (bone marrow), spleen and fetal liver [Citation5–Citation7]. Isolation of macrophages from primary tissues has severe limitations, such as limited quantities, difficulties of purification, difficulties associated with genetic modifications and long-term cultivation, preventing their potential biological and therapeutic applications. Thus, it is important to understand the mechanisms behind the differentiation processes from HPCs to macrophages, which can be divided into several stages [Citation8]. Deficiencies in the macrophage differentiation processes seriously undermine the body’s immune systems, leading to various diseases.
CSF2/GM-CSF (colony stimulating factor 2) is one of the most important cytokines necessary for multiple cellular processes [Citation9–Citation11]. When CSF2 binds to its receptor, multiple downstream signaling pathways are activated, resulting in cell survival, proliferation and differentiation [Citation10,Citation12]. CSF2 has been shown to activate the MTOR signaling pathway, which can integrate multiple extracellular signals, such as nutrition, energy and cytokines, and controls gene transcription, protein translation, ribosome synthesis and autophagy [Citation13–Citation17]. Increasing evidence has indicated that MTOR plays an important role in the process of cellular differentiation, such as differentiation of adult stem cells to adipose cells, osteogenic cells, smooth muscle cells and epithelial cells [Citation16–Citation22]. Depletion of the MTOR signaling pathway components in mouse bone marrow results in the loss of quiescence of HSCs, the reduction of myeloid and lymphoid lineages [Citation23–Citation25]. We recently showed that MTOR is also necessary for neutrophil differentiation from mouse myeloid progenitor cells induced by CSF3/G-CSF (colony stimulating factor 3) [Citation26]. However, there are still very limited studies on the role of MTOR signaling pathway in myeloid differentiation.
Autophagy, mediated by the MTOR signaling pathway, is a conserved proteolytic mechanism that degrades cytoplasmic materials including various cell organelles [Citation27–Citation31]. It is essential for maintaining cellular homeostasis and has been proved to play an important function in the process of self-renewal and differentiation. Autophagy is required for the maintenance of hematopoietic stem and progenitor cells. When ATG7 is conditionally deleted in hematopoietic stem and progenitor cells, mitochondrial superoxide levels, DNA damage and apoptosis are elevated, and ATG-deleted cells fail to form secondary colonies in vitro [Citation32,Citation33]. Autophagy is essential for monocyte-macrophage differentiation [Citation34,Citation35]. When BECN/BECLIN1, ATG5, or ATG7 are depleted, macrophage differentiation of human monocytes induced by CSF1 is blocked [Citation35]. Upon inhibition of autophagy via 3-MA, CQ, or BECN1 depletion, human monocytes can no longer respond to CSF2 stimulation by undergoing macrophage differentiation [Citation35–Citation38]. Despite these studies, there is limited documentation of the role of autophagy in macrophage differentiation of HPCs.
To examine the role of MTOR signaling pathway and autophagy in myeloid differentiation, we used a previously developed immortalized myeloid progenitor cell line (mEB8-ER) [Citation26]. We found that CSF2 activated MTOR signaling pathway in mEB8-ER cells, accompanied by a decrease in autophagy. Inhibition of autophagy enhanced myeloid differentiation and rescued the effect caused by inhibition of MTOR signaling. We conclude that the MTOR signaling pathway regulates myeloid differentiation via inhibition of autophagy.
Results
The mEB8-ER cells can differentiate to functional macrophages
The mEB8-ER cells are mouse ESC-derived myeloid progenitors immortalized by the use of ectopic expression of estradiol-regulated HOXB8-ER; these cells exhibit a nearly homogeneous myeloblast-like morphology, as evidenced by large oval nuclei and relatively scant cytoplasm, and express high levels of progenitor markers, including KIT, ITGA2B, and PTPRC and little LY6A. In the absence of estradiol and with the addition of CSF3, mEB8-ER cells can be differentiated into neutrophils within 5–6 days [Citation26,Citation39].
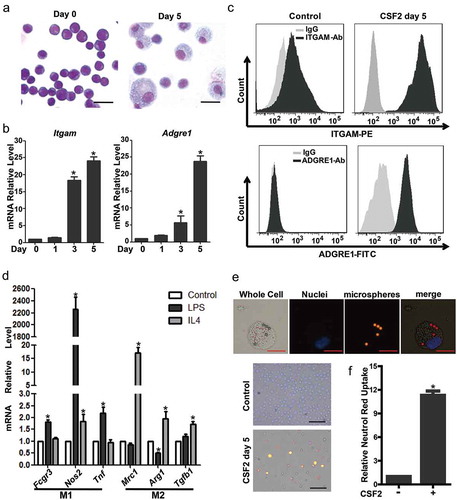
In this study, we tested the differentiation potential of mEB8-ER cells into macrophages. After 5 days of induction with CSF2, the morphology and the nucleo-cytoplasmic ratio were examined by the use of Wright-Giemsa staining. During the course of CSF2 induction, cells changed their shapes and exhibited a macrophage-like morphology, as evidenced by enlarged cell bodies, small-round nuclei, and loose-coarse chromatin (). The expression of pan-myeloid marker ITGAM/CD11b (integrin alpha M) and mouse macrophage marker ADGRE1/F4/80 (adhesion G protein-coupled receptor E1) increased dramatically (). We next tested the function of the macrophages derived from mEB8-ER cells. We stimulated the cells with LPS (lipopolysaccharide) or IL4 for 24 h and detected the polarization of macrophages. Indeed, the expression of M1 macrophage markers including Fcgr3, Nos2, Tnf were upregulated when the cells were stimulated with LPS, while the expression of M2 macrophage markers such as Mrc1, Arg1, Tgfb1 were upregulated upon stimulation of cells with IL4 ()). The phagocytosis of macrophages can be tested by the use of the fluorescent microsphere phagocytosis assay [Citation40,Citation41] and the neutral red uptake assay [Citation42,Citation43]. The cells that have phagocyted the microspheres can be excited to emit red fluorescence. After 5 days of induction, the number of cells containing microspheres and microspheres in individual cells increased substantially ()). To quantify phagocytosis, we performed the neutral red uptake assay and found that the uptake in the differentiated cells was 10-fold higher than that of the undifferentiated mEB8-ER cells ()). Together, these results showed that the mEB8-ER cells can differentiate into functional macrophages in the presence of CSF2.
Figure 1. The mEB8-ER cells can differentiate to functional macrophages. (a-c) The mEB8-ER cells were incubated with CSF2 (2 ng/mL) for the indicated days. The morphological changes were evaluated by Wright-Giemsa staining. Bar: 20 μm (a). ITGAM and ADGRE1 were chosen as macrophage markers, and their mRNA or protein levels were quantified by real-time PCR (b) or flow cytometry (c), respectively. (d) After 5 days of induction with CSF2 (2 ng/mL), the mEB8-ER cells were stimulated with 200 ng/mL LPS or 20 ng/mL IL4 for 24 h, the mRNA levels of M1 and M2 macrophage markers (as indicated) were detected with real-time PCR. (e) After 5 days of induction with CSF2 (2 ng/mL), the phagocytosis of these mEB8-ER cells were tested by phagocytosis assay with fluorescent microspheres. Merged panel indicates overlapping images of the 3 signals. Red bar: 10 µm; black bar: 100 μm. (f) After 5 days of induction with CSF2 (2 ng/mL), the phagocytosis was quantified by neutral red uptake assay. All values were normalized to the level (=1) in cells without CSF2 treatment or controls. *P < 0.05. All experiments were repeated 3 times with similar results, and all values were shown as means ± SEM of 3 independent experiments.
MTOR regulates macrophage differentiation from myeloid progenitors
The MTOR signaling pathway can be activated by CSF2 and is involved in many biological processes including cellular differentiation [Citation44]. We previously showed that this pathway can regulate the differentiation of mEB8-ER cells induced by CSF3 [Citation26]. Here we asked whether the MTOR signaling pathway participates in differentiation of mEB8-ER cells induced by CSF2.
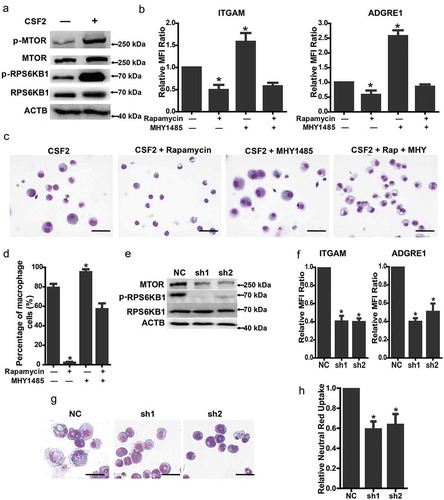
First, we detected the phosphorylation level of MTOR after CSF2 induction. Compared with the control, MTOR and RPS6KB1/p70S6K1 (ribosomal protein S6 kinase, polypeptide 1) protein were substantially phosphorylated after 24 h and sustained up to 5 days, when the cells were differentiated (Figure 2(a); Figure S1A). Thus, the MTOR signaling pathway can be activated by CSF2. We next examined the impact of MTOR inhibitor rapamycin and activator MHY1485 on cellular differentiation. As expected, the phosphorylation of RPS6KB1 was severely inhibited with rapamycin treatment. After 5 days of treatment, the expression of ITGAM and ADGRE1 was reduced significantly, with no changes to macrophage-like morphologies (Figure S1B; ). In contrast, MHY1485 promoted the phosphorylation of RPS6KB1, increased the expression of ITGAM and ADGRE1, and enhanced the macrophage-like morphological changes (Figure S1B; ). However, without the induction of CSF2, the levels of ITGAM exhibited little differences between rapamycin- or MHY1485-treated cells and control (Figure S1D). These results suggest that activation of MTOR signaling per se is insufficient to induce macrophage differentiation. When rapamycin and MHY1485 were added simultaneously, the impacts were neutralized (Figure S1B; ). The effect of MTOR inhibition in mEB8-ER cells was further confirmed by RNAi-mediated knockdown. With the knockdown of Mtor, the expression of ITGAM and ADGRE1 was much less than that in the control cells after 5-day induction with CSF2, with also significantly reduced morphological changes (). To examine the function of differentiated macrophages from MTOR-depleted cells upon CSF2 treatment and estradiol removal, the neutral red uptake assay was performed to quantify phagocytosis of the cells. The neutral red uptake in MTOR-depleted cells with 5-days CSF2 induction decreased significantly, indicating reduced phagocytosis ()). Thus, the MTOR signaling pathway positively regulates macrophage differentiation induced by CSF2.
Figure 2. MTOR regulates macrophage differentiation from myeloid progenitors. (a) The indicated protein markers in the mEB8-ER cells treated with/without CSF2 (2 ng/mL, 24 h) were tested with western bloting. (b-d) The mEB8-ER cells were induced with 2 ng/mL CSF2 and treated with or without 1 μM rapamycin or 10 μM MHY1485 for 5 days. The protein level of ITGAM and ADGRE1 was quantified by flow cytometry (b), All values were normalized to the level (= 1) in cells with only CSF2 treatment. *P < .05. Wright-Giemsa staining was performed, and the percentage of macrophage cells was counted. Bar: 50 μm (c, d). (e) The indicated protein markers in mEB8-ER cells with Mtor knockdown were tested by western blotting. NC denotes the empty retrovirus-vector. (f-h) The infected cells were induced with CSF2 (2 ng/mL) for 5 days. The protein level of ITGAM and ADGRE1 was quantified with flow cytometry (f). The morphological changes were evaluated with Wright-Giemsa staining (Bar: 20 μm) (g), and phagocytosis was tested by the use of the neutral red uptake assay (h). All values were normalized to the level (= 1) in NC cells. *P < .05. All experiments were repeated 3 times and produced similar results. All values were shown as means ± SEM of 3 independent experiments.
The role of autophagy in macrophage differentiation
It has been well established that autophagy is downstream of the MTOR signaling pathway and that MTOR can phosphorylate ULK1 at Ser757 to inhibit its activity, resulting in inhibition of autophagy [Citation31]. Thus, the link between autophagy and MTOR signaling led us to investigate autophagy involvement in the regulation of macrophage differentiation.
Firstly, we assessed the phosphorylation of ULK1 at Ser757 and found that the level was increased in mEB8-ER cells with CSF2 induction (Figure 3(a)). It has been shown previously that SQSTM1/p62 (sequestosome 1) can bind to ubiquitinated substrates and MAP1LC3/LC3 (microtubule-associated protein 1 light chain 3) on phagophores and is degraded by autophagy [Citation45]. SQSTM1 has been used as a marker of autophagy via the analysis of its protein and mRNA levels. LC3 is converted from form I to form II when autophagy is activated. As such the LC3-II:LC3-I ratio has been used to indicate the activation of autophagy [Citation46]. We found that when mEB8-ER cells were treated with CSF2, the mRNA level of Sqstm1 was downregulated, while the protein level of SQSTM1 was increased, indicating SQSTM1 accumulation. Also, the LC3-II:LC3-I ratio was decreased. Thus, autophagy was inhibited with the CSF2 treatment in mEB8-ER cells (); Figure S1A). Furthermore, autophagy was enhanced with rapamycin treatment or Mtor knockdown, but was inhibited with MHY1485 treatment (Figure S1B-C).
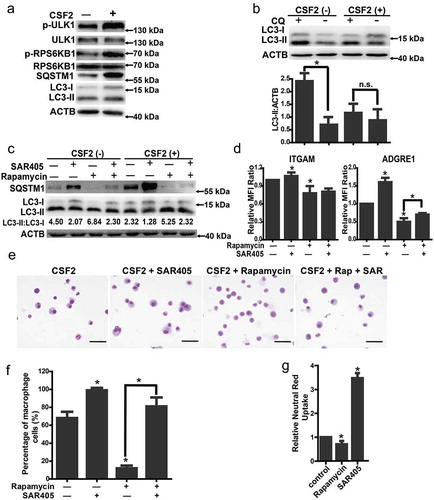
Figure 3. The role of autophagy in macrophage differentiation. (a) The indicated protein markers in the mEB8-ER cells treated with/without CSF2 (2 ng/mL, 24 h) were tested by western blotting. (b) The mEB8-ER cells stably expressing mCherry-GFP-LC3B were incubated with or without CSF2 for 24 h. The cells were then fixed with paraformaldehyde. Images were collected using a Nikon ECLIPSE Ts2R microscope. The mCherry:EGFP ratio was measured with ImageJ software, and the median of the ratio in mEB8 control cells was used as a threshold. The GFP and mCherry puncta were counted. The data are the mean ± SEM of values from 3 experiments. *P < .05. (c) The mEB8-ER cells were infected with retroviruses containing control sequence or GFP-LC3B overexpressing sequence. The infected cells were incubated with/without 10 ng/mL CSF2 for 18 h, and then treated with 10 μM CQ for 6 h. The fluorescence level of GFP-LC3B was measured with flow cytometry. The data are the mean ± SEM of values from 3 experiments. All values were normalized to the level (= 1) in cells without treatment. *P < .05. (d) The indicated protein markers in the mEB8-ER cells incubated with SAR405 at the indicated final concentrations for 24 h were tested by western blotting. (e-f) The CSF2-induced mEB8-ER cells were treated with/without SAR405 at the indicated final concentrations for 5 days. The protein level of ITGAM and ADGRE1 was measured with flow cytometry (e). The morphological changes were evaluated with Wright-Giemsa staining. Bar: 50 µm (f). All data above are the mean ± SEM of values from 3 experiments. All values were normalized to the level (= 1) in cells without SAR405 treatment. (g) The mEB8 cells were infected, respectively, with retroviruses containing Ulk1, Pik3c3, Becn1, Atg5 or Atg7 shRNA, the indicated protein markers were tested with western blot. (h)The infected cells mentioned above were induced with CSF2 (2 ng/mL) for 5 days, the protein level of ITGAM and ADGRE1 was measured with flow cytometry. All data above are the mean ± SEM of values from 3 experiments. All values were normalized to the level (= 1) in NC cells. *P < .05. (i-k) The mEB8-ER cells were infected with retroviruses containing control sequence or Gfp-Lc3b overexpressing sequence (LC3-OE). The indicated protein markers were tested with western blotting (i). The infected cells were treated with CSF2 (2 ng/mL) for 5 days. The protein level of ITGAM and ADGRE1 was measured with flow cytometry (j), and the morphological changes were evaluated with Wright-Giemsa staining. Bar: 50 μm (k). All data above are the mean ± SD of values from 3 experiments. All values were normalized to the level (=1) in control cells. *P < .05. All experiments were repeated 3 times and produced similar results.
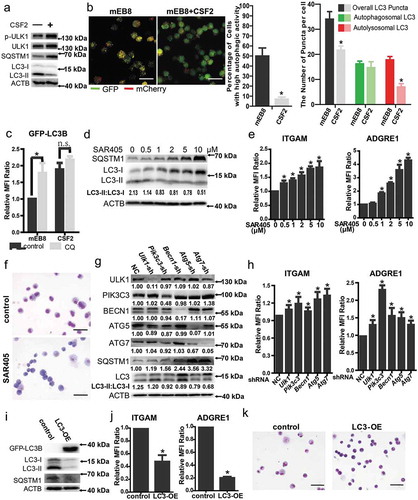
To monitor autophagy activation in rapamycin-treated mEB8-cells, autophagy flux was tested in experiments with fluorescence labeling. A retrovirus plasmid containing mCherry-Gfp-Lc3b sequence was used to obtain a mEB8-ER cell line stably expressing a tandem monomeric mCherry-GFP-tagged mouse LC3B. The GFP fluorescence is sensitive to the acidic and/or proteolytic environment of the lysosome lumen, whereas mCherry is more stable. Therefore, colocalization of GFP and mCherry fluorescence indicates a compartment that has not been fused with lysosome such as phagophores or autophagosomes. In contrast, a mCherry dot without corresponding GFP fluorescence suggests an amphisome or autolysosome [Citation46]. When the stably transfected cells were treated with CSF2, the percentage of cells with high autophagic activity was reduced, as characterized by a high mCherry:GFP ratio. In particular, the total fluorescent puncta and the mCherry fluorescent puncta were dramatically reduced. In contrast, the GFP puncta exhibited no significant changes (); Figure S2A). A retrovirus vector containing Gfp-Lc3b sequences was used to determine the autophagy flux. The GFP fluorescence was significantly enhanced when the cells were treated with CSF2. However, when the flux was blocked by CQ, the accumulation of GFP fluorescence in the mEB8-ER cells was significantly elevated, and the accumulation of GFP in the cells treated with CSF2 increased moderately (); Figure S2B). These results indicate that CSF2 addition leads to inhibition of the autophagy flux.
To test the possibility that autophagy functions in macrophage differentiation, we examined the effect of autophagy inhibitors. SAR405, an autophagy inhibitor can specifically and effectively inhibit PIK3C3 production from Pik3c3/Vps34, a key regulator of autophagy [Citation47]. The accumulation of SQSTM1 and the reduction of the LC3-II:LC3-I ratio depended on the concentration gradient of SAR405 ()). Treatment of cells stably expressing mCherry-Gfp-Lc3b with 10 μM SAR405 led to reduction of the fluorescence dots. Thus, the autophagy flux was effectively inhibited by SAR405 (Figure S2A). The expression of ITGAM and ADGRE1 was increased after the addition of SAR405, while macrophage-like morphologies were enhanced (). The autophagy inhibitor CQ had a similar effect on differentiation of mEB8-ER cells induced by CSF2 (Figure S2C-E).
To test whether autophagy played a role in macrophage differentiation, we also examined the effect of knockdown of autophagy-related genes including Ulk1, Pik3c3, Becn1, Atg5 and Atg7. As controls, we examined expression of key autophagy-related genes (Ulk1, Pik3c3, Becn1, Atg5, Atg7 and Sqstm1) during murine and human monocyte/macrophage differentiation in vivo (Figure S3A, B). We found that all of the above genes were highly expressed in mEB8-ER cells (); Figure S2F, G). When these genes were knocked down individually, autophagy was inhibited, as reflected by the accumulation of SQSTM1, the decrease of the LC3-II:LC3-I ratio (); Figure S2F, G) and the expression of ITGAM and ADGRE1 was increased ()). We found that the increase of ITGAM and ADGRE1 expression in Pik3c3 knockdown cells was similar to that in the cells treated with 1–2 µM SAR405, but was much lower than that in the cells with higher concentration of SAR405 treatment (,h); Figure S4A). This may be due to the higher efficiency of autophagy inhibition from SAR405 treatment than that from partial depletion of Pik3c3 (; Figure S4B). SAR405 can specifically and effectively inhibit a key regulator of autophagy, PIK3C3 [Citation47].
When a retrovirus vector containing Gfp-Lc3b sequences was used to overexpress LC3B in mEB8-ER cells, the SQSTM1 accumulation decreased and the expression of ITGAM and ADGRE1 was decreased (-k)). Thus, autophagy negatively regulates macrophage differentiation of mEB8-ER cells.
It has been suggested that metabolic regulation, such as fetal bovine serum (FBS) concentration or oxidative activity and glycolysis may be involved in stem cell/progenitor cell differentiation [Citation16,Citation17,Citation48]. We attempted to investigate the potential relationship between metabolism, autophagy and differentiation. First, we reduced the amount of FBS in the culture medium, which reportedly reduces cellular metabolism and results in the activation of autophagy [Citation46]. We found that reduction of FBS (from 10% to 5%) promoted autophagy but inhibited differentiation (Figure S5A, B). To further explore the effects of metabolism on autophagy and differentiation, we conducted experiments to analyze glycolysis. Extracellular acidification rate (ECAR) has been used to determine the metabolism of the cells [Citation49]. We measured ECAR during cell differentiation and found that the induction of CSF2 leads to greater ECAR of the media compared to the mEB8-ER cells (Figure S5C). Next, we inhibited glycolysis with 2-deoxy-D-glucose (2-DG) [Citation50–Citation52]. Functionality of the 2-DG treatment was assessed by testing ECAR [Citation53]. The results show that 2-DG significantly reduced ECAR (Figure S5D). Consistently, the MTOR signaling pathway was inhibited, while autophagy was activated upon 2-DG treatment (Figure S5E). Furthermore, inhibition of glycolysis attenuated differentiation of the mEB8-ER cells, as reflected by the decreased expression of ITGAM and ADGRE1 (Figure S5F). Notably, the former mentioned responses were dose dependent.
It has been reported that mitophagy is involved in cellular differentiation [Citation16,Citation54], leading us to examine the role of mitophagy in CSF2-induced differentiation. We discovered that mitophagy was inhibited by CSF2 in mEB8-ER cells (Figure S5G).
Together, these results imply a link between metabolism, autophagy and cell differentiation. However, a more detailed understanding of the potential relationship and underlying mechanisms await future experimentation.
Inhibition of autophagy rescues the effect of MTOR inhibition
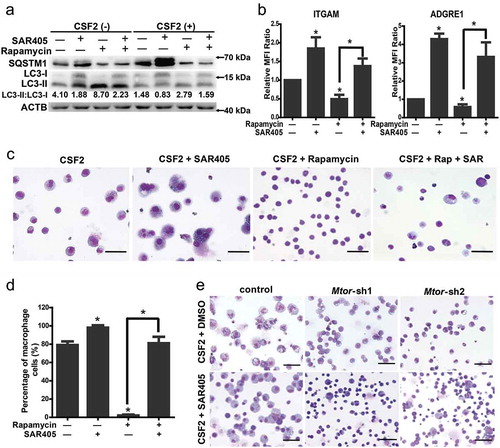
To further the functional relationship between MTOR and autophagy in macrophage differentiation, we conducted rescue analysis. As shown in and Figure S6A-D, the effect of rapamycin on SQSTM1 and LC3-II:LC3-I ratio was rescued by SAR405 and CQ, and the effect on differentiation was rescued, too. Expectedly, the phosphorylation of RPS6KB1 was unaltered by SAR405 and CQ, consistent with the notion that autophagy acts downstream of the MTOR pathway (); Figure S6A, S7). Additionally, SAR405 treatment or the knockdown of Atg genes partially rescued the inhibition of the differentiation induced by Mtor knockdown (); Figure S6E).
Figure 4. Inhibition of autophagy rescues the effect of MTOR inhibition. (a) The indicated protein markers in the mEB8-ER cells induced by 2 ng/mL CSF2 with or without 1 μM rapamycin and/or 10 μM SAR405 for 24 h were tested with western blotting. (b-d) The mEB8-ER cells were induced with 2 ng/mL CSF2, and treated with or without 1 μM rapamycin and/or 10 μM SAR405 for 5 days. The protein level of ITGAM and ADGRE1 was measured with flow cytometry (b), All values were normalized to the level (= 1) in cells with only CSF2 treatment. *P < .05. Wright-Giemsa staining was performed, and the percentage of macrophage cells was counted. Bar: 50 μm (c, d). (e) The mEB8-ER cells that infected by retrovirus containing Mtor-shRNA were induced with 2 ng/mL CSF2 with or without 10 μM SAR405 for 5 days. The morphological changes were evaluated with Wright-Giemsa staining. Bar: 50 μm. All experiments were repeated 3 times and produced similar results. MFI, median fluorescence intensity.
We previously reported that MTOR mediates CSF3 induction of neutrophil differentiation in mEB8-ER cells. The effect of autophagy inhibition on neutrophil differentiation has been reported by Rožman et al [Citation55]. They found that the lack of ATG5 in the neutrophil lineage results in both increased and accelerated neutrophil production. We explored the function of autophagy in CSF3 induced neutrophil differentiation in mEB8-ER cells. As shown in Figure S8A, CSF3 treatment inhibited autophagy in mEB8-ER cells, while neutrophil marker LY6G was upregulated significantly with ATG depletion (Figure S8B). Moreover, SAR405 rescued the inhibition of the differentiation induced by rapamycin (Figure S8C). These data suggest that the MTOR signaling pathway regulates myeloid differentiation of mEB8-ER cells into both macrophages and neutrophils via inhibition of autophagy.
What is the relationship between cell proliferation and myeloid differentiation? To address this question, we examined the effects of rapamycin, SAR405, CQ and a cell-cycle inhibitor roscovitine (Figure S9A). Rapamycin, SAR405, CQ and roscovitine all inhibited cell proliferation, but they exerted different effects on differentiation. While rapamycin inhibited macrophage differentiation, SAR405 and CQ promoted differentiation. Interestingly, roscovitine inhibited differentiation induced by CSF2 (Figure S9B). As shown in , when autophagy was inhibited by SAR405, it not only increased the number of macrophage cells, but also promoted MFI of the differentiated cells and enhanced the maturity of the cells, as judged by cell morphology. Together, these results suggest that inhibition of proliferation does not necessarily cause inhibition of differentiation. They also indicate that the changes in differentiation induced by autophagy inhibition are not due to its effect on proliferation.
MTOR has a conserved function in primary HPCs
To validate the results obtained from mEB8-ER cells, we isolated primary myeloid progenitor cells from 4-week-old mouse bone marrow and assessed the role of MTOR and autophagy in macrophage differentiation. Similar to the results from mEB8-ER cells, CSF2 activated the MTOR signaling pathway in HPCs, as indicated by the phosphorylation of RPS6KB1 and ULK1. Also, autophagy was inhibited, as reflected by the accumulation of SQSTM1 and the decrease of LC3-II:LC3-I ratio (Figure 5(a)). In addition, CSF2 reduced the accumulation of LC3-II, indicating inhibition of the autophagy flux ()). Rapamycin treatment activated autophagy and inhibited differentiation of primary HPCs induced by CSF2, as indicated by the decrease of ITGAM and ADGRE1 and reduced morphological changes. In addition, SAR405 rescued the effect of rapamycin (). We also tested the phagocytosis of cells by the neutral red uptake assay, which demonstrated that rapamycin reduced the uptake, while SAR405 increased it ()). Thus, MTOR regulates macrophage differentiation of mouse bone marrow HPCs via autophagy, similar to mEB8-ER cells.
Figure 5. MTOR has a conserved function in primary HPCs. (a) The indicated protein markers in HPCs treated with/without CSF2 (10 ng/mL, 24 h) were tested with western blotting. (b) The primary hematopoietic progenitor cells derived from mouse bone marrow were incubated with/without 10ng/mL CSF2 for 18 h, and then treated with 10 μM CQ for 6 h. LC3-II level was determined by using western blotting and quantified. All data are the mean ± SD of values from three experiments. *P < .05. (c) The indicated protein markers in the mEB8-ER cells induced with 2 ng/mL CSF2, and treated with or without 1 μM rapamycin and/or 10 μM SAR405 for 24 h were tested by western blot. (d-g) The HPCs were induced with 10 ng/mL CSF2, and treated either with or without 1 μM rapamycin and/or 10 μM SAR405 for 5 days. The protein level of ITGAM and ADGRE1 was measured by flow cytometry (d). Wright-Giemsa staining was performed, and the percentage of macrophage cells was counted. Bar: 50 μm (e, f). The phagocytosis was tested by neutral red uptake assay (g). All data above are the mean ± SEM of values from three experiments. All values were normalized to the level (= 1) in cells with only CSF2 treatment. *P < .05. All experiments were repeated 3 times and produced similar results.
Discussion
Macrophages are an important class of innate immune cells that also participate in adaptive immunity. The studies on the macrophage developmental mechanisms and function are of great significance to the understanding of many diseases, such as inflammation, autoimmune diseases and tumor. However, the molecular mechanism underlying differentiation of hematopoietic stem cells to macrophages remains largely elusive. A major hurdle for such mechanistic studies is the lack of appropriate cellular models. The primary hematopoietic progenitor cells derived from bone marrow are difficult to purify, prone to differentiation, unsuitable for long-term culture and resistant to genetic manipulations. Other cell models derived from leukemia are tumor cells with permanent genetic alterations. Instead, the mEB8-ER cells are myeloid progenitors immortalized from genetically normal embryonic stem cells by the use of ectopic expression of estradiol-regulated HOXB8-ER. Our previous studies show that the mEB8-ER cells are able to differentiate to neutrophils in the presence of CSF3 and with the removal of estradiol [Citation26]. In our current study, we found that the mEB8-ER cells can differentiate into macrophage-like cells in the presence of CSF2 and with the removal of estradiol.
CSF2 can activate various signaling pathways with distinct functions. For instance, the JAK-STAT5 signaling pathway is involved in cellular differentiation, the 14-3-3 pathway promotes cell survival, the MAPK pathway is associated with cell proliferation, and the MTOR pathway can influence many biological processes [Citation9,Citation12,Citation56]. In our study, we show that the MTOR signaling pathway can be activated by CSF2 in mEB8-ER cells and in turn regulates myeloid progenitor cell differentiation (). However, activation of MTOR by MHY1485 alone does not effectively induce cell differentiation (Figure S1D), suggesting that MTOR activation per se is insufficient. It has been well established that different extracellular conditions and stimuli that activate MTOR signaling can lead to distinct cellular responses. For instance, MTOR activation by nutrients is required for HSC maintenance both in steady-state and under transplantation conditions [Citation57]; MTOR can be activated in HSCs by ex vivo expansion, which results in the induction of senescence in HSCs [Citation58]. We and others [Citation26] have shown that activation of MTOR by CSF3 is involved in differentiation of HPCs to neutrophils (Figure S8), while MTOR activation induced by CSF2 is necessary for macrophage differentiation. Thus, MTOR activation by CSF2 is a prerequisite for CSF2-induced macrophage differentiation, but is insufficient by itself to give rise to such diverse cellular responses. Although a comprehensive delineation of the detailed the mechanism underlying CSF2 induction of macrophage differentiation awaits future experimentation, additional factors besides MTOR activation alone are clearly needed. Specifically, we speculate that the precise temporal and spatial modulation of MTOR signaling by CSF2 and/or additional signals and pathways triggered by CSF2 may contribute to CSF2 induction of macrophage differentiation.
It is recently shown that MTOR inhibits autophagy through phosphorylating ULK1 at Ser757 [Citation14,Citation59,Citation60]. Autophagy is an important event during differentiation of many different types of cells. Despite previous studies of autophagy regulation of migration, polarization, and other functions of macrophages, the role of autophagy in mediating or facilitating differentiation of hematopoietic stem and progenitor cells remains largely elusive. Several recent in vivo studies reported that when Atg7 deletion by Vav promoter-directed Cyclization Recombination Enzyme (Cre) expression occurs at stem-cell level, which leads to complete floxing of Atg7 throughout the hematopoietic system. The atgflox/flox;Vav-Cre mice display robust myeloproliferation and exhibited a higher macrophage and neutrophil burden in the spleen, peritoneum and blood than the wild-type mice [Citation37,Citation61,Citation62]. The results suggest that the block of autophagy promotes the differentiation of stem cells and progenitors into macrophages and neutrophils in vivo. In our study, autophagy is continuously inhibited with the addition of CSF2 in vitro, as shown by the accumulation of SQSTM1 and the decrease of LC3-II:LC3-I ratio (); Figure S1A). When autophagy is inhibited pharmacologically or genetically, the macrophage and neutrophil differentiation of HPCs is enhanced; when autophagy is promoted, differentiation is attenuated. Our results are also consistent with a previous study showing that inhibition of autophagy via Atg5 knockdown can promote neutrophil differentiation of cells derived from mouse bone marrow when they are induced by CSF3 in vitro [Citation55].
However, other studies of the role of autophagy in macrophage and neutrophil differentiation have reported somewhat conflictive findings. For example, in atg7flox/flox;Lyz-Cre mice, Atg7 deletion is limited to myeloid-cell lineage, whereas early hematopoietic cells, including stem cells and progenitors, retain intact Atg7 alleles, and the conditional deletion does not result in peripheral blood changes relative to wild-type mice [Citation37]. A similar study reported that in atg5 flox/flox;Lyz2-Cre mice, the deletion of Atg5 has no measurable impact on neutrophil function but causes a mild expansion of precursors [Citation55]. Furthermore, another in vivo study found that in atg7flox/flox;Cebpa-Cre mice, in which Atg7 is deleted predominantly at the GMP stage with negligible deletion in HSCs or lymphoid lineages, the numbers of immature myeloblasts and myelocyte precursors are elevated, while neutrophil differentiation is blocked at or after the GMP stage [Citation62]. In human peripheral blood monocytes, autophagy can be activated by CSF2 [Citation34] or CSF1 [Citation35,Citation38], and monocyte-macrophage differentiation is blocked when autophagy is inhibited. Together, these data show that autophagy inhibition at different stages of macrophage and neutrophil differentiation can cause various phenotypes, indicating that autophagy might play different functional roles in different stages of differentiation. However, the underlying mechanisms appear to be complicated and need to be further explored.
Our findings that the autophagy inhibitors can rescue the effect of MTOR inhibition on macrophage differentiation strongly suggest that MTOR regulates macrophage differentiation via inhibition of autophagy. Interestingly, the protein levels of ITGAM and ADGRE1 in the rescued cells are higher than those in cells treated by CSF2 alone. Thus, autophagy may also mediate the function of other pathways that control macrophage differentiation.
Moreover, because MTOR signaling and autophagy are closely related to metabolism, we determined the effect of inhibiting metabolism by reducing serum concentrations and adding 2-DG. Our results show that inhibition of metabolism leads to decrease in MTOR activation, increase in autophagy, and inhibition of differentiation (Figure S5), indicating that metabolism might influence differentiation through MTOR and autophagy. Meanwhile, we discovered that mitophagy can be inhibited by CSF2 in mEB8-ER cells (Figure S5G). These observations are consisted with earlier reports that inhibition of MTOR can induce mitophagy [Citation63,Citation64]. However, a more detailed understanding of the potential relationship between mitophagy, MTOR signaling and differentiation and the underlying mechanisms await future experimentation.
In summary, we utilized the HOXB8-ER-based immortalized myeloid progenitor cells to dissect the mechanism of macrophage differentiation. We found that the MTOR signaling pathway regulates macrophage differentiation of myeloid HPCs via autophagy. While CSF2 is the only inducing factor we have used in vitro, the mechanisms of macrophage differentiation are certainly more complex and consisted of multiple factors. Furthermore, the more detailed mechanisms underlying autophagy regulation of macrophage differentiation remain elusive and therefore require future experiments to address. Our findings nevertheless suggest that MTOR signaling pathway and autophagy play important roles in the differentiation of HPCs.
Materials and methods
Antibodies and reagents
The following antibodies were used for western blot: Rabbit anti-MTOR (2983), anti-p-MTOR-Ser2448 (2971), anti-ULK1 (8054), anti-p-ULK1-Ser757 (14202), anti-RPS6KB1 (9202), anti-p-RPS6KB1 (9208), anti-LC3A/B (12741), anti-SQSTM1 (5114), anti-rabbit-IgG-HRP (7074), anti-mouse-IgG-HRP (7076) from Cell Signaling Technology; mouse anti-ACTB/β-Actin (HC-201) from Transgen Biotech.
The following antibodies were used for flow cytometry analysis: PE-anti-mouse/human ITGAM (101207), PE anti-mouse LY6G/LY6C (Gr-1) (108407), Percp/cy5.5-anti-mouse ADGRE1 (123127), FITC-anti-mouse ADGRE1 (123107), PE rat IgG2b,κ Isotype Ctrl (400607),Percp/cy5.5 rat IgG2a,κ Isotype Ctrl (400531), FITC rat IgG2a,κ Isotype Ctrl (400505), from Biolegend.
The following reagents were used: Rapamycin (A8167), SAR405 (A8883) from ApexBio; 2-deoxy-D-glucose (HY-13966) from MedChemExpress; chloroquine (CQ, C6628) and β-estradiol (E2758) from Sigma-Aldrich; recombinant murine KITL/SCF (250-03), CSF2 (315-03), CSF3 (250-05), IL3 (213-13), and IL6 (216-16) from PeproTech.
Cell culture
The mEB8-ER cells were cultured in Opti-Mem medium (Gibco, 11058-021) with 10% fetal bovine serum (FBS, Gibco, 1600044), 100 U/mL penicillin, 100 μg/mL streptomycin (Gibco, 15140122), 1% GlutaMAX (Gibco, 35050061), 10 ng/mL SCF, 30 μM mercaptoethanol, and 1 μM β-estradiol. The medium used for mEB8-ER cell differentiation was without β-estradiol, with 2 ng/mL CSF2. HEK293T cells were cultured in DMEM (high glucose) (Gibco, C11995500CP) with 10% FBS, 100 U/mL penicillin, 100 μg/mL streptomycin, 1% GlutaMAX.
Mouse primary progenitor cells isolation from BM
BM cells were isolated from the leg bones of 4 weeks old C57L/6 mice, and then used with EasySep™ Mouse Hematopoietic Progenitor Cell Isolation Kit (Stemcell Technologies, 19856) to obtain primary progenitor cells. The isolated progenitor cells were cultured in IMDM medium (Gibco, 12440053) containing 10% FBS, 100 U/mL penicillin, 100 μg/mL streptomycin, 1% GlutaMAX, 10 ng/mL SCF, 20 ng/mL IL3, 20 ng/mL IL6, as described previously [Citation65].
Retrovirus production and infection
For shRNA–mediated knockdown of MTOR, LMP-puro-shRNA containing retroviruses were used. The Mtor shRNA retroviral sequences were as described previously [Citation66]. And for shRNA–mediated knockdown of Ulk1, Pik3c3, Becn1, Atg5 and Atg7, pSIREN-RetroQ-shRNA containing retroviruses were used. Sequences of shRNA were as and .
Table 1. The sequences of Mtor shRNA for LMP containing retroviruses.
Table 2. The sequences of shRNA for pSIREN-RetroQ-shRNA containing retroviruses.
For overexpression of tagged LC3B, pBABE-puro-containing retroviruses (Addgene, 1764, Hartmut Land, Jay Morgenstern, Bob Weinberg) were constructed and used. The cDNAs of Gfp-Lc3b and mCherry-Gfp-Lc3b were purchased from Nanjing Bioworld Biotechnology.
Retroviruses were generated as previously described, and added along with 6 μg/mL polybrene (Shanghai Yeasen Biotechnology, 40804ES76) to the mEB8-ER cells and incubated for 20 h, after which fresh growth medium was provided. Cells were selected with 2 μg/mL puromycin (Shanghai Yeasen Biotechnology, 60210ES25) 2 days after infection and used for subsequent analyses 3 days after selection.
Western blotting
Cells were lysed in lysis buffer [20 mM Tris, pH 7 (Sangon Biotech, A100826), 0.5% NP-40 (Sangon Biotech, A510110), 250 mM NaCl (Sangon Biotech, A100241), 3 mM EDTA (Sangon Biotech, A100322), 3 mM EGTA (Sangon Biotech, A600077), 2 mM DTT (Sangon Biotech, A100281), 0.5 mM PMSF (Sangon Biotech, A610425), 20 mM β-glycerol phosphate (Sangon Biotech, A500486), 1 mM sodium vanadate (Sangon Biotech, A602444), 1 mg/mL of leupeptin (Sangon Biotech, A600580)] and were analyzed by immunoblotting after SDS-PAGE. Proteins were visualized by ECL according to the manufacturer’s instructions (Millipore, WBKLS0050).
RNA isolation and real-time PCR
Total RNA was extracted with TRIzol reagent (Invitrogen, 15596-026) according to the manufacturer’s guidelines. The reverse transcription of RNA samples were performed with PrimeScript RT reagent Kit with gDNA Eraser (TAKARA, RR047A). And then, real-time PCR was performed with SYBR Green Master Mix Reagent (Shanghai Yeasen Biotechnology, 11201ES03) using Roche Light Cycler 480 Real-Time PCR detector (Roche Diagnostics International Ltd, Forrenstrasse2,6343 Rotkreuz, Switzerland). The primers used in real-time PCR are in .
Table 3. The sequences of primers for real-time PCR.
Wright-Giemsa staining
Morphology was evaluated by Wright-Giemsa staining as previously described [Citation67]. Briefly, cytospin preparations of 2 × 10⁵ cells were incubated sequentially in solution A for 1 min and solution B for 7 min, washed with water, air-dried, and then examined under microscope. Images were collected using a Nikon ECLIPSE Ts2R microscope (Nikon, Tokyo, Japan).
Flow cytometry
Flow cytometry was performed according to the manufacturer’s protocol. Briefly, cells were washed with ice-cold phosphate buffered saline (PBS; Gibco, 10010023), incubated at 4°C for 1 h in PBS with bovine serum albumin (BSA, 0.5%; Sangon Biotech, A600903) with anti-ITGAM or -ADGRE1 antibodies or an isotype control. Finally, cells were washed and detected with a BD FACS CantoTM II flow cytometer (BD Bioscience, California, USA).
Phagocytosis assay with fluorescent microspheres
After 5 days of induction with CSF2 (2 ng/mL), the mEB8-ER cells were starved for 2 h and incubated with red fluorescent microspheres (Sigma-Aldrich, L3030) for 1 h. The cells were washed with PBS 3 times to remove the fluorescent microspheres not phagocytized, fixed with 4% paraformaldehyde (Thermo Fisher Scientific, 28908), and stained with DAPI (Sigma-Aldrich, D9542) for nuclear staining. The signals were detected by fluorescence microscopy.
Neutral red uptake assay
The phagocytic ability of the differentiated cells was measured by using neutral red uptake. The differentiated cells were washed twice in PBS, subsequently plated onto 96-well plates (106 cells/well), and cultured for 24 h in Opti-Mem medium containing 10% FBS, 1% Pen-Strep-glutamine. After 2 washes, 200 μl neutral red (Sangon Biotech, A600652) solutions (dissolved in PBS at the concentration of 0.075%) were added and incubated with the cells for 1 h. Supernatant was discarded, and cells were washed twice in PBS to remove the neutral red not phagocytized. Cell lysis buffer (ethanol and 0.01% acetic acid at the ratio of 1:1, 200 μL/well) was added to lyse cells. Finally, cells were incubated overnight at 4°C. The optical density was measured at 540 nm using a multi-mode detection platform (Tecan, Austria GmbH, Untersbergstr.1A, A-5082 Grödig, Austria).
Statistical analyses
Results are shown as mean±SEM. Statistical significance was determined using t test. Results were considered significant when P < .05.
Supplemental Material
Download Zip (36.2 MB)Acknowledgments
This article is dedicated to Dr Guo-Qiang Chen, who has made significant contribution in the field of myeloid and leukemia differentiation induction on the occasion of his 55th birthday.
Disclosure statement
No potential conflict of interest was reported by the authors.
Supplemental material
Supplemental data for this article can be accessed here.
Additional information
Funding
Related Research Data
References
- Eming SA, Krieg T, Davidson JM. Inflammation in wound repair: molecular and cellular mechanisms. J Invest Dermatol. 2007 Mar;127(3):514–525. PubMed PMID: 17299434.
- Wang H, Peters T, Kess D, et al. Activated macrophages are essential in a murine model for T cell-mediated chronic psoriasiform skin inflammation. J Clin Invest. 2006 Aug;116(8):2105–2114. PubMed PMID: 16886059; PubMed Central PMCID: PMC1523400.
- Gordon S. Alternative activation of macrophages. Nat Rev Immunol. 2003 Jan;3(1):23–35. PubMed PMID: 12511873.
- Wynn TA, Chawla A, Pollard JW. Macrophage biology in development, homeostasis and disease. Nature. 2013 Apr 25;496(7446):445–455. PubMed PMID: 23619691; PubMed Central PMCID: PMC3725458.
- Gordon S, Fraser I, Nath D, et al. Macrophages in tissues and in vitro. Curr Opin Immunol. 1992 Feb;4(1):25–32. PubMed PMID: 1317710.
- Stout RD, Suttles J. Functional plasticity of macrophages: reversible adaptation to changing microenvironments. J Leukoc Biol. 2004 Sep;76(3):509–513. PubMed PMID: 15218057; PubMed Central PMCID: PMC1201486.
- Geissmann F, Manz MG, Jung S, et al. Development of monocytes, macrophages, and dendritic cells. Science. 2010 Feb 05;327(5966):656–661. PubMed PMID: 20133564; PubMed Central PMCID: PMC2887389.
- Goasguen JE, Bennett JM, Bain BJ, et al. Morphological evaluation of monocytes and their precursors. Haematologica. 2009 Jul;94(7):994–997. PubMed PMID: 19535346; PubMed Central PMCID: PMC2704310.
- Stosser S, Schweizerhof M, Kuner R. Hematopoietic colony-stimulating factors: new players in tumor-nerve interactions. J Mol Med. 2011 Apr;89(4):321–329. PubMed PMID: 21079906; PubMed Central PMCID: PMC3055988.
- Pittet MJ, Nahrendorf M, Swirski FK. The journey from stem cell to macrophage. Ann N Y Acad Sci. 2014 Jun;1319:1–18. PubMed PMID: 24673186; PubMed Central PMCID: PMC4074243.
- Lehtonen A, Matikainen S, Miettinen M, et al. Granulocyte-macrophage colony-stimulating factor (GM-CSF)-induced STAT5 activation and target-gene expression during human monocyte/macrophage differentiation. J Leukoc Biol. 2002 Mar;71(3):511–519. PubMed PMID: 11867689.
- Guthridge MA, Stomski FC, Thomas D, et al. Mechanism of activation of the GM-CSF, IL-3, and IL-5 family of receptors. Stem Cells. 1998;16(5):301–313. PubMed PMID: 9766809.
- Wullschleger S, Loewith R, Hall MN. TOR signaling in growth and metabolism. Cell. 2006 Feb 10;124(3):471–484. PubMed PMID: 16469695.
- Nandagopal N, Roux PP. Regulation of global and specific mRNA translation by the mTOR signaling pathway. Translation. 2015 Jan-Jun;3(1):e983402. PubMed PMID: 26779414; PubMed Central PMCID: PMC4682803.
- Dibble CC, Manning BD. Signal integration by mTORC1 coordinates nutrient input with biosynthetic output. Nat Cell Biol. 2013 Jun;15(6):555–564. PubMed PMID: 23728461; PubMed Central PMCID: PMC3743096.
- Khacho M, Slack RS. Mitochondrial activity in the regulation of stem cell self-renewal and differentiation. Curr Opin Cell Biol. 2017 Nov 22;49:1–8.
- Meng D, Frank AR, Jewell JL. mTOR signaling in stem and progenitor cells. Development. 2018 Jan 8;145(1). DOI: 10.1242/dev.152595 PubMed PMID: 29311260.
- Cho HJ, Park J, Lee HW, et al. Regulation of adipocyte differentiation and insulin action with rapamycin. Biochem Biophys Res Commun. 2004 Sep 03;321(4):942–948. PubMed PMID: 15358118.
- Kim JE, Chen J. regulation of peroxisome proliferator-activated receptor-gamma activity by mammalian target of rapamycin and amino acids in adipogenesis. Diabetes. 2004 Nov;53(11):2748–2756. PubMed PMID: 15504954.
- Isomoto S, Hattori K, Ohgushi H, et al. Rapamycin as an inhibitor of osteogenic differentiation in bone marrow-derived mesenchymal stem cells. J Orthop Sci. 2007 Jan;12(1):83–88. PubMed PMID: 17260122.
- Erbay E, Chen J. The mammalian target of rapamycin regulates C2C12 myogenesis via a kinase-independent mechanism. J Biol Chem. 2001 Sep 28;276(39):36079–36082. PubMed PMID: 11500483.
- Laprise P, Chailler P, Houde M, et al. Phosphatidylinositol 3-kinase controls human intestinal epithelial cell differentiation by promoting adherens junction assembly and p38 MAPK activation. J Biol Chem. 2002 Mar 08;277(10):8226–8234. PubMed PMID: 11756422.
- Guo F, Zhang S, Grogg M, et al. Mouse gene targeting reveals an essential role of mTOR in hematopoietic stem cell engraftment and hematopoiesis. Haematologica. 2013 Sep;98(9):1353–1358. PubMed PMID: 23716557; PubMed Central PMCID: PMC3762090.
- Chen C, Liu Y, Liu R, et al. TSC-mTOR maintains quiescence and function of hematopoietic stem cells by repressing mitochondrial biogenesis and reactive oxygen species. J Exp Med. 2008 Sep 29;205(10):2397–2408. PubMed PMID: 18809716; PubMed Central PMCID: PMC2556783.
- Magee JA, Ikenoue T, Nakada D, et al. Temporal changes in PTEN and mTORC2 regulation of hematopoietic stem cell self-renewal and leukemia suppression. Cell Stem Cell. 2012 Sep 7;11(3):415–428. PubMed PMID: 22958933; PubMed Central PMCID: PMC3447536.
- Li D, Yang H, Nan H, et al. Identification of key regulatory pathways of myeloid differentiation using an mESC-based karyotypically normal cell model. Blood. 2012 Dec 06;120(24):4712–4719. PubMed PMID: 23086752; PubMed Central PMCID: PMC3520617.
- Hu G, McQuiston T, Bernard A, et al. TOR-dependent post-transcriptional regulation of autophagy. Autophagy. 2015;11(12):2390–2392. PubMed PMID: 26569496; PubMed Central PMCID: PMC4835197.
- Dash S, Chava S, Chandra PK, et al. Autophagy in hepatocellular carcinomas: from pathophysiology to therapeutic response. Hepat Med. 2016;8:9–20. PubMed PMID: 26955295; PubMed Central PMCID: PMC4772942.
- Guan JL, Simon AK, Prescott M, et al. Autophagy in stem cells. Autophagy. 2013 Jun 01;9(6):830–849. PubMed PMID: 23486312; PubMed Central PMCID: PMC3672294.
- Phadwal K, Watson AS, Simon AK. Tightrope act: autophagy in stem cell renewal, differentiation, proliferation, and aging. Cell Mol Life Sci. 2013 Jan;70(1):89–103. PubMed PMID: 22669258; PubMed Central PMCID: PMC3535400.
- Bento CF, Renna M, Ghislat G, et al. Mammalian autophagy: how does it work? Annu Rev Biochem. 2016 Jun 02;85:685–713. PubMed PMID: 26865532.
- Vessoni AT, Muotri AR, Okamoto OK. Autophagy in stem cell maintenance and differentiation. Stem Cells Dev. 2012 Mar 01;21(4):513–520. PubMed PMID: 22066548.
- Gomez-Puerto MC, Folkerts H, Wierenga AT, et al. Autophagy proteins ATG5 and ATG7 are essential for the maintenance of human CD34(+) hematopoietic stem-progenitor cells. Stem Cells. 2016 Jun;34(6):1651–1663. PubMed PMID: 26930546.
- Zhang Y, Morgan MJ, Chen K, et al. Induction of autophagy is essential for monocyte-macrophage differentiation. Blood. 2012 Mar 22;119(12):2895–2905. PubMed PMID: 22223827; PubMed Central PMCID: PMC3327464.
- Jacquel A, Obba S, Boyer L, et al. Autophagy is required for CSF-1-induced macrophagic differentiation and acquisition of phagocytic functions. Blood. 2012 May 10;119(19):4527–4531. PubMed PMID: 22452982.
- Salemi S, Yousefi S, Constantinescu MA, et al. Autophagy is required for self-renewal and differentiation of adult human stem cells. Cell Res. 2012 Feb;22(2):432–435. PubMed PMID: 22184008; PubMed Central PMCID: PMC3271583.
- Cao Y, Zhang S, Yuan N, et al. Hierarchal autophagic divergence of hematopoietic system. J Biol Chem. 2015 Sep 18;290(38):23050–23063. PubMed PMID: 26245898; PubMed Central PMCID: PMC4645612.
- Obba S, Hizir Z, Boyer L, et al. The PRKAA1/AMPKalpha1 pathway triggers autophagy during CSF1-induced human monocyte differentiation and is a potential target in CMML. Autophagy. 2015;11(7):1114–1129. PubMed PMID: 26029847; PubMed Central PMCID: PMC4590592.
- Wang Q, Liu F, Zhang M, et al. NLRP12 promotes mouse neutrophil differentiation through regulation of non-canonical NF-kB and MAPKERK1/2 signaling. Int J Biol Sci. 2018;14(2):147–155.
- Defresne F, Bouzin C, Grandjean M, et al. Preconditioned endothelial progenitor cells reduce formation of melanoma metastases through SPARC-driven cell-cell interactions and endocytosis. Cancer Res. 2011 Jul 15;71(14):4748–4757. PubMed PMID: 21616936.
- Webster SJ, Daigneault M, Bewley MA, et al. Distinct cell death programs in monocytes regulate innate responses following challenge with common causes of invasive bacterial disease. J Iimmunol. 2010 Sep 1;185(5):2968–2979. PubMed PMID: 20656927; PubMed Central PMCID: PMC2929480.
- Repetto G, Del Peso A, Zurita JL. Neutral red uptake assay for the estimation of cell viability/cytotoxicity. Nat Protoc. 2008;3(7):1125–1131. PubMed PMID: 18600217.
- Hualin C, Wenli X, Dapeng L, et al. The anti-inflammatory mechanism of heme oxygenase-1 induced by hemin in primary rat alveolar macrophages. Inflammation. 2012 Jun;35(3):1087–1093. PubMed PMID: 22160840.
- Hercus TR, Thomas D, Guthridge MA, et al. The granulocyte-macrophage colony-stimulating factor receptor: linking its structure to cell signaling and its role in disease. Blood. 2009 Aug 13;114(7):1289–1298. PubMed PMID: 19436055; PubMed Central PMCID: PMC2727416.
- Colunga A, Bollino D, Schech A, et al. Calpain-dependent clearance of the autophagy protein p62/SQSTM1 is a contributor to DeltaPK oncolytic activity in melanoma. Gene Ther. 2014 Apr;21(4):371–378. PubMed PMID: 24553345; PubMed Central PMCID: PMC3975656.
- Klionsky DJ, Abdelmohsen K, Abe A, et al. Guidelines for the use and interpretation of assays for monitoring autophagy ( (3rd edition)). Autophagy. 2016;12(1):1–222. PubMed PMID: 26799652; PubMed Central PMCID: PMC4835977.
- Pasquier B. SAR405, a PIK3C3/Vps34 inhibitor that prevents autophagy and synergizes with MTOR inhibition in tumor cells. Autophagy. 2015 Apr 3;11(4):725–726. PubMed PMID: 25905679; PubMed Central PMCID: PMC4502822.
- Xu S, Tao J, Yang L, et al. E2F1 suppresses oxidative metabolism and endothelial differentiation of bone marrow progenitor cells. Circ Res. 2018 Jan 22;122:701–711. PubMed PMID: 29358228.
- Villani LA, Smith BK, Marcinko K, et al. The diabetes medication canagliflozin reduces cancer cell proliferation by inhibiting mitochondrial complex-I supported respiration. Mol Metab. 2016 Oct;5(10):1048–1056. PubMed PMID: 27689018; PubMed Central PMCID: PMC5034684.
- Demoss RD, Happel ME. 2-Desoxy-D-glucose metabolism in Leuconostoc mesenteroides. J Bacteriol. 1955 Jul;70(1):104–109. PubMed PMID: 13242534; PubMed Central PMCID: PMC357640.
- Woodward GE, Hudson MT. The effect of 2-desoxy-D-glucose on glycolysis and respiration of tumor and normal tissues. Cancer Res. 1954 Sep;14(8):599–605. PubMed PMID: 13199805.
- Suganuma K, Miwa H, Imai N, et al. Energy metabolism of leukemia cells: glycolysis versus oxidative phosphorylation. Leuk Lymphoma. 2010 Nov;51(11):2112–2119. PubMed PMID: 20860495.
- Benavides GA, Liang Q, Dodson M, et al. Inhibition of autophagy and glycolysis by nitric oxide during hypoxia-reoxygenation impairs cellular bioenergetics and promotes cell death in primary neurons. Free Radic Biol Med. 2013 Dec;65:1215–1228. PubMed PMID: 24056030; PubMed Central PMCID: PMC3859859.
- Sin J, Andres AM, Taylor DJ, et al. Mitophagy is required for mitochondrial biogenesis and myogenic differentiation of C2C12 myoblasts. Autophagy. 2016;12(2):369–380. PubMed PMID: 26566717; PubMed Central PMCID: PMC4836019.
- Rozman S, Yousefi S, Oberson K, et al. The generation of neutrophils in the bone marrow is controlled by autophagy. Cell Death Differ. 2015 Mar;22(3):445–456. PubMed PMID: 25323583; PubMed Central PMCID: PMC4326574.
- Lehman JA, Calvo V, Gomez-Cambronero J. Mechanism of ribosomal p70S6 kinase activation by granulocyte macrophage colony-stimulating factor in neutrophils: cooperation of a MEK-related, THR421/SER424 kinase and a rapamycin-sensitive, m-TOR-related THR389 kinase. J Biol Chem. 2003 Jul 25;278(30):28130–28138. PubMed PMID: 12740386.
- Peng H, Kasada A, Ueno M, et al. Distinct roles of Rheb and raptor in activating mTOR complex 1 for the self-renewal of hematopoietic stem cells. Biochem Biophys Res Commun. 2018 Jan 1;495(1):1129–1135. PubMed PMID: 29175333.
- Luo Y, Li L, Zou P, et al. Rapamycin enhances long-term hematopoietic reconstitution of ex vivo expanded mouse hematopoietic stem cells by inhibiting senescence. Transplantation. 2014 Jan 15;97(1):20–29. PubMed PMID: 24092377; PubMed Central PMCID: PMC3877183.
- Hay N, Sonenberg N. Upstream and downstream of mTOR. Genes Dev. 2004 Aug 15;18(16):1926–1945. PubMed PMID: 15314020.
- Dorrello NV, Peschiaroli A, Guardavaccaro D, et al. S6K1- and betaTRCP-mediated degradation of PDCD4 promotes protein translation and cell growth. Science. 2006 Oct 20;314(5798):467–471. PubMed PMID: 17053147.
- Stranks AJ, Hansen AL, Panse I, et al. Autophagy controls acquisition of aging features in macrophages. J Innate Immun. 2015;7(4):375–391. PubMed PMID: 25764971; PubMed Central PMCID: PMC4386145.
- Riffelmacher T, Clarke A, Richter FC, et al. Autophagy-dependent generation of free fatty acids is critical for normal neutrophil differentiation. Immunity. 2017 Sep 19;47(3):466–480 e5. PubMed PMID: 28916263; PubMed Central PMCID: PMC5610174.
- Agarwal S, Tiwari SK, Seth B, et al. Activation of autophagic flux against xenoestrogen bisphenol-A-induced hippocampal neurodegeneration via AMP kinase (AMPK)/mammalian target of rapamycin (mTOR) pathways. J Biol Chem. 2015 Aug 21;290(34):21163–21184. PubMed PMID: 26139607; PubMed Central PMCID: PMC4543672.
- Ebrahimi-Fakhari D, Saffari A, Wahlster L, et al. Using tuberous sclerosis complex to understand the impact of MTORC1 signaling on mitochondrial dynamics and mitophagy in neurons. Autophagy. 2017 Apr 3;13(4):754–756. PubMed PMID: 28121223; PubMed Central PMCID: PMC5388227.
- Wang GG, Calvo KR, Pasillas MP, et al. Quantitative production of macrophages or neutrophils ex vivo using conditional Hoxb8. Nat Methods. 2006 Apr;3(4):287–293. PubMed PMID: 16554834.
- Karni R, Hippo Y, Lowe SW, et al. The splicing-factor oncoprotein SF2/ASF activates mTORC1. Proc Natl Acad Sci U S A. 2008 Oct 07;105(40):15323–15327. PubMed PMID: 18832178; PubMed Central PMCID: PMC2563124.
- Li D, Zhou J, Wang L, et al. Integrated biochemical and mechanical signals regulate multifaceted human embryonic stem cell functions. J Cell Biol. 2010 Nov 01;191(3):631–644. PubMed PMID: 20974810; PubMed Central PMCID: PMC3003326.