
ABSTRACT
Cell-based therapies represent a very promising strategy to repair and regenerate the injured heart to prevent progression to heart failure. To date, these therapies have had limited success due to a lack of survival and retention of the infused cells. Therefore, it is important to increase our understanding of the biology of these cells and utilize this information to enhance their survival and function in the injured heart. Mitochondria are critical for progenitor cell function and survival. Here, we demonstrate the importance of mitochondrial autophagy, or mitophagy, in the differentiation process in adult cardiac progenitor cells (CPCs). We found that mitophagy was rapidly induced upon initiation of differentiation in CPCs. We also found that mitophagy was mediated by mitophagy receptors, rather than the PINK1-PRKN/PARKIN pathway. Mitophagy mediated by BNIP3L/NIX and FUNDC1 was not involved in regulating progenitor cell fate determination, mitochondrial biogenesis, or reprogramming. Instead, mitophagy facilitated the CPCs to undergo proper mitochondrial network reorganization during differentiation. Abrogating BNIP3L- and FUNDC1-mediated mitophagy during differentiation led to sustained mitochondrial fission and formation of donut-shaped impaired mitochondria. It also resulted in increased susceptibility to cell death and failure to survive the infarcted heart. Finally, aging is associated with accumulation of mitochondrial DNA (mtDNA) damage in cells and we found that acquiring mtDNA mutations selectively disrupted the differentiation-activated mitophagy program in CPCs. These findings demonstrate the importance of BNIP3L- and FUNDC1-mediated mitophagy as a critical regulator of mitochondrial network formation during differentiation, as well as the consequences of accumulating mtDNA mutations.
Abbreviations: Baf: bafilomycin A1; BCL2L13: BCL2 like 13; BNIP3: BCL2 interacting protein 3; BNIP3L: BCL2 interacting protein 3 like; CPCs: cardiac progenitor cells; DM: differentiation media; DNM1L: dynamin 1 like; EPCs: endothelial progenitor cells; FCCP: carbonyl cyanide-4-(trifluoromethoxy)phenylhydrazone; FUNDC1: FUN14 domain containing 1; HSCs: hematopoietic stem cells; MAP1LC3B/LC3: microtubule-associated protein 1 light chain 3 beta; MFN1/2: mitofusin 1/2; MSCs: mesenchymal stem cells; mtDNA: mitochondrial DNA; OXPHOS: oxidative phosphorylation; PPARGC1A: PPARG coactivator 1 alpha; PHB2: prohibitin 2; POLG: DNA polymerase gamma, catalytic subunit; SQSTM1: sequestosome 1; TEM: transmission electron microscopy; TMRM: tetramethylrhodamine methyl ester
Introduction
Heart disease remains the primary cause of mortality and morbidity worldwide and there is a need to develop new and more effective treatments [Citation1]. Cell-based therapies represent a very promising strategy to repair and regenerate the injured heart which will prevent progression to heart failure. Numerous studies have demonstrated the beneficial effects of transplanting various stem cells into the heart [Citation2]. The beneficial effects on the heart have been reported to be due to differentiation of the transplanted cells into different cardiac cells [Citation3–Citation5] as well as their secretion of protective paracrine factors [Citation6]. Currently, cell based therapies suffer from limitations such as a failure of the cells to integrate into the myocardium and lack of survival and retention of the infused cells [Citation7–Citation9]. In fact, almost all infused cells are absent within a few days of transplantation, making them ineffective as a therapy for chronic heart diseases. To overcome some of these obstacles, it is necessary to increase our understanding of the biology of these cells and utilize this information to enhance their retention, survival and function in the unfavorable environment of the injured heart.
Endogenous adult progenitor cells are relatively rare and exist in niches in various tissues where they maintain a primarily glycolytic and quiescent state. As a result, mitochondria in a progenitor cell are sparse compared to a mature cell [Citation10,Citation11]. Upon activation, the cells undergo a bioenergetic switch from glycolysis to mitochondrial oxidative phosphorylation (OXPHOS) that is accompanied by activation of mitochondrial biogenesis and expansion of the mitochondrial network [Citation10–Citation13]. Studies have demonstrated that defects in mitochondria impair stem cell function and differentiation [Citation10,Citation14–Citation16], confirming the critical role of mitochondria in these cells. However, the molecular mechanisms underlying the mitochondrial reorganization and reprogramming are still unclear.
Autophagy is a lysosomal-dependent degradation pathway that is involved in eliminating unwanted or damaged cellular components, such as proteins and organelles [Citation17]. Autophagosomes degrade mitochondria in a process known as mitophagy [Citation18]. Given the long durability of stem cells in tissues, it is not surprising that autophagy plays a critical role in maintaining stem cell homeostasis. Ho et al. [Citation19] recently uncovered that mitophagy plays an important role in maintaining the stemness of hematopoietic stem cells (HSCs) by suppressing oxidative metabolism and removing actively respiring mitochondria [Citation19]. Although a few studies have also observed activation of macroautophagy/autophagy during differentiation of various cells [Citation20–Citation22], little is still known of how autophagy contributes to the stem cell commitment and differentiation processes. It is possible that autophagic degradation of immature and unwanted cellular components allows for remodelling and structural changes in the differentiating cell. For instance, recent evidence indicates that mitophagy is involved in eliminating immature mitochondria prior to the establishment of a new network of mature, actively respiring mitochondria [Citation22,Citation23]. Conversely, reprogramming of fibroblasts into induced pluripotent stem (iPS) cells requires a metabolic switch from mitochondrial oxidative phosphorylation to glycolysis and involves the removal of mature mitochondria by autophagosomes [Citation24–Citation26].
An orchestrated series of events are involved in stem cell activation and fate determination. Although it is known that mitochondria are important during differentiation, the molecular mechanisms linking mitochondria to the regulation of differentiation are still very poorly understood. Here, we have shown that mitochondrial clearance by mitophagy receptors is activated in CPCs during differentiation. Our findings demonstrate that both BNIP3L (BCL2 interacting protein 3 like) and FUNDC1 (FUN14 domain containing 1) were significantly upregulated during differentiation in CPCs and were required for formation of a functional interconnected mitochondrial network. Disrupting BNIP3L- and FUNDC1-mediated mitophagy led to mitochondrial fission with formation of donut-shaped mitochondria, a greater susceptibility to oxidative stress-mediated cell death, and reduced CPC retention in vivo. Thus, our studies highlight the critical role of mitophagy in the formation of a functional mature mitochondrial network upon differentiation of progenitor cells.
Results
Autophagy and mitophagy are activated in differentiating CPCs
Autophagy is a key regulator of intracellular degradation [Citation27] and has been reported to be increased during differentiation of cells. To determine whether autophagy was increased in CPCs following incubation in differentiation media (DM), we assessed the levels of LC3-II (microtubule-associated protein 1 light chain 3 beta) by western blotting. LC3-II is present on the autophagosome and the level of LC3-II reflects the number of autophagosomes in the cell [Citation28]. We found that the CPCs had low levels of LC3-II under baseline (D0) conditions but that LC3-II levels increased upon incubation in DM (). An increase in LC3-II could reflect either increased autophagosome formation due to enhanced autophagic activity, or an accumulation of autophagosomes due to reduced activity or impairment in the downstream degradation pathway. The vacuolar-type H+-ATPase inhibitor bafilomycin A1 (Baf) causes accumulation of autophagosomes due to impaired fusion between autophagosomes and lysosomes and can be used to monitor autophagic activity [Citation29]. We found that the presence of Baf led to a further increase in LC3-II levels at day 4 (), confirming increased autophagic activity in the CPCs. We also found that incubation of CPCs in DM led to a significant increase in BECN1 (beclin 1), a positive regulator of autophagy [Citation30], and a significant decrease in the autophagy substrate SQSTM1 (sequestosome 1) [Citation31] (). These findings demonstrate that autophagy was activated during differentiation.
Figure 1. POLG CPCs have reduced mitophagy upon induction of differentiation. (a) Representative western blots of LC3-II and ACTA1 in WT and POLG CPCs after incubation in differentiation medium (DM). To assess flux, cells were incubated with 50 nM bafilomycin A1 (Baf) for 4 h before harvesting cells. (b) Quantification of LC3-II:ACTA1 in WT CPCs and POLG CPCs (n = 3). (c) Quantification of LC3-II:ACTA1 ± Baf in WT and POLG CPCs (n = 3). (d) Representative western blots of BECN1 and SQSTM1 in WT and POLG CPCs. Cells were incubated in DM for 7 d. (e) Quantitation of BECN1:ACTA1 and SQSTM1:ACTA1 in WT and POLG CPCs (n = 3). (f) Representative fluorescent images of WT and POLG CPCs overexpressing GFP-LC3. Quantitation of GFP-LC3 and TOMM20 colocalization in WT and POLG CPCs (n = 3). Cells were incubated in DM for the indicated time, fixed, and stained with anti-TOMM20 to label mitochondria. Scale bar: 20 μm. (g) Representative fluorescent images of WT and POLG CPCs overexpressing COX8-EGFP-mCherry at D0 and D3. Quantification of acidic (red-only) mitochondria in WT and POLG CPCs (n = 3). Data are mean ± SEM. *p < 0.05; **p < 0.01; ***p < 0.001; ****p < 0.0001; n.s., not significant.
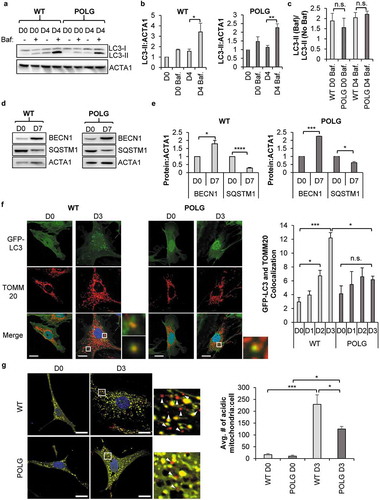
Mice with a defective proofreading mitochondrial POLG/DNA polymerase γ, polgD257A/D257A, experience premature aging and develop accelerated age-related cardiomyopathy due to accumulation of mtDNA mutations [Citation32]. We have previously reported that CPCs isolated from young POLG mice have impaired mitochondrial function and differentiation [Citation10]. Here, we investigated whether autophagic activity in POLG CPCs was altered by the mutated POLG. We found that autophagy was increased in POLG CPCs upon incubation in DM and that the presence of Baf resulted in a further increase in LC3-II levels at day 4 in POLG CPCs (). Finally, we compared the rate of autophagic degradation (i.e., the ratio of LC3-II+Baf:LC3-II-Baf) in WT and POLG CPCs but we observed no significant differences (). This suggests that the rate of autophagic activity was at a steady state both at baseline and during differentiation in WT and POLG CPCs.
Next, we examined whether mitophagy was activated during differentiation. First, we assessed the level of co-localization between GFP-LC3 positive autophagosomes and TOMM20 (translocase of outer mitochondrial membrane 20)-labeled mitochondria in WT and POLG CPCs. We found that WT CPCs exhibited a significantly higher number of GFP-LC3-positive autophagosomes that co-localized with TOMM20-labeled mitochondria after just two days of incubation in DM (). In contrast, we observed little colocalization between autophagosomes and mitochondria in POLG CPCs after incubation in DM (). To further confirm these findings, we utilized the Cox8-EGFP-mCherry fluorescence reporter that is targeted to the mitochondrial matrix [Citation33]. Normal mitochondria are yellow due to simultaneous green and red fluorescence, while mitochondria in the acidic environment of a lysosome are red due to quenched EGFP fluorescence [Citation33]. Thus, the number of red-only mitochondria are indicative of mitophagy. We found that the number of red-only mitochondria per cell was low at baseline but increased significantly in WT CPCs after just 3 d in DM (). Although the number of red-only mitochondria in POLG CPCs was also increased after 3 d in DM, it was significantly lower compared to WT CPCs (). Overall, these findings indicate that mitophagy was activated in WT CPCs during differentiation and that CPCs with mtDNA mutations were unable to efficiently activate the mitophagy machinery in response to differentiation.
Mitophagy machinery is functional in POLG CPCs
Mitophagy can be mediated via the PINK1-PRKN pathway or by mitophagy receptors residing in the outer mitochondrial membrane [Citation18]. To determine the mechanism responsible for mitophagy in the CPCs, we first examined the role of PRKN (parkin RBR E3 ubiquitin protein ligase), which is known for its role in mediating the clearance of depolarized mitochondria [Citation34]. Treatment of cells with mitochondrial uncouplers such as FCCP leads to activation of PRKN-mediated mitophagy [Citation35]. We found that exposure to FCCP led to a robust increase in autophagy in both WT and POLG CPCs, as assessed by western blotting for LC3-II (). Next, we measured changes in mitochondrial content in response to FCCP treatment in WT and POLG CPCs by western blotting for the mitochondrial protein TIMM23 (translocase of inner mitochondrial membrane 23) and found that mitochondrial clearance occurred in both cell types (). Additionally, overexpression of PRKN had no effect on the induction of autophagy or the clearance of mitochondria in response to FCCP exposure in WT and POLG CPCs. Thus, these data demonstrate that the autophagic degradation pathway was functional in the POLG CPCs and that the cells retained the capability to clear depolarized mitochondria.
Figure 2. Mitophagy of depolarized mitochondria is functional in POLG CPCs. Cells were infected with β-Gal or mCherry-PRKN prior to treatment with 25 μM FCCP for 24 h. (a) Representative western blots of LC3-II and GAPDH in WT and POLG CPCs. (b) Quantification of LC3-II:GAPDH in WT (n = 4) and POLG CPCs (n = 3). (c) Representative western blots of the mitochondrial protein TIMM23 and GAPDH in WT and POLG CPCs. (d) Quantitation of TIMM23:GAPDH in WT (n = 4) and POLG CPCs (n = 3). Data are mean ± SEM. *p < 0.05; **p < 0.01; ****p < 0.0001.
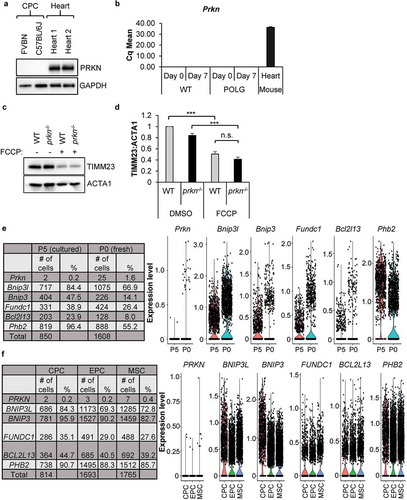
To identify the pathway involved in mediating the mitochondrial clearance, we further examined the role of PRKN in mediating mitophagy in the CPCs. Surprisingly, PRKN protein was undetectable in CPCs isolated from two different mouse strains (). At the transcript level, Prkn mRNA was also undetectable in WT and POLG CPCs both before and after 7 d of differentiation (). To further investigate the presence of a PRKN-independent mitophagy pathway in CPCs, we examined mitophagy in CPCs isolated from prkn−/- hearts [Citation36]. We found that FCCP-mediated mitochondrial clearance occurred to a similar extent in WT and prkn−/- CPCs (). We also confirmed activation of mitophagy by immunofluorescence in prkn−/- CPCs after FCCP treatment (Figure S1(a-b)) or incubation in DM (Figure S1(c-d)) and we found no differences in the levels of mitophagy in WT and prkn−/- CPCs under either condition. Finally, we confirmed the lack of PRKN expression in CPCs by single cell RNA sequencing. Prkn transcripts were only detectable in 1.6% of freshly isolated mouse CPCs (P0) and in 0.2% of cultured CPCs (P5) (). Instead, we discovered that the CPCs contain transcripts for various mitophagy receptors including Bnip3l, Bnip3 (BCL2 interacting protein 3), Fundc1, Phb2 (prohibitin 2), and Bcl2l13 (BCL2 like 13). We also analyzed transcripts of the various mitophagy proteins in three different cardiac stem cell populations: cardiac progenitor cells (CPCs), endothelial progenitor cells (EPCs), and mesenchymal stem cells (MSCs), isolated from human heart samples [Citation37]. We found that while all the mitophagy receptors were expressed in hCPCs, hEPCs and hMSCs, PRKN transcripts were only detectable in 0.2–0.4% of the cells in all three different stem cell populations (). These results indicate that a PRKN-independent mechanism of mitophagy exists in progenitor cells. It also suggests that a defect exists in the upstream pathway in POLG CPCs that signals to the cells to induce mitophagy during differentiation.
Figure 3. PRKN is not required for mitophagy in CPCs. (a) Representative western blots of PRKN and GAPDH in mouse CPCs and adult hearts. (b) Real-time PCR analysis of Prkn transcript levels in CPCs and heart tissue (n = 3). (c) Representative western blots of TIMM23 and ACTA1 in WT and prkn−/- CPCs after treatment with 25 μM FCCP for 24 h. (d) Quantification of TIMM23:ACTA1 in WT and prkn−/- CPCs (n = 3). (e) The number and percentage of cells with mRNA detected by single-cell RNA sequencing for Prkn and mitophagy genes in mouse CPCs at passage 0 (fresh) or passage 5 (cultured). Violin plots display gene expression of mitophagy genes in mouse CPCs. (f) The number and percentage of cells with mRNA detected by single-cell RNA sequencing for PRKN and mitophagy receptors in human CPCs at passage 5 (cultured). Violin plots display gene expression of mitophagy genes in human CPCs. Data are mean ± SEM. ***p < 0.001; n.s., not significant.
Mitophagy receptors induce mitochondrial clearance in CPCs during differentiation
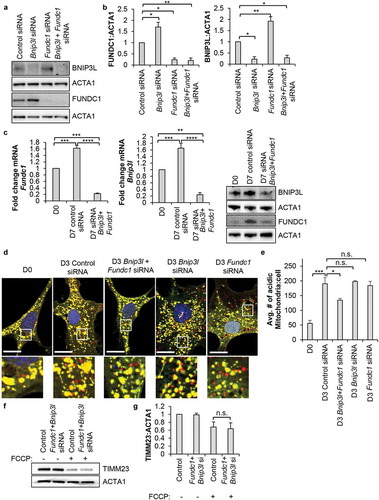
To investigate the mechanism of mitophagy during differentiation, we examined the transcript and protein levels of mitophagy receptors FUNDC1, BNIP3L and BNIP3 in WT and POLG CPCs. We discovered significant increases in Fundc1 and Bnip3l transcript levels after 4 and 7 d of incubation in DM in WT CPCs, respectively (). Transcript levels of Bnip3, Bcl2l13 and Phb2 were not increased in WT CPCs upon incubation in DM ( and S2). We confirmed that FUNDC1 and BNIP3L protein levels were both significantly increased after 7 d of incubation in DM (). Protein levels of BNIP3 were undetectable in WT CPCs by western blotting. In contrast, the POLG CPCs had a significant decrease in mRNA levels of Fundc1, Bnip3l, and Bnip3 after 4 d of differentiation (). At the protein level, BNIP3L was reduced while FUNDC1 was increased upon incubation in DM, but neither trend was significant (). The fact that the decrease in Fundc1 transcript levels during differentiation did not correlate with changes in protein levels () suggested that an additional level of gene expression regulation exists in the POLG CPCs. It is possible that the Fundc1 transcripts could be targeted by RNA binding proteins. They are known to regulate translation [Citation38] and could potentially function to increase translation of FUNDC1.
Figure 4. Mitophagy receptors are upregulated in WT CPCs upon differentiation. Real-time PCR analysis of mitophagy receptors (a) Fundc1, (b) Bnip3l and (c) Bnip3 transcript levels in WT and POLG CPCs at baseline and after incubation in DM (n = 4). (d) Representative western blots and quantification of FUNDC1:ACTA1 in WT and POLG CPCs (n = 4). (e) Representative western blots and quantification of BNIP3L:ACTA1 in WT and POLG CPCs (n = 4). Data are mean ± SEM. *p < 0.05; **p < 0.01; ***p < 0.001; n.s., not significant.
We also examined whether overexpression of BNIP3L or FUNDC1 in POLG CPCs would restore mitophagy during differentiation. Interestingly, we found that overexpression of BNIP3L alone, but not FUNDC1, increased mitophagy in POLG CPCs at D0 (Figure S3(b,c)). We also noted that BNIP3L, but not FUNDC1, induced formation of GFP-LC3-positive autophagosomes at D0, indicating that FUNDC1 does not function as a direct activator of autophagy. However, overexpression of either BNIP3L or FUNDC1 increased mitophagy after 3 d of differentiation (Figure S3(d,e)). Overall, these data suggest that the impairment of mitophagy in the POLG CPCs during differentiation could be attributed to an inability to upregulate the mitophagy receptors.
Knockdown of Bnip3l and Fundc1 leads to reduced mitophagy during differentiation
To determine the functional role of mitophagy during differentiation, we used siRNA to knockdown Bnip3l and Fundc1 in WT CPCs. We noted that knockdown of Bnip3l led to a compensatory increase in FUNDC1 and vice versa (). In contrast, knockdown of Bnip3 did not increase Bnip3l and Fundc1 transcript levels or affect induction of mitophagy after 3 d of incubation in DM (Figure S4(b-c)). Therefore, we decided to perform our experiments in cells with simultaneous knockdown of Bnip3l and Fundc1. We confirmed that transfecting cells with siRNA against Bnip3l and Fundc1 led to efficient knockdown at both the transcript and protein levels (). While knockdown of either Bnip3l and Fundc1 alone did not affect induction of mitophagy, knockdown of Bnip3l plus Fundc1 impaired mitophagy in WT CPCs, as the number of red-only mitochondria was significantly reduced after 3 d of incubation in DM (). Our earlier experiments indicate that mitophagy of depolarized mitochondria occurs via a PRKN-independent mechanism. To examine if BNIP3L and FUNDC1 played a role in mediating mitophagy of depolarized mitochondria, we assessed whether FCCP-induced mitophagy was reduced in CPCs after Bnip3l and Fundc1 knockdown. However, we found that FCCP induced mitophagy to similar extent in both control and Bnip3l and Fundc1 knockdown CPCs (). These data demonstrate that BNIP3L and FUNDC1 served an important function in mediating mitophagy during differentiation in CPCs, and that an alternative mitophagy pathway independent of BNIP3L, FUNDC1 and PRKN was involved in clearing depolarized mitochondria.
Figure 5. Knockdown of Bnip3l and Fundc1 decreases mitophagy in WT CPCs. (a) Representative western blots of BNIP3L and FUNDC1 protein levels after Bnip3l or Fundc1 siRNA co-transfection. FUNDC1 protein increased upon Bnip3l knockdown, while BNIP3L protein increased upon Fundc1 knockdown. (b) Quantification of BNIP3L and FUNDC1 protein levels after siRNA knockdown (n = 3). (c) Real-time PCR analysis of Bnip3l and Fundc1 transcript levels (n = 3). Representative western blots of BNIP3L and FUNDC1 after Bnip3l+Fundc1 knockdown (n = 4). (d) Representative fluorescence images of CPCs overexpressing COX8-EGFP-mCherry. Cells were transfected with siRNA against Bnip3l, Fundc1, or Bnip3l+Fundc1, and incubated in DM for 3 d. Scale bar: 20 μm. (e) Quantification of acidic (red-only) mitochondria in CPCs (n = 3). (f) Representative western blots of TIMM23 after siRNA knockdown of Bnip3l+Fundc1 and treatment with 25 µM FCCP for 24 h. (g) Quantification of TIMM23:ACTA1 in CPCs (n = 3). Data are mean ± SEM; *p < 0.05; **p < 0.01; ***p < 0.001; ****p < 0.0001; n.s., not significant.
Mitophagy is dispensable for lineage commitment and mitochondrial biogenesis in CPCs
Next, we examined the functional role of differentiation-induced mitophagy in CPCs. We investigated whether BNIP3L- and FUNDC1-mediated mitophagy was involved in regulating lineage commitment of WT CPCs. We found that knockdown of Bnip3l and Fundc1 did not affect the upregulation of lineage markers such as Gata4, Gata6, and Mef2c (). Moreover, it has previously been reported that mitophagy is required before mitochondrial biogenesis can be activated in differentiating C2C12 myoblasts [Citation22]. Because we previously observed rapid activation of mitochondrial biogenesis in CPCs upon differentiation [Citation10,Citation39], we examined whether mitochondrial biogenesis was altered in CPCs with Bnip3l and Fundc1 knockdown. PPARGC1A (PPARG coactivator 1 alpha), a member of the PPARG co-activator (PGC) family of transcriptional co-activators, was significantly induced in CPCs at the transcript level after incubation in DM, and Bnip3l and Fundc1 knockdown had no effect on Ppargc1a induction (). We also compared mitochondrial OXPHOS protein levels between normal CPCs and CPCs with Bnip3l and Fundc1 knockdown and found that incubation of the CPCs in DM still resulted in increased expression of various OXPHOS proteins under both conditions (). Additionally, the mechanism through which CPCs provide therapeutic benefit to the heart has recently been linked to its secretion of paracrine factors [Citation40]. Therefore, we assessed transcript levels of three different key paracrine factors after 3 d of incubation in DM but observed no effect on the induction of Ccl2, Il6, or Wnt5a during differentiation in cells with Bnip3l and Fundc1 knockdown (). To further investigate the potential differences in secreted factors, we performed an endothelial tube formation assay with conditioned DM from control and Bnip3l and Fundc1 knockdown CPCs undergoing differentiation. We found that DM from CPCs with Bnip3l and Fundc1 knockdown resulted in significantly less tube formation than DM from control CPCs (). Taken together, these data indicate that activation of mitophagy during differentiation was independent of lineage commitment, activation of mitochondrial biogenesis, and induction of select paracrine factors. However, it was required for the production and/or release of functional factors involved in promoting angiogenesis in vitro.
Figure 6. Mitophagy is dispensable for lineage commitment and mitochondrial biogenesis in CPCs. (a) Real-time PCR analysis of Gata4, Gata6, and Mef2c transcripts in CPCs (n = 4). (b) Real-time PCR analysis of Ppargc1a transcript levels in CPCs (n = 4). (c) Representative western blots of mitochondrial OXPHOS subunit proteins ATP5F1A, UQCRC2, MT-CO1, and SDHB in CPCs. (d) Quantitation of mitochondrial OXPHOS subunit protein levels (n = 4). (e) Real-time PCR analysis of secretome-related Ccl2, Il6, and Wnt5a transcripts (n = 3). (f) Representative images and quantitation of endothelial tube formation (complete circles) after incubation in conditioned CPC media for 14 h (n = 3). Data are mean ± SEM. *p < 0.05; **p < 0.01; ***p < 0.001; ****p < 0.0001; n.s., not significant.
Knockdown of mitophagy receptors disrupts formation of the mitochondrial network and accumulation of dysfunctional mitochondria during differentiation
We have previously found that the early stages of commitment in CPCs involves substantial expansion and remodeling of the mitochondrial network [Citation10]. To investigate the relationship between mitophagy and mitochondrial network formation, we examined mitochondrial morphology in CPCs during differentiation by immunofluorescence. We confirmed that incubation in DM for 7 d led to formation of an extensive interconnected mitochondrial network in CPCs (). In contrast, in CPCs with Bnip3l and Fundc1 knockdown, mitochondria adapted a fragmented spherical morphology and failed to form a connected network of elongated mitochondria upon incubation in DM. Interestingly, knockdown of Fundc1 alone, but not Bnip3l, also led to fragmentation of the mitochondrial network in CPCs at D7 (Figure S5(a-b)). Although knockdown of Fundc1 caused mitochondrial fragmentation at both D0 and D7, we did not observe a change in mitochondrial membrane potential, indicating that mitochondrial function was unaffected (Figure S5(c-d)). The fragmented mitochondrial morphology in CPCs with Bnip3l and Fundc1 knockdown was also confirmed via transmission electron microscopy (TEM) (). Unexpectedly, the TEM revealed a striking alteration in mitochondrial structure where many of the mitochondria displayed a donut-shaped morphology with electron dense material in the lumen (). Although knockdown of Bnip3l and Fundc1 induced a moderate, but significant, increase in mitochondrial fragmentation at baseline (), the TEM showed that the mitochondria did not adopt the donut morphology at this time point (Figure S6(c)). Thus, the alteration in mitochondrial structure was only evident during differentiation with Bnip3l and Fundc1 knockdown.
Figure 7. Knockdown of mitophagy receptors leads to formation of a fragmented mitochondrial network. (a) Representative fluorescence images of mitochondrial network in CPCs before and after incubation in DM. Scale bar: 20 μm. (b) Quantification of CPCs with fragmented mitochondria (n = 3). (c) Representative electron microscopy images of mitochondria in CPCs before and after incubation in DM. Arrows point to donut-shaped mitochondria. Scale bar: 2 μm. (d) Representative western blots of DNM1L, MFN1 and MFN2. (e) Quantification of DNM1L (n = 5), MFN1 (n = 3) and MFN2 (n = 3) protein levels. (f) Representative western blots of p-DNM1L (Ser 616) and DNM1L. (g) Quantification of p-DNM1L (n = 3) and DNM1L (n = 3) protein levels. Data are mean ± SEM. *p < 0.05; **p < 0.01; ***p < 0.001; n.s. not significant.
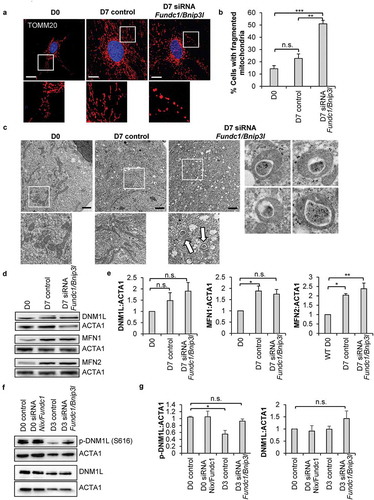
Because mitochondrial dynamics play a critical role in the differentiation process of various stem cells [Citation11,Citation41,Citation42], we next examined expression of proteins involved in regulating mitochondrial morphology in CPCs. DNM1L/DRP1 (dynamin 1 like) is involved in mitochondria fission and was not significantly changed in control CPCs and Bnip3l and Fundc1 knockdown CPCs after 7 d of incubation in DM ()). In contrast, MFN1 (mitofusin 1) and MFN2, regulators of mitochondrial fusion, were significantly increased in both control CPCs and Bnip3l and Fundc1 knockdown CPCs after incubation in DM. Interestingly, knockdown of Fundc1 alone, but not Bnip3l, significantly increased DNM1L protein levels after incubation in DM (Figure S6(d)). Knockdown of either Fundc1 or Bnip3l had no effect on MFN1/2 protein levels (Figure S6(d)). Phosphorylation of DNM1L at Ser616 leads to activation of mitochondrial fission [Citation43,Citation44]. We found that after 3 d of differentiation, phosphorylation of DNM1L at Ser616 significantly decreased in control CPCs, while knockdown of Bnip3l and Fundc1 abrogated the dephosphorylation of DNM1L (). Taken together, these data suggest that abrogation of BNIP3L- and FUNDC1-mediated mitophagy led to sustained DNM1L activation and mitochondrial fission during differentiation.
Abnormal mitochondrial morphology and distribution in cells are indicators of defective mitochondrial function. Therefore, we examined the functional consequences of abrogating mitophagy during differentiation in CPCs. We found that CPCs with Bnip3l and Fundc1 knockdown had significantly reduced mitochondrial membrane potential compared to control CPCs after seven days in DM as assessed by TMRM staining (). Utilizing the Seahorse Extracellular Flux analyzer, we confirmed that maximal oxygen consumption rate was significantly decreased in CPCs upon Bnip3l and Fundc1 knockdown compared to control CPCs ().
Figure 8. Knockdown of mitophagy receptors leads to reduced mitochondrial function and increased susceptibility to cell death. (a) Representative images of TMRM fluorescence in CPCs. Scale bar: 20 μm. (b) Quantification of TMRM fluorescence (n = 3). (c) Mitochondrial respiration in CPCs at D7. Oxygen consumption rate (OCR) was normalized to cell number (n = 4). (d) Quantification of cell death in differentiating CPCs (D7). Cells were treated with 200 μM H2O2 for 8 h in serum-free DM in the presence or absence of 10 μM Mdivi-1 (n = 3). (e) Representative scans of mouse hearts for retention of GFP-positive CPCs. Hearts from animals injected with either control CPCs or Bnip3l and Fundc1 knockdown CPCs were immunostained with GFP to detect surviving CPCs at 5 d after infarction. Dil dye was utilized to track the injections through the heart. GFP-positive control CPCs were detected in the border zone of infarcted hearts (n = 2), while GFP-positive Bnip3l and Fundc1 knockdown CPCs were not present in the infarcted hearts (n = 5). Scale bar: 1 mm and 10 μm, respectively. Data are mean ± SEM. *p < 0.05; **p < 0.01; ***p < 0.001. n.s., not significant.
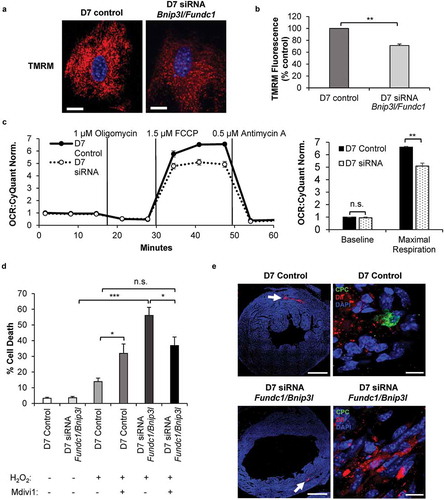
Finally, we examined whether abrogation of mitophagy altered susceptibility to cellular stress in vitro and in vivo. We found that CPCs were remarkably resistant to H2O2 exposure, but abrogating mitophagy by knockdown of Bnip3l and Fundc1 led to a significant increase in cell death, from about 15% to 55% (). The presence of Mdivi-1, an inhibitor of DNM1L-mediated mitochondrial fission and promoter of mitochondrial fusion (Figure S6), reduced H2O2-induced cell death in CPCs with knockdown of Bnip3l and Fundc1, suggesting that the increased fission observed in these cells contributes to reduced tolerance to stress. Unexpectedly, Mdivi-1 produced the opposite results in control CPCs, where treatment with Mdivi-1 significantly increased H2O2-induced cell death (). This suggests that in differentiating CPCs, mitochondrial fission is a protective response during stress. Lastly, we performed adaptive transfer experiments to determine the in vivo retention capacity of the CPCs after a myocardial infarction in mice [Citation45]. Transplanted control CPCs were present in the infarct border zone seven days post myocardial infarction as previously reported [Citation46,Citation47]. We examined sections from five different hearts injected with CPCs with Bnip3l and Fundc1 knockdown but were unable to detect any transplanted CPCs in the infarcted hearts (). Overall, these data suggest that mitophagy played an important role in the formation of a healthy mitochondrial network that allowed for increased protection against conditions of stress and survival of CPCs in vivo.
Discussion
Our study provides new, important insights into the role of mitophagy in the execution of the differentiation program. First, we demonstrated that mitophagy was induced upon initiation of differentiation in CPCs. This mitophagy was mediated by the mitophagy receptor pathway, rather than the well-known PINK1-PRKN pathway. Second, mitophagy was not involved in regulating progenitor cell fate determination or mitochondrial reprogramming, but instead facilitated the expansion and formation of a functional mitochondrial network. Finally, aging is associated with accumulation of mtDNA mutations in cells and we found that acquiring mtDNA mutations selectively disrupted the differentiation-activated mitophagy program in CPCs. Thus, our findings demonstrate the importance of mitophagy as a critical regulator of mitochondrial health and proper network formation in differentiating progenitor cells, as well as the consequences of accumulating mtDNA mutations.
Mitophagy can be mediated by two distinct signaling pathways: via PINK1/PRKN or mitophagy receptor pathways [Citation18]. Most studies to date have focused on PINK1/PRKN-mediated mitophagy and their critical role in clearing depolarized mitochondria [Citation35,Citation36,Citation48]. However, we found that PRKN did not play a role in programmed mitophagy during differentiation. Instead, two different mitophagy receptors, BNIP3L and FUNDC1, were required for mitophagy in CPCs after incubation in DM. Currently, little is understood about their transcriptional regulation and there are no published reports on potential common transcription factors that might turn on their gene expression during differentiation. However, BNIP3L and FUNDC1 levels can be regulated by microRNAs and microRNA-137 has been reported to inhibit mitophagy by targeting both Bnip3l and Fundc1 mRNA [Citation49]. Thus, it is possible that specific microRNAs bind to their mRNA and promote increased translation or degradation. Further studies are needed to identify the exact mechanism by which BNIP3L and FUNDC1 are selectively activated during differentiation. Moreover, although mitophagy receptors have not been investigated in the context of progenitor cell differentiation, BNIP3L has previously been reported to play a critical role in removing mitochondria during erythroid maturation [Citation50,Citation51] and in differentiating retinal ganglion cells [Citation52]. A role for FUNDC1 in stem cell homeostasis or differentiation has not been reported previously. However, FUNDC1 has been reported to regulate hypoxia-induced mitophagy [Citation53]. Because stem cells exist in a hypoxic environment in vivo, it is not surprising that FUNDC1 plays a role in mediating mitophagy in CPCs. It is possible that activation of mitophagy to selectively remove mitochondria during early differentiation represents a developmentally programmed step toward maturation in a hypoxic stem cell environment. Further studies are needed to examine the importance of FUNDC1 in stem cell homeostasis and development, particularly in vivo.
Our study linked activation of mitophagy to the formation of a functional interconnected mitochondrial network. Specifically, if the CPCs failed to activate mitophagy, mitochondrial fission was sustained and the cells started to accumulate less functional donut-shaped mitochondria. Additional studies are needed to determine if the structures inside the mitochondria represent vesicles formed inside the lumen and whether the electron dense material are damaged mitochondrial components. Interestingly, other studies have reported that loss of mitochondrial membrane potential can lead to formation of ring- or donut-shaped mitochondria [Citation54–Citation56]. Ding et al. found that exposure of MEFs to CCCP led to formation of spherical mitochondria with an internal lumen containing cytosolic material [Citation56].
Another key finding is the effect on mitochondrial morphology upon knockdown of Bnip3l and Fundc1. Studies have demonstrated that there is a shift in the balance towards mitochondrial fusion during differentiation which allows for the formation of an elongated network. For instance, deletion of Mfn1/2 leads to impaired differentiation of ESCs into cardiac myocytes [Citation42], while inhibiting DNM1L-mediated mitochondrial fission promotes cardiac differentiation of human iPSCs [Citation57]. Our study shows that abrogating mitophagy during differentiation led to sustained DNM1L activation in CPCs. It has previously been reported that fetal mitochondria must be removed in the neonatal hearts after birth to allow for metabolic reprogramming [Citation23]. Progenitor cells do not rely on mitochondria as their main source of energy. It is possible that CPCs contain a pool of fetal and/or weak mitochondria that must be removed upon initiation of differentiation. Thus, impaired mitophagy might lead to expansion of a less functional mitochondrial network that produces excessive reactive oxygen species, leading to sustained activation of DNM1L and fission [Citation58]. Although FUNDC1 can directly alter mitochondrial morphology, our data suggest that the disruption of mitophagy, rather than a direct regulation of mitochondrial fission by BNIP3L and FUNDC1, contributed to the mitochondrial phenotype in the CPCs during differentiation. Our data also suggest that while BNIP3L can directly induce both formation of autophagosomes and mitophagy, FUNDC1 overexpression alone did not activate these two processes in CPCs and other stimuli are needed. This is in contrast to data from Liu et al. [Citation53] who reported that overexpression of FUNDC1 in HeLa cells led to formation of autophagosomes and induction of mitophagy. It is possible that the contrasting findings could be due to the type of cells used in the study, as immortalized HeLa cells differ from primary CPCs isolated from the hearts of mutant POLG mice. Clearly, additional studies on FUNDC1’s function in stem cells are needed.
Another interesting and unexpected finding in our study was that inhibition of mitochondrial fission produced opposite effects depending on whether mitophagy was abrogated. Inhibition of fission in differentiating CPCs exposed to H2O2 led to enhanced cell death, while it was protective against H2O2-mediated cell death when BNIP3L- and FUNDC1-mediated mitophagy was silenced. This suggests that in normal differentiating CPCs, mitochondrial fission protects against increased oxidative stress. However, when mitophagy was abrogated and the cells accumulated fragmented abnormal mitochondria, shifting the balance towards fusion protected the cells against H2O2-mediated cell death. Changes in mitochondrial morphology are often an adaptive response to perturbations in the intracellular environment. Studies have reported that mitochondrial fission can be either protective or detrimental depending on the context. For instance, excessive mitochondrial fission is associated with increased cell death [Citation59] and a contributor to myocardial ischemia/reperfusion injury [Citation59]. In contrast, deletion of Dnm1l is detrimental to myocytes [Citation60,Citation61], suggesting that baseline levels of fission are important for cellular homeostasis. Also, fused mitochondria have a lower threshold for mitochondrial permeability transition pore (mPTP) opening and activation of necrosis [Citation62], and Mfn2 deficiency can delay mPTP opening in cardiac myocytes [Citation63]. Thus, whether DNM1L-mediated fission is protective or detrimental is clearly context-dependent.
Aging is associated with accumulation of mtDNA mutations in cells and we have previously reported that CPCs isolated from POLG mutant mice fail to activate mitochondrial biogenesis and commit to the cardiac lineage when incubated in DM [Citation10]. Here, we found that the POLG CPCs had functional autophagic machinery to degrade mitochondria but were defective in activating programmed mitophagy. This suggests that accumulation of mtDNA mutations impaired the signals necessary to induce mitophagy during differentiation. Another study has reported that erythrocytes from POLG mice have a defect in clearing mitochondria during erythrocyte maturation [Citation64]. However, this was due to excessive MTOR (mechanistic target of rapamycin kinase) activation resulting in suppression of autophagy. Although BNIP3L has been reported to be a critical regulator of mitophagy during erythrocyte activation [Citation50,Citation51], the authors did not examine whether BNIP3L levels were altered in these cells. The defect in mitophagy of POLG erythrocytes was not evident until after 4 months of age [Citation64]. In contrast, the POLG CPCs in our study were isolated from 2 month old mice and were already showing severe mitochondrial defects at this young age. These variations might be due to differences in cell type, age of mice, and in vivo environment where they reside (bone marrow versus heart).
In summary, we have demonstrated that mitochondrial number and morphology are modulated early on during CPC commitment and contribute to mitochondrial network remodeling to accommodate the bioenergetic need of the mature cell. However, there are still many questions that need to be answered. For instance, exactly how does differentiation signal activation of mitophagy and which mitochondria are targeted for degradation? Also, why does a failure to remove these mitochondria lead to a defect in mitochondrial network formation? For cell-based therapies to be successful, it is important to gain increased knowledge of the molecular basis for stem and progenitor cell functions and why these cells do not thrive when transplanted in vivo. This information can then be utilized to improve the design of cell-based therapies and could have great impact on the field of regenerative medicine.
Materials and methods
CPC isolation and culture
CPCs were isolated from ~2 month old homozygous polgD257A/D257A, prkn−/- [Citation65], and wild-type mice as described previously [Citation10]. CPCs were cultured in DMEM/F12 (GIBCO, 11330-032; 1:1) media containing embryonic stem cell grade FBS (GIBCO, 10439-016; 10%), leukemia inhibitory factor (MilliporeSigma, LIF2010; 1:1000), insulin transferrin selenium (Lonza, 17-838Z; 1:500), EGF/epidermal growth factor (MilliporeSigma, E9644; 1:5000), FGF2/basic fibroblast growth factor (Peprotech Inc., 100-18B; 1:5000), and antibiotic-antimycotic (GIBCO, 15240-062; 1X). To induce differentiation, CPCs were incubated in α-Minimal Essential Medium containing 10 nM dexamethasone (Alfa Aesar Chemicals, A17590) for up to 7 d [Citation10]. All experimental procedures were performed in accordance with institutional guidelines and approved by the Institutional Animal Care and Use Committee of the University of California, San Diego.
GFP-stable CPCs were generated by lentiviral infection. In short, WT CPCs were infected with 10 MOI of Lenti-PGK-EGFP (puromycin) in the presence of 8 μg/mL polybrene (MilliporeSigma, TR-1003). Cells were incubated for 48 h, after which GFP-positive cells were selected for using 10 μg/mL puromycin (MilliporeSigma, P9620). GFP-CPCs were subsequently cultured in CPC media with puromycin until a stable line was established.
Human CPCs for single cell RNA seq experiments were isolated as previously described [Citation37]. The National Institutes of Health guidelines for human subject research are consistent with Institutional Review Board exemption based on the use of tissues that are waste discards from normal and routine clinical procedures of LVAD surgery (45 CFR 46.101). Briefly, cardiac biopsies were obtained from patients undergoing LVAD implantation. The cardiac tissue was minced and digested in collagenase solution (Worthington Biochemical Corporation, LS004174; type II 225 U/mg dry weight) for 1.5–2 h at 37°C with continuous shaking. After digestion, the suspension was centrifuged at 350 g for 5 min and resuspended in human CPC media. The cells were filtered through a 100 µm filter (Corning, 352360) followed by a 40-µm filter (Corning, 352340) and centrifuged at 150 g for 2 min to eliminate cardiomyocytes. The supernatant was further centrifuged at 350 g for 5 min and resuspended in human CPC media and incubated overnight at 37°C in a CO2 incubator.
Transfections and adenoviral infections of CPCs
For identifying acidic mitochondria, CPCs were transfected with pCLBW-Cox8-EGFP-mCherry, a gift from David Chan (Addgene, 78520) [Citation33], using Fugene 6 Transfection Reagent (Promega, E2691) according to the manufacturer’s instructions. For siRNA knockdowns, CPCs were transfected with 5 nM of Bnip3l, Fundc1, and/or Bnip3 siRNA (Sigma Mm01_00038852, Mm01_00049694, and Mm01_00115985, respectively) using the HiPerfect transfection reagent according to the manufacturer’s instructions (Qiagen, 301705). CPCs were re-transfected mid-way through differentiation for 7 d experiments. CPCs were infected with adenoviruses (100 MOI) encoding β-Gal, mCherry-PRKN, or GFP-LC3 for 4 h as previously described [Citation66]. All experiments were performed 24 h after the infection.
Gene expression analysis by quantitative polymerase chain reaction
RNA was extracted from cells using the RNeasy Mini kit (Qiagen, 74704), and cDNA was synthesized using the Quantitect Reverse Transcription Kit (Qiagen, 205311) according to the manufacturer’s instructions. TaqMan primers for Rn18s (18S Mm03928990), Prkn (Mm00450187), Bnip3 (Mm01275600), Bnip3l (Mm00786306), Fundc1 (Mm00511132), Gata4 (Mm00484689), Gata6 (Mm00802636), Mef2c (Mm01340842), Il6 (Mm00446190) and Ppargc1a (PGC-1α Mm01208835) were obtained from ThermoFisher Scientific. Bcl2l13 (Mm.PT.58.41776912), Phb2 (Mm.PT.58.7430511), Ccl2 (Mm.PT.58.42151692) and Wnt5a (Mm.PT.58.16402801) were obtained from Integrated DNA Technologies. qPCR utilized TaqMan Universal Master Mix II (Applied Biosystems, 4440040). qPCR was run on a CFX96 real-time PCR detection system (Bio-Rad Laboratories). Relative amounts of mRNA were normalized to 18S, and fold change in gene expression was calculated using the 2 (-ΔΔCt) method [Citation67].
Single-cell RNA sequencing
Freshly isolated (P0) or cultured (P5) CPCs were loaded on a Chromium™ Controller (10x Genomics) to generate single-cell Gel Bead-In-EMulsions (GEMs). Single-cell RNA-Seq libraries were prepared using Chromium™ Single Cell 3ʹ Library & Gel Bead Kit v2 (10x Genomics, 120267). GEM-reverse transcription (RT) was performed in a C1000 Touch Thermal cycler. After RT, GEMs were broken and the single-strand cDNA was cleaned up with DynaBeads MyOne Silane Beads (Thermo Fisher Scientific, 37002D) and SPRIselect Reagent Kit (Beckman Coulter, B23317; 0.6X SPRI). cDNA was amplified and then cleaned up with the SPRIselect Reagent Kit. Indexed sequencing libraries were constructed using the reagents in the Chromium™ Single Cell 3ʹ Library & Gel Bead Kit v2, following these steps: (1) end repair and A-tailing; (2) adapter ligation; (3) post-ligation cleanup with SPRIselect; (4) sample index PCR and cleanup. For quality control of libraries, each library was tested with Bioanalyzer (average library size: 450–490 bp). The sequencing libraries were quantified by quantitative PCR using KAPA Biosystems Library Quantification Kit (Illumina, KK4824) and Qubit 3.0 with dsDNA HS Assay Kit (Thermo Fisher Scientific, Q32851). Sequencing libraries were loaded at 2 pM on an Illumina HiSeq2500 with 2 × 75 paired-end kits using the following read length: 98 bp Read1, 8 bp i7 Index, and 26 bp Read2. For the single-cell RNA sequencing of mouse CPCs in , 1608 and 850 cells were recovered from freshly isolated and cultured CPC samples, respectively. For the single-cell RNA sequencing of human cardiac stem cells in , 814, 1693, and 1765 cells were recovered from cultured CPCs, EPCs, and MSCs, respectively. Samples were down-sampled until all samples have an equal number of confidently mapped reads per cell. The gene-cell barcode matrix was filtered based on number of genes detected per cell (any cells with less than 1000 genes per cell were filtered) and percentage of mitochondrial UMI counts (any cells with more than 10% of mitochondrial UMI counts were filtered). Altogether, 2383 cells and 15786 genes were kept for analysis by Seurat [Citation68]. 2221 variable genes were selected based on their expression and dispersion (expression cutoff = 0.0125, and dispersion cutoff = 0.5), and the first 10 principal components were used for clustering analysis.
Myocardial infarction and intramyocardial injection
All animal protocols and studies were approved by the review board of the Institutional Animal Care and Use Committee at San Diego State University. Myocardial infarctions were carried out on 8-week old C57/B6 male mice under 2% isoflurane anesthesia as previously described [Citation69]. Briefly, the heart was popped out through the fourth intercostal space, and the left anterior descending artery was ligated at the distal diagonal branch with a 7–0 suture. Infarction was confirmed by blanching of anterior left myocardium wall. Following ligation, either control CPCs or Bnip3l and Fundc1 siRNA CPCs stably expressing GFP together with DiI stain as an injection tracer (Thermo Fisher Scientific, D3911; 25 µg/mL) were delivered intramyocardially at three sites at the border of the blanching area with a total of 100,000 cells/10 µL per heart. The heart was immediately placed back into the intrathoracic space followed by muscle and skin closure.
Endothelial tube formation assay
Adapted from a protocol as described previously [Citation70], CPCs were incubated for 3 d in DM to generate conditioned media. Bovine aortic endothelial cells (75,000 cells/well) were plated on Geltrex (Invitrogen, A14132-02) coated 24-well plates with conditioned media from CPCs [Citation70]. Tube formation was assessed using a Carl Zeiss Axio Observer Z1 at 10x magnification after 14 h and tube formation was quantitated as previously described [Citation71]. Each condition was quantitated from at least 15 images per well in replicate.
Immunohistochemistry
Mice were sacrificed at 6 d post injection by chloral hydrate sedation. Hearts were infused with heparin and arrested in diastole under CdCl2 and KCl solution and perfused with 1% paraformaldehyde (ThermoFisher, 28908) in PBS for 5 min at 80–100mmHg via retrograde cannulation of the abdominal aorta. Retroperfused hearts were removed from the thoracic cavity and fixed overnight in 1% paraformaldehyde at 4ºC. Fixed hearts were gradually dehydrated by 30% sucrose (Fisher Chemical, S3-212) and 1:1 mix of 30% sucrose:Neg50 frozen section medium (ThermoFisher Scientific, 6502) before mounting in Neg50 on dry ice, followed by cryosectioning at 20-µm thickness at −18-20ºC. Heart sections were rehydrated with 1X PBS (GIBCO, 14200-075), permeabilized and blocked with 0.1% Triton X-100 (Sigma, T9284-500ML), 0.1 M glycine (Fisher, BP381-500), 1% BSA (Sigma, A9418), and 10% donkey serum (Millipore, S30-100mL) in PBS for 45 min at room temperature. Sections were incubated in primary antibodies anti-GFP (Rockland Immunochemicals Inc., 600-101-215) and anti-DES/desmin (Abcam, 15200) overnight at 4ºC, followed by incubation in secondary antibodies (ThermoFisher Scientific, A-11055 and A-31573) for 90 min at room temperature. Representative images were scanned using Leica SP8 confocal microscopy.
Western blot analysis
Cells were homogenized in ice-cold lysis buffer containing 50 mM Tris-HCl, pH 7.4, 150 mM NaCl, 1 mM EGTA, 1 mM EDTA, 1% Triton X-100, and protease inhibitor mixture (Roche Applied Science, 11873580001). The proteins were separated on NuPAGE Bis-Tris gels (Invitrogen, NP0302BOX) and then transferred to nitrocellulose membranes (GE Healthcare Life Sciences, 10600001). The membranes were blotted with the following antibodies: LC3A/B (Cell Signaling Technology, 4108), PRKN (Cell Signaling Technology, 4211), GAPDH (GeneTex, 627408), TIMM23 (BD transduction laboratory, 611222), BNIP3L (ProSci, 2289), FUNDC1 (Aviva Biosystems, ARP53280_P050), MFN1 (Santa Cruz Biotechnology, 50330), MFN2 (MilliporeSigma, M6319), MYC (MilliporeSigma, M4439), OXPHOS (Abcam, ab110413), ACTA1 (Genetex, 110003), TUBA4A (MilliporeSigma, T6074), p-DNM1L-S616 (Cell Signaling Technology, 3455) and DNM1L (BD transduction laboratory, 611113). Membranes were imaged using a ChemiDoc XRS+ System (Bio-Rad).
Electron microscopy
CPCs were fixed, mounted, and sectioned as previously described [Citation36]. Sections were imaged using a TECNAI G2 Spirit BioTWIN Transmission Electron Microscope equipped with an Eagle 4k HS digital camera (FEI).
Immunofluorescence microscopy
Cells were fixed, permeabilized, and stained with antibodies as previously described [Citation10]. The cells were stained anti-TOMM20 (Santa Cruz Biotechnology, 11415) to label mitochondria. In BNIP3L and FUNDC1 overexpression experiments, cells were co-stained with anti-MYC and anti-TOMM20 to identify transfected cells and label mitochondria, respectively. Cells were incubated with Alexa Fluor 488 or 594 secondary antibodies (Life Technologies, A11037) and Hoechst 33342 (Life Technologies, H3570; 10 μg/ml) to stain nuclei. To visualize autophagosomes, cells were infected with an adenovirus encoding GFP-LC3 24 h prior to fixation. Cells were imaged using a Carl Zeiss Axio Observer Z1, and Z-stacks were acquired using a high resolution AxioCam MRm digital camera, a 63x oil immersion objective, and Zeiss AxioVision 4.8 software (Carl Zeiss). A minimum of 100 cells per group were counted for each condition. Images were analyzed for mitochondrial fragmentation using ImageJ software. Mitophagy was assessed by analyzing colocalization between GFP-LC3-positive autophagosomes and TOMM20-labeled mitochondria. Mitophagy was also assessed using the COX8-EGFP-mCherry reporter [Citation33]. Red-only mitochondria were identified by thresholding images for red on merged images, and then quantified by the ‘analyze particles’ function in ImageJ.
Cell death assay
CPCs in DM were incubated with vehicle or 10 μM Mdivi-1 (MilliporeSigma, M0199) for 16 h prior to addition of 200 μM H2O2 (MilliporeSigma, H1009). After 8 h, CPCs were stained with YOPRO1 (ThermoFisher Scientific, Y3603; 1:1000) and Hoechst 33342 (Life Technologies, H3570; 10 μg/ml) for 5 min at 37°C. Cells were imaged using a Carl Zeiss Axio Observer Z1 at 10x magnification and cell death was quantified with ImageJ software. At least 175 cells were quantitated per condition in replicate.
Mitochondrial function
Mitochondrial membrane potential was measured by incubating CPCs with tetramethylrhodamine methyl ester (Invitrogen, T668; 25 nM) and Hoechst 33342 (Life Technologies, H3570; 10 μg/ml) for 20 min at 37°C. Live cells were imaged using a Carl Zeiss Axio Observer Z1 at 40x magnification and fluorescence intensity was quantified using ImageJ software. At least 30 cells were quantified per condition in replicate. Mitochondrial oxygen consumption of monolayers of CPCs was measured using the Seahorse XF96 analyzer (Agilent Technologies, Santa Clara, CA), adapted from a previously described protocol [Citation72]. 1 × 10⁴ cells/well were equilibrated in XF Base medium (Agilent Technologies, 102353-100) supplemented with 1 mM sodium pyruvate (MilliporeSigma, S8636), 3 mM glutamine (ThermoFisher Scientific, 25030149), and 10 mM glucose (MilliporeSigma, G8769) for 1 h before addition of 2 µM oligomycin (MilliporeSigma, 75351) to measure ATP-linked respiration. Three successive additions of 1.5 µM FCCP (MilliporeSigma, C2920) were added to measure maximal respiration, with the full respiration profile obtained after addition of antimycin A (MilliporeSigma, A8674). Oxygen consumption rates were normalized against cell number.
Statistical analysis
All experiments were independently repeated in the laboratory at least three times. Data are expressed as mean ± SEM. Differences between groups were assayed using repeated-measure ANOVA tests with Tukey’s post-hoc test or Student’s t-test. Differences were considered to be significant when p ≤ 0.05.
Supplemental Material
Download MS Word (4.3 MB)Disclosure statement
No potential conflict of interest was reported by the authors.
Supplementary material
Supplemental data for this article can be accessed here.
Additional information
Funding
References
- Writing Group M, Mozaffarian D, Benjamin EJ, et al. Heart disease and stroke statistics-2016 update: a report from the American heart association. Circulation. 2016 Jan 26;133(4):e38–e60.
- Broughton KM, Sussman MA. Empowering adult stem cells for myocardial regeneration V2.0: success in small steps. Circ Res. 2016 Mar 04;118(5):867–880.
- Hatzistergos KE, Takeuchi LM, Saur D, et al. cKit+ cardiac progenitors of neural crest origin. Proc Natl Acad Sci U S A. 2015 Oct 20;112(42):13051–13056.
- Cho GS, Lee DI, Tampakakis E, et al. Neonatal transplantation confers maturation of PSC-derived cardiomyocytes conducive to modeling cardiomyopathy. Cell Rep. 2017 Jan 10;18(2):571–582.
- Kulandavelu S, Karantalis V, Fritsch J, et al. Pim1 kinase overexpression enhances ckit+ cardiac stem cell cardiac repair following myocardial infarction in Swine. J Am Coll Cardiol. 2016 Dec 06;68(22):2454–2464.
- Hodgkinson CP, Bareja A, Gomez JA, et al. Emerging concepts in paracrine mechanisms in regenerative cardiovascular medicine and biology. Circ Res. 2016 Jan 08;118(1):95–107.
- Li X, Tamama K, Xie X, et al. Improving cell engraftment in cardiac stem cell therapy. Stem Cells Int. 2016;2016:7168797.
- Terrovitis JV, Smith RR, Marban E. Assessment and optimization of cell engraftment after transplantation into the heart. Circ Res. 2010 Feb 19;106(3):479–494.
- Guo Y, Wysoczynski M, Nong Y, et al. Repeated doses of cardiac mesenchymal cells are therapeutically superior to a single dose in mice with old myocardial infarction. Basic Res Cardiol. 2017 Mar;112(2):18.
- Orogo AM, Gonzalez ER, Kubli DA, et al. Accumulation of mitochondrial DNA mutations disrupts cardiac progenitor cell function and reduces survival. J Biol Chem. 2015 Sep 4;290(36):22061–22075.
- Chung S, Dzeja PP, Faustino RS, et al. Mitochondrial oxidative metabolism is required for the cardiac differentiation of stem cells. Nat Clin Pract Cardiovasc Med. 2007 Feb;4(Suppl 1):S60–S67.
- Rodriguez-Colman MJ, Schewe M, Meerlo M, et al. Interplay between metabolic identities in the intestinal crypt supports stem cell function. Nature. 2017 Mar 16;543(7645):424–427.
- Chen CT, Shih YR, Kuo TK, et al. Coordinated changes of mitochondrial biogenesis and antioxidant enzymes during osteogenic differentiation of human mesenchymal stem cells. Stem Cells. 2008 Apr;26(4):960–968.
- Norddahl GL, Pronk CJ, Wahlestedt M, et al. Accumulating mitochondrial DNA mutations drive premature hematopoietic aging phenotypes distinct from physiological stem cell aging. Cell Stem Cell. 2011 May 6;8(5):499–510.
- Wahlestedt M, Ameur A, Moraghebi R, et al. Somatic cells with a heavy mitochondrial DNA mutational load render induced pluripotent stem cells with distinct differentiation defects. Stem Cells. 2014 May;32(5):1173–1182.
- Spitkovsky D, Sasse P, Kolossov E, et al. Activity of complex III of the mitochondrial electron transport chain is essential for early heart muscle cell differentiation. Faseb J. 2004 Aug;18(11):1300–1302.
- Gatica D, Chiong M, Lavandero S, et al. Molecular mechanisms of autophagy in the cardiovascular system. Circ Res. 2015 Jan 30;116(3):456–467.
- Kubli DA, Gustafsson AB. Mitochondria and mitophagy: the yin and yang of cell death control. Circ Res. 2012 Oct 12;111(9):1208–1221.
- Ho TT, Warr MR, Adelman ER, et al. Autophagy maintains the metabolism and function of young and old stem cells. Nature. 2017 Mar 09;543(7644):205–210.
- Vessoni AT, Muotri AR, Okamoto OK. Autophagy in stem cell maintenance and differentiation. Stem Cells Dev. 2012 Mar 01;21(4):513–520.
- Zhang Y, Goldman S, Baerga R, et al. Adipose-specific deletion of autophagy-related gene 7 (atg7) in mice reveals a role in adipogenesis. Proc Natl Acad Sci U S A. 2009 Nov 24;106(47):19860–19865.
- Sin J, Andres AM, Taylor DJ, et al. Mitophagy is required for mitochondrial biogenesis and myogenic differentiation of C2C12 myoblasts. Autophagy. 2016;12(2):369–380.
- Gong G, Song M, Csordas G, et al. Parkin-mediated mitophagy directs perinatal cardiac metabolic maturation in mice. Science. 2015 Dec 4;350(6265):aad2459.
- Ma T, Li J, Xu Y, et al. Atg5-independent autophagy regulates mitochondrial clearance and is essential for iPSC reprogramming. Nat Cell Biol. 2015 Nov;17(11):1379–1387.
- Liu K, Zhao Q, Liu P, et al. ATG3-dependent autophagy mediates mitochondrial homeostasis in pluripotency acquirement and maintenance. Autophagy. 2016 Nov;12(11):2000–2008.
- Vazquez-Martin A, Van Den Haute C, Cufi S, et al. Mitophagy-driven mitochondrial rejuvenation regulates stem cell fate. Aging (Albany NY). 2016 Jul;8(7):1330–1352.
- Mizushima N. Autophagy: process and function. Genes Dev. 2007 Nov 15;21(22):2861–2873.
- Kabeya Y, Mizushima N, Ueno T, et al. LC3, a mammalian homologue of yeast Apg8p, is localized in autophagosome membranes after processing. Embo J. 2000;19(21):5720–5728. PubMed PMID: 133.
- Yoshimori T, Yamamoto A, Moriyama Y, et al. Bafilomycin A1, a specific inhibitor of vacuolar-type H(+)-ATPase, inhibits acidification and protein degradation in lysosomes of cultured cells. J Biol Chem. 1991 Sep 15;266(26):17707–17712. PubMed PMID: 1832676; eng.
- Kang R, Zeh HJ, Lotze MT, et al. The Beclin 1 network regulates autophagy and apoptosis. Cell Death Differ. 2011 Apr;18(4):571–580.
- Bjorkoy G, Lamark T, Brech A, et al. p62/SQSTM1 forms protein aggregates degraded by autophagy and has a protective effect on huntingtin-induced cell death. J Cell Biol. 2005 Nov 21;171(4):603–614. PubMed PMID: 16286508.
- Kujoth GC, Hiona A, Pugh TD, et al. Mitochondrial DNA mutations, oxidative stress, and apoptosis in mammalian aging. Science. 2005 Jul 15;309(5733):481–484.
- Rojansky R, Cha MY, Chan DC. Elimination of paternal mitochondria in mouse embryos occurs through autophagic degradation dependent on PARKIN and MUL1. eLife. 2016 Nov 17;5.
- Eiyama A, Okamoto K. PINK1/Parkin-mediated mitophagy in mammalian cells. Curr Opin Cell Biol. 2015 Apr;33:95–101.
- Narendra D, Tanaka A, Suen DF, et al. Parkin is recruited selectively to impaired mitochondria and promotes their autophagy. J Cell Biol. 2008 Dec 1;183(5):795–803.
- Kubli DA, Zhang X, Lee Y, et al. Parkin protein deficiency exacerbates cardiac injury and reduces survival following myocardial infarction. J Biol Chem. 2013 Jan 11;288(2):915–926.
- Monsanto MM, White KS, Kim T, et al. Concurrent isolation of 3 distinct cardiac stem cell populations from a single human heart biopsy. Circ Res. 2017 Jul 7;121(2):113–124.
- Hentze MW, Castello A, Schwarzl T, et al. A brave new world of RNA-binding proteins. Nat Rev Mol Cell Biol. 2018 May;19(5):327–341.
- Castaldi A, Dodia RM, Orogo AM, et al. Decline in cellular function of aged mouse c-kit+ cardiac progenitor cells. J Physiol. 2017 Oct 01;595(19):6249–6262.
- Hong KU. c-kit+ cardiac stem cells alleviate post-myocardial infarction left ventricular dysfunction despite poor engraftment and negligible retention in the recipient heart. PloS one. 2014;9(5):e96725.
- Wanet A, Arnould T, Najimi M, et al. Connecting mitochondria, metabolism, and stem cell fate. Stem Cells Dev. 2015 Sep 01;24(17):1957–1971.
- Kasahara A, Cipolat S, Chen Y, et al. Mitochondrial fusion directs cardiomyocyte differentiation via calcineurin and Notch signaling. Science. 2013 Nov 8;342(6159):734–737.
- Kashatus JA, Nascimento A, Myers LJ, et al. Erk2 phosphorylation of Drp1 promotes mitochondrial fission and MAPK-driven tumor growth. Mol Cell. 2015 Feb 5;57(3):537–551.
- Din S, Mason M, Volkers M, et al. Pim-1 preserves mitochondrial morphology by inhibiting dynamin-related protein 1 translocation. Proc Natl Acad Sci U S A. 2013 Apr 9;110(15):5969–5974.
- Fischer KM, Din S, Gude N, et al. Cardiac progenitor cell commitment is inhibited by nuclear Akt expression. Circ Res. 2011 Apr 15;108(8):960–970.
- Fischer KM, Cottage CT, Wu W, et al. Enhancement of myocardial regeneration through genetic engineering of cardiac progenitor cells expressing Pim-1 kinase. Circulation. 2009 Nov 24;120(21):2077–2087.
- Khan M, Mohsin S, Avitabile D, et al. beta-Adrenergic regulation of cardiac progenitor cell death versus survival and proliferation. Circ Res. 2013 Feb 1;112(3):476–486.
- Durcan TM, Fon EA. The three ‘P’s of mitophagy: PARKIN, PINK1, and post-translational modifications. Genes Dev. 2015 May 15;29(10):989–999.
- Li W, Zhang X, Zhuang H, et al. MicroRNA-137 is a novel hypoxia-responsive microRNA that inhibits mitophagy via regulation of two mitophagy receptors FUNDC1 and NIX. J Biol Chem. 2014 Apr 11;289(15):10691–10701.
- Sandoval H, Thiagarajan P, Dasgupta SK, et al. Essential role for Nix in autophagic maturation of erythroid cells. Nature. 2008 Jul 10;454(7201):232–235.
- Schweers RL, Zhang J, Randall MS, et al. NIX is required for programmed mitochondrial clearance during reticulocyte maturation. Proc Natl Acad Sci U S A. 2007 Dec 4;104(49):19500–19505.
- Esteban-Martinez L, Sierra-Filardi E, McGreal RS, et al. Programmed mitophagy is essential for the glycolytic switch during cell differentiation. Embo J. 2017 Jun 14;36(12):1688–1706.
- Liu L, Feng D, Chen G, et al. Mitochondrial outer-membrane protein FUNDC1 mediates hypoxia-induced mitophagy in mammalian cells. Nat Cell Biol. 2012 Feb;14(2):177–185.
- Long Q, Zhao D, Fan W, et al. Modeling of mitochondrial donut formation. Biophys J. 2015 Sep 1;109(5):892–899.
- Miyazono Y, Hirashima S, Ishihara N, et al. Uncoupled mitochondria quickly shorten along their long axis to form indented spheroids, instead of rings, in a fission-independent manner. Sci Rep. 2018 Jan 10;8(1):350.
- Ding WX, Li M, Biazik JM, et al. Electron microscopic analysis of a spherical mitochondrial structure. J Biol Chem. 2012 Dec 7;287(50):42373–42378.
- Hoque A, Sivakumaran P, Bond ST, et al. Mitochondrial fission protein Drp1 inhibition promotes cardiac mesodermal differentiation of human pluripotent stem cells. Cell Death Discov. 2018;4:39.
- Jezek J, Cooper KF, Strich R. Reactive oxygen species and mitochondrial dynamics: the yin and yang of mitochondrial dysfunction and cancer progression. Antioxidants. 2018 Jan 16;7(1):13.
- Ong SB, Subrayan S, Lim SY, et al. Inhibiting mitochondrial fission protects the heart against ischemia/reperfusion injury. Circulation. 2010 May 11;121(18):2012–2022.
- Song M, Mihara K, Chen Y, et al. Mitochondrial fission and fusion factors reciprocally orchestrate mitophagic culling in mouse hearts and cultured fibroblasts. Cell Metab. 2015 Feb 3;21(2):273–285.
- Ikeda Y, Shirakabe A, Maejima Y, et al. Endogenous Drp1 mediates mitochondrial autophagy and protects the heart against energy stress. Circ Res. 2015 Jan 16;116(2):264–278.
- Whelan RS, Konstantinidis K, Wei AC, et al. Bax regulates primary necrosis through mitochondrial dynamics. Proc Natl Acad Sci U S A. 2012 Apr 24;109(17):6566–6571.
- Papanicolaou KN, Khairallah RJ, Ngoh GA, et al. Mitofusin-2 maintains mitochondrial structure and contributes to stress-induced permeability transition in cardiac myocytes. Mol Cell Biol. 2011 Mar;31(6):1309–1328.
- Li-Harms X, Milasta S, Lynch J, et al. Mito-protective autophagy is impaired in erythroid cells of aged mtDNA-mutator mice. Blood. 2015 Jan 1;125(1):162–174.
- Goldberg MS, Fleming SM, Palacino JJ, et al. Parkin-deficient mice exhibit nigrostriatal deficits but not loss of dopaminergic neurons. J Biol Chem. 2003 Oct 31;278(44):43628–43635.
- Hanna RA, Quinsay MN, Orogo AM, et al. Microtubule-associated protein 1 light chain 3 (LC3) interacts with Bnip3 protein to selectively remove endoplasmic reticulum and mitochondria via autophagy. J Biol Chem. 2012 Apr 13;287(23):19094–19104.
- Schmittgen TD, Livak KJ. Analyzing real-time PCR data by the comparative C(T) method. Nat Protoc. 2008;3(6):1101–1108. PubMed PMID: 18546601; eng.
- Macosko EZ, Basu A, Satija R, et al. Highly parallel genome-wide expression profiling of individual cells using nanoliter droplets. Cell. 2015 May 21;161(5):1202–1214.
- Gao E, Koch WJ. A novel and efficient model of coronary artery ligation in the mouse. Methods Mol Biol. 2013;1037:299–311.
- Castaldi A, Dodia RM, Orogo AM, et al. Decline in cellular function of aged mouse c-kit+ cardiac progenitor cells. J Physiol. 2017 Jul 24;595:6249–6262.
- Moc C, Taylor AE, Chesini GP, et al. Physiological activation of Akt by PHLPP1 deletion protects against pathological hypertrophy. Cardiovasc Res. 2015 Feb 01;105(2):160–170.
- Rikka S, Quinsay MN, Thomas RL, et al. Bnip3 impairs mitochondrial bioenergetics and stimulates mitochondrial turnover. Cell Death Differ. 2011 Nov 19;18(4):721–731.