
ABSTRACT
Mutations in the TBK1 (TANK binding kinase 1) gene are causally linked to amyotrophic lateral sclerosis (ALS) and frontotemporal dementia (FTD). TBK1 phosphorylates the cargo receptors OPTN and SQSTM1 regulating a critical step in macroautophagy/autophagy. Disruption of the autophagic flux leads to accumulation of cytosolic protein aggregates, which are a hallmark of ALS. hiPSC-derived TBK1-mutant motoneurons (MNs) showed reduced TBK1 levels and accumulation of cytosolic SQSTM1-positive aggresomes. By screening a library of nuclear-receptor-agonists for modifiers of the SQSTM1 aggregates, we identified 4-hydroxy(phenyl)retinamide (4HPR) as a potent modifier exerting detrimental effects on mutant-TBK1 motoneurons fitness exacerbating the autophagy overload. We have shown by TEM that TBK1-mutant motoneurons accumulate immature phagophores due a failure in the elongation phase, and 4HPR further worsens the burden of dysfunctional phagophores. 4HPR-increased toxicity was associated with the upregulation of SQSTM1 in a context of strongly reduced ATG10, while rescue of ATG10 levels abolished 4HPR toxicity. Finally, we showed that 4HPR leads to a downregulation of ATG10 and to an accumulation of SQSTM1+ aggresomes also in hiPSC-derived C9orf72-mutant motoneurons. Our data show that cultured human motoneurons harboring mutations in TBK1 gene display typical ALS features, like decreased viability and accumulation of cytosolic SQSTM1-positive aggresomes. The retinoid 4HPR appears a strong negative modifier of the fitness of TBK1 and C9orf72-mutant MNs, through a pathway converging on the mismatch of initiated autophagy and ATG10 levels. Thus, autophagy induction appears not to be a therapeutic strategy for ALS unless the specific underlying pathway alterations are properly addressed.
Abbreviations
4HPR: 4-hydroxy(phenyl)retinamide; AKT: AKT1 serine/threonine kinase 1; ALS: amyotrophic lateral sclerosis; ATG: autophagy related; AVs: autophagic vesicle; C9orf72: chromosome 9 open reading frame 72; CASP3: caspase 3; CHAT: choline O-acetyltransferase; CYCS: cytochrome c, somatic; DIV: day in vitro; FTD: frontotemporal dementia; FUS: FUS RNA binding protein; GFP: green fluorescent protein; hiPSCs: human induced pluripotent stem cells; MAP1LC3/LC3: microtubule associated protein 1 light chain 3; MNs: motoneurons; mRFP: monomeric red fluorescent protein; MTOR: mechanistic target of rapamycin kinase; NFE2L2/NRF2: nuclear factor, erythroid 2 like 2; RARA: retinoic acid receptor alpha; SLC18A3/VACHT: solute carrier family 18 (vesicular acetylcholine transporter), member 3; SQSTM1/p62: sequestosome 1; TBK1: TANK binding kinase 1; TEM: transmission electron microscopy
KEYWORDS:
Introduction
TBK1 (TANK binding kinase 1) is a serine-threonine kinase that has been initially identified as a regulator of the NFKB pathway, through TRAF2-MAP4K4/NIK-IKK complex [Citation1]. More recently, TBK1 has been found to regulate cell survival by directly phosphorylating and activating AKT [Citation2] and through the control of proteostatic (degradative) mechanisms. In fact, TBK1 regulates the autophagic flux and cargo selection by phosphorylating the autophagic receptors OPTN (optineurin) and SQSTM1/p62 (sequestosome 1), providing a crucial regulatory step in in the recruitment of the ubiquitinated cargo at the forming autophagosome [Citation3,Citation4].
Mutations in TBK1 have been associated with several human diseases: heterozygous loss-of-function mutations have been linked to a juvenile form of herpes simplex encephalitis [Citation5], whereas an increased copy number of the TBK1 gene has been associated with a rare subtype of glaucoma [Citation6]. Most notably, two recent studies have identified TBK1 as a novel amyotrophic lateral sclerosis (ALS) and frontotemporal dementia (FTD) causative gene [Citation7,Citation8]. Additional TBK1 mutations characterized by strong penetrance have been disclosed in distinct cohorts of ALS and FTD patients [Citation9–Citation12].
The pathogenic mechanisms linking TBK1 mutations to the clinical phenotype of motoneurons (MNs) disease are poorly understood. TBK1 haploinsufficiency has been hypothesized to be sufficient to generate a pathologic phenotype associated with autophagy impairment in vivo [Citation8]. In particular, mutations or deletion of the kinase domain and of the coiled-coil domain 2 (TBK1 is composed by a kinase domain [KD] located at its N terminus, a ubiquitin-like domain [ULD] and 2 coiled-coil domains [CCD1 and CCD2]) [Citation13], which directly mediate the interaction with and the phosphorylation of SQSTM1 and OPTN, are sufficient to prevent the recruitment of these two proteins. As a consequence, this slows down the autophagic clearance of damaged mitochondria [Citation4,Citation8,Citation14]. In fact, siRNA-mediated TBK1 depletion is sufficient to cause incomplete autophagosomal maturation [Citation15].
Taken together, these findings suggest that reduced levels of TBK1 protein, as well as loss-of-function mutations, might lead to a less efficient autophagy and to the toxic accumulation of protein aggregates and damaged organelles. In fact, post-mortem tissues from ALS patients carrying TBK1 mutations display accumulation of SQSTM1 and TARDBP/TDP-43 aggregates in cortical neurons and spinal MNs [Citation8,Citation16]. The same aggregates are shared also by patients carrying mutations in other ALS-causing genes as well as by sporadic patients [Citation17], suggesting that TBK1 mutations may trigger pathogenic cascades common to the majority of ALS cases.
We set out to identify and modify TBK1-dependent pathogenic pathways by exploiting patient-related, hiPSC-derived MNs and by screening small-molecules modifiers of TBK1-associated autophagy abnormalities, with the goal of further understanding and eventually circumventing the molecular defects leading to MN degeneration.
Results
TBK1 haploinsufficiency and increased neuronal loss in TBK1-mutant MNs
In order to elucidate the pathogenic cascades linking TBK1 mutations to ALS pathogenesis, we generated human induced pluripotent stem cell (hiPSC) lines from 3 ALS patients (out of the cohort reported by Freischmidt and collaborators [Citation8]) carrying different heterozygous mutations in TBK1 gene: 2 patients carried different loss-of-function point mutations, while the third patient carried an in-frame deletion mutation (). Of note, the patient carrying the 555T>A loss-of-function mutation carried also a mutation in the ALS-related FUS gene (p.R524G, mTBK1-FUS line). hiPSC lines were generated by reprogramming of the patients’ keratinocytes with a lentiviral polycistronic STEMCCA cassette encoding OCT4, SOX2, KLF4, and MYC [Citation18]. hiPSC lines maintained the genomic mutations within TBK1 gene (Figure S1(a)), expressed pluripotency markers (Figure S1(b,c)), had normal karyotypes (Figure S1(d)) and were ultimately able to spontaneously differentiate in the 3 germ layers (Figure S1(e)) [Citation18–Citation21].
We compared TBK1-mutant (mTBK1) hiPSC lines with cells derived from 2 healthy individuals (CTRL) either previously generated in our group [Citation21,Citation22] or commercially available (BioCat). The cell lines CTRL I and mTBK1 I were used for displaying representative images and experiments.
hiPSCs were differentiated into MNs following the protocol by Shimojo and coworkers (summarized in Figure S2(a)) [Citation23]. At day in vitro (DIV) 14, hiPSC-derived MNs were immunopositive for neuronal and motoneuronal markers (Figure S2(b)) and expressed typical neuronal marker genes. Of note, the expression of the early neurodevelopmental marker NES (nestin) was undetectable, suggesting that at DIV14 these MNs were already at a later stage of maturation (Figure S2(c)). In differentiated cultures, MNs (CHAT+) represented 45.6 ± 1.8% of all cells, and 80% of the total neuronal cells (evaluated by CHAT-MAP2 coimmunolabelling; Figure S2(d)). The differentiation efficiency was comparable between genotypes.
In agreement with previous observations [Citation8], mTBK1 MNs showed a reduction of up to 50% of TBK1 protein levels in comparison to healthy controls (). This reduction in TBK1 protein did not affect the MNs differentiation and early development: at DIV14, CTRL and mTBK1 showed comparable population of CHAT+ MNs, while the number of mTBK1 MNs dramatically declined in long-term cultures ().
Figure 1. mTBK1 MNs resemble typical features of ALS patients. (a) Table showing the different mTBK1 hiPSC lines derived from ALS patients. (b) Immunoblot analysis of endogenous TBK1 protein levels in CTRL and mTBK1 MNs at DIV14 (One-Way ANOVA followed by Sidak´s multiple comparisons test: *p < 0.05). (c) Immunofluorescence labeling of CTRL and mTBK1 MNs against ChAT. From DIV28, mTBK1 show reduced number of CHAT+ cells (two-way ANOVA followed by Holm-Sidak´s multiple comparisons test *p < 0.05; **p < 0.01). (d) Heatmap showing decreased phosphorylation levels of AKT-MTOR pathway interplayers in mTBK1 MNs compared to CTRL (two-way ANOVA followed by Holm-Sidak´s multiple comparisons test. AKT Thr308 **p < 0.01; AKT Ser473 **p < 0.01; PRKAA/AMPKa Thr172 **p < 0.01; MTOR Ser2481 **p < 0.01; GSK3A Ser21 **p < 0.01; GSK3B Ser9 **p < 0.01; RPS6KB/p70 S6 kinase Thr241/Ser424 ***p < 0.001; BAD Ser112 **p < 0.01; RPS6KA1/RSK1 Ser380 **p < 0.01; PTEN Ser380 **p < 0.01; PDK1 Ser 241 **p < 0.01; MAPK1/ERK2-MAPK3/ERK1 Thr202/Tyr202 **p < 0.01). (e) Immunofluorescence labeling of CTRL and mTBK1 MNs against SLC18A3/VACHT and active CASP3 at DIV28. mTBK1 show increased numbers of SLC18A3/VACHT-CASP3 double-positive MNs (Mann Whitney test ***p < 0.001). Data information: all the experiments were performed in N = 3 independent replicates, and in (c and e) the lines CTRL I and mTBK1 I were used as representative of the respective genotypes. Scale bars: 50 μm in (c) and 25 μm in (e). To improve readability, in (b) is displayed only the statistical comparison between the 2 genotypes. Data are presented as mean ± SEM.
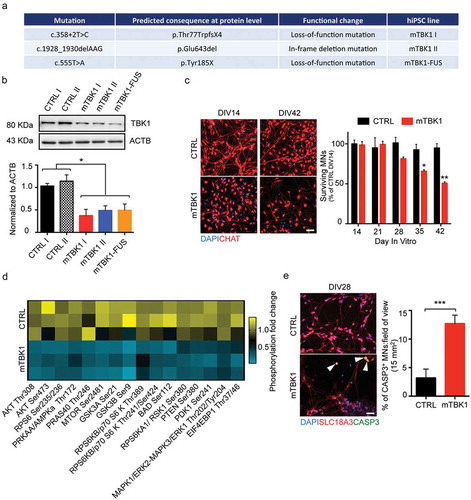
TBK1 directly phosphorylates and activate AKT and MTOR, which are both crucial members of the AKT-MTOR cascade responsible for the activation, among others, of protein synthesis and pro-survival pathways [Citation24,Citation25]. Because mTBK1 MNs displayed reduced TBK1 protein levels and reduced viability, we investigated the possible involvement of the pro-survival AKT-MTOR pathway. We exploited a phospho-antibody array exploring the activation of the AKT-MTOR signaling cascade (PathScan® Akt Signaling Array). Out of the 18 targets explored, we detected a dramatic decrease in the levels of phosphorylated AKT, PRKAA/AMPKa, MTOR, GSK3A and GSK3B, BAD, RPS6KA1/RSK1, PTEN, PDK1 and MAPK/ERK in mTBK1 MNs compared to CTRL (), suggesting a strong inhibition of the AKT-MTOR pathway in mutant cells. In agreement with the loss of MNs and the inhibition of pro-survival mechanisms, already at DIV28 mTBK1 showed increased number of active CASP3 (caspase 3)-positive MNs in comparison to healthy CTRL ().
mTBK1 MNs accumulate aberrant aggresomes
Since mTBK1 MNs showed decreased viability during long-term culture, we speculated that accumulation of insoluble protein aggregates within MNs’ somata might contribute to the observed decay. In fact, at DIV14 mTBK1 MNs showed intracellular accumulation of aberrant SQSTM1-positive (SQSTM1+) aggregates ( and S3(a)), similar to those observed in pathological specimens [Citation8].
The burden of SQSTM1+ aggregates did not appear to increase upon long-term culture (Figure S3(b)), although at this time point a significant loss of MNs already occurred. Notably, the aggregates were already detectable at the stage of undifferentiated hiPSCs (Figure S3(c)).
We then analyzed the nature of SQSTM1+ structures in the cytoplasm of mTBK1 MNs, in particular focusing on the possibility that they might represent immature autophagosomes or cytoplasmic heterogeneous accumulations of misfolded proteins (as suggested by Bjørkøy et al [Citation26]). High-pressure freezing transmission electron microscopy (TEM) highlighted the accumulation of membrane-bound structures enclosing unorganized material, free membranes and debris of cytosolic organelles, with irregular shape, perinuclear localization () and a size ranging from 0.200 μm2 up to 4 μm2. We identified these structures as aggresomes according to current criteria [Citation27,Citation28]. Aggresomes were only rarely found in MNs from healthy individuals, and those were never larger than 1 μm2 ().
Figure 2. mTBK1 MNs accumulate cytosolic SQSTM1+ aggresomes. (a) Representative confocal images of CTRL and mTBK1 MNs at DIV14 immunolabeled against CHAT and SQSTM1. mTBK1 accumulate cytosolic SQSTM1+ structures compared to CTRL (One-Way ANOVA followed by Sidak´s multiple comparisons test: ***p < 0.001). (b) TEM analysis of cytosolic aggresomes in CTRL and mTBK1 MNs at DIV14. mTBK1 MNs show larger cytosolic fraction occupied by aberrant aggresomes (displayed in Bi; Mann Whitney test ***p < 0.001). (Bii) Cumulative frequency of aggresomes’ size distribution. (c, d, e, f and g) Representative confocal single-optical sections of mTBK1 MNs immunolabeled against SQSTM1 and PROTEOSTAT® Aggresome detection kit (Aggresomes – C), HDAC6 (d), ubiquitin (e), ATG5 (f) and LC3 (g). The SQSTM1-positive structures colocalize with the aggresome markers, but not with the autophagy proteins ATG5 and LC3. Data information: all the experiments were performed in N = 3 independent replicates, and in (b) the lines CTRL I and mTBK1 I were used as representative of the respective genotypes. In immunocytochemistry a minimum of n = 90 CHAT+ cells were analyzed. TEM analysis was performed on a minimum of n = 21 MNs. Scale bar: in (a) is 10 μm, in (b) is 2 μm, in the magnification 1 is 0.250 μm and in the magnification 2 is 0.500 μm. In (g) the scale bar is 5 μm in the upper row and 1 μm in the lower. To improve readability, in (a) is displayed only the statistical comparison between the 2 genotypes. Data are presented as mean ± SEM.
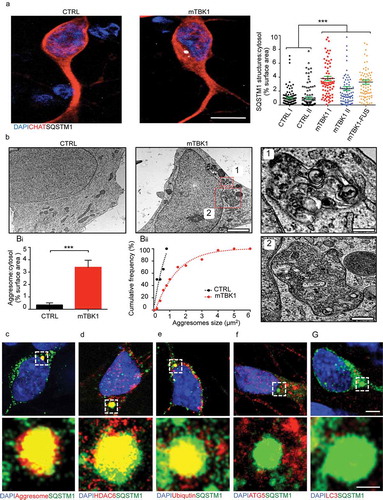
We then aimed to elucidate the molecular composition of the SQSTM1+ structures, in order to finely uncover whether these might correspond to the aggresomes observed in TEM. In light microscopy experiments the aberrant SQSTM1+ aggregates were positively co-labeled by the aggresome-specific dye PROTEOSTAT® (), and were immunopositive for the aggresome markers HDAC6 and ubiquitin () [Citation29–Citation32]. Taken together, light and electron microscopy data show that SQSTM1 aggregates are bona fide aggresomes. Moreover, SQSTM1 aggresomes did not colocalize with LC3A/B (henceforth LC3) and ATG5, (), suggesting that SQSTM1+ aggresomes are not efficiently targeted for autophagic degradation in mTBK1 MNs.
Taken together, these data show that hiPSC-derived MNs carrying ALS-related TBK1 mutations display pathologic phenotypes closely reminiscent of the spectrum observed in human specimens, namely decreased TBK1 expression and accumulation of SQSTM1+ aggresomes.
Screening of nuclear receptor ligands reveals 4-hydroxy(phenyl)retinamide as an autophagy modifier
In order to gain mechanistic and therapeutic insights into TBK1-dependent pathogenic features, we screened the effect of a small-molecule library on the occurrence of accumulation of cytosolic aggresomes in mTBK1 MNs, focusing on ligands for nuclear receptors because of their involvement in the regulation of metabolic events and proteostasis [Citation33]. mTBK1 MNs (DIV14) were treated for 24 h with the different nuclear receptor ligands, DMSO (0.1% as negative control), or rapamycin (as positive control for autophagy induction); cells were fixed and the SQSTM1 burden in CHAT+ MNs was assessed. This initial screening was performed using the mTBK1 I line (carrying the 358 + 2 T >C loss-of-function mutation) as representative of the 3 ALS mutants.
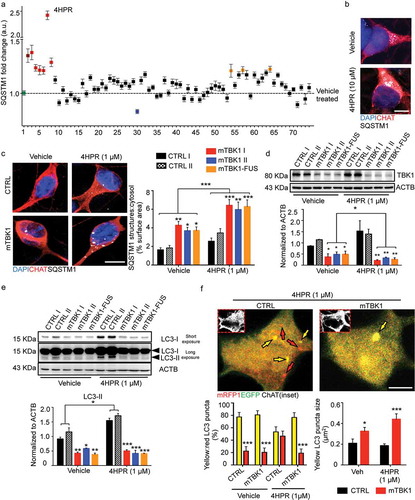
Out of 72 compounds tested (complete list in Table S1), 10 produced a significant effect on SQSTM1 burden; in particular, 9 compounds increased the burden of SQSTM1, whereas 1 (paxilline) decreased it (indicated in blue in ). Notably, the majority (6 out of 9) of compounds increasing SQSTM1 burden belong to the family of RARA (retinoic acid receptor alpha) agonists (indicated in red in ), and among them 4-hydroxyphenylretinamide (4HPR) showed the strongest effect (). We sought confirmation of the hits resulting from the screening in dose-response and time course experiments. Whereas paxiline revealed to be a false-positive result, 4HPR robustly and dose-dependently increased SQSTM1 burden in MNs (Figure S4(a)). Since we observed an increased toxicity with high doses (starting from 10 μM, which was used to perform the initial screening; ), μM 4HPR was selected for further investigations. The time course revealed that 24 h of treatment with 1 μM 4HPR were sufficient to increase the SQSTM1 burden in MNs significantly, and SQSTM1+ signal was found to steadily increase up to 48 h (Figure S4(b)). Of note, short-term treatment (24 h) with 1 μM 4HPR did not affect the differentiation of MNs (as shown by CHAT, ISL1, TUBB3 and NEFH expression; Figure S4(c)) and short-term survival was unchanged (Figure S4(d)), implying that the effect on SQSTM1 was not a consequence of impaired MNs differentiation or apoptotic cell death.
Figure 3. Small molecules screening identifies 4HPR as a potent modifier of mTBK1 phenotype. (a) Manhattan plot showing the intensity of SQSTM1 in mTBK1 MNs treated with the nuclear receptor ligands. In green: vehicle (DMSO, as negative control); in dark red: Rapamycin (positive control); in red: RARA agonists that increased significantly SQSTM1 intensity (4HPR is highlighted); in blue: Paxilline; in orange (in sequence): Geranylgeraniol, 6a-fluorotestosterone and 1a,25-dihydroxyvitamin D3 (One-Way ANOVA followed by Sidak´s multiple comparisons test; a complete list of the compounds is available in Table S1). (b) Representative immunolabeling of mTBK1 MNs treated with DMSO (vehicle) and 4HPR (10 μM). (c) Representative confocal images of CTRL and mTBK1 MNs at DIV14 treated with vehicle or 4HPR (1 μM) for 24 h and immunolabeled against CHAT and SQSTM1. 4HPR increases SQSTM1 accumulation in mTBK1 to a higher extent compared to CTRL (two-way ANOVA followed by Holm-Sidak´s multiple comparisons test: *p < 0.05; **p < 0.01; ***p < 0.001). (d and e) Immunoblot analysis of endogenous TBK1 (d) and LC3-II (e) protein levels in CTRL and mTBK1 MNs at DIV14 treated with vehicle or 4HPR (1 μM) for 24 h. (two-way ANOVA followed by Holm-Sidak´s multiple comparisons test: *p < 0.05; **p < 0.01; ***p < 0.001). (f) Representative confocal images of CTRL and mTBK1 MNs transfected with mRFP-EGFP-LC3 construct and treated with 4HPR (1 μM). The autophagy sensor reveals that the retinoid increases the autophagic flux in CTRL cells, while mutant MNs are characterized by an early-phase block in the pathway. Data information: the complete molecule screening was performed twice in N = 2 independent differentiations, and compounds were tested twice each time (n = 120 MNs analyzed). The other experiments were performed in N = 3 independent replicates, and in (f) the lines CTRL I and mTBK1 I were used as representative of the respective genotypes. In immunocytochemistry a minimum of n = 90 CHAT+ cells were analyzed, while the autophagy flux was evaluated in a minimum of n = 16 transfected MNs for each condition. Scale bars: (b) and (f) 5 μm, (c) 10 μm. Data are presented as mean ± SEM.
RARA activation worsens the autophagy impairment in mTBK1 MNs
We investigated further the detrimental effect of 4HPR on healthy and on mTBK1 MNs, including the line carrying a compound mutation of TBK1 and FUS (in order to explore the interaction between distinct ALS-related mutations). CTRL MNs did not display SQSTM1 aggregates in vehicle-treated cultures, and SQSTM1 burden was only modestly increased by 4HPR treatment. Conversely, 4HPR strongly increased SQSTM1 burden to the same extent in pure TBK1 mutants and in the TBK1-FUS mutant line, suggesting that 4HPR was affecting SQSTM1 burden by primarily interacting with the pathogenic pathways specific of the mutant TBK1 ().
We then further explored the mechanisms leading to RA-induced SQSTM1 accumulation by considering the effect of 4HPR on proteins regulating SQSTM1 entry into the autophagic pathway (TBK1) or associated with SQSTM1 degradation in mature autophagosomes (LC3). Although 4HPR did not affect TBK1 levels in CTRL cells, it further reduced the TBK1 protein levels in mutant MNs ().
Moreover, mTBK1 MNs displayed significantly reduced levels of lipidated LC3 (compared to CTRL MNs) in vehicle treated cultures; notably, 4HPR increased the levels of LC3-II in CTRL MNs but it failed to do so in mutant cells (). Lipidated LC3 was increased also by all trans retinoic acid (ATRA, a structurally unrelated RARA agonist; Figure S5(a)) whereas co-treatment of cells with 4HPR and the RARA antagonist BMS-195614 reduced this effect (Figure S5(b)). Based on these results, we hypothesized that although RARA activation increases autophagosome levels in normal MNs, it may fail to do so in mTBK1. Notably, either in the case of TBK1 or in case of LC3-II levels, the mTBK1-FUS MNs were comparable to pure mTBK1, suggesting that FUS contribution to autophagy dysregulation and increased 4HPR sensitivity is negligible in these conditions ().
To obtain a more direct evaluation of the autophagic flux in CTRL and mTBK1 cells (and the relative effect of 4HPR), we transfected MNs from both genotypes with a mRFP1-EGFP-LC3 construct [Citation34]; cells were then treated with 1 μM 4HPR for 24 h and imaged using confocal microscopy. In vehicle-treated CTRL cultures, the yellow LC3+ structures (autophagosomes) were more numerous than red ones. The 4HPR treatment increased the overall number of LC3+ structures in CTRL MNs (1.745 ± 0.347 fold increase of CTRL vehicle-treated; data not shown), but increased disproportionately more the number of red than of yellow LC3 puncta; these results indicate not only an increase in the overall activity of the autophagic pathway, but also an increased flux toward autolysosome formation. Vehicle-treated mTBK1 MNs did not differ from CTRL in terms of yellow LC3 structure number, but these were significantly larger than in wild-type cells. Notably, 4HPR failed to increase the number of red LC3+, but further increased the size of yellow LC3 structures in mTBK1 MNs (). Thus, 4HPR did not increase the autophagic flux in ALS-related cells, but it exacerbated the autophagy impairment that, at DIV14, in vehicle-treated cultures was hinted by the significantly larger size of the yellow LC3 puncta (suggesting an accumulation in structures that do not undergo complete maturation).
4HPR induces accumulation of immature phagophores in mTBK1 MNs, which is due to an impaired elongation phase in the autophagic flux
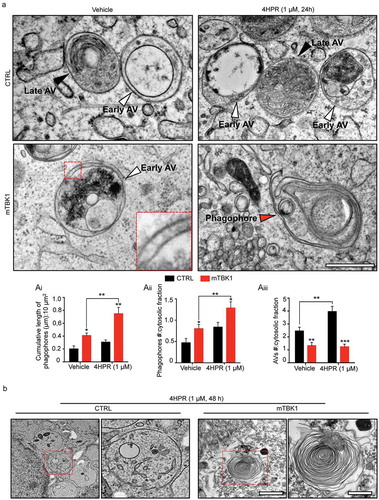
To uncover at which step (upstream of LC3 lipidation) RARA activation further interfered with the autophagic flux already altered by TBK1 mutations, we analyzed at ultrastractural level the autophagic structures generated in response to 4HPR treatment. In high-pressure freezing TEM images, autophagic structures were identified according to accepted criteria [Citation35,Citation36]: briefly, autophagic structures were readily identified in CTRL MNs, corresponding to the morphological criteria for early autophagic vesicles (AVs) and for late AVs (autolysosomes). Interestingly, vehicle-treated TBK1 MNs displayed a significant higher amount of phagophore membranes and phagophore number, indicating an increased population of early autophagic structures, while displaying decreased number of AVs compared to CTRL MNs. Thus, in vehicle-treated mutant MNs, TEM identified a failure in the maturation of phagophores. Treatment of CTRL MNs with 4HPR resulted in an increase of phagophores number as well as of AVs, indicating the overall stimulation of autophagy (in agreement with the results obtained with the mRFP1-EGFP-LC3 sensor). Notably, mTBK1 MNs exposed to 4HPR displayed a strong accumulation of immature phagophores (,), without showing a corresponding increase in mature autophagosomes (occurring in treated CTRL MNs). Taken together, these data provide compelling morphological evidence that the autophagic impairment in mTBK1 MNs takes place at the elongation phase, and this elongation-phase bottleneck is worsened by 4HPR, which induces the accumulation of immature phagophores.
In fact, even prolonged treatment with the RARA-agonist (48 h) did not cause the clearing of phagophores but rather resulted in a further dramatic accumulation of immature double-membrane structures in mTBK1: unorganized double-membranes with a minimum length of 0.75 μm were detectable in 37.6% of the cells analyzed, while CTRL cells were characterized by an accumulation of large, single-membrane cytosolic vacuoles (). In agreement with the massive accumulation of immature autophagic structures, 48-h exposure to 4HPR strongly increased the number of apoptotic nuclei detected by TEM in mTBK1 MNs but not in CTRL (Figure S6(a)). Confirming the TEM data, the prolonged 4HPR treatment triggered a significant increase in CYCS (cytochrome c, somatic; a readout associated with apoptosis [Citation37,Citation38]) in the mutant genotype (Figure S6(b)); in fact, an increased number of cleaved CASP3+ MNs was observed in mTBK1 (but not in CTRL) upon 48 h of 4HPR treatment (Figure S6(c)).
Figure 4. mTBK1 MNs show impaired autophagosome maturation. (a) TEM analysis of CTRL and mTBK1 MNs at DIV14 treated with vehicle or 4HPR (1 μM) for 24 h. White arrowheads indicate Early AVs; black arrowheads indicate Late AVs (autolysosomes); red arrowheads indicate phagophores. mTBK1 MNs show increased cumulative phagophore length and accumulation of phagophores after 4HPR treatment (shown in ai and aii, two-way ANOVA followed by Holm-Sidak´s multiple comparisons test: *p < 0.05; **p < 0.01). 4HPR increases the total number of AVs in CTRL MNs, but not in mTBK1 (shown in aiii, two-way ANOVA followed by Holm-Sidak´s multiple comparisons test: **p < 0.01; ***p < 0.001). (b) TEM analysis of CTRL and mTBK1 MNs at DIV14 treated with vehicle or 4HPR (1 μM) for 48 h. CTRL MNs show large cytosolic vesicles, while mTBK1 accumulate large unorganized double-membrane structures. Data information: in all the experiments a minimum of n = 21 MNs were analyzed (N = 3 independent replicates for 24 h treatment, N = 2 independent replicates for 48 h treatment), and the lines CTRL I and mTBK1 I were used as representative of the respective genotypes. scale bars: (A) 0.25 μm, (b) 1 μm in the low magnifications and 0.5 μm in the higher magnifications. Data are presented as mean ± SEM.
Incomplete activation of RARA-dependent autophagy-regulating transcriptional program in TBK1 MNs
In order to gain molecular insights into the detrimental effect of RARA activation on mTBK1 autophagy impairment, we screened the expression levels of 84 genes involved in the autophagic pathway (Human Autophagy RT2 Profiler™ PCR Array) in control or TBK1-mutant cells subject to vehicle or 4HPR treatment for 24 h. After quantile normalization, differential expression analysis revealed that vehicle-treated mTBK1 MNs already displayed a significant downregulation of genes involved in the elongation phase (ATG10, ATG12, ATG4A, TMEM74 and ULK2) and upregulation of genes involved in apoptosis (BAX, DRAM1, FAS and TP53) compared to CTRL (adjusted p-value < 0.05; the complete set of raw data is available in Table S2). However, whereas 4HPR induced the upregulation of HSP90AA1, MAP1LC3B, LAMP1 and SQSTM1 expression in healthy MNs, the response of mTBK1 MNs to 4HPR was restricted to increased SQSTM1 expression levels (). The downregulation of ATG10 and TMEM74 in mTBK1 was not modified by 4HPR, as confirmed by independent qRT-PCR and, for ATG10, also at protein level ().
Figure 5. Autophagy blockade in mTBK1 occurs at the elongation phase. (a) Heatmap showing mRNA expression of autophagy genes significantly altered in CTRL and mTBK1 MNs at DIV14 treated with vehicle or 4HPR (1 μM) for 24 h. (b) qRT-PCR analysis of ATG10 and TMEM74 levels (two-way ANOVA followed by Holm-Sidak´s multiple comparisons test: *p < 0.05). (c) Immunoblot analysis of endogenous ATG10 protein levels in CTRL and mTBK1 MNs at DIV14 treated with vehicle or 4HPR (1 μM) for 24 h (two-way ANOVA followed by Holm-Sidak´s multiple comparisons test: ***p < 0.001). (d and e) Immunoblot analysis of endogenous total (d) and phosphorylated (e) SQSTM1 protein levels in CTRL and mTBK1 MNs at DIV14 treated with vehicle or 4HPR (1 μM) for 24 h. mTBK1 show increased baseline levels of SQSTM1, whose accumulation becomes more dramatic upon 4HPR treatment. Levels of Ser403 phosphorylation were increased in CTRL after 4HPR treatment, while in mTBK1 remained downregulated (two-way ANOVA followed by Holm-Sidak´s multiple comparisons test; *p < 0.05; **p < 0.01; ***p < 0.001). (f and g) Representative confocal images of mTBK1 MNs transfected either with GFP reporter or ATG10-GFP vector. Cells were treated with vehicle or 4HPR (1 μM) for 24 (f) or 48 h (g) and immunolabeled against CHAT and SQSTM1 (f) or CYCS (g). Upper row shows GFP-positive signals, lower row shows magnification of the somata. Overexpression of ATG10 rescues the detrimental effect of 4HPR on SQSTM1 accumulation (two-way ANOVA followed by Holm-Sidak´s multiple comparisons test: p = 0.06), and attenuates the 4HPR-dependent increase of CYCS (two-way ANOVA followed by Holm-Sidak´s multiple comparisons test: *p < 0.05). This confirms the beneficial effect on MNs fitness exerted by ATG10 restoration. Data information: all the experiments were performed in in N = 3 independent replicates, and the lines CTRL I and mTBK1 I were used as representative of the respective genotypes. The effect of ATG10 overexpression was evaluated in N = 3 independent replicates analyzing a minimum of n = 16 CHAT+ cells for each group. Scale bars: (f) and (g) 10 μm in the higher row and 5 μm in the lower row. Data are presented as mean ± SEM.
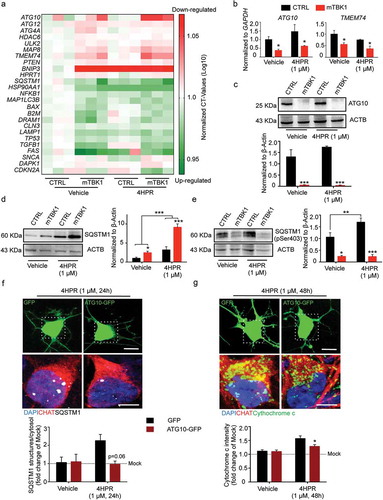
Thus, whereas in CTRL MNs 4HPR activated a coordinated program aiming at enhancing the autophagic flux, in mTBK1 the transcriptional activation was incomplete and restricted (among the tested genes) to SQSTM1; notably, SQSTM1 upregulation took place in the context of a persistent and RA-insensitive downregulation of ATG10. In fact, vehicle-treated mTBK1 MNs displayed a higher protein level of SQSTM1 compared to CTRL cells, and whereas in CTRL MNs 4HPR induced only a minor increase in SQSTM1, in mTBK1 MNs it produced a massive build-up of this protein (). SQSTM1 is itself phosphorylated by TBK1 on Ser403 [Citation4], a critical checkpoint for the progression of the autophagic pathway. In mTBK1 MNs, the baseline value of phosphorylated SQSTM1 was significantly lower than in CTRL; upon 4HPR treatment, levels of phosphorylated SQSTM1 increased strongly in CTRL MNs (underscoring the activation of the autophagic pathway) but remained persistently low in mTBK1 (). Thus, 4HPR induces the accumulation of mainly unphosphorylated SQSTM1 in mTBK1 MNs.
We further explored the flux of SQSTM1 autophagic degradation at baseline and under 4HPR treatment: in particular, cells were treated with the lysosome acidification inhibitor bafilomycin A1. WB analysis of SQSTM1 levels revealed that whereas CTRL cells accumulate SQSTM1 under 4HPR treatment, accumulation was further enhanced by bafilomycin A1-4HPR co-treatment, implying that the net increase in SQSTM1 is the result of transcriptional upregulation and increased degradation. Conversely, mTBK1 MNs accumulated much more SQSTM1 than CTRL cells in presence of 4HPR but this effect was not further enhanced by bafilomycin A1, suggesting that 4HPR does not increase SQSTM1 degradation in mTBK1 MNs, as would be expected in case of a flux blockade at the early stages of autophagy (Figure S7).
All together, these results demonstrate that the block occurring at the elongation phase, rather than an impaired lysosomal fusion, is the crucial detrimental bottleneck leading to the aberrant SQSTM1 accumulation in mTBK1 MNs.
We reasoned that the mismatch between upregulated SQSTM1 levels and reduced autophagic flux might be critical in driving mTBK1 MNs sensitivity to 4HPR. Therefore, restoring the balance between SQSTM1 levels and autophagic outflow may rescue 4HPR toxicity. Among the genes downregulated in mTBK1 MNs, which could be implicated in the ‘autophagy bottleneck’, we focused on ATG10 since this is directly involved in the elongation of the phagophore membrane upstream LC3 lipidation [Citation39]. Therefore, we sought to rescue the mismatch between SQSTM1 levels and the autophagy flux capacity by forcing ATG10 expression in mTBK1 MNs. Cells were transfected either with a plasmid encoding ATG10-GFP fusion protein or GFP alone, treated with 4HPR (or vehicle) for 24 h, and the burden of SQSTM1 aggregates was assessed. In vehicle treated mTBK1 MNs, the expression of GFP alone or ATG10-GFP did not alter the burden of SQSTM1+ aggresomes; however, whereas 4HPR treatment strongly increased SQSTM1 burden in GFP-expressing MNs, this effect did not appear in ATG10-GFP-expressing neurons; in fact, overexpression of ATG10 completely abolished 4HPR-induced accumulation of SQSTM1, indicating a complete clearing of the autophagic bottleneck (although ATG10 overexpression did not rescue the baseline burden of SQSTM1 in mTBK1 MNs; ).
Because ATG10 overexpression prevented the detrimental 4HPR-induced SQSTM1 accumulation, we investigated whether this might also be sufficient to rescue 4HPR toxicity on mTBK1 MNs. To this aim, we investigated the levels of CYCS in mutant MNs expressing either GFP or ATG10-GFP after 48 h of 4HPR: the treatment strongly upregulated CYCS in GFP-expressing mTBK1 MNs, but significantly less in ATG10-GFP-expressing MNs ().
4HPR leads SQSTM1 accumulation, ATG10 loss and aggresome formation also in c9orf72-mutant MNs
We then verified if the mismatch between 4HPR-activated autophagy and intrinsic autophagic bottlenecks might be a general feature of multiple ALS-related molecular defects. To this aim, we considered MNs derived from two hiPSC lines carrying different mutations in the FUS gene (mFUS-I and mFUS-II), or hexanucleotide expansion in the C9orf72 gene (mC9orf), compared to a control line (CTRL I) and to an isogenic control line in which the FUS mutations were corrected (all these lines have been previously reported [Citation21,Citation22]). In vehicle-treated cultures, neither the mFUS lines or corresponding CTRLs displayed SQSTM1 aggregates; although 4HPR produced a small increase in SQSTM1 burden, this was comparable in mFUS and CTRL MNs, indicating the absence of obvious autophagy bottlenecks due to FUS mutations ().
Vehicle-treated mC9orf MNs did not show any aberrant accumulation of SQSTM1+ inclusions compared to CTRL MNs; however, 24-h 4HPR treatment induced a significant accumulation of SQSTM1+ structures in the cell soma of mC9orf cells (), suggesting that mutations in TBK1 and in C9orf72 may converge on a pathogenic pathway selectively enhanced by RARA activation. Notably, although at baseline ATG10 levels were comparable in mC9orf and control lines, treatment with 4HPR induced a significant reduction of ATG10 levels in mC9orf MNs ().
Figure 6. 4HPR leads to ATG10 downregulation and aggresome accumulation in mC9orf MNs. (a and b) Representative confocal images of corrected mFUS (a); CTRL and mC9orf (b) MNs at DIV14 treated with vehicle or 4HPR (1 μM) for 24 h and immunolabeled against CHAT and SQSTM1. 4HPR does not trigger SQSTM1 accumulation in FUS-mutant MNs; in contrast, it induces a strong SQSTM1 accumulation in mC9orf (two-way ANOVA followed by Holm-Sidak´s multiple comparisons test; *p < 0.05). (c) Immunoblot analysis of endogenous ATG10 protein levels in CTRL and C9orf72 (C9orf) MNs at DIV14 treated with vehicle or 4HPR (1 μM) for 24 h (two-way ANOVA followed by Holm-Sidak´s multiple comparisons test: *p < 0.05). (d) TEM analysis of CTRL and mC9orf72 MNs at DIV14 treated with vehicle or 4HPR (1 μM) for 24 h. 4HPR increases in both genotypes the number of AVs (two-way ANOVA followed by Holm-Sidak´s multiple comparisons test; **p < 0.01), which are larger (black arrowheads) in mC9orf MNs (two-way ANOVA followed by Holm-Sidak´s multiple comparisons test; **p < 0.01). 4HPR eventually leads to accumulation of aggresomes in mC9orf MNs (two-way ANOVA followed by Holm-Sidak´s multiple comparisons test; *p < 0.05). Red arrowheads indicate double-membrane structures associated to high-sized AVs and aggresomes. Data information: immunocytochemistry was performed in N = 3 independent replicates and a minimum of n = 60 CHAT+ cells were analyzed. TEM analysis was performed in a minimum of n = 21 MNs from N = 2 independent replicates. Scale bars: (a and b) 10 μm, (d) 1 μm. Data are presented as mean ± SEM.
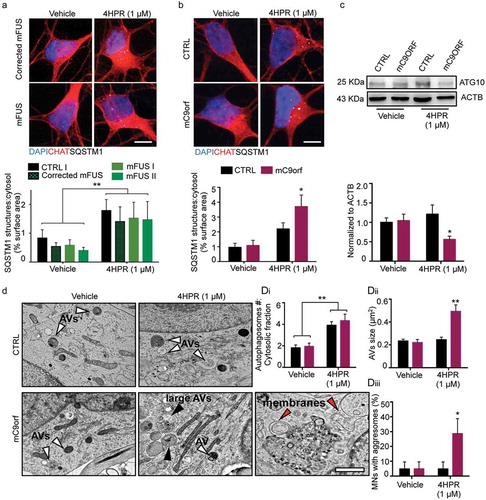
We then investigated by TEM the autophagy step that may be affected in mC9orf MNs. In contrast to what seen in mTBK1, mC9orf MNs accumulated free membranes (indicated in with red arrowheads) that did not bear the typical cup-shape of phagophores [Citation29]. Although 4HPR did not increase the number of AVs in mC9orf MNs, it did strongly increase the size of these structures (): whereas in 4HPR-treated CTRL cells AVs were almost invariably smaller than 0.5 μm2, in 4HPR-treated mC9orf MNs a large fraction of AVs was significantly larger (). Moreover, although at baseline CTRL and mC9orf MNs did not display aggresomes in TEM images, aggresome formation was triggered by 4HPR in mC9orf cells ().
These data show that RARA activation worsens the autophagic flux in MNs carrying TBK1 and C9orf72 (but not FUS) ALS-related mutations, in both cases leading to the accumulation of SQSTM1 aggresomes and the loss of ATG10, but interfering with autophagy at distinct steps of the pathway.
Discussion
In this study, we have shown that mutant TBK1 MNs derived from hiPSCs obtained from ALS patients display abnormal SQSTM1 aggregates and morphological and biochemical signs of altered autophagy, in particular (but not necessarily only) at the stage of the elongation phase. We have further shown that this phenotype is not easily reversed but can be worsened by RARA agonists, through a mechanism that involves a mismatch between SQSTM1 levels and the deficiency in ATG10 and TBK1 itself. In addition, the effect of RARA activation is not restricted to mTBK1 MNs only but also worsens autophagy in mC9orf MNs, again with accumulation of SQSTM1 and decrease in ATG10 but with accumulation of autophagosomes at later stages of maturation. Taken together, our work shows that increasing the autophagic flux is not a therapeutic solution for ALS if ‘autophagy bottlenecks’ are not solved at the same time, otherwise it results in decreasing MN fitness.
The accumulation of SQSTM1+ inclusions is a hallmark of ALS [Citation40] and it has already been described in clinical cases characterized by TBK1 mutations [Citation6,Citation8] as well as upon siRNA-mediated knockdown of TBK1 [Citation41]. Thus, the detection of SQSTM1 aggregates in our mTBK1 MNs suggests that they recapitulate critical cell-autonomous pathogenic pathways and further validate the use of SQSTM1 aggregates burden as a meaningful readout in modifier screening [Citation42]. In particular, mutations in TBK1 itself are sufficient to generate, via haploinsufficiency, a 50% decrease of TBK1 protein; we show that the consequence is a decreased efficiency of the elongation phase and, related to the slow-down of the autophagic flux, the accumulation of aberrant, membrane-bound perinuclear aggresomes [Citation27,Citation28].
Nevertheless, this finding raises the possibility of overcoming the cell-autonomous TBK1 dependent blockade of autophagy as therapeutic strategy for ALS. In particular, we elected to screen small molecules targeting nuclear receptors because of their favorable pharmacokinetics (they often cross the blood-brain-barrier), their large impact on transcriptional responses [Citation43–Citation46] and the availability of large sets of nuclear-receptor targeting compounds amenable of drug repurposing. We found that a whole class of RARA agonists is able to accelerate the accumulation of SQSTM1 and increase the rate of MN apoptosis. We showed that RARA activation effects were not due to an interference with MN differentiation in culture (no change in MN markers was observed, and retinoid treatment was applied for max 48 h) but rather to a direct effect on transcriptional programs. In fact, in control MNs RARA activation triggered (among many) the transcription of several genes involved in the autophagic pathway, in agreement with the role of RA as autophagy stimulator [Citation47].
Interestingly, 4HPR increased SQSTM1 levels in healthy MNs under the conditions of increased autophagic flux. Although one may expect reduced levels of SQSTM1 when autophagy is enhanced [Citation48,Citation49], an increase in SQSTM1 has already been shown to take place under retinoid-dependent autophagy induction [Citation50,Citation51], and in the specific case of mTBK1 MNs results from the mismatch between increased transcription of SQSTM1 and reduced degradation as results of failed phagophore maturation and the downregulation of several genes involved in the early phases of autophagy.
Interestingly, the accumulation of aberrant aggresomes observed at DIV14 in mTBK1 MNs, together with reduced LC3 lipidation and increased phagophore numbers, does not seem to alter the autophagic flux at an extent that might result as fatal (no MN loss was observed at this time point). In fact, flux analysis revealed that under normal conditions, despite the alterations mentioned above, in mutant MNs a relevant number of autophagosome is still able to undergo a complete maturation. Even if mTBK1 cells showed a population of abnormal large-sized LC3 yellow puncta already in vehicle-treated cells, this might indicate that at DIV14 mutant MNs are still able to overcome the detrimental alterations triggered by TBK1 mutations. In this scenario, induction of autophagy by 4HPR exacerbates the pathologic phenotype by further increasing the accumulation of SQSTM1 aggregates and phagophores (and of aberrantly large LC3 yellow structures), and eventually inducing MN death upon long-term treatment. Thus, it seems that autophagy induction in mTBK1 MNs results in accelerating the disease progression, as in normal conditions neuronal loss was firstly observed starting from DIV28.
In detail, the RARA-associated autophagic transcriptional program was significantly different in mTBK1 MNs: although SQSTM1/p62 was still upregulated, several other genes related to the downstream autophagic cascade were not, suggesting the onset of a possible imbalance between inflow and outflow in the autophagic pathway. In addition we identified ATG10 as an additional autophagy-related protein that was strongly downregulated in mTBK1 MNs (and retinoid-insensitive). Thus, our screening has revealed that coordinated transcriptional responses to upregulate autophagy in mTBK1 MNs are not feasible and, in the case of RARA activation, the incomplete response results in a detrimental outcome at the elongation phase.
Actually, the overload of the autophagic system at the elongation phase is coherent with the molecular alterations: TBK1 haploinsufficiency is associated with a significant downregulation of genes involved in the elongation phase such as ATG12, ATG4A, TMEM74 and the E2-like enzyme ATG10. This protein in particular plays a key role in the early phases of autophagosome formation, as it is required for the proper conjugation of the ATG12–ATG5-ATG16L1 complex [Citation52], which is fundamental for the autophagosomes’ membrane elongation [Citation39]. Thus, the reduced levels of these genes (and ULK2 as well) might disrupt the phagophore maturation at the very early stages, even before the recruitment of LC3 at the expanding double membrane [Citation53]. Binding of LC3 to the phagophore is in fact required to drive the formation of a mature autophagosome to completion and this, together with reduced ATG4A, should explain why mTBK1 MNs do not display changes in LC3-II levels while accumulating immature phagophores.
Of note, it has been shown that SQSTM1 itself is involved in the regulation of the elongation phase: in fact, in normal conditions SQSTM1 is phosphorylated by TBK1 and sequestrates the NFE2L2/NRF2 interactor KEAP1 to the forming autophagosome, releasing NFE2L2/NRF2 itself, which then activates the transcription of autophagy genes such as ATG4, ATG5, ATG9, ATG10, ATG16L1 and SQSTM1 itself [Citation54,Citation55]. So the massive increase in non-phosphorylated SQSTM1 (due to TBK1 loss, since TBK1 directly phosphorylates SQSTM1 at Ser403 [Citation56]) would correspond to a less efficient KEAP1 sequestration and suppression of NRF2-activated genes. In these conditions, further activation of the autophagy pathway would stall at the elongation phase because of a lack of critical factors for this stage [Citation15].
In addition, an increase in SQSTM1 levels may interfere directly with proper autophagic flux: in fact, SQSTM1 directly interacts with BCL2 freeing BECN1/Beclin 1 from this autophagy-repressive interaction [Citation57]. Thus, the upregulation of SQSTM1 may make larger amounts of BECN1 available to start the autophagic pathway; to date, the role of SQSTM1 phosphorylation in this process is not well understood. Furthermore, upon clustering in aggregates, SQSTM1 has been shown to trigger the apoptosis cascade by recruiting and activating caspase-8 [Citation58,Citation59]. Although the upregulation of un-phosphorylated SQSTM1 may not be the only entry point for RARA-induced worsening of mTBK1-associated autophagy impairment (considering the large number of genes modified by RARA in the human genome) and reduced MNs survival, it may nevertheless play a significant part in the process; in fact, mutations in SQSTM1 are causally linked to ALS [Citation60], and pathogenic mutations in SQSTM1 have been shown to affect the binding of SQSTM1 with KEAP1 [Citation61]. Thus, our investigation reveals that RA may act as non-genetic modifier of ALS-related pathobiochemistry in MNs that, nevertheless, converges on genetically-determined pathogenic cascades.
Although alterations in the RA-signaling pathway have been identified in ALS disease progression [Citation62], the effect of RA activation in ALS mouse models has been controversial. Riancho et al. have reported a neuroprotective effect of the synthetic retinoid Bexarotene (administered at a 100 mg/kg body weight/day dose), which increased the body weight and the lifespan of SOD1G93A mice [Citation63]. In contrast, a previous work demonstrated that lower doses (30 mg/kg body weight/day) of retinoic acid decrease the lifespan of the same animal model [Citation64]. Our in vitro results (and in vivo results, unpublished) are in line with the latter findings, suggesting that administration of RARA agonists without simultaneous removal of ‘autophagy bottlenecks’ would result in worsening of the disease progression. This effect is not restricted to RA alone: although earlier studies suggested that autophagy induction would be sufficient to clear intracellular aggregates [Citation65], studies in mammalian models have repeatedly demonstrated that administration of the MTOR inhibitor and autophagy stimulator Rapamycin to SOD1G93A mice increases the burden of misfolded SOD1, amplifies the ER stress and shortens the survival of the mice [Citation66,Citation67]. Likewise, stimulation of MTOR-independent autophagy by rilmenidine leads to accelerated MN degeneration and pathology progression in SOD1G93A mice [Citation68]. This model may apply also to non-neuronal cells: in muscle fibers, increased autophagy under the conditions of impaired intracellular trafficking results in myonecrosis [Citation69].
Interestingly, we show that ATG10 deficiency can be triggered in C9orf72-mutant MNs by retinoid treatment, together with the appearance of abnormal autophagic structures. Thus, ‘autophagic bottlenecks’ may be not constitutively present but appear under stress conditions, raising the intriguing possibility that environmental factors may influence the appearance of disease in genetically predisposed subjects. Notably, ATG10 levels have been found to be downregulated also in a Parkinson mouse model displaying autophagy impairment [Citation70]; thus, the mismatch between induction and maturation of autophagy may be worth investigating in multiple misfolded proteinopathies.
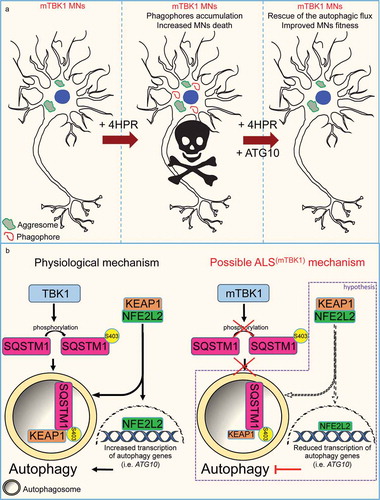
In conclusion, we have demonstrated that the response of mTBK1 to transcriptionally-driven autophagy induction (including SQSTM1 upregulation) is altered because of the pre-existing molecular alterations (ATG10 deficiency) which are downstream a cascade set in motion by the cell-autonomous haploinsufficiency of the kinase itself. We further show that in these conditions, any further activation of the autophagy machinery is incomplete and may result in detrimental effects (in agreement to what shown also by Saxena and Roselli [Citation67]). The resulting ‘autophagy bottlenecks’, either constitutive (TBK1-mutant) or induced (C9orf72-mutant) could be possibly difficult to address at transcriptional level (none of our nuclear receptor modulator proved able to circumvent it) although they may be addressed by other approaches (e.g., at the kinase level [Citation71];). Therefore, the potential therapeutic effect of autophagy induction seems to be only of clinical relevance for the treatment of ALS patients, once the autophagy machinery is reestablished and properly working ().
Figure 7. Schematic representation of the autophagy mismatch model in mTBK1 MNs. (a) In the present study we show that due to an impaired autophagic flux, mTBK1 MNs accumulate aberrant cytosolic SQSTM1-positive aggresomes. Treatment with 4HPR induces a mismatch between phagophore formation and the ability of these structures to undergo proper maturation, and this eventually leads to increased MNs death upon prolonged treatment. The mismatch is rescued by re-establishment of ATG10 levels, which also exerts an overall beneficial effect on MNs fitness. (b) Speculative mechanistic hypothesis: in absence of pathogenic mutations TBK1 phosphorylates SQSTM1, which promotes autophagy and sequesters KEAP1 from its interaction partner NFE2L2/NRF2. This releases NFE2L2, which can promote the transcription of autophagy-related genes such as ATG10. In the present study we have shown that ALS-related TBK1 mutations lead to reduced SQSTM1 phosphorylation and impaired autophagy. We speculate (purple frame) that this might disrupt the positive feedback loop orchestrated by SQSTM1 and its interaction with the KEAP1-NFE2L2 complex: lack of SQSTM1 activation might limit KEAP1 degradation and lead to a subsequent reduced release of NFE2L2: as a consequence NFE2L2 transcriptional activity is downregulated leading to a reduced transcription of autophagy genes.
Materials and methods
Generation and cultivation of human iPSCs
For creating hiPSC lines, human keratinocytes derived from ALS patients’ hair were reprogrammed as previously described [Citation18–Citation21]. Briefly, keratinocytes (75% confluence) were treated with 5 × 10⁵ proviral genome copies for two subsequent days and transferred to previously irradiated (30Gy) rat embryonic fibroblasts feeder cells. Keratinocytes were kept in a 5% O2 incubator and cultured in hiPSC medium so composed: KnockOutTM DMEM (Gibco, 10,829–018), 20% KnockOutTM Serum Replacement (Gibco, 10,828,028), 2 mM GlutaMAXTM (Gibco, 35,050,061), 100 mM MEM non-essential amino acids (NEAA) (Gibco, 11,140–035), 1% antibiotic–antimycotic (Gibco, 15,240–062), 100 mM β-mercaptoethanol (Millipore, ES-007-E), 50 mg/ml vitamin C (Sigma-Aldrich, A4403), and 10 ng/ml FGF-2 (PeproTech, 100-18C)). After 15–20 d of cultivation hiPSCs growing in colonies with the characteristic morphology started to be detectable. hiPSC colonies were then mechanically detached and further cultivated on feeder-free plates using mTeSR1 medium (Stem Cell Technologies, 83850).
Human iPSCs characterization
We characterized the newly created hiPSC lines according to previously published protocols [Citation18] or using the StemLite Pluripotency Kit (Cell Signaling Technology, 9656S). For spontaneous in vitro differentiation into the 3 germ layers, hiPSC colonies were mechanically lifted transferred in T75 low-attachment flasks (Corning, 3814). Embryoid bodies (EBs) formation was performed in suspension in hiPSC medium for 10 d. Afterwards, EBs were plated on 35-mm μDishes (Ibidi, 81156) and kept in culture for up to 14 d. Differentiated EBs were stained against representative markers of Endoderm, Ectoderm and Mesoderm.
Karyograms of all generated hiPSC lines were analyzed to exclude chromosomal aberrations after reprogramming and performed according to standard procedures [Citation18]. Briefly, 2 confluent wells of a 6-well-plate were treated with 1.5 M colchicine (Eurobio, CCHCLC00-JA) for 2 h to conserve metaphases. hiPSCs showed normal male/female karyotypes (Figure S1(d)).
The 2 mFUS cell lines, as well as the corrected-FUS line, were already characterized [Citation22]. Specifically, in the present study we used the mFUS lines carrying the R495QfsX527 and the Asp502ThrfS∗27 mutation. The ‘corrected-mFUS’ line corresponds to the isogenic control created from the R495QfsX527 line using Clustered regularly interspaced short palindromic repeats (CRISPR) technology.
MNs differentiation, treatment and transfection
MNs were differentiated from hiPSCs using the protocol published by Shimojo and collaborators [Citation23] with minor modifications. In brief, cells were detached and cultivated in suspension in ultra-low attachment flasks T75 (Corning, 3815) for 3 d for the formation of EBs in hESC medium: DMEM-F12 (Gibco, 31331-028), 20% KnockOutTM (Gibco, 10828028) serum replacement, 1% NEAA, 1% β-mercaptoethanol, 1% antibiotic-antimycotic, 10 µM SB-431542 (Stemcell Technologies, 72232), 1 µM dorsomorphin (Tocris, 3093), 3 µM CHIR 99021 (Stemcell Technologies, 72054), 1 µM pumorphamine (Miltenyi Biotec, 130-104-465), 150 µM vitamin C, 500 µM cAMP (Sigma-Aldrich, D0260), 1% Neurocult supplement (Stemcell Technologies, 05731), 0.5% N2 supplement (Gibco, 17502-284). At the fourth day, medium was switched to MN Medium: DMEM/F12 (Gibco, 31331-028), 24 nM sodium selenite (Sigma-Aldrich, S5261), 16 nM progesterone (Sigma-Aldrich, P8783), 0.08 mg/mL apotransferrin (Sigma-Aldrich, T2036), 0.02 mg/mL Insulin (Sigma-Aldrich, 91077C), 7.72 μg/mL putrescine (Sigma-Aldrich, P7505), 1% NEAA, 1% antibiotic-antimycotic, 50 mg/mL heparin (Sigma-Aldrich, H4783), 10 μg/mL of the neurotrophic factors BDNF (Peprotech, 450-02), GDNF (Peprotech, 450-10), and IGF1 (Peprotech, 100-11), 10 µM SB-431542, 1 µM dorsomorphin, 3 µM CHIR 99021, 1 µM pumorphamine, 150 µM vitamin C, 1 µM retinoic acid, 500 µM cAMP, 1% Neurocult supplement, 0.5% N2 supplement. After 5 d of cultivation, EBs were dissociated into single cells with Accutase (Sigma-Aldrich, A6964) and plated onto μDishes (Ibidi, 81156), μPlates (Ibidi, 89626) or 6-well plates (Corning, 353046) previously coated with Growth Factor Reduced Matrigel (Corning, 356231). MNs were further cultivated up to 42 d, and processed at the desired time point for the specific experiments.
To perform the screening of nuclear receptor ligands library (Enzo, BML-2802-0100), MNs were seeded onto 96-well μPlates (Ibidi, 89626) and cultivated for 14 d. At DIV14, MNs were then treated for 24 h with the compounds of the commercial library (diluted 1:1000 from the stock solution provided from the supplier in MN-medium). Each chemical was tested in 2 different replicates for each plate, and the whole library was screened twice in N = 2 independent experiments. After treatment, cells were fixed and immunostained (see below) against CHAT and SQSTM1.
All the other treatments using 4HPR (Tocris, 1396), ATRA (Tocris, 0695) and BMS195614 (Tocris, 3660), as well as time-course and dose response experiments for 4HPR, were performed at doses and times as indicated in each experiment of the results section. Bafilomycin A1 (Sigma-Aldrich, B1793) was used at a concentration of 100 nM alone or in combination with 4HPR to evaluate the degradation of SQSTM1. All the chemicals were dissolved in DMSO (Sigma-Aldrich, D4540), which was also used in every experiment as control (vehicle).
Overexpression experiments were performed at DIV14 by using LipofectamineTM3000 (Thermo Fisher Scientific, L3000015) following the protocol provided by the supplier. The autophagic flux was assessed by transfecting CTRL and mTBK1 MNs with a previously published ptfLC3 (Addgene, 21074; Tamotsu Yoshimori) encoding mRFP1-EGFP-LC3 [Citation34].
ATG10 overexpression was performed using a commercial plasmid (Sino Biological, HG15519-ANG), and a commercially available GFP-reporter construct was used as control (Oligo Engine, VEC-PRT-0005/0006). Three days after transfection, MNs were tested for GFP-positive signal, treated with 4HPR, fixed and immunostained against CHAT and SQSTM1 or CYCS.
Immunocytochemistry
Immunochemical analysis was performed as previously described in standard protocols [Citation18–Citation22]. hiPSCs and MNs were fixed by using 4% paraformaldehyde (Sigma-Aldrich, P6148) and 10% sucrose (Carl Roth, 4621.1) in PBS (Gibco, 14190-094). After fixation, cells were incubated for 2 h with blocking-permeabilization solution (PBS + 10% goat serum [Millipore, S26-100ML] + 0.1% Triton X-100 [Roche, 10789704001]), and the same solution was used for the primary antibodies incubation (48 h at 4°C). Afterwards cells were washed with PBS, incubated with Alexa Fluor TM 488 goat anti-mouse IgG (Invitrogen, A11036), Alexa Fluor TM 568 goat anti-rabbit IgG (Invitrogen, A32723) or Alexa Fluor TM 647 goat anti-chicken IgY (Invitrogen, A21449) secondary antibodies (diluted 1:1000 in PBS), washed again and mounted with ProLong Gold Antifade reagent with DAPI (Invitrogen, P36935).
To analyze the SQSTM1 load, a region of interest (ROI) was manually drawn to highlight the somata of CHAT-positive cells (excluding the nucleus) and used to calculate the area occupied by bright SQSTM1 puncta after thresholding. Values were expressed as ratio between SQSTM1 area above threshold and the total area of the ROI.
The colocalization between SQSTM1+ structures and aggresomes markers was evaluated in single optical sections acquired with confocal microscopy (see below). Aggresomes were detected using the PROTEOSTAT® Aggresome detection kit (Enzo, ENZ-51035-0025) by incubating the detection dye overnight at 4°C in blocking solution together with the other primary antibodies.
To calculate the amount of apoptotic MNs, the signal of CASP3 staining was thresholded and then merged with the SLC18A3/VACHT signal. Cells showing a colocalizing signal for both markers were scored as apoptotic MNs. The analysis was performed considering the entire field of view acquired (20x magnification).
For the analysis of MNs treated with the nuclear receptor ligands library, we measured the intensity of SQSTM1 signal within the MNs somata. Each compound was tested twice in separate wells and the complete screening was performed twice (4 independent wells for each small molecule, 30 MNs were randomly selected and analyzed from each well). The same threshold and image settings were used to analyze the different cell lines among independent experiments. A complete list of the primary antibodies used is available in .
Table 1. Complete list of the primary antibodies used in this study.
Western blot
Western blots were performed as previously described [Citation72]. Briefly, protein concentration was determined by Bradford Assay. Equal amounts of protein were separated on 10–12% SDS-PAGE, transferred to a nitrocellulose membrane (GE Healthcare Life Sciences, 10600021) with a Trans-Blot Turbo device (Bio-Rad, USA). Non-specific binding sites were blocked using a 5% BSA (BIOFROXX, 1126GR100) solution diluted in TBS (50 mM Tris-Cl [PanReac Applichem, A2264], 150 mM NaCL [Honeywell Fluka, 31434], pH 7.5) for 2 h, and then membranes were probed with the corresponding primary antibody overnight. After incubation with primary antibody, blots were washed 3 times with TBS + 0.2% TWEEN (Carl Roth, 9127.1), incubated with HRP-conjugated secondary anti-mouse (Dako, P0448) or anti-rabbit (Dako, P0260) antibody, and again washed 3 times. Membranes were developed using an ECL detection kit (Thermo Fischer Scientific, 32106) and acquired with MicroChemi 4.2 device (DNR Bio Imaging System, Israel). For quantification, Gel-analyzer Software 2010a was used. Values were normalized against the loading control ACTB/β-actin. A complete list of the primary antibodies used is available in .
PathScan® Akt signaling antibody array kit detection and analysis
The phospho-AKT array (Cell Signaling Technology, 9474) was performed according to the manufacturer’s instructions. Briefly, at DIV14 MNs were lysate, centrifuged and stored as dry pellet at −80°C until usage. The antibody array was blocked for 2 h with 100 μl of Array Blocking Buffer. After discarding the blocking buffer, 75 μl of sample lysate (diluted in blocking buffer to a concentration of 1 μg/μl) was added to each sub-array and incubated overnight at 4°C on an orbital shaker. Sample lysate was discarded and each sub-array was washed 4 × 5 min with Array Wash Buffer. After washing, the Detection Antibody cocktail was added to each sub-array and incubated for 1 h at room temperature (RT). Arrays were then washed 4 × 5 min with Wash Array Buffer, before being incubated with Streptavidin-Alexa Fluor 647 conjugated (Thermo Fisher Scientific, S32357; diluted 1:1000) for 30 min at RT on an orbital shaker. After 30 min the arrays were once again washed, briefly rinsed in distilled water, air-dried, and scanned in a Genepix 4000B microarray scanner (Molecular Devices, San Jose, USA). The 16-bits images obtained were analyzed by quantifying the fluorescence intensity using ImageJ software. We used a fixed-size circular ROI to detect the signal of each spot in the array. The values for 3 replicated spots were used for quantification, after excluding the spots showing artifacts (dust grains, crystals, damaged spot area). Local background was assessed for each spot and subtracted. The fluorescence intensity value was expressed as relative to the average value of the corresponding analyte in the CTRL MNs.
qRT-PCR
RNA isolation from hiPSCs and MNs was performed using the RNeasy Mini kit (Qiagen, 74104) as described by the manufacturer. First strand synthesis and quantitative real-time-PCR amplification were performed in a one-step, single-tube format using the QuantiFast™ SYBR Green RT-PCR kit (Qiagen, 208054) according to the manufacturer’s instructions in a total volume of 20 µl. All the primers used for qRT-PCR were purchased (Qiagen QuantiTect Primer Assays, Qiagen; validated primers without sequence information). The following settings were used: 10 min at 55°C and 5 min at 95°C, followed by 40 cycles of PCR for 5 s at 95°C for denaturation and 10 s at 60°C for annealing and elongation (one-step). The SYBR Green I reporter dye signal was measured against the internal passive reference dye (ROX) to normalize non-PCR-related fluctuations. Resulting data were normalized to HMBS or GAPDH expression levels. The Rotor-Gene Q software (version 2.0.2) was used to calculate the cycle threshold values. All experiments were performed in technical triplicate.
The RT2 Profiler™ PCR Array Human Autophagy (Qiagen, PAHS-084Z) was performed following the instructions. Briefly, after isolation with RNeasy Mini kit (Qiagen, 74104), RNA was eluted in a total of 15 μL RNAse-free water (Qiagen, 129112). Genomic DNA elimination and cDNA synthesis were performed with 800 ng RNA using the RT2 First Strand Kit (Qiagen, 330404) as described by the manufacturer. Quantitative real-time PCR screening was performed using the RT2 SYBR Green qPCR Mastermix (Qiagen, 330501) in a volume of 20 μL for each reaction.
DNA sequence analysis
To identify the mutations in TBK1 gene carried by the newly created hiPSC lines, genomic DNA was isolated using a DNeasy kit (Qiagen, 69504) and sequencing was performed by Eurofins Genomics (Germany). The sequences of mTBK1 cells were compared to sequences obtained from CTRL DNA with the same primers (Figure S1(a)). A list of the primer used is available in Table S3.
Microscopy
Fluorescence images were acquired with an upright Axioscope 2 microscope (Carl Zeiss, Jena, Germany) equipped with a Zeiss CCD camera (16 bits; 1280 ppi × 1024 ppi) and either a 20x air or a 63x oil immersion objective using Axiovision software.
Confocal images were acquired with a DMi8 laser-scanning microscope (Leica Microsystems, Wetzlar, Germany) equipped with an ACS APO 20x or 63 x oil DIC immersion objective. Images were acquired with a resolution of 1024 × 1024 pixels and a number of Z-stacks (step size of 0.2 μm) enough to span the complete cell soma.
For screening of the nuclear receptor ligands library, images were acquired with an ImageXpress Micro Confocal (Molecular Devices, San Jose, CA, USA) automatic microscope.
Transmission electron microscopy (TEM)
To perform TEM analysis, samples were fixed by high-pressure freezing [Citation73]. Briefly, MNs were cultivated onto sapphire discs (Engineering Office M. Wohlwend, Sankt Gallen, Switzerland) and at the indicated time point of cultivation, the sapphire discs were removed from the plates and dipped once in 95% 1-hexadecene (Merck Millipore, 822064). Two sapphire discs oriented face-to-face and separated by a gold ring (Plano, G2620A; 3.05 mm diameter) were mounted into a holder (Engineering Office M. Wohlwend, Sankt Gallen, Switzerland) and placed into a Wohlwend HPF Compact 01 high-pressure freezer (Engineering Office M. Wohlwend, Sankt Gallen, Switzerland). The samples were frozen with liquid nitrogen at a pressure of 2100 bar. After high-pressure freezing, the sapphire discs were separately incubated in 1.5 mL precooled (−87°C) sample tubes filled with 1 mL freeze substitution solution: 0.2% osmium tetroxide (Sigma-Aldrich, 20816120), 0.1% uranyl acetate (Merck Millipore, 8473), 5% dH2O in acetone (Sigma-Aldrich, 32201). After the tube had been warmed up to 0°C the samples were washed 3 times with 1 mL 100% acetone and transferred into a clean tube containing 0.25 mL 100% epoxy resin (Honeywell Fluka, 45345-1L-F) and incubated for 24 h at 60°C to polymerize. The samples were stored at RT after polymerization. For specimen preparation, 70- to 100-nm-thick sections were cut off from the epoxy resin block parallel to the plane of the sapphire disc with an Ultracut UCT ultramicrotome (Leica, Wetzlar, Germnay) equipped with a diamond knife (Science Services, Munich, Germany). After mounting the slice onto a 300-mesh copper grid (Plano, G2300C-M), sections were stained with 0.3% lead citrate (Agar Scientific, AGR1210) for 1 min, washed with dH2O and dried at RT. The samples were examined with a Jeol JEM 1400 (Jeol, Tokyo, Japan) transmission electron microscope at 100 kV. Images were randomly recorded with an exposure time of 14,000 milliseconds and saved with a resolution of 4 megapixels (2.048 × 2.048). Images were then manually analyzed using ImageJ program. Since chemical differentiation of MNs from hiPSCs leads to impure cultures, we analyzed only cells in which we could identify protrusions extending from the soma, which resembled dendrites or axons. Aggresomes were identified as large, non-perfectly round shaped and membrane-bound structures enclosing in their lumen membrane and organelle residuals, as well as electron-dense material. We considered aggresomes only those structures with a minimum size of 0.250 μm2. The size of every aggresomes was then measured manually and plotted in ratio to the portion of cytosol visible in the picture (excluding the nucleus).
Autophagic structures were identified following recent criteria [Citation35,Citation36,Citation48]: AVs were identified as round-shaped vesicles (size range from 0.1 to 1 μm2), showing either electron-dense or empty lumen. The vesicles matching these criteria presenting a double membrane were scored as early AVs (resembling autophagosomes), while those presenting a single membrane were scored as late AVs (resembling autolysosomes). AVs were manually counted and plotted as number of structures per cell.
Phagophores were identified as double-membrane, open structures with a minimum length of 0.1 μm.
Data and statistical analysis
Analysis of fluoresce- and transmission electron microscopy was performed by a researcher (AC) unaware of experimental conditions (genotype and treatment).
Fluorescence and TEM images were analyzed using the ImageJ software. Data collection and statistical analysis was performed using Microsoft Excel, GraphPad Prism (Version 7) and RStudio software. All experiments were performed in a minimum of N = 3 independent replicates (independent differentiations) if not differently stated in the figure legends.
Statistical analysis was performed as follow: nonparametric Mann-Whitney test was used to compare 2 independent groups; One-Way ANOVA followed by the Sidak’s correction for multiple comparisons was used to evaluate differences among multiple groups; two-way ANOVA followed by the Holm-Sidak’s correction for multiple comparisons was used to analyze the effect of different treatments among different groups. Statistical significance was set at p < 0.05.
To analyze data obtained from the Array Human Autophagy, raw Ct-Values quantile normalization and differential expression analysis between samples was performed using the High throughput qPCR Bioconductor package [Citation74]. Significantly differentially expressed genes were identified using a limma (linear models and differential expression for microarray data [Citation75];) wrapper within HTqPCR.
Because every hiPSC line is derived from a different individual, they were considered as biological replicates. Therefore, all the independent technical replicates of individual experiments are depicting variances within a single individual, which are then compared to all the other cell lines. For this reason, we decided to display the data as mean ± S.E.M.
Moreover, to improve the readability and the comprehension of some figures we graphically displayed only the statistical comparison (and associated significances) between healthy (CTRL lines) and ALS (mTBK1 lines) genotypes.
Ethics approval
All procedures with human material were in accordance with the ethical committee of the Ulm University (Nr.0148/2009 or 265/12) and in compliance with the guidelines of the Federal Government of Germany. The use of human material was approved by the Declaration of Helsinki concerning Ethical Principles for Medical Research Involving Human Subjects. All participants gave informed consent for the study.
Supplemental Material
Download Zip (4.2 MB)Acknowledgments
The authors are thankful to Maja Manz for the technical support. The authors are also thankful to Paul Walther and Renate Kunz for the support with TEM and high pressure freezing. The authors would like also to thank Dr. Andreas Till, University of Bonn, for providing the plasmid ptfLC3 (Addgene plasmid # 21074) encoding mRFP1-EGFP-LC3 (generated by Tamotsu Yoshimori and first described in Kimura et al. 2007), and Prof. Jan Tuckermann for the helpful collaboration.
Disclosure statement
No potential conflict of interest was reported by the authors.
Supplementary material
Supplemental data for this article can be accessed here.
Correction Statement
This article has been republished with minor changes. These changes do not impact the academic content of the article.
Additional information
Funding
Related Research Data
References
- Pomerantz JL, Baltimore D. NF-kappaB activation by a signaling complex containing TRAF2, TANK and TBK1, a novel IKK-related kinase. Embo J. 1999;18(23):6694–6704.
- Xie X, Zhang D, Zhao B, et al. IkappaB kinase epsilon and TANK-binding kinase 1 activate AKT by direct phosphorylation. Proc Natl Acad Sci U S A. 2011;108(16):6474–6479.
- Wild P, Farhan H, McEwan DG, et al. Phosphorylation of the autophagy receptor optineurin restricts Salmonella growth. Science. 2011;333(6039):228–233.
- Matsumoto G, Shimogori T, Hattori N, et al. TBK1 controls autophagosomal engulfment of polyubiquitinated mitochondria through p62/SQSTM1 phosphorylation. Hum Mol Genet. 2015;24(15):4429–4442.
- Herman M, Ciancanelli M, Ou Y-H, et al. Heterozygous TBK1 mutations impair TLR3 immunity and underlie herpes simplex encephalitis of childhood. J Exp Med. 2012;209(9):1567–1582.
- Awadalla MS, Fingert JH, Roos BE, et al. Copy number variations of TBK1 in Australian patients with primary open-angle glaucoma. Am J Ophthalmol. 2015;159(1):124–130.
- Cirulli ET, Lasseigne BN, Petrovski S, et al. Exome sequencing in amyotrophic lateral sclerosis identifies risk genes and pathways. Science. 2015;347(6229):1436–1441.
- Freischmidt A, Wieland T, Richter B, et al. Haploinsufficiency of TBK1 causes familial ALS and fronto-temporal dementia. Nat Neurosci. 2015;18(5):631–636.
- Williams KL, McCann EP, Fifita JA, et al. Novel TBK1 truncating mutation in a familial amyotrophic lateral sclerosis patient of Chinese origin. Neurobiol Aging. 2015;36(12):3334.e1–3334.e5.
- Gijselinck I, Van Mossevelde S, van der Zee J, et al. Loss of TBK1 is a frequent cause of frontotemporal dementia in a Belgian cohort. Neurology. 2015;85(24):2116–2125.
- Van der Zee J, Gijselinck I, Van Mossevelde S, et al. TBK1 mutation spectrum in an extended european patient cohort with frontotemporal dementia and amyotrophic lateral sclerosis. Hum Mutat. 2017;38(3):297–309.
- Pozzi L, Valenza F, Mosca L, et al. TBK1 mutations in Italian patients with amyotrophic lateral sclerosis: genetic and functional characterisation. J Neurol Neurosurg Psychiatry. 2017 Oct;88(10):869–875. doi:10.1136/jnnp-2017-316174. Epub 2017 Aug 19.
- Larabi A, Devos JM, Ng SL, et al. Crystal structure and mechanism of activation of TANK-binding kinase 1. Cell Rep. 2013;3(3):734–746.
- Richter B, Sliter DA, Herhaus L, et al. Phosphorylation of OPTN by TBK1 enhances its binding to Ub chains and promotes selective autophagy of damaged mitochondria. Proc Natl Acad Sci U S A. 2016;113(15):4039–4044.
- Pilli M, Arko-Mensah J, Ponpuak M, et al. TBK-1 promotes autophagy-mediated antimicrobial defense by controlling autophagosome maturation. Immunity. 2012;37(2):223–234.
- Mossevelde S, van der Zee J, Gijselinck I, et al. Clinical features of TBK1 carriers compared with C9orf72, GRN and non-mutation carriers in a Belgian cohort. Brain. 2016;139(Pt 2):452–467.
- Blokhuis AM, Groen EJN, Koppers M, et al. Protein aggregation in amyotrophic lateral sclerosis. ACTA Neuropathol. 2013;125(6):777–794.
- Somers A, Jean JC, Sommer CA, et al. Generation of transgene-free lung disease-specific human iPS cells using a single excisable lentiviral stem cell cassette. Stem Cells. 2010;28(10):1728–1740.
- Takahashi K, Yamanaka S. Induction of pluripotent stem cells from mouse embryonic and adult fibroblast cultures by defined factors. Cell. 2006;126:663–676.
- Aasen T, Raya A, Barrero MJ, et al. Efficient and rapid generation of pluripotent stem cells from human keratinocytes. Nat Biotechnol. 2008;26:1276–1284.
- Linta L, Stockmann M, Kleinhans KN, et al. Rat embryonic fibroblasts improve reprogramming of human keratinocytes into induced pluripotent stem cells. Stem Cells Dev. 2012;21(6):965–976.
- Higelin J, Demestre M, Putz S, et al. FUS mislocalization and vulnerability to DNA damage in ALS patients derived hiPSCs and aging motoneurons. Front Cell Neurosci. 2016;10:290.
- Shimojo D, Onodera K, Doi-Torii Y, et al. Rapid, efficient, and simple motor neuron differentiation from human pluripotent stem cells. Mol Brain. 2015;8(1):79.
- Cooper JM, Ou YH, McMillan EA, et al. TBK1 provides context-selective support of the activated AKT/mTOR pathway in lung cancer. Cancer Res. 2017;77(18):5077–5094.
- Chen W, Luo K, Ke Z, et al. TBK1 promote bladder cancer cell proliferation and migration via Akt signaling. J Cancer. 2017;8(10):1892–1899.
- Bjørkøy G, Lamark T, Brech A, et al. p62/SQSTM1 forms protein aggregates degraded by autophagy and has a protective effect on huntingtin-induced cell death. J Cell Biol. 2005;171(4):603–614.
- Taylor JP, Tanaka F, Robitschek J, et al. Aggresomes protect cells by enhancing the degradation of toxic polyglutamine-containing protein. Hum Mol Genet. 2003;12(7):749–757.
- Miller SB, Mogk A, Bukau B. Spatially organized aggregation of misfolded proteins as cellular stress defense strategy. J Mol Biol. 2015;427(7):1564–1574.
- Hao Y, Lu Q, Yang G, et al. Lin28a protects against postinfarction myocardial remodeling and dysfunction through Sirt1 activation and autophagy enhancement. Biochem Biophys Res Commun. 2016;479(4):833–840.
- Sigurdsson V, Takei H, Soboleva S, et al. Bile acids protect expanding hematopoietic stem cells from unfolded protein stress in fetal liver. Cell Stem Cell. 2016 Apr 7;18(4):522–532. doi:10.1016/j.stem.2016.01.002. Epub 2016 Jan 28.
- Kalveram B, Schmidtke G, Groettrup M. The ubiquitin-like modifier FAT10 interacts with HDAC6 and localizes to aggresomes under proteasome inhibition. J Cell Sci. 2008;121:4079–4088.
- Kawaguchi Y, Kovacs J, McLaurin A, et al. The deacetylase HDAC6 regulates aggresome formation and cell viability in response to misfolded protein stress. Cell. 2003;115(6):727–738.
- Evans RM, Mangelsdorf DJ. Nuclear receptors, RXR, and the big bang. Cell. 2014;157(1):255–266.
- Kimura S, Noda T, Yoshimori T. Dissection of the autophagosome maturation process by a novel reporter protein, tandem fluorescent-tagged LC3. Autophagy. 2007;3(5):452–460.
- Biazik J, Ylä-Anttila P, Vihinen H, et al. Ultrastractural relationship of the phagophore with surrounding organelles. Autophagy. 2015;11(3):439–451.
- Mizushima N, Yamamoto A, Hatano M, et al. Dissection of autophagosome formation using Apg5-deficient mouse embryonic stem cells. J Cell Biol. 2001;152(4):657–668.
- Lovat PE, Ranalli M, Annichiarrico-Petruzzelli M, et al. Effector mechanisms of fenretinide-induced apoptosis in neuroblastoma. Exp Cell Res. 2000;260(1):50–60.
- Ulukaya E, Pirianov G, Kurt MA, et al. Fenretinide induces cytochrome c release, caspase 9 activation and apoptosis in the absence of mitochondrial membrane depolarisation. Cell Death Differ. 2003;10(7):856–859.
- Shintani T, Mizushima N, Ogawa Y, et al. Apg10p, a novel protein-conjugating enzyme essential for autophagy in yeast. Embo J. 1999;8(19):5234–5241.
- Mizuno Y, Amari M, Takatama M, et al. Immunoreactivities of p62, an ubiquitin-binding protein, in the spinal anterior horn cells of patients with amyotrophic lateral sclerosis. J Neurol Sci. 2006;249(1):13–18.
- Sellier C, Campanari ML, Corbier C, et al. Loss of C9ORF72 impairs autophagy and synergizes with polyQ Ataxin-2 to induce motor neuron dysfunction and cell death. Embo J. 2016;35(12):1276–1297.
- Cha-Molstad H, Lee SH, Kim JG, et al. Regulation of autophagic proteolysis by the N-recognin SQSTM1/p62 of the N-end rule pathway. Autophagy. 2018;14(2):359-361. doi: 10.1080/15548627.2017.1415190. Epub 2018 Jan 29.
- Malm T, Mariani M, Donovan LJ, et al. Activation of the nuclear receptor PPARδ is neuroprotective in a transgenic mouse model of Alzheimer’s disease through inhibition of inflammation. J Neuroinflammation. 2015;12:7.
- Lv Y, Zhang L, Li N, et al. Geraniol promotes functional recovery and attenuates neuropathic pain in rats with spinal cord injury. Can J Physiol Pharmacol. 2017;23:1–7.
- Bajbouj K, Shafarin J, Abdalla MY, et al. Estrogen-induced disruption of intracellular iron metabolism leads to oxidative stress, membrane damage, and cell cycle arrest in MCF-7 cells. Tumour Biol. 2017;39(10):1010428317726184.
- Cao H, Xie J, Guo L, et al. All-trans retinoic acid induces autophagic degradation of ubiquitin-like modifier activating enzyme 3 in acute promyelocytic leukemia cells. Leuk Lymphoma. 2017;29:1–9.
- Zhong C, Pu LY, Fang MM, et al. Retinoic acid receptor α promotes autophagy to alleviate liver ischemia and reperfusion injury. World J Gastroenterol. 2015;21(43):12381–12391.
- Klionsky DJ, Abdalla, FC, Abeliovich, H, et al. Guidelines for the use and interpretation of assays for monitoring autophagy (3rd edition). Autophagy. 2016;12(2):443.
- Yoshii SR, Mizushima N. Monitoring and measuring autophagy. J Mol Sci. 2017;18(9).
- Trocoli A, Bensadoun P, Richard E, et al. p62/SQSTM1 upregulation constitutes a survival mechanism that occurs during granulocytic differentiation of acute myeloid leukemia cells. Cell Death Differ. 2014;21:1852–1861.
- Trocoli A, Mathieu J, Priault M, et al. ATRA-induced upregulation of Beclin 1 prolongs the life span of differentiated acute promyelocytic leukemia cells. Autophagy. 2011;7:1108–1114.
- Nemoto T, Tanida I, Tanida-Miyake E, et al. The mouse APG10 homologue, an E2-like enzyme for Apg12p conjugation, facilitates MAP-LC3 modification. J Biol Chem. 2003;278(41):39517–39526.
- Rubinsztein D, Shpilka T, Elazar Z. Mechanisms of autophagosome biogenesis. Curr Biol. 2012;22(1):R29–R34.
- Komatsu M, Kurokawa H, Waguri S, et al. The selective autophagy substrate p62 activates the stress responsive transcription factor Nrf2 through inactivation of Keap1. Nat Cell Biol. 2010;12(3):213–223.
- Pajares M, Jimenez-Morenoa N, Garcia-Yaguea AJ, et al. Transcription factor NFE2L2/NRF2 is a regulator of macroautophagy genes. Autophagy. 2016;12(10):1902–1916.
- Matsumoto G, Wada K, Okuno M, et al. Serine 403 phosphorylation of p62/SQSTM1 regulates selective autophagic clearance of ubiquitinated proteins. Mol Cell. 2011;44(2):279–289.
- Zhou L, Wang H, Ren H, et al. Bcl-2-dependent upregulation of autophagy by sequestosome 1/p62 in vitro. Acta Pharmacol. 2013;34(5):651–656.
- Huang S, Okamoto K, Yu C, et al. p62/sequestosome-1 up-regulation promotes ABT-263-induced caspase-8 aggregation/activation on the autophagosome. J Biol Chem. 2013;288(47):33654–33666.
- Zeng RX, Zhang YB, Fan Y, et al. p62/SQSTM1 is involved in caspase-8 associated cell death induced by proteasome inhibitor MG132 in U87MG cells. Cell Biol Int. 2014;38(10):1221–1226.
- Teyssou E, Takeda T, Lebon V, et al. Mutations in SQSTM1 encoding p62 in amyotrophic lateral sclerosis: genetics an neuropathology. Acta Neuropathol. 2013;125(4):511–522.
- Goode A, Rea S, Sultana M, et al. ALS-FTLD associated mutations of SQSTM1 impact on Keap1-Nrf2 signalling. Mol Cell Neurosci. 2016;76:52–58.
- Maden M. Retinoic acid in the development, regeneration and maintenance of the nervous system. Nat Rev Neurosci. 2007;8(10):755–765.
- Riancho J, Ruiz-Soto M, Berciano MT, et al. Neuroprotective Effect of Bexarotene in the SOD1(G93A) Mouse Model of Amyotrophic Lateral Sclerosis. Front Cell Neurosci. 2015;9:250.
- Crochemore CL, Virgili M, Bonamassa B, et al. Long-term dietary administration of valproic acid does not affect, while retinoic acid decreases, the lifespan of G93A mice, a model for amyotrophic lateral sclerosis. Muscle Nerve. 2009;39(4):548–552.
- Cheng CW, Lin MJ, Shen CK. Rapamycin alleviates pathogenesis of a new Drosophila model of ALS-TDP. J Neurogenet. 2015;29(2–3):59–68.
- Zhang X, Li L, Chen S, et al. Rapamycin treatment augments motor neuron degeneration in SOD1(G93A) mouse model of amyotrophic lateral sclerosis. Autophagy. 2011;7(4):412–425.
- Saxena S, Roselli F, Singh K, et al. Neuroprotection through excitability and mTOR required in ALS motoneurons to delay disease and extend survival. Neuron. 2013;80(1):80–96.
- Perera ND, Sheean RK, Lau CL, et al. Rilmenidine promotes MTOR-independent autophagy in the mutant SOD1 mouse model of amyotrophic lateral sclerosis without slowing disease progression. Autophagy. 2018;14(3):534-551. doi:10.1080/15548627.2017.1385674. Epub 2017 Dec 17.
- Ching JK, Ju JS, Pittman SK, et al. Increased autophagy accelerates colchicine-induced muscle toxicity. Autophagy. 2013;9(12):2115–2125.
- Shams Nooraei M, Noori-Zadeh A, Darabi S, et al. Low level of autophagy-related gene 10 (ATG10) Expression in the 6-Hydroxydopamine Rat Model of Parkinson’s Disease. Iran Biomed J. 2018;22(1):15–21.
- Imamura K, Izumi Y, Watanabe A, et al. The Src/c-Abl pathway is a potential therapeutic target in amyotrophic lateral sclerosis. Sci Transl Med. 2017;9(391).
- Grabrucker AM, Schmeisser MJ, Udvardi PT, et al. Amyloid beta protein-induced zinc sequestration leads to synaptic loss via dysregulation of the ProSAP2/Shank3 scaffold. Mol Neurodegener. 2011;6:65.
- Villinger C, Schauflinger M, Gregorius M, et al. Three-dimensional imaging of adherent cells using FIB/SEM and STEM. Methods Mol Biol. 2014;1117:617–638.
- Huber W, Carey VJ, Gentleman R, et al. Orchestrating high-throughput genomic analysis with Bioconductor. Nat Methods. 2015;12:115.
- Smyth GK. Limma: linear models for microarray data. In: Gentleman R, Carey V, Dudoit S, et al., editors. Bioinformatics and computational biology solutions using R and Bioconductor. New York: Springer; 2005. p. 397–420.