
ABSTRACT
The ubiquitin-proteasome pathway (UPP) is central to proteostasis network (PN) functionality and proteome quality control. Yet, the functional implication of the UPP in tissue homeodynamics at the whole organism level and its potential cross-talk with other proteostatic or mitostatic modules are not well understood. We show here that knock down (KD) of proteasome subunits in Drosophila flies, induced, for most subunits, developmental lethality. Ubiquitous or tissue specific proteasome dysfunction triggered systemic proteome instability and activation of PN modules, including macroautophagy/autophagy, molecular chaperones and the antioxidant cncC (the fly ortholog of NFE2L2/Nrf2) pathway. Also, proteasome KD increased genomic instability, altered metabolic pathways and severely disrupted mitochondrial functionality, triggering a cncC-dependent upregulation of mitostatic genes and enhanced rates of mitophagy. Whereas, overexpression of key regulators of antioxidant responses (e.g., cncC or foxo) could not suppress the deleterious effects of proteasome dysfunction; these were alleviated in both larvae and adult flies by modulating mitochondrial dynamics towards increased fusion or by enhancing autophagy. Our findings reveal the extensive functional wiring of genomic, proteostatic and mitostatic modules in higher metazoans. Also, they support the notion that age-related increase of proteotoxic stress due to decreased UPP activity deregulates all aspects of cellular functionality being thus a driving force for most age-related diseases.
Abbreviations
ALP: autophagy-lysosome pathway; ARE: antioxidant response element; Atg8a: autophagy-related 8a; ATPsynβ: ATP synthase, β subunit; C-L: caspase-like proteasomal activity; cncC: cap-n-collar isoform-C; CT-L: chymotrypsin-like proteasomal activity; Drp1: dynamin related protein 1; ER: endoplasmic reticulum; foxo: forkhead box, sub-group O; GLU: glucose; GFP: green fluorescent protein; GLY: glycogen; Hsf: heat shock factor; Hsp: Heat shock protein; Keap1: kelch-like ECH-associated protein 1; Marf: mitochondrial assembly regulatory factor; NFE2L2/Nrf2: nuclear factor, erythroid 2 like 2; Opa1: optic atrophy 1; PN: proteostasis network; RNAi: RNA interference; ROS: reactive oxygen species; ref(2)P: refractory to sigma P; SQSTM1: sequestosome 1; SdhA: succinate dehydrogenase, subunit A; T-L: trypsin-like proteasomal activity; TREH: trehalose; UAS: upstream activation sequence; Ub: ubiquitin; UPR: unfolded protein response; UPP: ubiquitin-proteasome pathway.
Introduction
All critical cellular functions are performed by highly sophisticated protein machines [Citation1] and thus it is not surprising that proteome homeodynamics (proteostasis) is central for cellular functionality and the overall healthspan of organisms. Proteome stability in cells is assured by the proteostasis network (PN), a modular integrated system which ensures proteome quality control at basal conditions and also during conditions of increased proteome instability (also referred to as proteotoxic stress) by addressing the triage decision of fold, hold, or degrade [Citation2]. Key components of the PN are the protein synthesis and sorting/trafficking machineries, the endoplasmic reticulum (ER) unfolded protein response (ER-UPR), the molecular chaperones and the 2 main degradation machineries, namely the autophagy-lysosome (ALP) and the ubiquitin-proteasome (UPP) pathways [Citation3,Citation4]. Additional modules of the PN can also be considered the stress responsive signaling pathways (e.g., heat or oxidative), including those of Foxo (forkhead box, sub-group O), Hsf (heat shock factor) and NFE2L2/Nrf2 (nuclear factor, erythroid 2 like 2) transcription factors. NFE2L2/Nrf2 is involved in cell protection against xenobiotic or oxidative damage that abrogate the KEAP1-mediated proteasomal degradation of NFE2L2/Nrf2 and induce its nuclear accumulation. In the nucleus, NFE2L2/Nrf2 heterodimerizes with the MAF bZIP transcription factor (known in Drosophila as maf-S) protein on antioxidant response elements (AREs) to induce the expression of antioxidant and phase II genes [Citation5].
ALP is mainly involved in the degradation of damaged organelles and protein aggregates and consists of microautophagy, chaperone-mediated autophagy and macroautophagy [Citation6,Citation7]. In macroautophagy, double-membrane vesicles (autophagosomes) are formed by the participation of the autophagy-related (ATG) proteins that capture lipids, proteins or organelles and transfer them to lysosome for degradation [Citation8]. ALP can also degrade ubiquitinated substrates via the action of microtubule-associated HDAC6 (histone deacetylase 6) and SQSTM1 (sequestosome 1; also known as p62) (SQSTM1/p62) which directly binds to ubiquitinated protein aggregates [Citation9]. On the other hand, UPP ensures protein synthesis quality control in both the ER (via the ER-associated proteasome degradation) and the cytosol, and it degrades normal short-lived ubiquitinated proteins and non-repairable misfolded or unfolded proteins [Citation10]. The 26S eukaryotic proteasome is a complicated protein machine of ~2.5 MDa that comprises a 20S core particle (CP) bound to 19S regulatory particles (RP) [Citation11,Citation12]. The 20S CP consists of 4 stacked heptameric rings (2 α type surrounding 2 of β type) that form a barrel-like structure; the caspase- (C-L), trypsin- (T-L), and chymotrypsin- (CT-L) like peptidase activities are located at the beta 1 (β1), beta 2 (β2) and beta 5 (β5) (known as Prosβ1, Prosβ2 and Prosβ5 in Drosophila) proteasomal subunits, respectively. The 19S RP is involved in substrate recognition, deubiquitination, unfolding and translocation into the 20S CP [Citation10]. Ubiquitinated polypeptides are degraded by the 26S proteasome [Citation13], while non-native (e.g. oxidized) polypeptides are likely degraded by the 20S proteasome via chaperone-mediated targeting [Citation14].
Increased proteotoxic stress in mitochondria triggers a specific UPR response (MT-UPR) [Citation10]. MT-UPR induces the outer mitochondrial membrane associated degradation (OMMAD) [Citation15], mitophagy, or even apoptosis if the disruption of mitostasis is irreversible [Citation16,Citation17]. Studies in yeast and Drosophila show that UPP modulates mitochondrial dynamics (i.e. fission and fusion) by degrading key modulators of mitochondrial fusion, namely fzo [(fuzzy onions), a spermatocyte-specific mitofusin] in Drosophila; FZO1 in yeast, or mammalian MFN1 and MFN2 [Citation18,Citation19]. In support, ubiquitination of the mammalian mitofusins MFN1 and MFN2 by PRKN/Parkin (parkin RBR E3 ubiquitin protein ligase) targets them for proteasomal degradation [Citation20]. Mitochondria undergo fusion and fission in order either to avoid damage accumulation or to respond to certain bioenergetic demands [Citation21]. Fusion rearranges the matrix content of a damaged mitochondrion with a healthy one, diluting thus mutated DNA copies and unfolded proteome, while fission drives mitochondrial division and elimination of damaged mitochondria by mitophagy [Citation22,Citation23].
The functionality of anti-stress responses [Citation5], proteostatic modules [Citation10] and mitochondria [Citation21] declines during aging and these events seem to fuel the appearance of aging and/or age-related diseases [Citation4,Citation24]. Accordingly, age is the major risk factor for several diseases, including diabetes, neurodegeneration and cancer [Citation25]. Notably, the impact of in vivo proteasome dysfunction on genome stability, or on other proteostatic or mitostatic modules functionality, along with the extent of functional wiring and cross-talk of these modules remains poorly understood. We have recently found that proteasome functionality in Drosophila is sex-, tissue- and age-dependent [Citation26]. Furthermore, by developing a model of pharmacological proteasome inhibition in adult flies, we have reported that prolonged impairment of proteasome function promotes several ‘old-age’ phenotypes and markedly reduces flies’ lifespan [Citation27].
As the mechanistic details of these findings are not clear, we sought to genetically phenocopy these effects by RNAi-mediated knock down (KD) of 20S or 19S proteasomal subunits. We report here that KD of proteasome subunits in Drosophila induced lethality at early developmental stages. Analyses in larvae revealed that proteasome dysfunction enhanced genomic instability, caused activation of proteostatic modules and promoted loss of mitostasis that triggered cncC (cap-n-collar isoform-C, the fly ortholog of NFE2L2/Nrf2)-dependent upregulation of mitostatic genes. These toxic effects were alleviated in larvae and adult flies either by alterations in mitochondrial dynamics that favored mitochondrial fusion or by inducing autophagy.
Results
KD of proteasomal subunits reduces proteasome functionality and causes excessive proteome and genome instability
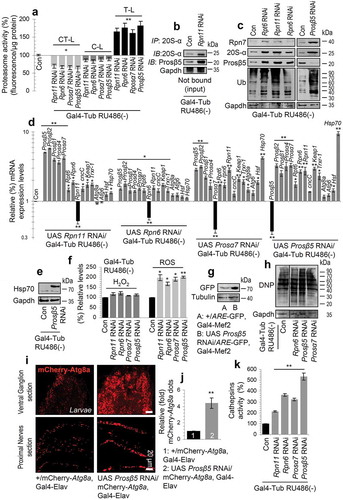
First, we sought to genetically phenocopy the effects induced after pharmacological proteasome inhibition in adult flies [Citation27]. Thus, we knocked down 20S (Prosα7, Prosα4, Prosβ5, Prosβ1) or 19S (Rpn11, Rpn10, Rpn6, Rpt6) proteasomal subunits genes. We found that inducible ubiquitous KD of the Prosα4 (20S regulatory), Rpn10 (19S polyubiquitin receptor) and Rpt6 (19S ATPase) subunits genes was not developmentally lethal; yet, hatched flies had defective locomotion (not shown) and reduced longevity (Figure S1; statistics of the longevity curves are reported in Table S1). Ubiquitous KD due to low levels of leaky (non-induced) transgene expression [Citation27] of the Rpn11 (19S deubiquitinase), Rpn6 (molecular clamp that holds the 20S and 19S particles), Prosα7 (20S regulatory), Prosβ5 (CT-L activity) and Prosβ1 (C-L activity) proteasomal subunits genes caused larval growth retardation (see below), defective locomotion and lethality at larval/early pupal stages. Analyses in larval (while viable) tissues after KD of the Rpn11, Rpn6, Prosα7 and Prosβ5 genes showed reduced main proteasomal peptidase activities (Figure 1(a)) and triggered an array of counteracting responses, including enhanced proteasome assembly rates (), upregulation of other proteasomal protein subunits () and genes () along with the induction of additional antioxidant (cncC, Keap1, Trxr-1) and proteostatic (Atg8a, Atg6, Hsf, Hsp70) genes (). These results coincided with increased Hsp70 protein expression levels (), as well as with higher levels of ROS (); consistently, by using an AREs-GFP reporter line we observed activation of AREs in the Prosβ5 KD background (). Also, we found increased proteome carbonylation (), while studies with a mCherry-Atg8a reporter line revealed the increased expression of the autophagic Atg8a protein in larvae nervous tissues after proteasome KD (); furthermore, proteasome KD enhanced activities of lysosomal cathepsins ().
Figure 1. RNAi-mediated KD of 20S or 19S proteasomal subunits disrupts proteasome functionality resulting in proteome instability and the activation of PN modules. (a) Relative (%) 26S proteasome activities (vs. control) after KD of the shown proteasomal subunits. (b) Immunoblot analyses after immunoprecipitation of shown tissue lysates with a 20S-α antibody and probing with antibodies against Prosβ5 and 20S proteasome subunit α (20S-α). (c) Immunoblot analyses (after KD of the indicated proteasomal subunits) of tissue protein samples probed with antibodies against proteasomal subunits Rpn7, 20S-α, Prosβ5 and ubiquitin (Ub). (d) Relative expression (vs. control) of Prosβ5, Prosβ2, Prosβ1, Prosα4, Prosα7, Rtp6, Rpn6, Rpn11, cncC, Keap1, Trxr-1, Atg8a, Atg6, Hsf and Hsp70 genes following KD of the shown proteasomal subunits. (e) Immunoblot showing Hsp70 expression after KD of the Prosβ5 proteasomal subunit. (f) Relative (%) H2O2 and ROS levels in mitochondria and in larvae tissues respectively, after KD of the shown proteasomal subunits. (g) Immunoblot showing GFP expression in the GstD1-ARE:GFP/II reporter line after KD of the Prosβ5 proteasomal gene. (h) Immunoblot analyses of total protein carbonylation (dinitrophenol, DNP) in flies’ tissues after Rpn6, Prosβ5 and Prosα7 KD. (i) CLSM visualization of the mCherry-Atg8a and (j) quantification (vs. control) of mCherry-Atg8a dots in the nervous tissues of larvae expressing Prosβ5 RNAi. (k) Relative (%) cathepsin activities (CtsB1/CTSB, Cp1/CTSL) in larvae tissues of the indicated genotypes. In all cases (unless otherwise indicated) data refer to 3rd instar stage transgenic larvae not exposed to RU486 (driver, Gal4-Tub). Controls refer to larvae expressing mCherry RNAi. Gene expression was plotted vs. the respective control set to 1; in (a, f, k) control values were set to 100%. Gapdh (b, c, e, h) or Tubulin (g) probing and RpL32/rp49 gene expression (d) were used as input reference. Bars, ± SD; n ≥ 2; *P < 0.05; **P < 0.01.
These findings prompted us to perform high resolution iTRAQ proteomics in larvae tissues after KD of the rate limiting for protein breakdown CT-L catalytic Prosβ5 proteasomal subunit (Table S2). Results revealed that reduction of proteasome activity triggered the upregulation of several proteostatic modules including proteasomal subunits, molecular chaperons (Hsp70, Hsp23, Hsp26), as well as ref(2)P (the fly ortholog of mammalian SQSTM1/p62) and antioxidant proteins (Figure S2(a)). Interestingly, we also found reduced levels of the ribosomal structural protein RpS6, likely indicating defective protein synthesis. At the genomic level, targeted proteasome KD in larvae muscle tissues revealed the increased expression of His2Av (Histone H2A variant; the fly ortholog of human H2AFX) (Figure S2(b)) which forms extensive foci in nuclei (Figure S2(c)) containing condensed DNA (Figure S3) implying increased DNA damage.
Taken together these findings suggest that loss of proteasome function mobilizes the activation of antioxidant and proteostatic modules due to extensive genome and proteome instability.
Sustained decline of proteasomal functionality results in severe disruption of mitostasis
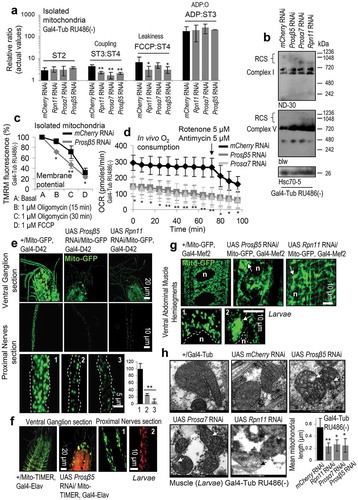
As our iTRAQ proteomics analyses showed the upregulation of the selective autophagy receptor protein ref(2)P, and proteasome KD in muscles expressing a Mito-GFP reporter revealed a disrupted mitochondrial network (Figure S2(c)), we then studied the effects of loss of proteasome function on mitochondrial functionality. We observed that proteasome KD decreased the mitochondrial respiratory control (ST3:ST4) and FCCP:ST4 ratios (Figure 2(a)), suggesting decreased substrate oxidation and mitochondrial coupling, along with increased proton leak. Furthermore, immunoblotting analyses for the complex I ND-30/NDUFS3 (NADH dehydrogenase [ubiquinone] 30 kDa subunit) subunit and complex V blw/ATP5F1A (bellwether) subunit revealed increased disassembly of respiratory chain complexes and supercomplexes (, S4(a)). Also, proteasome KD compromised the mitochondrial membrane potential and permeability () and it significantly reduced in vivo O2 consumption, rendering mitochondria non-responsive to respiration inhibitors (i.e. rotenone or antimycin) (). Proteasome KD in the larval nervous system led to decreased Mito-GFP reporter signal () revealing a significant (>70%) reduction of mitochondria (, right lower panel), while studies with larvae coexpressing the Mito-TIMER reporter (shifts to red fluorescence when it is oxidized) showed a significant increase in mitochondrial oxidation (). Similar findings were noted after muscle targeted proteasome KD where we also found that the physiological tubular mitochondrial network collapses into mitochondrial aggregates and/or large perinuclear clusters (); this phenotype represents a well-known feature of on-going cell death [Citation28,Citation29] and/or mitophagy due to mitochondria depolarization [Citation30]. Supportively, EM analyses showed the significant disruption of mitochondria fine structure, including disrupted cristae and outer membrane integrity (). These structural defects were accompanied with reduced mitochondrial size likely due to enhanced fission (, right lower panel) and increased mean cristae width (Figure S4(b)). Notably, loss of mitostasis due to proteasome KD triggered the induction of genes involved in mitochondrial dynamics [Marf (the single ortholog in Drosophila of mammalian mitofusins MFN1, MFN2), Opa1, Drp1], energetics (ATPsynβ, SdhA) and proteolysis (Lon), which, as found after treating control or cncC KD larvae with the specific proteasome inhibitor PS-341 [Citation27] was cncC-dependent (Figure S5).
Figure 2. Sustained decline of proteasome activities results in severe disruption of mitostasis. (a) Relative mitochondrial ST3:ST4, FCCP:ST4 and ADP:ST3 ratios or actual ST2 values after KD of the shown proteasomal subunits. (b) Immunoblots after BN-PAGE (1% Triton X-100) for the analysis of mitochondrial RCS assembly, and probing with antibodies against ND-30/NDUFS3 (complex I) and blw/ATP5F1A (complex V); mitochondria were isolated from larvae tissues expressing Prosβ5, Prosα7 or Rpn11 RNAi transgenes. (c) Relative TMRM fluorescence in isolated mitochondria from larvae of the shown genotypes after the addition of 1 μM oligomycin for 15, 30 min or 1 μM FCCP. (d) In vivo O2 consumption (Seahorse apparatus) in larvae expressing Prosβ5 or Prosα7 RNAi transgenes; the time point of rotenone and antimycin addition is indicated by an arrow. (e) CLSM visualization of mitochondria (Mito-GFP reporter) in the nervous system of larvae after KD of the Prosβ5 or Rpn11 genes; quantification of visible mitochondria in proximal nervous sections is shown in lower right graph. (f) Representative CLSM images of oxidized mitochondria (red color; Mito-TIMER reporter) after targeted Prosβ5 RNAi in larvae nervous system. Labels 1, 2, 3 in (e) refer to genotypes +/Mito-GFP, Gal4-D42; UAS Prosβ5 RNAi/Mito-GFP, Gal4-D42 and UAS Rpn11 RNAi/Mito-GFP, Gal4-D42 respectively, while in (f) labels 1, 2 refer to genotypes +/Mito-TIMER, Gal4-Elav and UAS Prosβ5 RNAi/Mito-TIMER, Gal4-Elav respectively. (g, h) CLSM (g) or EM (h) visualization of mitochondria in larvae muscle after KD of the shown proteasome subunits; in (g) nuclei (n) and perinuclear mitochondrial aggregates (arrows) are indicated, while in (h), stars indicate electron dense areas in mitochondria, and arrows disrupted mitochondrial cristae and outer membranes. Labels 1, 2 in (g) refer to genotypes +/Mito-GFP, Gal4-Mef2 and UAS Prosβ5 RNAi/Mito-GFP, Gal4-Mef2 respectively. Lower right panel in (h) indicates quantification of mean mitochondrial length. Unless otherwise indicated data refer to 3rd instar stage larvae not treated with RU486 (driver, Gal4-Tub). Controls referred to larvae expressing mCherry RNAi. In (c) control values were set to 100%. Hsc70-5 (HSPA9/Grp75) (b) probing was used as input reference. Bars, ± SD; n ≥ 2; *P < 0.05; **P < 0.01.
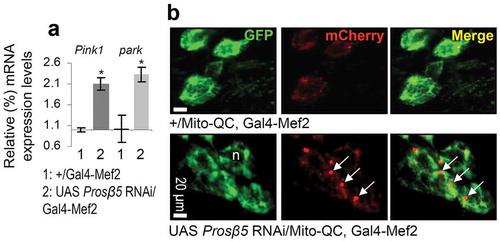
We then performed iTRAQ proteomics in mitochondria isolated from larvae tissues after proteasome KD. We found differential (vs. control) accumulation in mitochondria of molecular chaperones (Hsp70Bc, Hsp22, Hsp70Ab, Hsp23, Hsp26), proteasomal assembly factors (Pomp) or subunits (Prosβ7, Prosα4, Prosβ6), ref(2)P, the 40S RpS27A (ribosomal protein S27A), as well as a number of metabolism related proteins including GlyS (Glycogen synthase) and AMPKα (AMP-activated protein kinase α subunit) (Figure S6(a); Table S3). The dependence of mitochondrial proteome stability on proper UPP functionality was also evident by the accumulation of ubiquitinated and carbonylated proteins in mitochondria after proteasome KD (Figure S6(b)) corroborating previous observations in cell models (see Discussion) showing that UPP plays a major role in mitochondrial proteome quality control. These findings were further verified by Nano-LC-ESI-MS/MS proteomics analyses after Ub immunoprecipitation in isolated mitochondria (Table S4). Two of the most enriched proteins were RpS27A and the 60S RpL40 (ribosomal protein L40) proteins, which serve as cellular ubiquitin reservoirs and are also involved in ribosome biogenesis (Figure S6(c)); this observation further supports the extended functional crosslink of proteostatic and mitostatic modules. ref(2)P accumulation in larvae tissues was verified by Confocal Laser Scanning Microscope (CLSM) immunofluorescence studies after targeted proteasome KD in the nervous system (Figure S6(d)) or in muscles (Figure S6(e)), and also, by immunoblotting analyses (Figure S6(f)). In the former assays, ref(2)P was found to decorate mitochondrial aggregates in large perinuclear clusters (Figure S6(d,e)); in support, immunoblotting analysis showed increased ref(2)P accumulation in isolated mitochondria (Figure S6(g)), which, along with increased mitochondrial ubiquitination suggests enhanced rates of mitophagy. Previous studies of mitophagy regulation in flies were mostly focused at the large-scale developmentally programmed mitophagy in the shrinking pre-pupal gut [Citation31]; thus, we assayed on-going mitophagy under conditions of proteasome KD. We found that proteasome dysfunction increased colocalization of mCherry-Atg8a with ref(2)P (Figure S7(a)); upregulated Pink1 and park gene expression (Figure 3(a)), increased localization of a Mito-QC reporter (a tandem GFP-mCherry fusion protein of the outer mitochondrial membrane which turns red due to selective quenching of GFP in the acidic microenvironment of the lysosome) [Citation32] with lysosomes () and enhanced colocalization of blw/ATP5F1A-positive mitochondrial aggregates with GFP-Lamp1 (Figure S7(b)). Notably, in spite of enhanced expression of GFP-Lamp1 after KD of the Prosβ5 gene, LysoTracker Red staining in this particular genotype was reduced (Figure S8(a)), indicating that diminished energetics due to loss of mitostasis also affected the process of lysosomes acidification and likely their proteolytic activity. The noted collapse of lysosomal acidification mostly associated with Prosβ5 KD as it was not evident upon milder proteasome dysfunction, e.g. following KD of the 19S Rpn11 gene; in this case Mito-GFP colocalized with LysoTracker Red positive lysosomes (Figure S8(b)). In support, to a generalized collapse of cellular homeodynamics after KD of the Prosβ5 subunit we also noted that proteasome dysfunction resulted in Atg8a nuclear localization (Figure S7(a)); an indication of enhanced nucleophagy [Citation33,Citation34]. Additional studies with a Mito-GFP reporter after targeted Prosβ5 RNAi in larval nervous tissues showed a significant reduction of mitochondrial motility (Videos S1, S2; Figure S6(h)) suggesting decreased topical supply of energetic molecules [Citation35].
Figure 3. Increased expression of Pink1 and park genes and of mitophagy after KD of the β5 proteasomal subunit. (a) Relative expression (vs. control) of Pink1 and park genes following KD of the Prosβ5 proteasomal gene. (b) CLSM visualization of GFP and mCherry signal of the Mito-QC reporter in larval cells after RNAi of the Prosβ5 gene; white arrows indicate mCherry positive staining. The RpL32/rp49 gene expression (a) was used as input reference; n, nucleus. Bars, ± SD; n ≥ 2; *P < 0.05.
Interestingly, targeted proteasome KD in larval nervous tissues induced proteome instability in the muscle as indicated by ref(2)P accumulation not only in the targeted nervous tissue (Figure S9(a)) but also in adjacent muscles (Figure S9(b)). In support, targeted KD of the Prosβ5 gene in larval nervous system or in muscles increased proteome ubiquitination and carbonylation (i.e. proteome instability) not only in the targeted tissues but also in isolated larval muscles and brains, respectively (Figure S9(c)). These findings indicate the occurrence of cell non-autonomous systemic effects and a communication between alarm pathways engaged by proteotoxic stress in neurons or muscles that activate adaptive programs in peripheral organs to control systemic proteostasis and likely mitostasis. This observation is in line with our finding (not shown) that targeted RNAi-mediated KD of 20S (Prosβ5, Prosα7) or 19S (Rpn11) proteasomal genes in either muscle or nervous tissues caused (likewise ubiquitous proteasome KD) developmental lethality in larval and early pupal stages.
As mentioned, our proteomics analyses after proteasome KD also revealed alterations in the expression of metabolic proteins. This finding, along with the induced severe larval growth retardation due to declined proteasome activity (Figure S10(a), middle panel), support the notion of extensive metabolic stress and reprogramming of metabolic signaling. Indeed, proteasome KD resulted in significant reduction of energetic molecules, i.e. GLU, GLY and TREH, in larval tissues (Figure S9(d)).
Overall, loss of proteasome function, apart from genome and proteome instability, also results in defective mitostasis and likely extensive metabolic reprogramming.
Higher cncC or foxo expression levels cannot rescue the toxic effects of proteasome dysfunction
Our findings of the proteasome loss of function impact on the nervous tissue and cellular energetics largely explain the severe side-effects (e.g. peripheral neuropathy, cardiotoxicity) seen in the clinic by proteasome inhibitors (e.g. PS-341) used for cancer therapeutics [Citation36]. Given also that proteasome malfunction is a hallmark of aging and of several age-related diseases [Citation25] we sought to alleviate the toxic effects of proteasome KD by genetically modulating antioxidant, mitostatic or proteostatic pathways. We found that ubiquitous, nervous system or muscle targeted cncC or foxo upregulation in a Prosβ5 RNAi background could not rescue the proteasome KD mediated larval lethality or growth retardation (shown for cncC; Figure S10(a)). These effects were evident in spite of less intense (not for the Hsp70 gene and protein or ref(2)P) deregulation of proteostatic and mitochondrial genes expression (Figure S10(b,c)) and a minor improvement, after targeted cncC or foxo overexpression (OE) in the nervous system, of the mitochondrial network that correlated with a more dispersed ref(2)P localization pattern (Figure S10(d)). Similarly, muscle targeted cncC or foxo OE in a Prosβ5 RNAi background could not alleviate mitochondria aggregation and ref(2)P induction (Figure S10(e)); notably, targeted coexpression of cncC and Prosβ5 RNAi in the muscle resulted in very fragile larvae of a very small size (not shown). Consistently, targeted coexpression of Prosβ5 RNAi and cncC or foxo transgenes in the fly eye did not suppress the large necrotic scar (indicative of considerable cell death) caused after KD of the Prosβ5 proteasomal gene (Figure S10(f)).
Thus, enhancement of antioxidant responses cannot rescue the deleterious effects of proteasome KD.
Enhanced mitochondrial fusion mitigated proteasome dysfunction mediated loss of mitostasis and increased viability
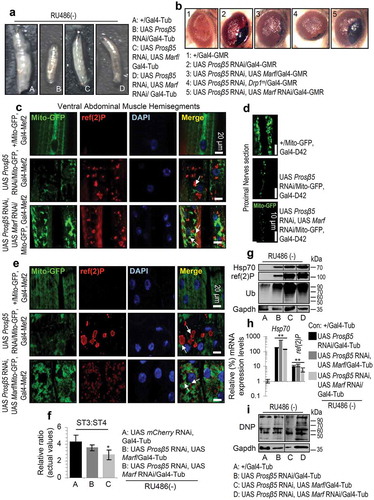
We then asked whether altered mitochondrial dynamics could alleviate the impact of declined proteasomal function. We found that enhancement of mitochondrial fusion by overexpressing Marf or a Drp1 mutant (insertion; Drp1m) alleviated larvae growth retardation (Figure 4(a)) and reduced the necrotic area seen after targeted proteasome KD in the adult eye (). These effects were not evident after Marf KD that shifts mitochondrial dynamics towards fission (). In support, Marf KD in a Prosβ5 RNAi background in the muscle enhanced perinuclear mitochondrial aggregation and ref(2)P expression (), while in the nervous system it did not restore mitochondrial network (). On the other hand, targeted muscle Marf OE in the Prosβ5 RNAi background largely restored the dense tubular mitochondrial network and resulted in a more dispersed ref(2)P expression pattern (); similarly, Drp1m expression in a Prosβ5 RNAi background increased mitochondria numbers in larvae muscles and nervous system (Figure S11). Furthermore, Marf OE (but not Marf KD) restored more physiological mitochondrial substrate oxidation rates and coupling (ST3:ST4 ratio) (; compare to 2A). Notably, gene and protein expression analyses showed that none of these genetic interventions could alleviate proteasome KD mediated loss of proteostasis, i.e. accumulation of Hsp70 and ref(2)P or increased proteome ubiquitination and carbonylation ().
Figure 4. Enhanced mitochondrial fusion partially rescued mitostasis albeit with no enhanced proteome stability. (a) Stereoscope viewing of 3rd instar control (+/Gal4-Tub) or transgenic larvae expressing the indicated transgenes. (b) Stereoscope viewing of control adult flies’ eyes (+/Gal4-GMR) or after targeted eye expression of the indicated transgenes. (c, d) CLSM viewing of Mito-GFP reporter along with immunofluorescence staining of tissues with a ref(2)P antibody and DAPI, in muscle (c) or nervous tissues (d; only Mito-GFP is shown) after KD of Prosβ5 or both the Prosβ5 and Marf genes. (e) CLSM visualization of Mito-GFP reporter in muscles of the shown transgenic larvae stained also for ref(2)P and counterstained with DAPI. (f) Relative mitochondrial ST3:ST4 ratio in tissues of the shown transgenic larvae. (g, i) Immunoblotting analyses of tissues protein samples from indicated transgenic larvae; samples were probed with antibodies against ref(2)P, Hsp70, ubiquitinated (Ub) (g) and carbonylated (DNP) (i) proteins. (h) Relative expression (vs. control) of Hsp70 and ref(2)P genes in 3rd instar control (+/Gal4-Tub) or transgenic larvae expressing the shown transgenes. If not otherwise indicated, data refer to 3rd instar stage larvae not exposed to RU486 (driver, Gal4-Tub). Arrows in (c), (e) indicate ref(2)P colocalization with aggregated mitochondria. Gapdh (g, i) probing was used as input reference. Bars, ± SD; n ≥ 2; *P < 0.05; **P < 0.01.
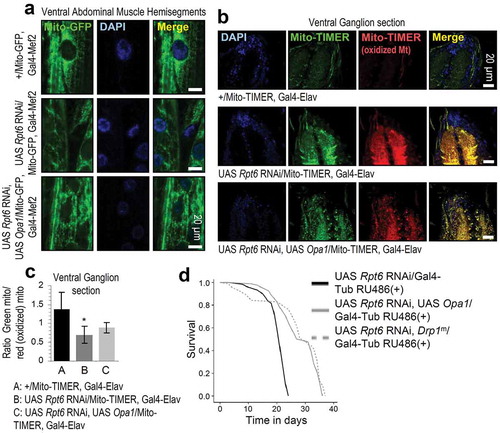
Given these findings, we then studied the effects induced by altered Opa1 expression levels; Opa1 is involved in fusion of mitochondrial inner membrane, cristae remodeling and energetics regulation [Citation37]. As our attempts to overexpress Opa1 in the Prosβ5 RNAi background failed likely due to no homologous recombination between these lines, we overexpressed Opa1 in flies expressing Rpt6 RNAi as these flies had a severe reduction in longevity (Figure S1). We found that Opa1 OE restored a more physiological density of the mitochondrial network (Figure 5(a)) and reduced mitochondrial oxidation of Rpt6 KD larvae in the ganglion after nervous system targeted expression (). Also, Opa1 OE or Drp1m significantly increased the longevity of Rpt6 KD flies ().
Figure 5. Enhancement of mitochondrial fusion mitigates loss of proteasome function effects on mitochondria. (a) CLSM viewing of Mito-GFP reporter in muscle tissues of shown genotypes. (b, c) CLSM viewing of Mito-GFP and Mito-TIMER reporters (b), along with quantification of green (not oxidized):red (oxidized) Mito-TIMER ratio (c) after targeted expression of the shown transgenes in larvae nervous system. (d) Longevity curves of flies overexpressing the shown transgenes. Statistics of the longevity curves are reported in Table S1. Bars, ± SD; n ≥ 2; *P < 0.05.
Taken together these findings indicate that modulation of mitochondrial dynamics towards mitochondrial fusion partially mitigates the toxic effects of proteasome KD on mitochondria functionality.
Autophagy activation ameliorated proteasome dysfunction-mediated proteome instability and partially rescued larvae lethality and adult flies’ accelerated aging
Next, we asked whether activation of the other main PN degradation axis, namely autophagy, could ameliorate the proteasome loss of-function toxicity. We observed that Atg8a upregulation could largely rescue the Prosβ5 RNAi mediated larvae growth retardation (Figures 6(a), S12(a)) and necrosis in the adult fly eye (). Double transgenic larvae looked healthier, were of a bigger size and more mobile; and died at latter development stages. Also, targeted expression of the transgenes in larvae muscles, reduced ref(2)P expression, increased mitochondrial staining () and restored a more physiological mitochondrial function as it largely normalized respiration and coupling (). Moreover, Atg8a upregulation significantly alleviated proteome instability as evidenced by reduced induction of proteasomal subunits, of ref(2)P and Hsp70 proteins () and of the Hsp70 gene (), as well as by reduced accumulation of ubiquitinated and carbonylated proteins (, S12(b), S12(c)). Consistently, Atg8a OE reduced proteome over ubiquitination and carbonylation induced by the specific proteasome inhibitor PS-341 in adult flies’ somatic tissues (Figure 7(a)). To provide further evidence that autophagy activation can alleviate proteasome KD-mediated proteotoxic stress in the adult somatic tissues we took advantage of the Rpt6 RNAi intervention which although enabled flies hatching it resulted in significantly reduced lifespan (Figure S1). We found that Atg8a OE in the Rpt6 RNAi background resulted in reduced proteome ubiquitination and carbonylation (); further, it increased the longevity of Rpt6 RNAied flies ().
Figure 6. Enhancing the expression of autophagic effectors (Atg8a) alleviates the proteasome dysfunction-induced loss of mitostasis and proteome instability. (a) Stereoscope viewing of 3rd instar control (+/Gal4-Mef2, +/Gal4-Tub) or transgenic larvae expressing the shown transgenes in muscles (Gal4-Mef2 driver) or ubiquitously (Gal4-Tub inducible driver). (b) Stereoscope viewing of adult transgenic flies’ eyes after eye-targeted Prosβ5 RNAi or combined Prosβ5 and GFP-Atg8a OE. (c) CLSM viewing of Mito-GFP reporter and of GFP-Atg8a, along with immunofluorescence staining of muscles tissues with a ref(2)P antibody and DAPI in shown transgenic larvae. (d) ST3:ST4 mitochondrial ratio in tissues of shown transgenic larvae. (e) Immunoblotting analyses of tissue protein samples from shown transgenic larvae; samples were probed with antibodies against Rpn6, 20S-α, ref(2)P, Hsp70, ubiquitinated (Ub) and carbonylated (DNP) proteins. (f) Relative expression (vs. control) of the Hsp70 gene in larvae or adult flies expressing the shown transgenes. Mhc, muscle specific driver; mRNA expression levels were assayed in dissected head (enriched in neural tissues) and thorax (enriched in muscle tissues) samples. Unless otherwise indicated, data refer to 3rd instar stage larvae not exposed to RU486 (driver, Gal4-Tub). Arrows in (c, lower panel) denote lysosome-like structures positive for GFP that colocalize with ref(2)P. Gapdh (e) probing was used as input reference. Bars, ± SD; n ≥ 2; **P < 0.01.
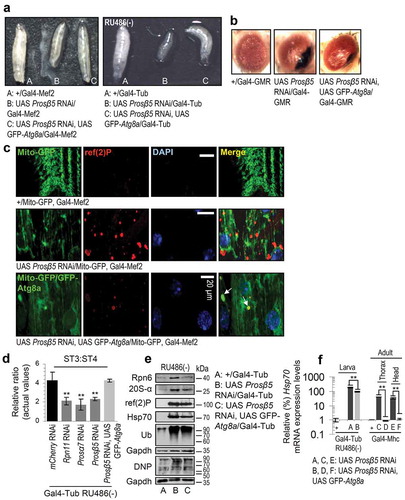
Figure 7. Atg8a OE in adult flies suppresses the toxic effects of proteasome KD and increases adult flies’ longevity. (a) Immunoblotting analyses of protein samples from shown transgenic flies somatic tissues; samples were probed with antibodies against GFP (denotes expression of the GFP-Atg8a transgene), ubiquitinated (Ub) and carbonylated (DNP) proteins. (b) Immunoblotting analyses of protein samples from shown transgenic flies somatic tissues; samples were probed with antibodies against ubiquitinated (Ub) and carbonylated (DNP) proteins. (c) Longevity curves of indicated transgenic fly lines. Statistics of the shown longevity curves are reported in Table S1. In (a) young flies were exposed to RU486 for 3 days and were then treated (or not) with RU486/1 μΜ PS-341 for 4 days, while in (b) young flies were exposed to RU486 for 7 days. Gapdh (a, b) probing was used as input reference.
Thus, the toxic effects of proteasome KD can be partially suppressed by Atg8a OE indicating that ALP activation can be protective against proteasome dysfunction-mediated proteome instability.
Discussion
Viability of metazoans largely depends on their capacity to mount anti-stress responses, as well as on their ability to regulate metabolic processes in order to produce energetic molecules. At the whole organism level, these responses require extremely complicated coregulation and wiring of cell autonomous and non-autonomous mechanisms. We report here that UPP is a central hub in the regulation of these networks as loss of proteasome function results in increased genomic, proteomic, mitostatic and, consequently, metabolic instability. In line with this notion, KD of proteasomal subunits in Drosophila caused developmental lethality; supportively, pharmacological inhibition of proteasomal activities in the adult fly accelerates aging [Citation27]. It is worth mentioning that, differently from our previously described inhibitor-based pharmacological model [Citation27], our herein used genetic approach likely decreased the amount of properly assembled proteasomes and/or it promoted the assembly of dysfunctional proteasomes lacking the targeted subunit. Our reported observations corroborate previous studies [Citation38,Citation39] and exemplify the increased proteolytic demands required for cell proliferation and morphogenesis during development. Notably, not all subunits are functionally equivalent for proper proteasome assembly or functionality, as KD of the 20S Prosα4 or the 19S Rpn10 and Rpt6 proteasomal genes was not lethal.
Our in vivo findings indicate that cells sense the decline of proteasome activity and respond by mobilizing the entire genome maintenance, proteostatic and antioxidant machineries. These data further extend previous in vivo and cell-based studies showing upregulation of proteasome genes after proteasome inhibition in Drosophila [Citation27,Citation40] or in human cells [Citation41]. Similarly, it has been reported that proteasome inhibition activates molecular chaperones via the transcription factor Hsf [Citation42]. Ubiquitinated substrates can also be degraded by autophagy via the ubiquitin-specific receptor SQSTM1/p62 [Citation9] (which as we found is significantly induced upon proteasome KD), indicating that SQSTM1/p62-mediated autophagy compensates for the loss of proteasome polyubiquitin recruiting capacity [Citation43]. Consistently, ALP is activated after silencing of proteasomal genes [Citation44] and it was suggested that it complements UPP for the degradation of polyubiquitinated proteins after proteasome dysfunction [Citation45]. Also, ALP activation likely relates to clearance of unstructured proteasomes via proteaphagy [Citation46]. Reportedly, this process depends on SQSTM1/p62 functionality and proteasome ubiquitination [Citation47]; and, indeed, we have previously found increased proteasome ubiquitination following its pharmacological inhibition [Citation27].
Due to mitochondria evolution and the physical isolation of their content, mitostatic pathways have been traditionally thought not to be regulated by UPP. Contrary to this notion, our findings suggest that proteasome loss-of-function causes severe mitochondrial dysfunction as demonstrated by the disruption of mitochondrial dynamics, energetics and cristae structure. Furthermore, the altered glycemic profile of larvae along with the severe growth retardation after proteasome KD suggest defective insulin/IGF-like signaling and metabolic deregulation [Citation48]. Thus, proteasome malfunction apart from disrupting genome integrity and PN functionality, it also affects the other critical arm of metazoans viability, namely regulation of metabolic processes and production of energy-related molecules. Supportively, UPP affects the precursor forms of Opa1 [Citation49] and it also mediates the degradation of intra-membrane space proteins before they arrive at the mitochondria [Citation50]; and of damaged mitochondrial proteins of the outer mitochondrial membrane [Citation15]. Also, proteomic analyses have identified over 100 mitochondrial proteins that can undergo ubiquitination [Citation51,Citation52], while UPP also affects mitochondria dynamics and motility by degrading proteins involved in these processes [Citation20,Citation21]. Loss-of mitostasis and PRKN-mediated ubiquitination of the outer mitochondrial membrane proteins recruits SQSTM1/p62 to mitochondria where it is thought to promote mitophagy due to its capacity to directly interact with the MAP1LC3/LC3 receptor [Citation20,Citation53] and to mediate (as was also shown here) mitochondrial perinuclear clustering [Citation53]. Our proteomics analyses on isolated mitochondria indicated significant alterations in mitochondrial proteome and also heavy loading with the ribosomal S27a and L40 protein forms of ubiquitin. As the ubiquitin moiety is removed from these fusion proteins during ribosome biogenesis, the accumulation of the unprocessed S27a and L40 protein forms also indicates significant distortion of ribosomal biogenesis and consequently protein synthesis. In support, deletion of either the RPL40A or RPL40B genes impairs 60S ribosomal subunit biogenesis in yeast [Citation54]. Whether the accumulation of these ubiquitin precursor proteins in mitochondria also relates to decoration of mitochondria with ubiquitin and to the downstream SQSTM1/p62-mediated mitophagy, along with the exact mechanisms involved in UPP-mediated degradation of the inner mitochondria compartment proteins remain to be elucidated.
Our previous studies have revealed cncC activation after proteasome inhibition [Citation27]; these observations are in line with our herein shown findings at the in vivo setting of the ARE-GFP reporter transgenic lines. Also, by using a fluorescent redox reporter we found that proteasome inhibition led to mitochondrial oxidation which, as shown before [Citation27] is followed by extensive cytosolic oxidation. This redox instability activates the cncC signaling pathway which, as we report here, apart from upregulating proteostatic and antioxidant modules it also induces mitostatic genes. In support, it has been recently shown that cncC regulates mitochondria turnover, biogenesis and energetics [Citation55,Citation56]. Thus, cncC is an immediate key sensor of altered mitochondrial energetics and/or ROS production, consistent with its tethering to the cytoplasmic side of the outer mitochondrial membrane, via interaction of Keap1, with the mitochondrial protein PGAM5 [Citation57].
Interestingly, we also observed that loss of proteasome function in the nervous system mobilizes systemic responses in muscles and vice versa. Similarly, unfolded protein stress in different sub-cellular compartments of the neuron, including mitochondria [Citation58], ER [Citation59] and cytoplasm [Citation60], possesses unique signaling properties that transmit the respective stress response information to distal tissues. Also, an aggregation-prone protein expressed in the neurons of Caenorhabditis elegans binds to mitochondria and elicits a global induction of MT-UPR that affects whole-animal physiology [Citation61]. Thus, the maintenance of organismal proteostasis depends on the integration of intracellular and external signals, involving the ability to detect molecular perturbations across different tissues and organs; nonetheless, the mediators of such signals remain to be identified.
Given that proteasome dysfunction is a hallmark of physiological aging and of several age-related diseases (e.g. neurodegeneration), as well as that treatment of tumor patients with proteasome inhibitors results in side-effects (e.g. peripheral neuropathy or cardiotoxicity) [Citation36] which are also seen in the fly model [Citation27,Citation62] we sought to alleviate the proteasome KD-mediated toxic effects by modulating proteostatic or mitostatic machineries. We found that induction of stress sensors (e.g. cncC or foxo) exerted no beneficial effect. In support, we have recently reported that inducible cncC OE suppresses longevity in adult flies [Citation27] and foxo OE is even more toxic (our unpublished data). On the other hand, OE of mitostatic modules that enhanced fusion balanced mitochondrial dynamics and partially mitigated the loss of proteasome function effects albeit with no signs of enhanced proteome stability. Mitochondrial dynamics are currently targets for the development of novel therapeutics [Citation63] and titration of mitochondrial fusion rescue Mff-deficient cardiomyopathy [Citation64]. Moreover, we have recently reported that Opa1 OE ameliorates the phenotype of two mitochondrial disease mouse models [Citation65]. On the other hand, heterozygous mutation of Opa1 in Drosophila shortens lifespan through increased ROS production [Citation66], while reduction of ER stress attenuates the defects caused by Drosophila mitofusin depletion [Citation67]. The benign role of mitochondrial fusion is evident by findings showing that cells respond to loss of mitostasis by enhancing fusion which rearranges the matrix content of a damaged mitochondrion with a healthy one, diluting thus mutated DNA copies and unfolded proteome [Citation68]. Consistently, increasing fusion events prevent the degradation of mitochondria by starvation-induced autophagy [Citation69]; on the contrary, mitochondria fragmentation induced by fission facilitates autophagosome engulfment [Citation70].
A more intense rescue of proteasome dysfunction-mediated toxicity, that also largely restored proteome stability, was seen after induction of the other main cellular degradation arm, namely ALP. Supportively, autophagy has a renoprotective role in diabetic nephropathy [Citation71] and it improves ER stress-induced diabetes in a rodent model of diabetes [Citation72]. Mild caloric restriction or treatment with rapamycin (that culminates in autophagy activation) extends healthspan of model organisms [Citation73] and restricted diet delays accelerates aging, improves neuronal function and alleviates genomic stress in DNA repair-deficient mice [Citation74]; also, lysosomal cathepsins reduce the toxicity of diet-derived advanced glycation end products or lipofuscin in the fly model [Citation75]. These findings suggest potential therapeutic dietary interventions that culminate in autophagy activation in various age-related diseases of chronic stress, including neurodegeneration and/or progeroid genome instability syndromes.
Taken together, our findings indicate that UPP dysfunction has global effects on organismal genome, proteome, mitochondrial and metabolic stability (Figure S13). Thus, loss of proteostasis is likely the driving force in aging and in most (if not all) age-related diseases, since the decline of a core PN component (e.g. proteasome) during physiological aging saturates the PN, resulting in the collapse of genome stability, proteostasis and the mitochondrial functionality boundary below a threshold that sustains cell viability. Furthermore, our findings provide mechanistic explanations for the reported adverse effects (e.g. neuropathies or heart toxicity) of therapeutic proteasome inhibitors [Citation36] as both neuron cells and cardiomyocytes are highly depended on PN and mitochondria for maintaining their functionality. Our finding that proteasome dysfunction-mediated toxicity can be alleviated by modulating mitochondrial dynamics or by enhancing autophagy is thus highly relevant either for anti-aging approaches or for mitigating the adverse effects of therapeutic approaches targeting the proteasome. Systematic analyses of the cross-talk and functional interactions of pathways controlling stress and metabolic responses in model organisms can provide valuable preclinical insights and elucidate potential therapeutic avenues [Citation76] against aging and age-associated pathologies.
Materials and methods
Fly stocks (maintenance and transgenic lines)
Flies stocks were maintained at 23 to 24ºC, 60% relative humidity on a 12 h light: 12 h dark cycle and were fed standard medium [Citation77]. The wild type D. melanogaster flies used in this study were w1118 (BDSC: 5905). The transgenic strains UAS Prosβ5 RNAi (BDSC: 34810, FBgn0029134), UAS Prosβ1 RNAi (BDSC: 34824, FBgn0010590), UAS Prosα7 RNAi (BDSC: 33660, FBgn0023175), UAS Prosα4 RNAi (BDSC: 36063, FBgn0004066), UAS Rpn11 RNAi (BDSC: 33662, FBgn0028694), UAS Rpn10 RNAi (BDSC: 34566, FBgn0015283), UAS Rpt6 RNAi (BDSC: 34712, FBgn0020369), UAS Rpn6 RNAi (BDSC: 29385, FBgn0028689), UAS foxo (BDSC: 9575, FBgn0038197), Drp1m (BDSC: 13510, FBgn0026479), UAS GFP-Atg8a (BDSC: 51656, FBgn0052672), UAS mCherry-Atg8a (BDSC: 37750, FBgn0052672), UAS mCherry RNAi (BDSC: 35785), UAS GFP-Lamp1 (BDSC: 42714, FBgn0032949), along with the transgenic reporter lines UAS Mito-TIMER (BDSC: 57323) and UAS Mito-GFP (BDSC: 8443), the nervous system specific Gal4-Elav (BDSC: 8765) and Gal4-D42 (BDSC: 8816); the eye specific Gal4-GMR (BDSC: 9146) and the muscle specific Gal4-Mef2 (BDSC: 27390) and Gal4-Mhc (BDSC: 55132) drivers were obtained from the Bloomington Drosophila Stock Center. The transgenic line UAS Marf RNAi was obtained from the Vienna Drosophila Resource Center (VDRC, 40478). For the generation of the UAS Marf line, the Marf full-length cDNA was obtained by RT-PCR performed on total Drosophila RNA using attB-modified primers. The PCR product was cloned via recombination in pDONR221 Gateway Entry vector (Invitrogen Life Technologies, 2536017). Marf cDNA was recombined in the pTWH transformation vector using LR Clonase II enzyme (Invitrogen Life Technologies, 12538120) and the transgenic line was generated by microinjection of Drosophila embryos (BestGene, Inc.). The transgenic line UAS Opa1 was a gift from Prof. J. Chung (Seoul National University, Korea). The UAS cncC (FBgn0262975), UAS cncC RNAi [Citation78], along with the UAS GstD1-ARE:GFP (ARE of the GstD1 gene) reporter line and Gal4-Tubulin (Gal4-Tub) GeneSwitch (tubGSGal4) flies were a gift from Prof. D. Bohmann (University of Rochester, NY, USA); the conditional driver (tubGSGal4) is ubiquitously activated in an inducible manner upon dietary administration of RU486 (320 μΜ). The Mito-QC mitophagy reporter transgenic line was a gift from Prof. A. Whitworth (University of Cambridge, UK). Gonads display distinct aging rates and regulation of proteostatic mechanisms as compared to adult somatic tissues [Citation26] and thus in all presented experiments (unless otherwise indicated) referring to adult flies only microdissected somatic tissues (head and thorax; equal numbers from mated male and female flies) were analyzed.
Exposure of flies to compounds and longevity assays
The proteasome inhibitor PS-341 (Calbiochem, CAS 179324-69-7) and the transgene expression inducer RU486 (Sigma-Aldrich, M8046) were added in flies’ culture medium; doses and duration of flies’ exposure to compounds are indicated in figure legends.
Longevity of flies was assayed as described previously [Citation79]. For survival curves and statistical analyses, the Kaplan-Meier procedure and log-Rank (Mantel-Cox) test were used. Significance was accepted at P < 0.05. Statistical analyses for all presented longevity experiments are reported in Table S1.
Total RNA extraction and quantitative real-time PCR (Q-RT-PCR) analysis
Extracted total RNA was converted to cDNA with the Maxima First Strand cDNA Synthesis Kit (Thermo Fisher Scientific, K1642). cDNA was then subjected to Q-RT-PCR analysis by using the SYBR Green/ROX qPCR Master Mix (Thermo Fisher Scientific, K0221) and PikoReal™ Real-Time PCR System (Thermo Fisher Scientific, 168 3rd Avenue. Waltham, MA USA, 02451) as described previously [Citation26]. Primers were designed using the primer-BLAST tool (http://www.ncbi.nlm.nih.gov/tools/primer-blast/) and were as reported previously [Citation79] except from the following primer sets:
Rpt6-F: ATCGCAAGATCGAGTTCCCG, Rpt6-R: CCTTGACTTCCGCACCTGAT; Prosα4-F: GGC-AAGCCACTGAAAATGCT, Prosα4-R: AAGCGATTCAATGCAACGGC (binds to 3’ UTR sequence); Atg6-F: GTTCCTGCTGCCCTACAAGA, Atg6-R: TCCACTGCTCCTCCGAGTTA; ref(2)P-F: GGTCAGCTGGGCGAACTATT, ref(2)P-R: ATCAGTGTGGTAGACGGGGA; Hsf-F: CAGTGAAAGCTGATCGCATCG, Hsf-R: GCAGCTCAACGCGACATTAAA (binds to 3’ UTR sequence; binds all isoforms); Hsc70-3-F: ATATTACTGGCCGTCGTGGC, Hsc70-3-R: CACACCAACGCAGGAATACG; Hsp10-F: CATCCTAATCCAGCGTGCCG, Hsp10-R: GTTGCCAGTGGAGGCATTAC; Hsp60-F: AGAAGGATCGCGTCCATGAT, Hsp60-R: GTTTCTGATCCTCGTTGGTG; ATPsynβ-F: CCCGTGGTGTGCAGAAAATC, ATPsynβ-R; AAACGCTGAATCTTGCGAGC; Pink-F: ACAGCTGGTCTACAACATCC, Pink-R: ACTGTAGGATCTCCGGACTG; park-F: TTCTGCCGCAATTGTCTGCAGG, park-R:
GCATGCAACCGCCATCTCGCTC. The ribosomal gene RpL32/rp49-F: AGCACTTCATCCGCCACC, RpL32/rp49-R: ATCTCGCCGCAGTAAACG) was used as a normalizer.
Preparation of tissue protein extracts, immunoblot analysis, proteasome immunoprecipitation, and detection of protein carbonyl groups
Adult somatic (head, thorax) or larvae tissues were homogenized on ice in Nonident P-40 (NP-40) (Sigma-Aldrich, 74385) lysis buffer (0.1% Nonidet P-40, 150 mM NaCl, 50 mm Tris/HCl buffer, pH 8.0) containing protease inhibitors (Sigma-Aldrich, P1860) and centrifuged for 10 min (4ºC) at 19,000 × g. The protein content per sample was adjusted by Bradford assay (Bio-Rad) and was then analyzed by SDS-PAGE and immunoblotting as described previously [Citation77]. Primary and secondary antibodies were applied for 1 h at room temperature (RT). Immunoblots were developed using an enhanced chemiluminescence reagent kit (GE Healthcare Amersham, RPN2108). Analysis of blot quantification was performed by scanning densitometry and ImageJ (National Institutes of Health, USA).
For proteasome immunoprecipitation analyses, larvae tissues were extracted in NP-40 lysis buffer containing protease inhibitors. Equal protein amounts of each sample were cleared by adding protein-A Sepharose beads (GE Healthcare Amersham, 17-0974-01) and the target antigen was then immunoprecipitated with 2 μg of the corresponding antibody by overnight constant rocking at 4°C. Protein-A Sepharose beads were then added for 2 h at 4°C. Immunoprecipitated protein complexes were collected, washed and analyzed by immunoblotting.
For the detection of protein carbonyl groups, the OxyBlot protein oxidation detection kit (Millipore, s7150) was used. The carbonyl groups in the protein side chain of each sample react with 2,4-dinitrophenylhydrazine (DNPH) and produce 2,4-dinitrophenylhydrazone (DNP-hydrazone). Samples were subjected to SDS-PAGE; transferred to nitrocellulose membrane and DNP was detected by an anti-DNP specific antibody.
Blue native PAGE (BN-PAGE) for analyzing mitochondrial Respiratory Chain Supercomplexes (RCS)
Isolated mitochondria (250 μg) of larvae tissues were suspended in BSA-free mitochondria isolation buffer (see above) and centrifuged at 10,000 × g at 4°C. Mitochondria (pellet) were resuspended in 100 μl 1X Native sample buffer (Invitrogen, BN20032) with either 1% Triton X-100 (Applichem, A4975) or 4% digitonin (Thermo Fischer Scientific, BN2006) and incubated for 10 min on ice before centrifuging at 20,000 × g at 4ºC for 30 min [Citation80]. The supernatant (extracted solubilized complexes) was retained and Native PAGE sample additive G250 5% (Invitrogen, BN2004) was added. Samples were separated by 3–12% gradient BNGE and after electrophoresis the complexes were transferred on a polyvinylidene fluoride (PVDF) membrane and probed with the indicated antibodies.
Measurement of reactive oxygen species (ROS) and H2O2; proteasome, CtsB1/CTSB and Cp1/CTSL enzymatic activities in tissue extracts or in isolated mitochondria
ROS levels were measured as described previously [Citation26]. Briefly, larvae were incubated in CM-H2DCFDA (Invitrogen, C6827) dye for 30 min at 25°C in the dark. Following centrifugation and dye removal, tissues were incubated for 10 min at 24°C in PBS; washed with PBS and lysed in NP-40 lysis buffer. The protein content was measured by Bradford assay and the supernatant was diluted 1:4 (v:v) in ddH2O; fluorescent dichlorodihydrofluorescein was then measured using a Versa FluorTM fluorometer (Bio-Rad Laboratories, Hercules, CA, USA) (excitation 490 nm, and emission 520 nm). Negative controls were unstained tissues incubated with only PBS buffer to detect autofluorescence.
Mitochondrial H2O2 was measured using the Amplex Red hydrogen peroxide assay kit (Invitrogen, A22188) as per manufacturer’s instructions. Isolated mitochondria from larval tissues were homogenized in 100 μl 1Χ reaction buffer and were then centrifuged at 3,000 × g for 3 min at 4°C. Working solution (50 μl; 100 μΜ Amplex Red Reagent and 0.2 U/ml HRP diluted in 1X reaction buffer) was added to 50 μl of the collected supernatant, and samples were incubated for 30 min at RT. H2O2 concentration was measured in a SmartSpec 3000 spectrophotometer (Bio-Rad Laboratories) at 560 nm. Negative controls were free of tissue preparations; in positive controls 10 or 20 μΜ of H2O2 were added. The absorbance was normalized to the total protein input.
Proteasome, CtsB1/CTSB, and Cp1/CTSL enzymatic activities measurement was done as described previously [Citation27,Citation75]. In either proteasome or cathepsin assays the hydrolysis of the fluorogenic peptides was recorded (excitation, 350 nm; emission, 440 nm) in a Versa FluorTM Fluorometer. Fluorescence intensity was normalized to the total protein level per sample and expressed as the relative percentage vs. the corresponding control. In adult flies, equal numbers of male and female flies were used.
Mitochondria isolation and measurement of mitochondrial respiration
Mitochondria were isolated as described previously [Citation81]. Larvae tissues were homogenized in ice-cold isolation buffer (0.32 M sucrose [Applichem, A2211], 10 mM EDTA [Applichem, A2937], 10 mM Tris/HCl, pH 7.3) containing 2% (w:v) BSA (Sigma-Aldrich, A9418). Samples were filtered through a layer of gauze which was then washed with additional isolation buffer up to a final volume of 1.5 ml. Following centrifugation for 10 min at 2,200 × g, the pellet was washed with BSA-free isolation buffer and resuspended in 200 μl of the same buffer. The protein content of isolated mitochondria was measured by the Bradford method.
Mitochondrial respiration was determined using a Clark-type oxygen electrode connected to a computer-operated Oxygraph control unit (Hansatech Instruments, Norfolk, UK) as described previously [Citation37]. Freshly isolated mitochondria (150 μg) were added to the respiration buffer (120 mM KCl, 5 mM KH2PO4, 3 mM HEPES, 1 mM EGTA, 1 mM MgCl2, 0.2% BSA, pH 7.2) in which has been added 5 mM glutamate (Sigma-Aldrich, G1251), 2.5 mM malate (Sigma-Aldrich, W237418). Basal O2 consumption was recorded (state 2) and after 2 min 500 μM ADP (Sigma-Aldrich, 01905) was added (state 3; indicates rate of ATP production, O2 consumption), followed by 6 μΜ oligomycin (Sigma-Aldrich, O4876) (state 4; denotes coupling) and 100 nM of the uncoupler (causes maximal respiration) carbonyl cyanide p-trifluoromethoxyphenylhydrazone (FCCP; Cayman Chemical, 75351) (state FCCP). For all the experiments, the temperature was maintained at 25°C and the total reaction volume was 300 μl. The respiratory control ratio (RCR) was calculated as the ratio of state 3 to state 4 (ST3:ST4).
Measurement of mitochondrial membrane potential
Measurement of mitochondrial membrane potential was performed as described previously [Citation82] with minor modifications. A 10 μl drop of isolated larval mitochondria (20 μg) were placed in the middle of the coverslip. For attaching mitochondria to the coverslip, 31-mm glass coverslips were washed with 70% ethanol, then with dH2O and dried prior to use. The coverslip with the mitochondrial suspension was carefully placed into a 1-ml perfusion chamber that was then mounted onto a microscope fitted for fluorescence imaging. Mitochondria were washed in order to remove the non-attached mitochondria. Respiration buffer (120 mM KCl, 5 mM KH2PO4, 3 mM HEPES, 1 mM EGTA, 1 mM MgCl2, 0.2% BSA, pH 7.2) with 10 mM glutamate, 5 mM malate was then added to the chamber with mitochondria; the membrane potential was then measured by using the tetramethylrhodamine methyl ester (TMRM) (Thermo Fisher Scientific, T668) probe at final concentration 40 nM. Sequential images of TMRM fluorescence were acquired every 30 s; the whole fluorescence recording time per sample was 25 min (50 frames/30 s per frame). Samples were analyzed using an Olympus IX81 inverted microscope (Melville, NY, USA) equipped with an imaging system. At the first 10 frames the basal membrane potential was recorded; for the remaining 15 min the membrane potential was recorded after the addition of 2 μM oligomycin and finally after the addition of 1 μΜ FCCP. Mitochondria TMRM fluorescence analysis was performed using ImageJ (National Institutes of Health, USA).
Measurement of O2 consumption in larvae tissues
Oxygen measurements were made using the XF24 Extracellular flux analyzer (Seahorse Bioscience, Santa Clara, CA, USA) as previously described [Citation83]. More specifically, a small portion of the tip was cut from larvae; internal organs were removed by gently squeezing from end to end and the preparation was turned inside-out by rolling the cuticula along a holding tweezer. Larvae were maintained in a Drosophila hemolymph-like saline-3 (HL3) buffer (70 mM NaCl, 5 mM KCl, 1.5 mM CaCl2, 20 mM MgCl2, 10 mM NaHCO3, 5 mM trehalose, 115 mM sucrose, 5 mM HEPES, pH 7.2) until they were placed into 24-well microplates. Larvae were held in place with a grid and covered with HL3A medium. The instrument was maintained at a temperature of 25°C. Basal O2 consumption rates were measured 3 times; reported in the unit of picomoles/min and the loaded compounds were then sequentially injected as described in the figure legends. Twenty preparations were used in each experiment.
Body wall preparations for immunohistochemistry and CLSM visualization
For immunohistochemistry analyses third instar larvae were dissected in PBS. Larvae tissues were fixed in 4% formaldehyde for 15 min, washed in PBS containing 0.3% Triton X-100 and were then incubated with the primary antibody overnight at 4°C. Secondary antibodies were applied for 1 h at RT. After 3 washes with PBS, samples were mounted in Mowiol® 4–88 (Sigma-Aldrich, 4–88) and viewed; tissues were also counterstained with Rhodamine Phalloidin (Molecular ProbesTM – TFS, R415) or DAPI (Molecular Probes™ – TFS, D1306). Additional used fluorochromes were BODIPY 493/503 (Molecular Probes™ – TFS, D3922) and LysoTracker™ Red DND-99 (Molecular Probes™ – TFS L7528).
Visualization of samples was done by using a Digital Eclipse C1 Nikon (Melville, NY, UAS) CLSM equipped with a 40×, 1.0 NA differential interference contrast (DIC), 60×, 1.4 NA DIC Plan Apochromat objectives using the EZC1 acquisition and analysis software (Nikon). Z-stacks with a step size of 0.5 µm were taken using identical settings. Each stack consisted of 15 to 20 plane images; ~10 animals per genotype were analyzed. Measurement of CLSM stained structures (e.g., mitochondria) was done by ImageJ.
Electron microscopy
Electron microscopy (EM) analyses were done as described previously [Citation67] with minor modifications. Larvae were fixed for 2 h at RT in 4% paraformaldehyde, 2% glutaraldehyde in 0.1 mM sodium cacodylate buffer (pH 7.2) and washed overnight at 4°C. Samples were post-fixed with 1% OsO4 and were then embedded in Epon (Sigma-Aldrich, 45345). EM images were acquired from thin sections using a transmission electron microscope (Tecnai 12, FEI).
Antibodies
The antibody against the Drosophila Prosβ5 proteasomal subunit was a kind gift of Maria Figueiredo-Pereira (Hunter College, New York, USA). Primary antibodies against the 20S-α (sc-65755) and Rpn7 (sc-65750) Drosophila proteasome subunits; anti-Ubiquitin (Ub) (sc-8017), anti-β-Tubulin (sc-20852), anti-Hsp70 (sc-25837), anti-GFP (sc-9996) and the HRP-conjugated secondary antibodies were from Santa Cruz Biotechnology. The antibody against Gapdh (G9545) was from Sigma-Aldrich and the anti-Rabbit-IgG Alexa Flour 647 conjugated antibody (711-605-152) was from Jackson ImmunoResearch. The antibody against the Histone H2AvD (600-401-914) was obtained from Rockland Inc. The antibody against ref(2) has been described before [Citation84]. The antibodies against NDUFS3 (ab14711), ATP5PF/complex V subunit-ATP5F1A (ab14748) and HSPA9/Grp75 (ab2799) were from Abcam and the antibody against PSMD11 (Rpn6, NBP1-46191) was from Novus.
Statistical analyses
Experiments were performed at least in duplicates (for each biological replicate, n ≥ 2). Assays were done after pooling isolated male/female somatic tissues from 10 to 20 flies, unless otherwise stated. For statistical analysis, the MS Excel and the Statistical Package for Social Sciences (IBM SPSS; version 19.0 for Windows, NY, USA) were used. Statistical significance was evaluated using one-way analysis of variance (ANOVA). Data points correspond to the mean of the independent experiments and error bars denote standard deviation (SD); significance at P < 0.05 or P < 0.01 is indicated in graphs by one or two asterisks, respectively. For LC-MS experiments (n = 3) differences in Log2 ratio values at P < 0.05 were accepted.
Supplemental Material
Download PDF (3.7 MB)Supplemental Material
Download MP4 Video (434.2 KB)Supplemental Material
Download MP4 Video (716.1 KB)Acknowledgments
We acknowledge Rudi Costa (University of Padua, Italy) for hosting ENT during the Seahorse Analyzer experiments and Maria Eugenia Soriano Garcìa-Cuerva (University of Padua, Italy) for assistance during mitochondria isolation and respiration analyses. We also thank Maria Figueiredo-Pereira (Hunter College, New York, USA) for the Prosβ5 antibody, as well as Jongkyeong Chung (Seoul National University, Korea), Dirk Bohmann (University of Rochester, NY, USA) and Alexander Whitworth (University of Cambridge, UK) for fly lines.
Data availability statement
The datasets generated during and/or analyzed during the current study are available from the corresponding author on reasonable request.
Disclosure statement
No potential conflict of interest was reported by the authors.
Supplementary material
Supplementary data for this article can be accessed here.
Additional information
Funding
Related Research Data
References
- Trougakos IP, Sesti F, Tsakiri E, et al. Non-enzymatic post-translational protein modifications and proteostasis network deregulation in carcinogenesis. J Proteomics. 2013;92:274–298.
- Labbadia J, Morimoto RI. The biology of proteostasis in aging and disease. Annu Rev Biochem. 2015;84:435–464.
- Taylor RC, Dillin A. Aging as an event of proteostasis collapse. Cold Spring Harb Perspect Biol. 2011;1(5):3.
- Kaushik S, Cuervo AM. Proteostasis and aging. Nat Med. 2015;21:1406–1415.
- Sykiotis GP, Bohmann D. Stress-activated cap‘n‘collar transcription factors in aging and human disease. Sci Signal. 2010;3:re3.
- Mizushima N, Levine B, Cuervo AM, et al. Autophagy fights disease through cellular self-digestion. Nature. 2008;451:1069–1075.
- Klionsky DJ, Abdelmohsen K, Abe A, et al. Guidelines for the use and interpretation of assays for monitoring autophagy (3rd edition). Autophagy. 2016;12:1–222.
- Wong E, Cuervo AM. Integration of clearance mechanisms: the proteasome and autophagy. Cold Spring Harb Perspect Biol. 2010;2:a006734.
- Matsumoto G, Wada K, Okuno M, et al. Serine 403 phosphorylation of p62/SQSTM1 regulates selective autophagic clearance of ubiquitinated proteins. Mol Cell. 2011;44:279–289.
- Tsakiri EN, Trougakos IP. The amazing ubiquitin-proteasome system: structural components and implication in aging. Int Rev Cell Mol Biol. 2015;314:171–237.
- Saeki Y, Tanaka K. Assembly and function of the proteasome. Methods Mol Biol. 2012;832:315–337.
- Finley D, Chen X, Walters KJ. Gates, channels, and switches: elements of the proteasome machine. Trends Biochem Sci. 2016;41:77–93.
- Ciechanover A, Orian A, Schwartz AL. The ubiquitin-mediated proteolytic pathway: mode of action and clinical implications. J Cell Biochem. 2000;34:40–51.
- Höhn TJ, Grune T. The proteasome and the degradation of oxidized proteins: part III-Redox regulation of the proteasomal system. Redox Biol. 2013;2:388–394.
- Taylor EB, Rutter J. Mitochondrial quality control by the ubiquitin-proteasome system. Biochem Soc Trans. 2011;39:1509–1513.
- Baker MJ, Tatsuta T, Langer T. Quality control of mitochondrial proteostasis. Cold Spring Harb Perspect Biol. 2011;3:a007559–a007559.
- Baker BM, Haynes CM. Mitochondrial protein quality control during biogenesis and aging. Trends Biochem Sci. 2011;36:254–261.
- Neutzner A, Youle RJ, Karbowski M. Outer mitochondrial membrane protein degradation by the proteasome. Novartis Found Symp. 2007;287:4–20.
- Ziviani E, Tao RN, Whitworth AJ. Drosophila parkin requires PINK1 for mitochondrial translocation and ubiquitinates mitofusin. Proc Natl Acad Sci U S A. 2010;107:5018–5023.
- Tanaka A, Cleland MM, Xu S, et al. Proteasome and p97 mediate mitophagy and degradation of mitofusins induced by Parkin. J Cell Biol. 2010;191:1367–1380.
- Gumeni S, Trougakos IP. Cross talk of proteostasis and mitostasis in cellular homeodynamics, ageing, and disease. Oxid Med Cell Longev. 2016;2016:1–24.
- Wang K, Klionsky DJ. Mitochondria removal by autophagy. Autophagy. 2011;7:297–300.
- Mao K, Wang K, Liu X, et al. The scaffold protein Atg11 recruits fission machinery to drive selective mitochondria degradation by autophagy. Dev Cell. 2013;26:9–18.
- Klaips CL, Jayaraj GG, Hartl FU. Pathways of cellular proteostasis in aging and disease. J Cell Biol. 2018;217:51–63.
- López-Otín C, Blasco MA, Partridge L, et al. The hallmarks of aging. Cell. 2013;153:1194–1217.
- Tsakiri EN, Sykiotis GP, Papassideri IS, et al. Differential regulation of proteasome functionality in reproductive vs. somatic tissues of Drosophila during aging or oxidative stress. FASEB J. 2013;27:2407–2420.
- Tsakiri EN, Sykiotis GP, Papassideri IS, et al. Proteasome dysfunction in Drosophila signals to an Nrf2-dependent regulatory circuit aiming to restore proteostasis and prevent premature aging. Aging Cell. 2013;12:802–813.
- Thomas WD, Zhang XD, Franco AV, et al. TNF-related apoptosis-inducing ligand-induced apoptosis of melanoma is associated with changes in mitochondrial membrane potential and perinuclear clustering of mitochondria. J Immunol. 2000;165(10):5612–5620.
- Liu L, Vo A, Liu G, et al. Distinct structural domains within C19ORF5 support association with stabilized microtubules and mitochondrial aggregation and genome destruction. Cancer Res. 2005;65(10):4191–4201.
- Okatsu K, Saisho K, Shimanuki M, et al. p62/SQSTM1 cooperates with Parkin for perinuclear clustering of depolarized mitochondria. Genes Cells. 2010;15(8):887–900.
- Anding AL, Wang C, Chang TK, et al. Vps13D encodes a ubiquitin-binding protein that is required for the regulation of mitochondrial size and clearance. Curr Biol. 2018;28:287–295.
- Lee JJ, Sanchez-Martinez A, Zarate AM, et al. Basal mitophagy is widespread in Drosophila but minimally affected by loss of Pink1 or parkin. J Cell Biol. 2018;217(5):1613–1622.
- Dou Z, Xu C, Donahue G, et al. Autophagy mediates degradation of nuclear lamina. Nature. 2015;527(7576):105–109.
- Mochida K, Oikawa Y, Kimura Y, et al. Receptor-mediated selective autophagy degrades the endoplasmic reticulum and the nucleus. Nature. 2015;522(7556):359–362.
- Zhou B, Yu P, Lin MY, et al. Facilitation of axon regeneration by enhancing mitochondrial transport and rescuing energy deficits. J Cell Biol. 2016;214:103–119.
- Dimopoulos M, Moreau P, Palumbo A, et al. Carfilzomib and dexamethasone versus bortezomib and dexamethasone for patients with relapsed multiple myeloma (ENDEAVOR): a randomized, open label, phase 3, multi-centre study. Lancet Oncol. 2016;17:27–38.
- Cogliati S, Frezza C, Soriano ME, et al. Mitochondrial cristae shape determines respiratory chain supercomplexes assembly and respiratory efficiency. Cell. 2013;155:160–171.
- Szlanka T, Haracska L, Kiss I, et al. Deletion of proteasomal subunit S5a/Rpn10/p54 causes lethality, multiple mitotic defects and overexpression of proteasomal genes in Drosophila melanogaster. J Cell Sci. 2003;116:1023–1033.
- Tonoki A, Kuranaga E, Tomioka T, et al. Genetic evidence linking age-dependent attenuation of the 26S proteasome with the aging process. Mol Cell Biol. 2009;29:1095–1106.
- Lundgren J, Masson P, Mirzaei Z, et al. Identification and characterization of a Drosophila proteasome regulatory network. Mol Cell Biol. 2005;25:4662–4675.
- Zhu YX, Tiedemann R, Shi CX, et al. RNAi screen of the druggable genome identifies modulators of proteasome inhibitor sensitivity in myeloma including CDK5. Blood. 2011;117:3847–3857.
- Goldberg AL. Protein degradation and protection against misfolded or damaged proteins. Nature. 2003;426:895–899.
- Demishtein A, Fraiberg M, Berko D, et al. SQSTM1/p62-mediated autophagy compensates for loss of proteasome polyubiquitin recruiting capacity. Autophagy. 2017;9:1–12.
- Lőw P, Varga Á, Pircs K, et al. Impaired proteasomal degradation enhances autophagy via hypoxia signaling in Drosophila. BMC Cell Biol. 2013;14:29.
- Fusco C, Micale L, Egorov M, et al. The E3-ubiquitin ligase TRIM50 interacts with HDAC6 and p62, and promotes the sequestration and clearance of ubiquitinated proteins into the aggresome. PLoS One. 2012;7:e40440.
- Marshall RS, Li F, Gemperline DC, et al. Autophagic degradation of the 26s proteasome is mediated by the dual atg8/Ubiquitin receptor RPN10 in Arabidopsis. Mol Cell. 2015;58:1053–1066.
- Cohen-Kaplan V, Livneh I, Avni N, et al. p62- and ubiquitin-dependent stress-induced autophagy of the mammalian 26S proteasome. Proc Natl Acad Sci U S A. 2016;113:E7490–E7499.
- Zhang H, Liu J, Li CR, et al. Deletion of Drosophila insulin-like peptides causes growth defects and metabolic abnormalities. Proc Natl Acad Sci U S A. 2009;106:19617–19622.
- Ehses S, Raschke I, Mancuso G, et al. Regulation of OPA1 processing and mitochondrial fusion by m-AAA protease isoenzymes and OMA1. J Cell Biol. 2009;187:1023–1036.
- Bragoszewski P, Gornicka A, Sztolsztener ME, et al. The ubiquitin-proteasome system regulates mitochondrial intermembrane space proteins. Mol Cell Biol. 2013;33:2136–2148.
- Jeon HB, Choi ES, Yoon JH, et al. A proteomics approach to identify the ubiquitinated proteins in mouse heart. Biochem Biophys Res Commun. 2007;357:731–736.
- Peng J, Schwartz D, Elias JE, et al. A proteomics approach to understanding protein ubiquitination. Nat Biotechnol. 2003;21:921–926.
- Narendra D, Kane LA, Hauser DN, et al. p62/SQSTM1 is required for Parkin-induced mitochondrial clustering but not mitophagy; VDAC1is dispensable for both. Autophagy. 2010;6:1090–1106.
- Fernández-Pevida A, Rodríguez-Galán O, Díaz-Quintana A, et al. Yeast ribosomal protein L40 assembles late into precursor 60 S ribosomes and is required for their cytoplasmic maturation. J Biol Chem. 2012;287:38390–38407.
- Holmström KM, Baird L, Zhang Y, et al. Nrf2 impacts cellular bioenergetics by controlling substrate availability for mitochondrial respiration. Biol Open. 2013;2:761–770.
- Palikaras K, Lionaki E, Tavernarakis N. Coordination of mitophagy and mitochondrial biogenesis during ageing in C. elegans. Nature. 2015;521:525–528.
- Lo SC, Hannink M. PGAM5 tethers a ternary complex containing Keap1 and Nrf2 to mitochondria. Exp Cell Res. 2008;314:1789–1803.
- Durieux J, Wolff S, Dillin A. The cell-non-autonomous nature of electron transport chain-mediated longevity. Cell. 2011;144:79–91.
- Taylor RC, Dillin A. XBP-1 is a cell-nonautonomous regulator of stress resistance and longevity. Cell. 2013;153:1435–1447.
- Prahlad V, Cornelius T, Morimoto RI. Regulation of the cellular heat shock response in Caenorhabditis elegans by thermosensory neurons. Science. 2008;320:811–814.
- Berendzen KM, Durieux J, Shao LW, et al. Neuroendocrine coordination of mitochondrial stress signaling and proteostasis. Cell. 2016;166:1553–1563.
- Tsakiri EN, Terpos E, Papanagnou ED, et al. Milder degenerative effects of Carfilzomib vs. Bortezomib in the Drosophila model: a link to clinical adverse events. Sci Rep. 2017;7:17802.
- Hall AR, Burke N, Dongworth RK, et al. Mitochondrial fusion and fission proteins: novel therapeutic targets for combating cardiovascular disease. Br J Pharmacol. 2014;171:1890–1906.
- Chen H, Ren S, Clish C, et al. Titration of mitochondrial fusion rescues Mff-deficient cardiomyopathy. J Cell Biol. 2015;211:795–805.
- Civiletto G, Varanita T, Cerutti R, et al. Opa1 overexpression ameliorates the phenotype of two mitochondrial disease mouse models. Cell Metab. 2015;21:845–854.
- Tang S, Le PK, Tse S, et al. Heterozygous mutation of Opa1 in Drosophila shortens lifespan mediated through increased reactive oxygen species production. PLoS One. 2009;4:e4492.
- Debattisti V, Pendin D, Ziviani E, et al. Reduction of endoplasmic reticulum stress attenuates the defects caused by Drosophila mitofusin depletion. J Cell Biol. 2014;204:303–312.
- Santel A, Frank S, Gaume B, et al. Mitofusin-1 protein is a generally expressed mediator of mitochondrial fusion in mammalian cells. J Cell Sci. 2003;116:2763–2774.
- Rambold AS, Kostelecky B, Lippincott-Schwartz J. Fuse or die: shaping mitochondrial fate during starvation. Commun Integr Biol. 2011;4:752–754.
- Zhu J, Wang KZ, Chu CT. After the banquet: mitochondrial biogenesis, mitophagy, and cell survival. Autophagy. 2013;9:1663–1676.
- Xu Y, Liu L, Xin W, et al. The renoprotective role of autophagy activation in proximal tubular epithelial cells in diabetic nephropathy. J Diabetes Complications. 2015;29:976–983.
- Bachar-Wikstrom E, Wikstrom JD, Kaiser N, et al. Improvement of ER stress-induced diabetes by stimulating autophagy. Autophagy. 2013;9:626–628.
- Fontana L, Partridge L. Promoting health and longevity through diet: from model organisms to humans. Cell. 2015;161:106–118.
- Vermeij WP, Dollé ME, Reiling E, et al. Restricted diet delays accelerated ageing and genomic stress in DNA-repair-deficient mice. Nature. 2016;537:427–431.
- Tsakiri EN, Iliaki KK, Höhn A, et al. Diet-derived advanced glycation end products or lipofuscin disrupts proteostasis and reduces life span in Drosophila melanogaster. Free Radic Biol Med. 2013;65:1155–1163.
- Ziehm M, Kaur S, Ivanov DK, et al. Drug repurposing for aging research using model organisms. Aging Cell. 2017;16:1006–1015.
- Trougakos IP, Margaritis LH. Immunolocalization of the temporally “early” secreted major structural chorion proteins, Dvs38 and Dvs36, in the eggshell layers and regions of Drosophila virilis. J Struct Biol. 1998;123:111–123.
- Sykiotis GP, Bohmann D. Keap1/Nrf2 signaling regulates oxidative stress tolerance and lifespan in Drosophila. Dev Cell. 2008;14:76–85.
- Tsakiri E, Gaboriaud-Kolar N, Iliaki K, et al. The indirubin derivative 6-Bromoindirubin-3‘-oxime (6BIO) activates proteostatic modules, reprograms cellular bioenergetics pathways and exerts anti-aging effects. Antioxid Redox Signal. 2017;27:1027–1047.
- Nijtmans LG, Henderson NS, Holt IJ. Blue Native electrophoresis to study mitochondrial and other protein complexes. Methods. 2002;26:327–334.
- Ferguson M, Mockett MJ, Shen Y, et al. Age-associated decline in mitochondrial respiration and electron transport in Drosophila melanogaster. Biochem J. 2005;390:501–511.
- Vergun O, Votyakova TV, Reynolds IJ. Spontaneous changes in mitochondrial membrane potential in single isolated brain mitochondria. Biophys J. 2003;85:3358–3366.
- Da-Rè C, Franzolin E, Biscontin A, et al. Functional characterization of drim2, the Drosophila melanogaster homolog of the yeast mitochondrial deoxynucleotide transporter. J Biol Chem. 2014;289:7448–7459.
- Nagy P, Kárpáti M, Varga A, et al. Atg17/FIP200 localizes to perilysosomal Ref(2)P aggregates and promotes autophagy by activation of Atg1 in Drosophila. Autophagy. 2014; 10:453–467.