
ABSTRACT
There is overwhelming evidence for an association between impaired mitochondrial function and metabolic syndrome. Mitophagy, a process that selectively removes damaged mitochondria via a specialized form of autophagy, is essential for mitochondrial quality control (mitochondrial QC) and metabolic homeostasis. We thus addressed the potential role of defective mitophagy in the pathogenesis of metabolic disorders. Mice lacking Fundc1, a newly characterized mitophagy receptor, develop more severe obesity and insulin resistance when fed a high-fat diet (HFD). Ablation of Fundc1 results in defective mitophagy and impaired mitochondrial QC in vitro and in white adipose tissue (WAT). In addition, there is more pronounced WAT remodeling with more adipose tissue-associated macrophages infiltration, more M1 macrophage polarization and thus an elevated inflammatory response. Mechanistically, hyperactivation of MAPK/JNK leads to insulin insensitivity, which can be inhibited by knocking out Mapk8/Jnk1 in fundc1 KO mice. Our results demonstrate that dysregulated mitochondrial QC due to defective mitophagy receptor FUNDC1 links with metabolic disorders via MAPK signaling and inflammatory responses.
Abbreviations: ATMs: adipose tissue macrophages; BAT: brown adipose tissue; BMDMs: bone marrow-derived macrophages; GOT1/AST: glutamic-oxaloacetic transaminase 1, soluble; GPT/ALT: glutamic pyruvic transaminase, soluble; H&E staining: hematoxylin and eosin staining; HFD: high-fat diet; LIR: LC3-interacting region; mitochondrial QC: mitochondrial quality control; mito-ROS: mitochondrial ROS; mtDNA: mitochondrial DNA; RT-PCR: real-time-PCR; T2D: type 2 diabetes; WAT: white adipose tissue
Introduction
Metabolic syndrome is described as a cluster of metabolic disorders including central obesity, insulin resistance, glucose intolerance and non-alcoholic fatty liver disease, which contributes to and associates with the increased risks of developing type 2 diabetes (T2D) and cardiovascular diseases [Citation1,Citation2]. Metabolic syndrome is one of the greatest challenges to human health in the 21st century. Previously, metabolic syndrome was prevalent only in developed countries. However, new statistics reveal that 80% of patients with metabolic syndrome nowadays live in low- and middle-income countries [Citation3]. These alarming statistics and the increasing prevalence of metabolic syndrome worldwide urge better understanding of the underlying mechanism to develop effective treatment strategies to combat this pandemic.
Mitochondria lie at the center of glucose and lipid metabolism. Mitochondria are both the origin and target of multiple nutrients and metabolic insults-related signals. Additionally, mitochondria act as the signaling platform to orchestrate integrated physiological responses to maintain cellular homeostasis [Citation4]. Mitochondrial dysfunction or impaired mitochondrial QC, in conjunction with declining mitochondrial mass, limits the capacity of oxidative phosphorylation to fuel the cell. This leads to lipid accumulation in non-adipose tissues, such as skeletal muscle, liver and pancreatic β cells. Furthermore, the mitochondrial dysfunction also results in the dysregulated production of mitochondria-associated metabolic intermediates, declined energy production, as well as imbalanced redox status. These consequences collaborate and contribute to the etiology of insulin insensitivity and metabolic syndrome [Citation5–Citation10]. There is overwhelming evidence that mitochondrial content and mitochondrial oxidative capacity are altered in multiple tissues, particularly in the insulin-responsive tissues (liver, skeletal muscle and adipose tissue), from patients with obesity and insulin resistance, as well as in animal models. These impaired mitochondrial functions are highly associated with the pathogenesis of insulin resistance and metabolic syndrome [Citation11].
As mitochondria are susceptible to damage mediated by ROS and lipid species, maintaining a healthy population of mitochondria through mitochondrial QC mechanisms appears to be essential for normal cellular functions and cell survival. Mitophagy is regarded as one of the major mechanisms for mitochondrial QC and mitochondrial homeostasis. Mitophagy is a highly specific form of autophagy that selectively removes superfluous or damaged mitochondria by utilizing the autophagosome-lysosome machinery [Citation12]. Currently, several mitophagy receptors have been identified to participate in selective mitophagy. These include BNIP3L/NIX [Citation13], BNIP3 [Citation14], BCL2L13 [Citation15], PHB2 [Citation16], and FKBP8 [Citation17] in mammalian cells, as well as Atg32 [Citation18,Citation19] in yeast. Harboring a MAP1LC3B/LC3-interacting region (LIR) in BNIP3L, BNIP3, BCL2L13, PHB2, and FKBP8 or an Atg8-interacting motif (AIM, which is functionally similar to LIR in mammalian cells) in Atg32, these mitophagy receptors can recruit MAP1LC3B/Atg8-enriched phagophore membranes for recognizing and engulfing damaged mitochondria [Citation20,Citation21]. In addition, the PINK1-PRKN/PARKIN pathway is another well-understood mechanism for mitophagy. Upon loss of mitochondrial membrane potential, the Ser/Thr kinase PINK1 accumulates on the outer membrane of depolarized mitochondria, thus recruits autophagy receptors such as OPTN and CALCOCO2/NDP52, to subsequently engage core autophagy components (ULK1, ZFYVE1/DFCP1 and WIPI1) to focal spots proximal to mitochondria and thus trigger mitophagy. PINK1 also recruits the E3 ligase PRKN to translocate onto mitochondrial outer membrane for the initiation of mitophagy. Phagophores then expand around these damaged and marked mitochondria to remove them [Citation22–Citation24]. Mitophagy is important for mitochondrial remodeling and for preventing amplification of initial oxidative insults, which would otherwise further attack the respiratory chain or promote mutations in mitochondrial DNA (mtDNA). Indeed, morphological or functional abnormalities of mitochondria have been detected in several models of autophagy deficiency and mitophagy deficiency [Citation25–Citation27]. Increasing evidence is emerging that PINK1-PRKN-mediated mitophagy is of physiological importance to prevent metabolic disorders in various animal models. PINK1-PRKN-mediated mitophagy preserves insulin secretion in β cells [Citation28,Citation29] and ameliorates glucose tolerance in skeletal muscle [Citation30]. However, the potential physio-pathological role of receptors-mediated selective mitophagy in metabolic regulation and metabolic disorders has not been well dissected. We have recently identified that the mitochondrial outer membrane protein FUNDC1 acts as a novel mitophagy receptor and mediates mitophagy through its interaction with MAP1LC3B in response to hypoxia [Citation31,Citation32]. We reason that this novel mitophagy receptor may regulate mitochondrial quality and defective FUNDC1-mediated mitophagy and mitochondrial QC may contribute to the metabolic disorders. To address the critical role of receptor-mediated mitophagy in the pathogenesis of metabolic disorders, we used a HFD-induced Fundc1-deficient mouse model and demonstrated that ablation of Fundc1 leads to dysregulated mitochondrial QC and aggravates dietary-induced obesity, insulin resistance and metabolic syndrome. We have uncovered a novel regulatory signaling pathway comprising a mitochondrial QC-MAPK signaling axis in the pathogenesis of metabolic syndrome.
Results
Ablation of Fundc1 promotes HFD-induced obesity and insulin resistance
To address the fundamental issue of whether FUNDC1-mediated mitophagy has (patho-) physiological relevance, we obtained and maintained the fundc1 KO mice [Citation33]. During the period of animal care, we noticed that fundc1 KO mice over the age of 12 months had higher bodyweights than the corresponding WT littermates, even though their dietary consumption and ambulatory movement were similar. In 24-month-old fundc1 KO mice, the mass of fat tissues was higher than that in age-matched WT littermates. Additionally, the size of adipocytes was significantly larger than that in age-matched WT littermates, when fed with the standard chow diet (CD) (Figure S1(a–d)).
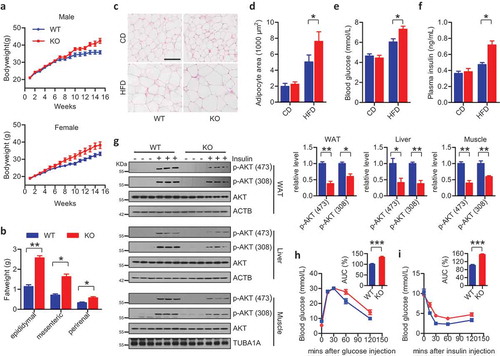
This observation prompted us to address the potential role of the mitophagy receptor FUNDC1 in the pathogenesis of obesity, insulin resistance and metabolic syndrome. We fed 6-week-old WT and KO mice with a high-fat diet (HFD, 60% fat, Research Diets No. D12492) for 15 weeks. Upon HFD feeding, both male and female fundc1 KO mice gained bodyweight more quickly than the corresponding age- and gender-paired WT animals ()). fundc1 KO mice had significantly accelerated expansion of gonadal fat pads, mesenteric fat pads, and perirenal fat pads ()). There was no obvious difference in food consumption between the two groups of mice (data not shown). Consistent with the increase in fat mass, adipocytes were larger in the KO mice than in WT mice when fed with HFD, as shown by hematoxylin and eosin (H&E) staining of WAT (,).
Figure 1. Ablation of Fundc1 promotes HFD-induced obesity and insulin resistance. (a) fundc1 KO mice and the corresponding WT littermates were fed with HFD, and the bodyweight was measured once every week (5 independent experiments, n > 10 for each group in each time). (b) Analysis of the masses of the indicated fat pads (*p < 0.05, **p < 0.01). (c) H&E staining of gonadal fat pads isolated from 15-week HFD- or CD-fed fundc1 KO and WT mice. Scale bar: 100 μm. (d) Analysis of adipocyte size. Data were obtained from three independent experiments and are expressed as the mean ± SEM (*p < 0.05). (e) Fasted blood glucose levels of CD- and HFD-fed WT and KO mice (n ≥ 7 for each group, *p < 0.05). (f) Fasted blood insulin levels of CD- and HFD-fed WT and KO mice (n ≥ 7 for each group, *p < 0.05). (g) Acute insulin sensitivity assay (AISA). Overnight-fasted HFD-fed WT and KO mice were injected with 0.75 U insulin/kg of bodyweight or saline. Lysates from white adipose tissue (WAT), liver and skeletal muscle of WT and KO mice were immunoblotted with the indicated antibodies. Grayscale values of the p-AKT (473), p-AKT (308) and AKT bands of WT and KO mice with insulin injection measured with ImageJ software are used to calculate the relative levels of p-AKT (473) and p-AKT (308) to AKT, shown in the right histograms (*p < 0.05, **p < 0.01). (h) GTT was performed on fasted HFD-fed WT mice and KO mice at different time points up to 120 min after injection of 1 g glucose/kg of bodyweight. Curves show blood glucose levels at the indicated times after injection of glucose. Histograms show area under curve (AUC, n = 5 for each group, ***p < 0.001). (i) ITT was performed on 6-h-fasted HFD-fed WT mice and KO mice at different time points up to 120 min after injection of 0.75 U insulin/kg of bodyweight. Curves show blood glucose levels at the indicated times after injection of insulin. Histograms show AUC (n = 5 for each group, ***p < 0.001).
H&E staining demonstrated aggravated hepatic steatosis in HFD-fed KO mice, as shown by the more lipid droplets apparent in KO livers (Figure S2(a,b)). Also, elevated levels of serum GOT1/AST (glutamic-oxaloacetic transaminase 1, soluble) and GPT/ALT (glutamic pyruvic transaminase, soluble) were detected in HFD-fed KO mice, suggesting severe hepatic injury (Figure S2(c,d)). Quantitative real-time-PCR (RT-PCR) was performed to examine the expression levels of genes associated with fatty acid metabolism. Expression of genes related to lipogenesis (Cd36, Fabp4, Fasn, Acaca, Scd1, Acacb) was significantly upregulated in liver tissues of HFD-fed KO mice compared to the livers of HFD-fed control mice, while the expression of genes associated with fatty acid β-oxidation (Ppara, Acadm, Cpt1a, Cpt1b) in liver was comparable (Figure S2(e)). Furthermore, despite the deficiency of the mitophagy receptor FUNDC1, the expression levels of genes related to fatty acid β-oxidation (Acadl, Acadm, Ppargc1a, Cpt1b) and lipogenesis (Acacb, Scd1, Dgat2, Pparg) in skeletal muscle were equivalent (Figure S3(a)). Similarly, equivalent expression levels of genes encoding browning markers (Cox7a1, Dio2, Prdm16, Ucp1), whitening markers (Ednra, Psat1), and genes related to lipid metabolism (Acadm, Cpt1b, Acadl, Cd36, Fabp4) were found in the brown adipose tissue (BAT) of HFD-fed WT and KO mice (Figure S3(b)). This suggests that Fundc1 deficiency has no obvious effect on lipid metabolism in skeletal muscle and BAT.
Obesity and hepatic steatosis are generally associated with the pathogenesis of insulin resistance and T2D. We thus investigated the susceptibility to insulin resistance of Fundc1-deficient mice under HFD feeding. Interestingly, compared to HFD-fed WT mice, HFD-fed KO mice developed hyperglycemia and hyperinsulinemia in fasted states, while no obvious differences in blood glucose and plasma insulin were observed between CD-fed WT and KO mice (,). The acute insulin sensitivity assay was performed to evaluate insulin sensitivity in the absence of Fundc1. In HFD-fed WT mice, intraperitoneal injection of insulin stimulated activation of AKT in insulin-responsive organs including liver, skeletal muscle and WAT. However, AKT activation was greatly reduced in the corresponding HFD-fed KO peers after intraperitoneal injection of insulin ()). Indeed, glucose tolerance tests (GTT) and insulin tolerance tests (ITT) showed that HFD-fed KO mice were less tolerant to glucose challenge and less sensitive to insulin stimulation, as compared to HFD-fed WT controls (,). Additionally, insulin stimulated activation of AKT in liver, skeletal muscle and WAT was also reduced in old fundc1 KO mice fed with CD, when compared to the age-matched WT littermates (Figure S1(e)), suggesting the more aggravated etiology of insulin insensitivity in KO animals.
Ablation of Fundc1 compromises mitochondrial quality in WAT
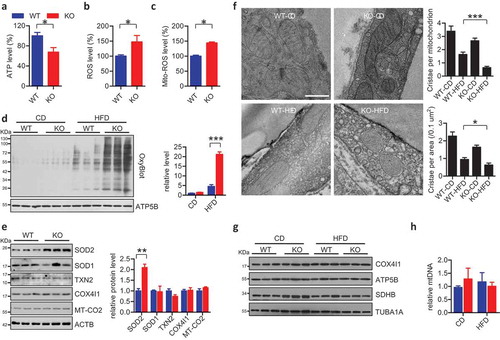
We next addressed the key question of whether ablation of Fundc1 causes defective mitophagy and compromised mitochondrial function, which then leads to the pathogenesis of obesity and insulin resistance. We observed decreased ATP levels ()) and increased levels of total ROS ()) in WAT isolated from HFD-fed fundc1 KO mice. As mitochondria are the major sources for ROS production, we then investigated the level of mitochondrial ROS (mito-ROS). As shown in ), elevated level of mito-ROS was observed in WAT isolated from HFD-fed fundc1 KO mice ()). Carbonyl groups are often introduced into oxidized proteins via a site-specific mechanism [Citation34], which is a marker of oxidative stress and can be detected by the specific antibody by utilizing the commercial OxyBlot kit. OxyBlot analysis revealed that total mitochondrial proteins were more oxidized in HFD-fed KO mice than that in HFD-fed WT mice ()), even though there was elevated expression of the anti-oxidative stress-related SOD2 /MnSOD, which may be upregulated by a compensatory mechanism ()) [Citation35]. The other mitochondria-associated anti-oxidative stress proteins, including SOD1 and TXN2, have no obvious differences between WT and KO mice. Furthermore, there are no obvious changes in the mitochondria marker proteins COX4I1 and MT-CO2 ()). These data collectively suggest that oxidative insults are elevated in WAT during HFD feeding in the absence of Fundc1. EM analysis revealed that mitochondria were morphologically normal in WAT from WT and KO mice when fed with CD. However, HFD induced deformation of the mitochondrial cristae in both WT and KO WAT, with more pronounced effects in the latter ()). Fundc1 deficiency may lead to compromised mitophagy and thus decelerate removal of superfluous mitochondria. However, we did not detect any obvious change in the mitochondrial mass in WAT from the mutant mice, as measured by the expression profiles of mitochondrial marker proteins ()) and by the copy number of mtDNA ()). However, the protein and mRNA levels of the mitochondrial biogenesis-related transcriptional factors NRF1 and TFAM were lower in HFD-fed KO mice than those in the corresponding WT mice (Figure S4). The decreased mitochondrial biogenesis but equivalent mitochondrial mass in the WAT of KO mice strongly suggests the deficiency of mitochondrial clearance and deceleration of mitochondrial turnover in WAT of HFD-fed KO mice, which would be, at least in part, due to impaired mitophagy in the absence of Fundc1.
Figure 2. fundc1 knockout compromises mitochondrial quality in WAT. The levels of ATP (a), total ROS (b), and mito-ROS (c) were measured in adipose tissues of HFD-fed WT and KO mice (n = 5 for each group, *p < 0.05). (d) Mitochondria were isolated from adipose tissues of CD- or HFD-fed WT and KO mice, and the levels of oxidized mitochondrial proteins levels were detected using an OxyBlot kit. Grayscale values of the OxyBlot and ATP5B bands measured with ImageJ software are used to calculate the relative level of OxyBlot to ATP5B, shown in the right histogram (***p < 0.001). (e) Lysates of adipose tissues isolated from HFD-fed WT and KO mice were immunoblotted to check indicated proteins. Grayscale values of the each band measured with ImageJ software are used to calculate the relative level of corresponding protein to ACTB, shown in the right histogram (**p < 0.01). (f) Representative transmission electron microscopy (TEM) images of adipose tissues isolated from CD- or HFD-fed WT and KO mice. Scale bar: 500 nm. The numbers of cristae per mitochondrion and the numbers of cristae per mitochondrial area were analyzed and shown in the top and lower right histograms, respectively (*p < 0.05, ***p < 0.001). (g) Lysates of adipose tissues isolated from CD- or HFD-fed WT and KO mice were immunoblotted with the indicated antibodies to check the expression levels of mitochondrial marker proteins. (h) Total DNA was extracted from adipose tissues of CD- or HFD-fed WT and KO mice, and the mtDNA copy numbers were checked with quantitative RT-PCR.
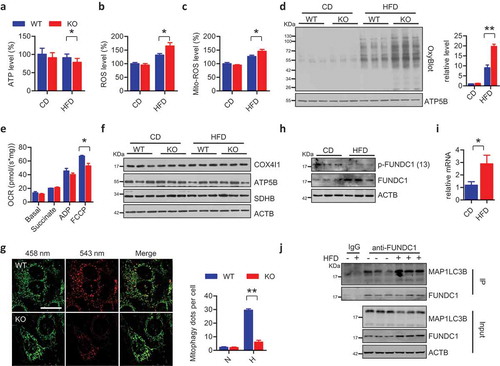
We further addressed the causal role of Fundc1 deficiency mediated dysregulated mitochondrial quality control in the pathogenesis of obesity and insulin insensitivity. We fed mice with a HFD for 7 weeks, the time during which WT and KO mice show equivalent adiposity ()) and insulin sensitivity (data not shown). Interestingly, we found that the HFD-fed KO mice had moderately but significantly reduced ATP levels, and moderately but significantly elevated levels of total and mito-ROS (–c)). The OxyBlot assay suggested that there were elevated levels of oxidized mitochondrial proteins in the WAT of HFD-fed KO mice compared to HFD-fed WT mice, while the levels of oxidized protein were similar when the mice were fed with CD ()). We evaluated mitochondrial functionalities by measuring oxygen consumption rates (OCR) on the isolated mitochondria in WAT of HFD-fed WT and KO mice. FCCP-stimulated maximal respiration capacities were significantly lower in fundc1 KO WAT compared to WT controls ()). Again, no obvious differences in mitochondrial mass were observed between KO and WT mice ()). These data collectively suggest that impaired mitochondrial QC (reduced energy production and increased oxidative stress) occurs before the onset of the obese phenotype in Fundc1-deficient mice.
Figure 3. Dysfunctional mitochondria accumulate in WAT before the onset of metabolic syndrome. Levels of ATP (a), total ROS (b), and mito-ROS (c) were measured in adipose tissues of CD- or HFD-fed WT and KO mice for 7 weeks (n = 5 for each group, *p < 0.05). (d) Mitochondria were isolated from adipose tissues of 7-week CD- or HFD-fed WT and KO mice, and the levels of oxidized mitochondrial proteins were detected using an OxyBlot kit. Grayscale values of the OxyBlot and ATP5B bands measured with ImageJ software are used to calculate the relative level of OxyBlot to ATP5B, shown in the right histogram (**p < 0.01). (e) Mitochondrial respiration rates were determined from WAT of 7-week HFD-fed WT and KO mice using succinate as the substrate (n = 4 mice per group, *p < 0.05). (f) Lysates of adipose tissues isolated from 7-week CD- or HFD-fed WT and KO mice were immunoblotted with the indicated antibodies to check the expression of mitochondrial markers. (g) WT and KO cells with stably expressed mt-Keima were subjected with hypoxic treatment for 24 h. The images were captured with a LSM510 Meta confocal microscope. Scale bar: 20 μm. The numbers of mitophagy dots were counted (mean ± SEM; n = 100 cells from three 3 experiments; **p < 0.01, N means normoxic condition, H means hypoxic treatment). (h) Lysates of adipose tissues isolated from CD- or HFD-fed WT mice were immunoblotted with the indicated antibodies to check FUNDC1 and FUNDC1 phosphorylation levels. (i) Total RNA was extracted from adipose tissues of CD- or HFD-fed WT mice. The relative expression of Fundc1 was measured by quantitative RT-PCR (n = 7, *p < 0.05). (j) Lysates of adipose tissues isolated from CD- or HFD-fed WT mice were prepared for co-immunoprecipitation assay using anti-FUNDC1 antibodies or normal rabbit IgG. The total lysates as input and IP samples were analyzed by immunoblotted with the indicated antibodies.
Increased mito-ROS (Figure S5(a,b)) was observed in adipocytes and MEFs isolated from fundc1 KO mice, suggesting increased mitochondrial redox imbalance during Fundc1 deficiency, while mitochondrial membrane potential in the two genotypes (Figure S5(c,d)) is comparable. Also, mitochondrial morphology (Figure S5(e,f)) is similar in adipocytes and MEFs. The protein levels of mitochondrial dynamic-related molecules are comparable in adipocytes and MEFs (Figure S5(g,h)), as well as in WAT in vivo, both under CD- and HFD-fed conditions (Figure S5(i)). We found decreased basal and maximal OCR in fundc1 KO adipocytes and MEFs (Figure S5(j,k)). These data collectively demonstrated compromised mitochondrial QC in Fundc1 deficiency cells in vitro.
As FUNDC1 acts an important role in selective mitophagy, we would like to address whether the compromised mitochondrial QC is due to the defective mitophagy when Fundc1 is ablated. To address this issue, we measured mitophagy activity in adipocytes following hypoxic treatment. This is of physiological relevance as adipocytes distant from the vasculature become hypoxic during obesity, and this has been proposed to be an important contributor to adipose tissue dysfunction, leading to insulin resistance and diabetes [Citation36,Citation37]. In WT mature adipocytes, hypoxia induced the degradation of mitochondrial marker proteins accompanied with MAP1LC3B-II conversion, the biochemical hallmarks of mitophagy (Figure S6(a)). However, mitophagy was largely blocked in fundc1 KO adipocytes under identical conditions, although the level of MAP1LC3B-II conversion was similar to that in WT cells, suggesting Fundc1 ablation largely compromises hypoxia-induced mitophagy, but fails to impact on the general autophagy, which is consistent with our previous finding [Citation31] (Figure S6(a)). Hypoxia also induced TIMM23-MAP1LC3B colocalization, while this colocalization was largely reduced in Fundc1-ablated cells (Figure S6(b)). Furthermore, we employed mt-Keima assay to directly dissect the role of FUNDC1 in mitophagy. Keima is a ratiometric pH-sensitive fluorescent protein and mt-Keima is targeted into the mitochondrial matrix by fusing a tandem repeat of the COX8A presequence to Keima. A low ratio of mt-Keima-derived fluorescence (543 nm:458 nm) reports a neutral environment, whereas a high ratio of fluorescence reports an acidic pH, which indicates that the mitochondria are engulfed by lysosomes [Citation38]. Clearly, the mt-Keima assay show less round structures with a high 543 nm signal in KO cells under hypoxic treatment compared to that in WT cells ()). To conclusively confirm the significant role of FUNDC1 in WAT mitophagy in vivo, fundc1 KO mice was crossed with mt-Keima transgenic mice to obtain the double mutant mice. We analyzed WAT mitophagy in mice fed with CD compared to mice fed with HFD, and found that increase in the ratio of 543 nm:458 nm fluorescence in WAT in mice under HFD feeding, compared to the WAT in mice under CD feeding. This increase of 543 nm:458 nm ratio is diminished in KO mice under the identical condition (Figure S6(c)). These data collectively suggest an indispensable role of FUNDC1 in WAT mitophagy during HFD feeding.
Fundc1 deficiency is able to reduce mitochondrial degradation, thus decelerating the rate of mitochondrial turnover. To test this, we used the Mito-Timer assay to assess mitochondrial turnover rate [Citation39]. The fluorescent Timer protein is a DsRed mutant, which fluoresces like GFP when newly synthesized, but shifts irreversibly to red following dehydrogenization during oxidative stress. The Mito-Timer was constructed by fusing Timer with the mitochondrial targeting sequence of COX8A, which makes it suitable for distinguishing the young-old portions of mitochondria and thus reporting the age and turnover rate of mitochondria. We stably expressed pTRE-Tet-On-Mito-Timer in WT and KO cells, and found that mitochondrial turnover rate was significantly reduced by Fundc1 ablation, as shown by the higher Red:Green fluorescent signal ratio in the fundc1 KO cells (Figure S6(d,e)). Collectively, these data showed that deficiency of Fundc1 leads to impaired mitophagy and decelerated mitochondrial turnover, which may partially contribute to the accumulation of dysfunctional mitochondria, both in vitro and in a pathophysiological setting.
FUNDC1 could be dephosphorylated at Ser13, leading to its enhanced interaction with MAP1LC3B for the activation of mitophagy [Citation40]. We found that FUNDC1 dephosphorylates at Ser13 in adipose tissues during HFD feeding ()). Furthermore, the immunoprecipitation assay shows that HFD feeding leads to enhanced FUNDC1-MAP1LC3B interaction in WAT ()), suggesting that FUNDC1 is activated during HFD feeding. Interestingly, FUNDC1 gets upregulated in WAT from HFD feeding mice ()), due to the increase of mRNA level of Fundc1 ()). This suggests that transcriptional activation of Fundc1 in response to HFD feeding, although the precise mechanism of Fundc1 induction has yet to be addressed.
Ablation of Fundc1 accelerates WAT remodeling and inflammation
Recent studies have reported WAT remodeling in obese subjects, which is mainly characterized by progressive macrophage infiltration and chronic low-grade inflammation. This is instrumental in the development of insulin insensitivity and metabolic disorders [Citation41,Citation42]. Immunostaining of the macrophage marker ADGRE1/F4/80 revealed that there was significantly more macrophages infiltration in the WAT of HFD-fed KO mice than in the control animals (CAV1 was stained to show the cell contour), whereas there were no obvious differences when the mice were fed with CD (,). Flow cytometric analysis revealed that compared to HFD-fed WT mice, the adipose tissue of HFD-fed KO mice contained more adipose tissue macrophages (ATMs) expressing surface markers (ADGRE1+ ITGAX+ MRC1−) associated with M1 polarization (or classically activated macrophage) [Citation43], but similar amounts of ATMs expressing surface markers (ADGRE1+ ITGAX− MRC1+) associated with M2 polarization (or alternatively activated macrophage) [Citation43] (,). The adipose tissue of HFD-fed Fundc1-deficient mice had higher expression of ATMs marker Adgre1 than HFD-fed WT mice ()). Additionally, expression of the Ccl2/Mcp-1 (chemokine [C-C motif] ligand 2), a major signaling factor for ATMs recruitment [Citation44], was increased in the KO mice ()). Moreover, Fundc1 deficiency increased the expression of M1 polarization-associated genes (Itgax, Nos2, Il1b, Il6, and Tnf) ()), but failed to influence M2 polarization-associated genes (Clec10a, Mrc1, and Il10) ()) in HFD-fed mice, further supporting the notion that Fundc1 deficiency accelerates ATMs infiltration and M1 polarization. To test whether M1 polarization is altered by Fundc1 deficiency in macrophages themselves, or by the WAT-associated microenvironment, we isolated bone marrow-derived macrophages (BMDMs) from WT and KO mice. When the BMDMs were stimulated in vitro with lipopolysaccharide (LPS), similar expression levels of M1 polarization-associated genes (Ccl2, Ccl5, Il1b, Tnf, and Nos2) were observed for both genotypes (Figure S7(a)). In addition, there were no obvious differences in IL4-mediated M2 polarization, as shown by the comparable expression of M2 polarization-associated genes (Arg1, Il10, Clec10a, and Mrc1) between the KO and WT cells (Figure S7(b)). Collectively, these data demonstrated that the Fundc1 ablation facilitates M1 polarization of ATMs via a cell non-autonomous mechanism, which may depend on the macrophage microenvironment in WAT as obesity develops [Citation45]. Analysis of serum inflammatory cytokines (IL6, TNF/TNFα and CCL2) by ELISA further confirmed the increased inflammatory response in HFD-fed KO mice (–). In addition, elevated expression of inflammatory response-associated genes was also observed in WAT in old KO mice (Figure S1(f)).
Figure 4. Ablation of Fundc1 accelerates inflammation in WAT. (a) Fat tissues from HFD-fed WT and KO mice were analyzed for ADGRE1 expression by immunofluorescence, CAV1 was stained to show the cell contour. Representative images are shown. Scale bar: 100 μm. The stromal vascular fractions (SVF) were isolated from fat tissues of CD- and HFD-fed WT and KO mice, then stained with anti-ADGRE1, anti-ITGAX and anti-MRC1 antibodies. The cells were then examined by flow cytometry to detect the total number of ADGRE1+ ATMs (b), the number of ADGRE1+ ITGAX+ MRC1− (M1, c) cells, and the number of ADGRE+ ITGAX− MRC1+ (M2, d) cells (n = 5 for each group, *p < 0.05). Total RNA was prepared from fat tissues isolated from HFD-fed WT and KO mice. The relative mRNA levels of genes associated with ATMs (e), M1 polarization (f) and M2 polarization (g) were measured by quantitative RT-PCR (*p < 0.05). Serum was collected from CD- or HFD-fed WT and KO mice, and the plasma inflammatory cytokines IL6 (h), TNF (i), and CCL2 (j) were detected with corresponding commercial ELISA kits (n ≥ 5 for each group, *p < 0.05). (k) Serum was collected from CD- or HFD-fed WT and KO mice, and the plasma ADIPOQ levels were detected with an ELISA kit (n ≥ 5 for each group, *p < 0.05).
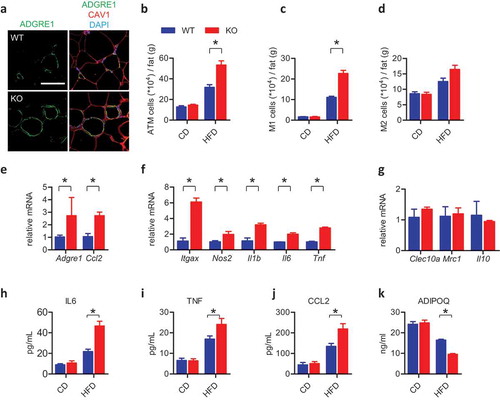
WAT is also regarded as a key secretory tissue that participates in systemic metabolic regulation. We showed that serum levels of ADIPOQ, a peptide hormone secreted by adipose tissue, were lower in HFD-fed KO mice than in HFD-fed WT mice ()). These data demonstrated that Fundc1 deficiency accelerates HFD-induced WAT remodeling, including macrophage infiltration, M1 polarization and inflammation, and reduces the secretion of ADIPOQ, which together lead to insulin resistance in the KO mice.
Specific Fundc1 ablation in adipose tissue phenocopies the obese and insulin resistant phenotypes
We next address whether WAT with compromised mitochondrial quality is one of the critical tissues accounting for the pathogenesis of obesity and insulin insensitivity. To achieve this, we specifically ablated Fundc1 in adipose tissue by crossing Fundc1 flox/flox mice with Fabp4-Cre transgenic mice. Adipose tissue-specific deletion of Fundc1 could phenocopy the obese phenotype of Fundc1 germline deletion when the animals were challenged with HFD. Increases in bodyweight and fat tissue size were detected in the adipose tissue-specific knockout mice when they were fed with a HFD (,). Also, HFD-fed adipose tissue-specific knockout mice showed hyperglycemia, hyperinsulinemia, glucose intolerance, and insulin tolerance, compared to Cre− animals, as shown by the levels of blood glucose, the levels of plasma insulin, GTT and ITT, respectively (–). Importantly, the acute insulin sensitivity assay showed that the insulin insensitivity occurs both in WAT and in liver tissue in HFD-fed Cre+ mice, suggesting that insulin insensitivity develops in the HFD-fed adipose-specific knockout mice ()).
Figure 5. Specific ablation of Fundc1 in WAT phenocopies the obese and insulin resistant phenotypes. (a) Bodyweight curves of HFD-fed mice with adipose tissue-specific knockout of Fundc1 (Fabp4-Cre+) and HFD-fed control littermates (Fabp4-Cre−) (n = 12 for each group). (b) Tissue weight of gonadal fat pads isolated from HFD-fed Cre+ mice and Cre− mice (n = 12 for each group, **p < 0.01). (c) Fasted blood glucose levels of HFD-fed Cre+ mice and Cre− mice (n = 7 for each group, *p < 0.05). (d) Fasted blood insulin levels of HFD-fed Cre+ mice and Cre− mice (n = 7 for each group, *p < 0.05). (e) GTT was performed on overnight-fasted HFD-fed Cre+ mice and Cre− mice at different time points up to 120 min after injection of 1 g glucose/kg of bodyweight. Curves on the left show blood glucose levels at the indicated times after injection of glucose. Histograms on the right show AUC (n = 5 for each group, *p < 0.05). (f) ITT was performed on 6-h-fasted HFD-fed Cre+ mice and Cre− mice at different time points up to 120 min after injection of 0.75 U insulin/kg of bodyweight. Curves on the left show blood glucose levels at the indicated times after injection of insulin. Histograms on the right show AUC (n = 5 for each group, *p < 0.05). (g) Acute insulin sensitivity assays were performed on overnight-fasted HFD-fed Cre+ mice and Cre− mice injected with 0.75 U insulin/kg of bodyweight or saline. Lysates from liver and WAT of Cre+ mice or Cre− mice were immunoblotted with the indicated antibodies. Grayscale values of the p-AKT (473), p-AKT (308) and AKT bands of Cre+ and Cre− mice with insulin injection measured with ImageJ software are used to calculate the relative levels of p-AKT (473) and p-AKT (308) to AKT, shown in the right histograms (*p < 0.05, **p < 0.01, ***p < 0.001). Levels of ATP (h), total ROS (i), and mito-ROS (j) were measured in WAT of HFD-fed Fabp4-Cre− and Cre+ mice (*p < 0.05). (k) Mitochondria were isolated from adipose tissues of HFD-fed Fabp4-Cre− and Cre+ mice, and the levels of oxidized mitochondrial proteins were detected using an OxyBlot kit. Grayscale values of the OxyBlot and ATP5B bands measured with ImageJ software are used to calculate the relative level of OxyBlot to ATP5B, shown in the right histogram (*p < 0.05).
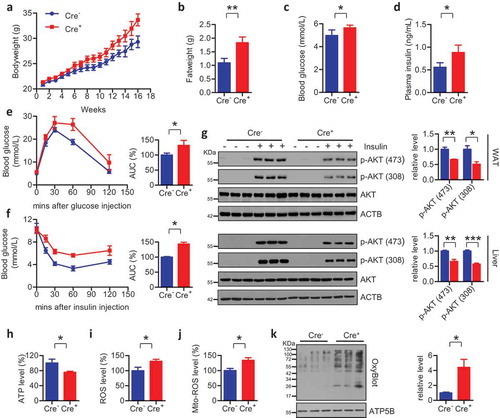
We also observed that HFD resulted in a more severe mitochondrial abnormality when Fundc1 is specifically ablated in adipose tissue. Similar to the global knockout mice, the adipose tissue-specific knockout mice showed decreased ATP levels accompanied by elevated levels of total ROS and mito-ROS in WAT (–). OxyBlot analysis confirmed the higher oxidized levels of total mitochondrial proteins ()). Collectively, these data demonstrated that the mitophagy receptor FUNDC1 is functionally important for maintaining a healthy mitochondrial pool in WAT.
Furthermore, increased expression levels of the ATM marker gene Adgre1, the ATM infiltration-associated gene Ccl2, and the M1 polarization-associated genes Il1b, Il6 and Tnf were observed in the HFD-fed WAT-specific knockout mice compared to the corresponding Cre− mice (Figure S8(a,b)). ELISA analysis further confirmed that serum levels of the pro-inflammatory response-associated cytokines IL6, TNF and CCL2 were elevated, suggesting aggravated inflammation in the mutant mice when fed with a HFD (Figure S8(c–e)). Collectively, these findings reveal that WAT with impaired mitochondrial QC due to Fundc1 deficiency may be partially responsible for the obesity- and insulin resistance-prone phenotypes of fundc1 null mice.
Hyperactivated MAPK is crucial for obesity and insulin resistance
We next addressed how compromised mitochondrial QC in WAT leads to retrograde signaling that promotes insulin resistance and metabolic disorders. Previous reports have clearly shown that the activated MAPK pathway is crucial for the pathogenesis of obesity and insulin resistance, partially by directly phosphorylating IRS (insulin receptor substrate) and subsequently blocking the downstream PI3K-AKT pathway, while knockout of Mapk8/Jnk1 could dramatically prevent HFD-induced obesity and insulin resistance [Citation43,Citation46,Citation47]. Because we observed that there was increased oxidative stress, we reasoned that MAPK may be activated in HFD-fed fundc1-null mice. Indeed, hyperactivated MAPK signaling was detected in WAT and skeletal muscle in HFD-fed KO mice compared to that in WT mice, while modestly hyperactivated MAPK was observed in liver () and S9(a)). To further address whether hyperactivation of MAPK is involved in retrograde signaling that leads to insulin resistance and obesity, we crossed fundc1 KO mice with mapk8 KO mice to generate fundc1 mapk8 double-knockout mice. Knocking out Mapk8 in the fundc1 KO background prevented obesity and decelerated adiposity during HFD feeding () and S9(b)). The size of adipocytes was also reduced in fundc1 mapk8 double-knockout mice, as shown by H&E staining () and S9(c)). Importantly, the acute insulin sensitivity assay showed that the insulin sensitivities in WAT of the double-knockout mice were restored to levels comparable to those of WT mice fed with a HFD () and S9(d)). Furthermore, deletion of Mapk8 in the fundc1 KO background also decreased the blood glucose level ()). Collectively, these data suggest that the hyperactivation of MAPK signaling is responsible for the development of insulin resistance in WAT in animals fed with a HFD.
Figure 6. Hyperactivated MAPK is crucial for the pathogenesis of obesity and insulin resistance. (a) Lysates from fat tissues, liver, and skeletal muscle isolated from CD- and HFD-fed WT and KO mice were immunoblotted with the indicated antibodies to check MAPK activation. (b) Bodyweight curves of HFD-fed indicated mice. The bodyweights were measured once a week (n = 10 for each group). (c) H&E staining of fat tissues of HFD-fed indicated mice. Scale bar: 100 μm. (d) Acute insulin sensitivity assays were performed on overnight-fasted HFD-fed mice injected with 0.75 U insulin/kg of bodyweight or saline vehicle control. Genotypes are shown at the top of the panel. Lysates of WAT from these mice were immunoblotted with the indicated antibodies. (e) Fasted blood glucose in HFD-fed mice. Genotypes are shown (*p < 0.05). (f and g) The stromal vascular fractions (SVF) were isolated from fat tissues of HFD-fed indicated mice, then stained with anti-ADGRE1, anti-ITGAX and anti-MRC1 antibodies, and examined by flow cytometry to determine the total number of ADGRE1+ ATMs (f) and the number of M1 ATMs (ADGRE1+ ITGAX+ MRC1−, g). Genotypes are shown in E (**p < 0.01). Serum was collected from HFD-fed indicated mice, and the plasma inflammatory cytokines IL6 (h), TNF (i), and CCL2 (j) were detected with the corresponding commercial ELISA kits. Genotypes are shown in E (*p < 0.05, **p < 0.01).
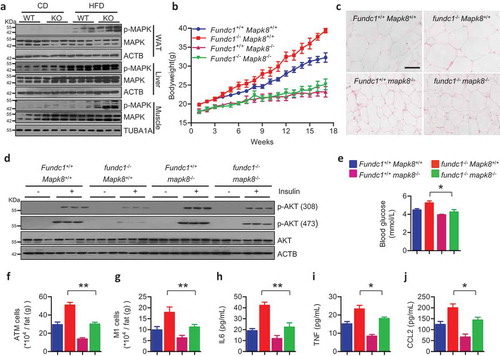
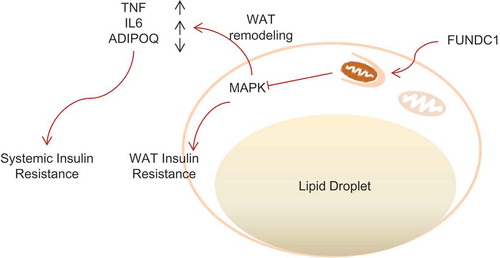
We next addressed whether the compromised mitochondrial QC-MAPK axis in WAT leads to insulin insensitivity in non-adipose tissue. Indeed, the acute insulin sensitivity assay showed that the insulin sensitivities in liver tissue of the double-knockout mice were also restored to levels comparable to those of WT mice fed with a HFD (Figure S9(e)). In addition, the aggravated hepatic steatosis was diminished in the fundc1 mapk8 double-knockout mice (Figure S9(f,g)). Many studies have documented the tight association between MAPK activation and obesity-associated chronic inflammation. It is possible that the hyperactivation of MAPK signaling in Fundc1-deficient mice resulted in WAT remodeling and the elevated inflammatory response in WAT leading to dysregulated secretion of inflammatory cytokines. The higher levels of circulating inflammatory cytokines may facilitate MAPK activation in non-adipose tissues. Indeed, deletion of Mapk8 in the fundc1 KO background suppressed ATMs infiltration and accumulation in adipose tissue ()). The mRNA levels of the macrophage marker gene Adgre1 and the macrophage infiltration-related gene Ccl2 were downregulated (Figure S9(h)). Furthermore, the immunophenotyping assay clearly suggested that polarization of ATMs to pro-inflammatory M1 macrophages was also decreased, as shown by the decreased number of ATMs expressing M1-associated surface markers (ADGRE1+ ITGAX+ MRC1–) ()), and by the decreased expression of M1 polarization-associated genes (Tnf, Il1b and Il6) (Figure S9(h)) when Mapk8 was ablated. Importantly, the secretion of pro-inflammatory cytokines (IL6, TNF and CCL2) was also reduced (–). Additionally, injection of MAPK inhibitor SP600125 also decelerated the onset of obesity (Figure S10(a)) and ameliorated inflammation in KO mice when fed with HFD, as shown by the decreased expression of Adgre1, Tnf and Il1b (Figure S10(b)), as well as by the decreased levels of TNF and IL6 cytokines (Figure S10(c)). We thus conclude that FUNDC1-mediated mitophagy and mitochondrial QC in adipose tissues retrogradedly signal through MAPK activation, WAT remodeling and subsequent inflammatory response for systemic metabolic regulation ().
Figure 7. A schematic diagram illustrating defective FUNDC1 impairing mitochondrial QC accelerates dietary-induced metabolic disorders. Schematic shows the proposed mechanism by which FUNDC1-mediated mitophagy and mitochondrial QC is linked to metabolic regulation. Ablation of Fundc1 leads to dysfunctional mitochondria accumulation in WAT, partially due to the defective mitophagy. The ROS outburst from the damaged mitochondria could lead to MAPK activation and subsequent insulin resistance in WAT. MAPK activation would also result in WAT remodeling, which includes ATMs infiltration, M1 macrophage polarization, inflammatory responses and abnormal ADIPOQ secretion. The elevated level of inflammatory cytokines and decreased level of ADIPOQ would then act as circulating factors responsible for systemic insulin insensitivity.
Discussion
A wealth of literature has documented the tight link between mitochondrial QC in insulin-responsive tissues (including liver, skeletal muscle, WAT and BAT) and the pathogenesis of metabolic syndrome. However, the potential role of receptor-mediated mitophagy and mitochondrial QC in the pathogenesis of metabolic syndrome has not been elucidated. In this study, we addressed this fundamental issue and showed that Fundc1 deficiency aggravates HFD-induced obesity and insulin resistance. We found that ablation of the mitophagy receptor FUNDC1 leads to impaired mitophagy both in vitro and in WAT when the mice were fed with HFD. This impaired mitophagy may partially account to the accumulation of compromised mitochondria in vitro and in WAT, as evidenced by the reduced bioenergetics, deformed mitochondria and pronounced oxidative stress. However, additional mitochondrial roles outside of mitophagy of FUNDC1 cannot be excluded. The impaired mitochondrial QC occurs prior to the onset of overt obesity or insulin resistance, suggesting that it may causally link with these phenotypes under HFD conditions. Importantly, we reveal that abnormal FUNDC1-mediated mitochondrial QC in adipose tissue results in increased oxidative stress and hyperactivation of MAPK signaling, leading to WAT remodeling as represented by enhanced ATMs infiltration, M1 macrophage polarization and a chronic inflammatory response. Our present study thus highlights the importance of FUNDC1-mediated mitochondrial QC in adipose tissue and its important role in the pathogenesis of insulin resistance and metabolic syndrome. Furthermore, adipose tissue-specific ablation of Fundc1 by crossing the Fundc1 flox/flox mice with Fabp4-Cre transgenic mice preliminarily suggests the adipose tissue specificity of FUNDC1-mediated mitophagy in maintaining metabolic homeostasis ( and S8). However, Fabp4 has been reported to be broadly expressed in tissues other than WAT, more adipose tissue-specific KO mice should be bred to further evaluate the tissue specificity of dysregulated FUNDC1-mediated mitophagy in regulating metabolic disorders.
Our results revealed the critical role of the mitochondrial QC-MAPK axis in WAT in retrograde signaling towards insulin resistance and metabolic disorders. Defective mitochondrial QC leads to MAPK hyperactivation when Fundc1-deficient mice are challenged with a HFD. Specifically, a burst of ROS, originating from damaged mitochondria due to dysregulated mitochondrial QC, leads to oxidative stress-driven MAPK activation [Citation48]. MAPK activation leads to phosphorylation and subsequent inhibition of IRS, blocking insulin-signaling transduction [Citation47,Citation49]. There is also another research demonstrating MAPK activity regulates energy expenditure [Citation49,Citation50], which is important for the development of obesity and insulin resistance. Additionally, MAPK activation is crucial for recruitment of monocytes and M1 polarization, and thus for chronic inflammation in obese and insulin-resistant subjects [Citation43,Citation51,Citation52], partially via facilitating the expression of CCL2 [Citation53], the major signaling factor for monocyte recruitment [Citation44]. The secretion of pro-inflammatory cytokines such as TNF and IL6 due to the M1 polarization and chronic inflammation in WAT can subsequently activate MAPK signaling and thus insulin resistance in other insulin-responsive organs [Citation48]. In addition, the ADIPOQ decrease due to MAPK activation [Citation54], and/or compromised mitochondrial quality [Citation55], also leads to insulin insensitivity and chronic inflammation in ADIPOQ sensing tissues (including liver and skeletal muscle), as ADIPOQ functions as both an insulin sensitizer [Citation56], and as an anti-inflammatory agent [Citation57]. In support of this, we found that deletion of Mapk8 ( and S9) or pharmacological inhibition of MAPK (Figure S10) strongly prevents the obese and insulin-resistant phenotypes, and reduces monocyte recruitment and the inflammatory response in Fundc1-deficient mice. Our study thus extends previous findings by showing that dysregulated FUNDC1-mediated mitochondrial QC activates MAPK, mediates retrograde signaling from mitochondria towards insulin resistance, and accelerates WAT remodeling and also the subsequent inflammatory response in metabolic syndrome.
Altered autophagy activity has been observed in a wide variety of tissues during the pathogenesis of metabolic disorders, and defective autophagy in these tissues is tightly associated with the pathogenesis of metabolic disorders [Citation26,Citation58–Citation65]. In particularly, autophagy is up-regulated in adipose tissue of obese individuals [Citation66–Citation68], partially because of the inflammation, ER stress and hypoxia in the obese adipose tissue. Mice with specific deletion of Atg7 in adipose tissue are resistant to HFD-induced obesity and insulin resistance [Citation61,Citation63,Citation64]. This is in contrast to our Fundc1 adipose tissue-specific-deficient mice. It is possible that autophagy flux is functionally essential for adipocyte differentiation [Citation64], whereas Fundc1 ablation does not affect normal autophagy flux, but only decelerates specific mitophagy (Figure S6). This further highlights the uniqueness and (patho-) physiological significance of mitophagy in stress responses.
Therapeutic interventions that improve adipocyte mitochondrial function have been explored to improve whole-body insulin sensitivity and metabolic homeostasis. Currently, the thiazolidinediones (TZDs), which are PPARG/PPARγ agonists that facilitate mitochondrial biogenesis and maintain normal mitochondrial functions, are used to treat patients with T2D to improve insulin sensitivity [Citation69]. Furthermore, mitochondrial antioxidant [Citation70] and chemical uncouplers [Citation71] may be beneficial to enhance mitochondrial function and adipocyte metabolism, and thus improve insulin sensitivity in diabetic patients. Our animal study has shown that Fundc1 ablation mediated mitochondrial dysfunction in WAT may affect adipocyte cellular physiology and impact upon systemic energy homeostasis. The compromised mitochondria accumulating in WAT in the knockout mice suggests the crucial role of mitophagy and mitochondrial QC mediated by FUNDC1 in supervising the microenvironments of WAT, including oxidative stress and inflammatory response, although it is still undefined how these insults activate FUNDC1-mediated mitophagy in adipocytes. It is conceivable that progressive hypoxia due to adipocyte expansion would lead to the activation of FUNDC1 and mitochondrial turnover at an early stage. However, prolonged chronic hypoxia in adipose tissue may initiate oxidative stress and inflammatory responses, as revealed in our study, which will eventually cause deterioration in mitochondrial functions. Our results imply that targeted therapeutic interventions that properly modulate FUNDC1-mediated mitophagy in WAT could improve adipocyte mitochondrial turnover and thus may be beneficial by improving whole-body insulin sensitivity and metabolic homeostasis. Our findings thus suggest a new avenue for fighting the alarming metabolic syndrome pandemic and for developing therapies that are specifically targeted to mitochondrial QC in WAT.
Materials and methods
Mice
fundc1 KO mice were maintained in our lab. mapk8 KO mice were generously provided by Dr. An-ning Lin (University of Chicago), and Dr. Yong Liu (Institute for Nutritional Sciences, Chinese Academy of Sciences, Shanghai, China). fundc1 KO and mapk8 KO mice were crossed to generate the fundc1 mapk8 double-knockout mice. All of the mice were housed in a specific pathogen-free (SPF) facility, and experiments were conducted under protocols approved by the Ethics Committee of the Institute of Zoology, Chinese Academy of Sciences. For the HFD feeding assay, 6-week-old mice were fed with HFD (60% of calories from fat, Research Diets No. D12492) for the indicated time. The bodyweights were measured once every week.
Antibodies and reagents
The following primary antibodies were used in this study: anti-p-AKT (473; Cell Signaling Technology, 4060), anti-p-AKT (308; Cell Signaling Technology, 4056), anti-AKT (Cell Signaling Technology, 4691), anti-p-MAPK (Cell Signaling Technology, 9251), anti-MAPK (Cell Signaling Technology, 9252), anti-ATG5 (Cell Signaling Technology, 12994), anti-ACTB (Sigma-Aldrich, A8481), anti-TUBA1A (Sigma-Aldrich, T2200), anti-MAP1LC3B (Sigma-Aldrich, L8918), anti-ATP5B (Proteintech, 17247–1-AP), anti-SDHB (Proteintech, 10620–1-AP), anti-MT-CO2 (Proteintech, 55070–1-AP), anti-COX4I1 (Proteintech, 11242–1-AP), anti-SOD1 (Proteintech, 10269–1-AP), anti-SOD2 (Proteintech, 24127–1-AP), anti-MFN1 (Abnova, H00055669-M04), anti-MFN2 (Abnova, H00009927-M03), anti-TIMM23 (BD Biosciences, 611223), anti-OPA1 (BD Biosciences, 612607), anti-DNM1L (BD Biosciences, 611113), anti-VDAC1 (Abcam, ab34726), and anti-CAV1 (Santa Cruz Biotechnology, sc-894) antibodies. The rabbit anti-FUNDC1 and anti-p-FUNDC1 (13) antibodies were generated by immunizing rabbits with a purified FUNDC1 peptide (9th–25th residues of FUNDC1, QDYESDDDSYEVLDLTE) and a phosphorylated peptide (peptide phosphorylated at Ser-13, QDYEpSDDDSYEVLDLTE), respectively. HRP-conjugated anti-rabbit IgG secondary antibodies (SeraCare Life Sciences, 5220–0336) and HRP-conjugated anti-mouse IgG secondary antibodies (SeraCare Life Sciences, 5220–0341) were used. The secondary antibody used for immunofluorescence was goat anti-mouse IgG Alexa Fluor 488 (Invitrogen, F2761).
The following reagents and kits were used in this study: Insulin (Sigma-Aldrich, 1342106), the ROS dye DCF (Invitrogen, C6827), the mito-ROS dye MitoSOX (Invitrogen, M36008), the mitochondrial dye MitoTracker (Invitrogen, M7512), the MAPK inhibitor SP600125 (Sigma-Aldrich, S5567), the ATP detection kit (Beyotime Biotechnology, S0026), the Insulin ELISA kit (Millipore, EZRMI-13K), the ADIPOQ ELISA kit (Millipore, EZMADP-60K), the OxyBlot kit (Millipore, S7150), the IL6 ELISA kit (BioLegend, 431307), the TNF ELISA kit (BioLegend, 430907) and the CCL2 ELISA kit (BioLegend, 432704).
Histological analysis
Fresh liver tissue and gonadal fat pads were rapidly isolated and fixed with 4% paraformaldehyde in phosphate-buffered saline (PBS; 137 mM NaCl, 2.7 mM KCl, 10 mM Na2HPO4, 2 mM KH2PO4, pH 7.4) and embedded in paraffin. The fixed liver and fat samples were sectioned at thicknesses of 5 μM and 8 μM, respectively. The samples were then stained with hematoxylin and eosin. Images were captured by a Vectra Automated Quantitative Pathology Imaging System (PerkinElmer, USA).
Quantitative real-time PCR
Fresh tissues were rapidly isolated and homogenized in Trizol reagent (ThermoFisher Scientific, 15596026). Total RNA was extracted following with the manufacturer’s protocol. The corresponding cDNA was synthesized using a cDNA synthesis kit (Takara, 6110A). Quantitative RT-PCR was performed on diluted cDNA with SYBR green Master Mix (ThermoFisher Scientific, A25742) on a real-time PCR machine (Bio-Rad, CA, USA). The sequences of primers used in this study are listed in Table S1.
Western blotting
Fresh tissues or cells were harvested and lysed in lysis buffer (137 mM NaCl, 20 mM Tris, pH 7.4, 2 mM EGTA, 1% NP-40 [Invitrogen, FNN0021]) supplemented with protease inhibitors (ThermoFisher Scientific, 88266) after the indicated treatments or transfections. The total protein concentration was analyzed with a Bradford Protein Assay kit (Beyotime Biotechnology, P0006), and equivalent protein quantities (20 μg) were subjected to SDS-PAGE gel electrophoresis and then transferred to nitrocellulose membranes. The membranes were blocked with 5% milk, and then incubated with the indicated primary antibody followed by HRP-conjugated secondary antibody. Immuno-reactive bands were visualized with a chemiluminescence kit (ThermoFisher Scientific, 32109).
Co-immunoprecipitation
Mice were sacrificed after CD or HFD feeding and the adipose tissues were quickly isolated. Adipose tissues (50 mg) were homogenized in the lysis buffer (137 mM NaCl, 20 mM Tris, pH 7.4, 2 mM EGTA, 1% NP-40) supplemented with protease inhibitors on ice for 30 min. After centrifugation at 12,000 g for 15 min, the supernatant was collected and the protein concentration was measured using a Bradford Protein Assay kit. Equivalent protein quantities (800 μg) were immunoprecipitated with 1 μg anti-FUNDC1 antibody or 1 μg normal rabbit IgG (Santa Cruz Biotechnology, sc-2027) overnight at 4°C, and 30 μL protein A agarose beads (ThermoFisher Scientific, 15918–014) were washed with ice-cold PBS and then added for an additional 3 h. Thereafter, the precipitants were washed 4 times with ice-cold lysis buffer, boiled with loading buffer (20 mM Tris, pH 6.8, 4% SDS, 20% glycerol, 0.1% bromophenol blue, 200 mM DTT) for 3 min and analyzed by SDS–PAGE and western blotting.
Immunofluorescence analysis
For cultured cells, the cells were fixed with 4% paraformaldehyde in DMEM (ThermoFisher Scientific, 11960–044) at 37°C for 15 min and then permeabilized with 0.2% Triton X-100 (Sigma-Aldrich, T8787) for 15 min on ice. The permeabilized cells were blocked with 1% FBS (ThermoFisher Scientific, SH3010903), then incubated with the indicated primary antibodies at 4°C overnight followed by the fluorescence-conjugated secondary antibodies at room temperature for 1 h. The cell images were captured with a LSM 510 Zeiss confocal microscope (Zeiss, Germany).
For tissue samples, the fresh tissues were isolated rapidly and frozen in OCT compound (SAKURA Tissue-Tek, 4583), and then the samples were cut at 5 μm thickness. The slides were blocked with 1% FBS and incubated with indicated primary antibody at 4°C overnight, followed by fluorescence-conjugated secondary antibody at room temperature for 1 h. The images were captured with a Vectra Automated Quantitative Pathology Imaging System (PerkinElmer, USA).
Mouse embryonic fibroblasts isolation, culture, and immortalization
Pregnant female mice were euthanized by CO2 asphyxiation when the embryos were 13.5-days old, and then the uterine horns containing the embryos were isolated. The head and liver were removed from the embryo in ice-cold PBS, and the remainder was minced to a very fine consistency, then digested with trypsin at 37°C with constant agitation for 45 min. The supernatant containing mouse embryonic fibroblasts (MEFs) was centrifuged and resuspended in DMEM supplemented with 10% FBS, as well as 100 U/ml penicillin (Amresco, 0339), and 100 μg/ml streptomycin (Amresco, 0382). One portion of the cells was passaged, and the other was used for genotyping via PCR and western blotting.
Immortalization of MEFs cells with SV-40 T antigen was performed as described previously [Citation72]. Briefly, primary MEF cells were transfected with SV-40 large T antigen, and G418 (ThermoFisher Scientific, 11811023) was added to select the positive clones after 24 h of transfection.
Isolation of preadipocytes and induction of adipogenesis
Gonadal fat pads were isolated rapidly and minced to a very fine consistency. The fat mince was digested with 1 mg/ml collagenase (Sigma-Aldrich, 1148089) at 37°C with constant agitation for 40–50 min. DMEM/F12 (ThermoFisher Scientific, 11320033) medium supplemented with 10% FBS was added and the stromal vascular cells were pelleted by centrifugation at 500 g for 15 min. Red blood cell lysis buffer (Sigma-Aldrich, 11814389001) was added to the pellet to remove the red blood cells, and then the cell suspension was filtered through a 40-μm filter into a new 50-mL tube. The crude preadipocytes were resuspended and plated in a sterile Petri dish containing DMEM/F12 medium supplemented with 10% FBS.
For induction of adipogenesis, the primary preadipocytes were plated at a density of 2.4 × 10⁵ cells per well in a 6-well plate. After the cells reach confluency, differentiation was induced by the addition of induction medium (DMEM/F12 supplemented with 10% FBS, as well as 10 μg/ml insulin, 1 μM dexamethasone [Sigma-Aldrich, D4902], 0.5 mM isobutylmethylxanthine [Sigma-Aldrich, I5879] and 200 μM indomethacin [Sigma-Aldrich, I7378]) for 48 h. The induction medium was then replaced with maintenance medium (DMEM/F12 supplemented with 10% FBS, as well as 1 μg/ml insulin), and the maintenance medium was replaced every 2 days for the following 7 days.
Isolation and M1, M2 polarization of bone marrow-derived monocytes (BMDMs)
Mice were sacrificed, and the pelvic and femoral bones were isolated. The bone marrow was expelled using a 27 g needle and 1-ml syringe filled with growth medium. Bone marrow cells were maintained in growth medium supplemented with CSF1/M-CSF (colony stimulating factor 1 [macrophage]; Sigma-Aldrich, M9170) and 10% FBS for 7 days. The mature macrophages were treated with 10 ng/ml LPS (Sigma-Aldrich, L2762) to induce M1 polarization, or with 10 ng/ml IL4 (Sigma-Aldrich, I1020) to induce M2 polarization, respectively [Citation73].
Stromal vascular cells isolation and flow cytometry
For isolation of stromal vascular cells, epididymal adipose tissue was excised and minced into small pieces in KRB buffer containing 12.5 mM HEPES, pH 7.4, 120 mM NaCl, 6 mM KCl, 1.2 mM MgSO4, 1 mM CaCl2, 2% BSA (Sigma-Aldrich, A1933), 2.5 mM glucose, supplemented with 1 mg/ml collagenase (Sigma-Aldrich, 1148089). These tissues were digested at 37°C with gentle shaking for 45 min, filtered through a 100-μm nylon sieve, and then centrifuged at 800 g for 5 min to collect the pellet, which is considered as the stromal vascular cells.
To examine the subpopulations of ATMs, immunophenotyping assays were performed on the freshly isolated stromal vascular cells. These cells were stained with fluorescence-conjugated antibodies including anti-ADGRE1-Phycoerythrin (BD Biosciences, 565410), anti-MRC1-Alexa Fluor 488 (BioLegend, 141709), and anti-ITGAX-Alexa Fluor 700 (BioLegend, 117319). After staining, the cells were washed and subsequently fixed with 3.7% paraformaldehyde, and then flow cytometry analysis was performed using a cytometer.
Isolation of mitochondria
Mitochondria were isolated as described previously [Citation74]. Briefly, mice were sacrificed after the indicated treatment, and the fresh tissues were isolated rapidly and minced into small pieces in STE buffer (5 mM Tris, 2 mM EGTA, 250 mM sucrose [Sigma-Aldrich, V900116], pH 7.4). Then the pieces of tissues were homogenized with a glass-Teflon homogenizer. After centrifugation at 600 g for 10 min, the supernatant was collected for another centrifugation at 10,000 g for 10 min, and the pellet was collected as the crude mitochondria.
ROS and mito-ROS analysis
For total ROS and mito-ROS analysis, cells were harvested using trypsin digestion, or directly isolated from WAT. After washed with PBS, the cells were then resuspended with PBS containing 5 μM ROS indicator DCF (Invitrogen, C6827), or with 5 μM mito-ROS indicator MitoSOX (Invitrogen, M36008). After staining for 30 min at 37°C in the dark, 2 volumes of ice-cold PBS were added to the cells, and the cells were kept on ice to terminate staining. The cells were then washed with ice-cold PBS twice and analyzed with flow cytometry. The data were analyzed with the FCS Express V3 software.
ATP analysis
ATP levels in cultured cells and fresh tissues were measured using the ATP determination kit (Beyotime Biotechnology, S0026) according to the manufacturer’s protocol. 20 mg fresh tissues were homogenized at 4°C with lysis buffer. After centrifugation at 12,000 g for 15 min, the supernatant was collected and protein concentration was detected using a Bradford Protein Assay kit. ATP detection reagent was diluted with the dilution buffer and then added into a 96-well plate. Equivalent amount of supernatants were then added into the 96-well plate. After a 5-s mixture, the luminescence was recorded in an illuminometer. The relative ATP level was finally standardized to protein content of each sample.
OCR measurement
Mitochondrial oxygen consumption rates (OCR) were determined on cultured cells and isolated mitochondria with succinate as substrate using an Oxygraph 2K (Oroboros Inc., Innsbruck, Austria). The suspended cells or isolated mitochondria were added into the chambers of an Oxygraph 2K full of buffer Z (105 mM potassium 2-[N-morpholino]-ethanesulfonic acid, 30 mM KCl, 10 mM KH2PO4, 5 mM MgCl2, 5 mg/ml BSA, 1 mM EGTA, pH 7.4) at 37°C and in the oxygen concentration 200 nmol O2/ml. The cells were permeabilized with digitonin (Sigma-Aldrich, 260746), and then 5 mM succinate (Sigma-Aldrich, 224731), 4 mM ADP (Sigma-Aldrich, A2754), and 10 uM FCCP (Sigma-Aldrich, C2920) were sequentially added into the chambers, and the oxygen consumption was recorded. All measurements were performed with constant stirring and constant 37°C. The OCR was finally standardized to cell number or mitochondrial protein content determined by Bradford assay.
Mitochondrial DNA (mtDNA) copy number quantification
Total DNA was extracted from frozen tissues. To quantify mtDNA copy number, quantitative RT-PCR was performed using a Bio-Rad IQ5 quantitative RT-PCR system (Bio-Rad, CA, USA) against external standards for mtDNA (mt-Cytb) and nuclear DNA (H19). The sequences of primers used in this study are listed in Table S2.
Transmission electron microscopy analysis
Mice were sacrificed after CD or HFD feeding, and WAT were isolated quickly, cut into small pieces and then fixed using 2% paraformaldehyde and 0.2% glutaraldehyde (Sigma-Aldrich, G5882) in Na cacodylate buffer (pH 7.4) for 2 h at room temperature followed by incubation at 4°C overnight. Tissues were washed 5 times with 100 mM phosphate buffer (19 mM NaH2PO4, 81 mM Na2HPO4) and then fixed with 1% osmium tetroxide (Sigma-Aldrich, 75632) for 1 h at room temperature followed by dehydration in 50, 70, 80, 90, and 100% ethanol for 10 min each procedure. The samples were infiltrated sequentially in 1:3, 1:1, 3:1 EPON (Sigma-Aldrich, 45347):100% ethanol for 1 h each procedure, then 100% EPON for 3 h, and polymerized in 100% EPON with DMP-30 (Sigma-Aldrich, T58203) at 60°C for 24 h. Ultra-thin sections were isolated and stained in 2% uranyl acetate. The samples were visualized using a 120 kV Jeol electron microscope (JEOL, USA) at 80 kV and images were captured.
Mito-timer assay
The Mito-Timer DNA (Addgene, 52659, deposited by Dr. Zhen Yan’s lab) was cloned into the pTRE-Tet-On lentiviral transfer vector (maintained in our lab), and the WT and fundc1 KO adipocytes were transfected with this plasmid. The stable Mito-Timer-expressing cells were sorted by flow cytometry after 48 h of tetracycline (Tet; Sigma-Aldrich, 58346-M) induction. For the Mito-Timer assay, cells with 24 h and 48 h of Tet induction were analyzed by flow cytometry analysis, or fixed with 3.7% paraformaldehyde solution and the images were captured using a LSM510 Meta confocal microscope (Zeiss, Germany).
mt-Keima assay
The mt-Keima DNA (Addgene, 72342, deposited by Dr. Richard Youle’s lab) was cloned into the lentiviral transfer vector. mt-Keima expressed virus were packaged by transfection the vector into HEK-293T cells. The WT and fundc1 KO adipocytes were infected with the virus, and the stably expressed cells were sorted by using flow cytometry. The indicated cells plated in confocal dishes were maintained in a hypoxic chamber (with 1% O2, 5% CO2, and 94% N2) for 24 h or maintained in normoxia. After hypoxia, the cells were observed and the images were captured with a LSM 510 Zeiss confocal microscope (Zeiss, Germany). Fluorescence of mt-Keima was imaged in two channels via two sequential excitations (458 nm, green; 543 nm, red) and using a 620-nm emission range.
Serum biochemistry analysis
Animals fed on CD or HFD were fasted overnight. Blood was collected from the tail vein to measure fasted blood glucose with a handheld glucometer (Johnson & Johnson, NJ, USA). For GOT1 and GPT analysis, blood was collected directly from the heart of anaesthetized mice, followed immediately by centrifugation at 3,000 g, 4°C. The supernatant was collected as plasma and stored at −80°C for further biochemical analysis using the corresponding kit (GOT1, Sigma-Aldrich, MAK055; GPT, Sigma-Aldrich, MAK052).
Plasma insulin and ADIPOQ analysis
Serum was collected and the levels of plasma insulin and ADIPOQ were determined using ELISA kits according to the manufacturer’s instructions (insulin, Millipore, EZRMI-13K; ADIPOQ, Millipore, EZMADP-60K).
Analysis of plasma inflammatory cytokines
The serum was collected and the levels of plasma IL6, TNF and CCL2 were determined using commercial ELISA kits according to the manufacturer’s instructions (IL6, BioLegend, 431307; TNF, BioLegend, 430907; CCL2, BioLegend, 432704).
Acute insulin sensitivity assay
0.75 U/kg bodyweight of insulin was intraperitoneally injected to mice that had been fasted overnight (14–16 h). The mice were sacrificed and dissected 10 min after the insulin injection. The insulin-responsive tissues including WAT, skeletal muscle and liver were rapidly isolated and frozen at −80°C. Tissue lysates were prepared and proteins involved in insulin signaling, especially AKT signaling components, were analyzed with western blotting.
Glucose tolerance tests
1 g/kg bodyweight of glucose was intraperitoneally injected to mice that had been fasted overnight (14–16 h). Blood was taken from the tail vein and blood glucose was analyzed at basal, 15, 30, 60, 90, and 120 min after glucose injection with a handheld glucometer. The area under curve (AUC) was calculated to evaluate glucose tolerance for each group of mice.
Insulin tolerance tests
0.75 U/kg bodyweight of insulin was intraperitoneally injected to 6-h-fasted mice. Blood was taken from the tail vein and blood glucose was analyzed at basal, 15, 30, 60, 90, and 120 min after insulin injection with a handheld glucometer. AUC was calculated to evaluate insulin tolerance for each group of mice.
Oxyblot assay
Mitochondria were isolated from fresh adipose tissues from WT and KO mice challenged with the indicated treatment. The mitochondria were lysed in lysis buffer (137 mM NaCl, 20 mM Tris, pH 7.4, 2 mM EGTA, 1% NP-40) supplemented with protease inhibitors. The total protein concentration of each mitochondrial lysate was analyzed with a Bradford Protein Assay kit, and mitochondrial lysates with equivalent protein quantities were reacted using the OxyBlot kit according to the manufacturer’s protocol. The levels of oxidized protein were analyzed by western blotting.
Statistical analysis
For quantitative analysis presented as histograms, values were obtained from three independent experiments and are expressed as the mean ± SEM. Statistical significance was determined by a Student’s t-test. p < 0.05 was considered as statistically significant. All statistical analysis was performed with GraphPad Prism software.
Supplemental Material
Download Zip (4.2 MB)Acknowledgments
We thank Dr. An-ning Lin (University of Chicago) and Dr. Yong Liu (Institute for Nutritional Sciences, Chinese Academy of Sciences, Shanghai, China) for their generous gift of mapk8 KO mice. We are grateful to Prof. Pin-sheng Liu (National Laboratory of Biomacromolecules, Institute of Biophysics, Chinese Academy of Sciences, Beijing, China) for his constructive suggestions. We are also grateful to Dr. Yong Liu (Institute for Nutritional Sciences, Chinese Academy of Sciences, Shanghai, China) and Dr. Sheng-cai Lin (Xiamen University, China) for critically reading the manuscript. The authors thank Dr. Guo-peng Wang (Core Facilities at the School of Life Sciences, Peking University, Beijing, China), as well as Yin-zi Ma and Peng-yan Xia (electron microscope center, State Key Laboratory of Membrane Biology, Institute of Zoology, Beijing, China) for their assistance with transmission electron microscopy work.
Disclosure statement
No potential conflict of interest was reported by the authors.
Supplementary material
Supplemental data for this article can be accessed here.
Additional information
Funding
Related Research Data
References
- Lakka HM, Laaksonen DE, Lakka TA, et al. The metabolic syndrome and total and cardiovascular disease mortality in middle-aged men. Jama. 2002 Dec 4;288(21):2709–2716. PubMed PMID: 12460094.
- Despres JP, Lemieux I. Abdominal obesity and metabolic syndrome. Nature. 2006 Dec 14;444(7121):881–887. PubMed PMID: 17167477.
- Popkin BM, Adair LS, Ng SW. Global nutrition transition and the pandemic of obesity in developing countries. Nutr Rev. 2012 Jan;70(1):3–21. PubMed PMID: 22221213. PubMed Central PMCID: PMC3257829.
- Liu Z, Butow RA. Mitochondrial retrograde signaling. Annu Rev Genet. 2006;40:159–185. PubMed PMID: 16771627.
- Kelley DE, He J, Menshikova EV, et al. Dysfunction of mitochondria in human skeletal muscle in type 2 diabetes. Diabetes. 2002 Oct;51(10):2944–2950. PubMed PMID: 12351431.
- Samuel VT, Petersen KF, Shulman GI. Lipid-induced insulin resistance: unravelling the mechanism. Lancet. 2010 Jun 26;375(9733):2267–2277. PubMed PMID: 20609972. PubMed Central PMCID: PMC2995547.
- Supale S, Li N, Brun T, et al. Mitochondrial dysfunction in pancreatic β cells. Trends Endocrinol Metab. 2012 Sep;23(9):477–487. PubMed PMID: 22766318.
- Itani SI, Ruderman NB, Schmieder F, et al. Lipid-induced insulin resistance in human muscle is associated with changes in diacylglycerol, protein kinase C, and I kappa B-alpha. Diabetes. 2002 Jul;51(7):2005–2011. PubMed PMID: ISI:000176616200002.
- Anderson EJ, Lustig ME, Boyle KE, et al. Mitochondrial H2O2 emission and cellular redox state link excess fat intake to insulin resistance in both rodents and humans. J Clin Invest. 2009 Mar;119(3):573–581. PubMed PMID: ISI:000263941000020.
- Koves TR, Ussher JR, Noland RC, et al. Mitochondrial overload and incomplete fatty acid oxidation contribute to skeletal muscle insulin resistance. Cell Metab. 2008 Jan;7(1):45–56. PubMed PMID: ISI:000252235100008.
- Kim JA, Wei Y, Sowers JR. Role of mitochondrial dysfunction in insulin resistance. Circ Res. 2008 Feb 29;102(4):401–414. PubMed PMID: 18309108. PubMed Central PMCID: PMC2963150.
- Youle RJ, Narendra DP. Mechanisms of mitophagy. Nat Rev Mol Cell Biol. 2011 Jan;12(1):9–14. PubMed PMID: 21179058. PubMed Central PMCID: PMC4780047.
- Novak I, Kirkin V, McEwan DG, et al. Nix is a selective autophagy receptor for mitochondrial clearance. Embo Rep. 2010 Jan;11(1):45–51. PubMed PMID: ISI:000273044300017.
- Hanna RA, Quinsay MN, Orogo AM, et al. Microtubule-associated protein 1 light chain 3 (LC3) interacts with Bnip3 protein to selectively remove endoplasmic reticulum and mitochondria via autophagy. J Biol Chem. 2012 Jun 1;287(23):19094–19104. PubMed PMID: ISI:000306411900020.
- Murakawa T, Yamaguchi O, Hashimoto A, et al. Bcl-2-like protein 13 is a mammalian Atg32 homologue that mediates mitophagy and mitochondrial fragmentation. Nat Commun. 2015 Jul;6:7527. PubMed PMID: ISI:000358845800001.
- Wei YJ, Chiang WC, Sumpter R, et al. Prohibitin 2 Is an inner mitochondrial membrane mitophagy receptor. Cell. 2017 Jan 12;168(1–2):224–238.e10. PubMed PMID: ISI:000396246700024.
- Bhujabal Z, Birgisdottir AB, Sjottem E, et al. FKBP8 recruits LC3A to mediate Parkin-independent mitophagy. Embo Rep. 2017 Jun;18(6):947–961. PubMed PMID: 28381481. PubMed Central PMCID: PMC5452039.
- Okamoto K, Kondo-Okamoto N, Ohsumi Y. Mitochondria-anchored receptor Atg32 mediates degradation of mitochondria via selective autophagy. Dev Cell. 2009 Jul 21;17(1):87–97. PubMed PMID: ISI:000268373900011.
- Kanki T, Wang K, Cao Y, et al. Atg32 Is a mitochondrial protein that confers selectivity during mitophagy. Dev Cell. 2009 Jul 21;17(1):98–109. PubMed PMID: ISI:000268373900012.
- Okamoto K. Organellophagy: eliminating cellular building blocks via selective autophagy. J Cell Biol. 2014 May 26;205(4):435–445. PubMed PMID: 24862571. PubMed Central PMCID: PMC4033777.
- Liu L, Sakakibara K, Chen Q, et al. Receptor-mediated mitophagy in yeast and mammalian systems. Cell Res. 2014 Jul;24(7):787–795. PubMed PMID: 24903109. PubMed Central PMCID: PMC4085769.
- Narendra D, Tanaka A, Suen DF, et al. Parkin is recruited selectively to impaired mitochondria and promotes their autophagy. J Cell Biol. 2008 Dec 1;183(5):795–803. PubMed PMID: ISI:000261232000007.
- Narendra DP, Jin SM, Tanaka A, et al. PINK1 is selectively stabilized on impaired mitochondria to activate Parkin. Plos Biol. 2010 Jan;8(1):e1000298. PubMed PMID: ISI:000275256800011.
- Lazarou M, Sliter DA, Kane LA, et al. The ubiquitin kinase PINK1 recruits autophagy receptors to induce mitophagy. Nature. 2015 Aug 20;524(7565):309–314. PubMed PMID: ISI:000359714000027.
- Komatsu M, Waguri S, Ueno T, et al. Impairment of starvation-induced and constitutive autophagy in Atg7-deficient mice. J Cell Biol. 2005 May 9;169(3):425–434. PubMed PMID: ISI:000228995800009.
- Masiero E, Agatea L, Mammucari C, et al. Autophagy is required to maintain muscle mass. Cell Metab. 2009 Dec 2;10(6):507–515. PubMed PMID: ISI:000272312200010.
- Mortensen M, Ferguson DJP, Edelmann M, et al. Loss of autophagy in erythroid cells leads to defective removal of mitochondria and severe anemia in vivo. Proc Natl Acad Sci U S A. 2010 Jan 12;107(2):832–837. PubMed PMID: ISI:000273559300058.
- Seillier M, Pouyet L, N‘Guessan P, et al. Defects in mitophagy promote redox-driven metabolic syndrome in the absence of TP53INP1. Embo Mol Med. 2015 Jun;7(6):802–818. PubMed PMID: ISI:000355686400009.
- Hoshino A, Ariyoshi M, Okawa Y, et al. Inhibition of p53 preserves Parkin-mediated mitophagy and pancreatic beta-cell function in diabetes. Proc Natl Acad Sci U S A. 2014 Feb 25;111(8):3116–3121. PubMed PMID: ISI:000332180900053.
- Drew BG, Ribas V, Le JA, et al. HSP72Is a mitochondrial stress sensor critical for Parkin action, oxidative metabolism, and insulin sensitivity in skeletal muscle. Diabetes. 2014 May;63(5):1488–1505. PubMed PMID: ISI:000334796600015.
- Liu L, Feng D, Chen G, et al. Mitochondrial outer-membrane protein FUNDC1 mediates hypoxia-induced mitophagy in mammalian cells. Nat Cell Biol. 2012 Feb;14(2):177–185. PubMed PMID: ISI:000300332500012.
- Wu H, Xue DF, Chen G, et al. The BCL2L1 and PGAM5 axis defines hypoxia-induced receptor-mediated mitophagy. Autophagy. 2014 Oct;10(10):1712–1725. PubMed PMID: ISI:000345704900004.
- Zhang WL, Ren H, Xu CL, et al. Hypoxic mitophagy regulates mitochondrial quality and platelet activation and determines severity of I/R heart injury. Elife. 2016 Dec 20;5. PubMed PMID: ISI:000392551200001.
- Stadtman ER. Protein oxidation and aging. Science. 1992 Aug 28;257(5074):1220–1224. PubMed PMID: ISI:A1992JL05000017.
- Candas D, Li JJ. MnSOD in oxidative stress response- potential regulation via mitochondrial protein influx. Antioxid Redox Sign. 2014 Apr 1;20(10):1599–1617. PubMed PMID: ISI:000332211500006.
- Regazzetti C, Peraldi P, Gremeaux T, et al. Hypoxia decreases insulin signaling pathways in adipocytes. Diabetes. 2009 Jan;58(1):95–103. PubMed PMID: 18984735. PubMed Central PMCID: PMC2606898.
- Hosogai N, Fukuhara A, Oshima K, et al. Adipose tissue hypoxia in obesity and its impact on adipocytokine dysregulation. Diabetes. 2007 Apr;56(4):901–911. PubMed PMID: 17395738.
- Sun N, Yun J, Liu J, et al. Measuring in vivo mitophagy. Mol Cell. 2015 Nov 19;60(4):685–696. PubMed PMID: ISI:000368288700017.
- Ferree AW, Trudeau K, Zik E, et al. MitoTimer probe reveals the impact of autophagy, fusion, and motility on subcellular distribution of young and old mitochondrial protein and on relative mitochondrial protein age. Autophagy. 2013 Nov 1;9(11):1887–1896. PubMed PMID: 24149000. PubMed Central PMCID: PMC4028338.
- Chen G, Han Z, Feng D, et al. A regulatory signaling loop comprising the PGAM5 phosphatase and CK2 controls receptor-mediated mitophagy. Mol Cell. 2014 May 8;54(3):362–377. PubMed PMID: 24746696.
- Lumeng CN, Bodzin JL, Saltiel AR. Obesity induces a phenotypic switch in adipose tissue macrophage polarization. J Clin Investig. 2007 Jan;117(1):175–184. PubMed PMID: ISI:000243538400022.
- Weisberg SP, McCann D, Desai M, et al. Obesity is associated with macrophage accumulation in adipose tissue. J Clin Investig. 2003 Dec;112(12):1796–1808. PubMed PMID: ISI:000187348300007.
- Han MS, Jung DY, Morel C, et al. JNK expression by macrophages promotes obesity-induced insulin resistance and inflammation. Science. 2013 Jan 11; 339(6116):218–222. PubMed PMID: ISI:000313328200048.
- Kanda H, Tateya S, Tamori Y, et al. MCP-1 contributes to macrophage infiltration into adipose tissue, insulin resistance, and hepatic steatosis in obesity. J Clin Investig. 2006 Jun; 116(6):1494–1505. PubMed PMID: ISI:000237979700012.
- Patsouris D, Li PP, Thapar D, et al. Ablation of CD11c-positive cells normalizes insulin sensitivity in obese insulin resistant animals. Cell Metab. 2008 Oct 8;8(4):301–309. PubMed PMID: ISI:000259897200006.
- Hirosumi J, Tuncman G, Chang L, et al. A central role for JNK in obesity and insulin resistance. Nature. 2002 Nov 21;420(6913):333–336. PubMed PMID: 12447443.
- Lee YH, Giraud J, Davis RJ, et al. c-Jun N-terminal kinase (JNK) mediates feedback inhibition of the insulin signaling cascade. J Biol Chem. 2003 Jan 31;278(5):2896–2902. PubMed PMID: ISI:000180915000018.
- Davis RJ. Signal transduction by the JNK group of MAP kinases. Cell. 2000 Oct 13;103(2):239–252. PubMed PMID: ISI:000089864300008.
- Sabio G, Davis RJ. cJun NH2-terminal kinase 1 (JNK1): roles in metabolic regulation of insulin resistance. Trends Biochem Sci. 2010 Sep;35(9):490–496. PubMed PMID: ISI:000281913500003.
- Vernia S, Cavanagh-Kyros J, Barrett T, et al. Diet-induced obesity mediated by the JNK/DIO2 signal transduction pathway. Gene Dev. 2013 Nov 1;27(21):2345–2355. PubMed PMID: ISI:000326921900006.
- Sabio G, Das M, Mora A, et al. A stress signaling pathway in adipose tissue regulates hepatic insulin resistance. Science. 2008 Dec 5;322(5907):1539–1543. PubMed PMID: ISI:000261377400048.
- Zhang XM, Xu AM, Chung SK, et al. Selective inactivation of c-Jun NH2-terminal kinase in adipose tissue protects against diet-induced obesity and improves insulin sensitivity in both liver and skeletal muscle in mice. Diabetes. 2011 Feb;60(2):486–495. PubMed PMID: ISI:000287172100017.
- Jiao P, Chen Q, Shah S, et al. Obesity-related upregulation of monocyte chemotactic factors in adipocytes involvement of nuclear factor-kappa B and c-Jun NH(2)-terminal kinase pathways. Diabetes. 2009 Jan;58(1):104–115. PubMed PMID: ISI:000262187100020.
- Kim K, Kim JK, Jeon JH, et al. c-Jun N-terminal kinase is involved in the suppression of adiponectin expression by TNF-alpha in 3T3-L1 adipocytes. Biochem Biophys Res Commun. 2005 Feb 11;327(2):460–467. PubMed PMID: ISI:000226364000012.
- Koh EH, Park JY, Park HS, et al. Essential role of mitochondrial function in adiponectin synthesis in adipocytes. Diabetes. 2007 Dec;56(12):2973–2981. PubMed PMID: ISI:000251365400019.
- Kadowaki T, Yamauchi T, Kubota N, et al. Adiponectin and adiponectin receptors in insulin resistance, diabetes, and the metabolic syndrome. J Clin Investig. 2006 Jul;116(7):1784–1792. PubMed PMID: ISI:000238924900007.
- Ohashi K, Shibata R, Murohara T, et al. Role of anti-inflammatory adipokines in obesity-related diseases. Trends Endocrinol Metab. 2014 Jul;25(7):348–355. PubMed PMID: ISI:000339038700003.
- Yang L, Li P, Fu SN, et al. Defective hepatic autophagy in obesity promotes ER stress and causes insulin resistance. Cell Metab. 2010 Jun 9;11(6):467–478. PubMed PMID: ISI:000278747800006.
- Stienstra R, Haim Y, Riahi Y, et al. Autophagy in adipose tissue and the beta cell: implications for obesity and diabetes. Diabetologia. 2014 Aug;57(8):1505–1516. PubMed PMID: ISI:000338997500001.
- Ebato C, Uchida T, Arakawa M, et al. Autophagy is important in islet homeostasis and compensatory increase of beta cell mass in response to high-fat diet. Cell Metab. 2008 Oct 8;8(4):325–332. PubMed PMID: ISI:000259897200009.
- Jung HS, Chung KW, Kim JW, et al. Loss of autophagy diminishes pancreatic beta cell mass and function with resultant hyperglycemia. Cell Metab. 2008 Oct 8;8(4):318–324. PubMed PMID: ISI:000259897200008.
- Singh R, Kaushik S, Wang YJ, et al. Autophagy regulates lipid metabolism. Nature. 2009 Apr 30;458(7242):1131–U64. PubMed PMID: ISI:000265754600039.
- Zhang Y, Goldman S, Baerga R, et al. Adipose-specific deletion of autophagy-related gene 7 (atg7) in mice reveals a role in adipogenesis. Proc Natl Acad Sci U S A. 2009 Nov 24;106(47):19860–19865. PubMed PMID: ISI:000272180900024.
- Singh R, Xiang YQ, Wang YJ, et al. Autophagy regulates adipose mass and differentiation in mice. J Clin Invest. 2009 Nov;119(11):3329–3339. PubMed PMID: ISI:000271589400017.
- Kim KH, Jeong YT, Oh H, et al. Autophagy deficiency leads to protection from obesity and insulin resistance by inducing Fgf21 as a mitokine. Nat Med. 2013 Jan;19(1):83–92. PubMed PMID: ISI:000313230300029.
- Jansen HJ, van Essen P, Koenen T, et al. Autophagy activity is up-regulated in adipose tissue of obese individuals and modulates proinflammatory cytokine expression. Endocrinology. 2012 Dec;153(12):5866–5874. PubMed PMID: ISI:000311752300018.
- Kovsan J, Bluher M, Tarnovscki T, et al. Altered autophagy in human adipose tissues in obesity. J Clin Endocrinol Metab. 2011 Feb;96(2):E268–E277. PubMed PMID: 21047928.
- Ost A, Svensson K, Ruishalme I, et al. Attenuated mTOR signaling and enhanced autophagy in adipocytes from obese patients with type 2 diabetes. Mol Med. 2010 Jul–Aug;16(7–8):235–246. PubMed PMID: 20386866. PubMed Central PMCID: PMC2896460.
- Valero T. Mitochondrial biogenesis: pharmacological approaches. Curr Pharm Design. 2014;20(35): 5507–5509. PubMed PMID: ISI:000342004900001.
- Shen W, Liu K, Tian C, et al. R-alpha-Lipoic acid and acetyl-L-carnitine complementarily promote mitochondrial biogenesis in murine 3T3-L1 adipocytes. Diabetologia. 2008 Jan;51(1):165–174. PubMed PMID: ISI:000251320900023.
- Clapham JC, Arch JRS. Targeting thermogenesis and related pathways in anti-obesity drug discovery. Pharmacol Therapeut. 2011 Sep;131(3):295–308. PubMed PMID: ISI:000293677300004.
- Forest C, Czerucka D, Negrel R, et al. Establishment of a human cell line after transformation by a plasmid containing the early region of the SV40 genome. Cell Biol Int Rep. 1983 Jan;7(1):73–81. PubMed PMID: 6299591.
- Lawrence T, Natoli G. Transcriptional regulation of macrophage polarization: enabling diversity with identity. Nat Rev Immunol. 2011 Nov;11(11):750–761. PubMed PMID: 22025054.
- Frezza C, Cipolat S, Scorrano L. Organelle isolation: functional mitochondria from mouse liver, muscle and cultured filroblasts. Nat Protoc. 2007;2(2):287–295. PubMed PMID: ISI:000253138100008.