
ABSTRACT
Macroautophagy/autophagy is a cellular process in which cytosolic contents are degraded by lysosome in response to various stress conditions. Apart from its role in the maintenance of cellular homeostasis, autophagy also involves in regulation of cell cycle progression under nutrient-deprivation conditions. However, whether and how autophagy is regulated by the cell cycle especially during mitosis remains largely undefined. Here we show that WIPI2/ATG18B (WD repeat domain, phosphoinositide interacting 2), an autophagy-related (ATG) protein that plays a critical role in autophagosome biogenesis, is a direct substrate of CUL4-RING ubiquitin ligases (CRL4s). Upon mitosis induction, CRL4s are activated via neddylation, and recruit WIPI2 via DDB1 (damage specific DNA binding protein 1), leading to polyubiquitination and proteasomal degradation of WIPI2 and suppression of autophagy. The WIPI2 protein level and autophagy during mitosis could be rescued by knockdown of CRL4s or treatment with MLN4924/Pevonedistat, a selective inhibitor of CRLs, via suppression of NAE1 (NEDD8 activating enzyme E1 subunit 1). Moreover, restoration of WIPI2 rescues autophagy during mitosis and leads to mitotic slippage and cell senescence. Our study thus discovers a novel function of CRL4s in autophagy by targeting WIPI2 for polyubiquitination and proteasomal degradation during mitosis.
Abbreviations: ACTB, actin beta; ATG, autophagy-related; AMPK, AMP-activated protein kinase; AURKB/ARK2, aurora kinase B; BafA1, bafilomycin A1; CCNB1, cyclin B1; CDK1, cyclin dependent kinase 1; CHX, cycloheximide; CQ, chloroquine; CRL4s, CUL4-RING ubiquitin ligases; DDB1, damage specific DNA binding protein 1; GAPDH, glyceraldehyde-3-phosphate dehydrogenase; GFP, green fluorescent protein; GST, glutathione S-transferase; MAP1LC3B/LC3B, microtubule associated protein 1 light chain 3 beta; STK11/LKB1,serine/threonine kinase 11; MTORC1/MTOR complex 1, mechanistic target of rapamycin kinase complex 1; NAE1, NEDD8 activating enzyme E1 subunit 1; NOC, nocodazole; RING, really interesting new gene; RBX1, ring-box 1; SA-GLB1/β-gal, senescence-associated galactosidase beta 1; TSC2, TSC complex subunit 2; TUBA, tubulin alpha; WIPI2, WD repeat domain, phosphoinositide interacting 2
Introduction
Autophagy is an evolutionarily conserved process in which cytoplasmic contents are engulfed by a double-membrane structure named autophagosome and then fuses with lysosome for degradation [Citation1,Citation2]. At present, it has been well-established that the autophagic process, in particular the autophagosome biogenesis is controlled by a group of proteins coded by the autophagy-related (ATG) genes [Citation3–Citation5]. Up to date, more than 40 Atgs have been identified in yeast. Among them, about 16 are well conserved in mammalians and play key roles in control of autophagosome formation. In recent years, there is emerging evidence demonstrating that the WIPI (WD-repeat protein domain, phosphoinositide interacting) family plays an important role in facilitating the nucleation and expansion of phagophore membranes [Citation6,Citation7]. There are 4 members of WIPI (WIPI1, WIPI2, WDR45B/WIPI3 and WDR45/WIPI4/WDRX1) [Citation8]. Among them, WIPI1/Atg18 is considered to function upstream of LC3 lipidation, although its exact role in autophagy has not yet been defined [Citation9]. WDR45B and WDR45 were recently reported to act upstream of phosphatidylinositol-3-phosphate (PtdIns3P) by regulating the STK11/LKB1-AMPK-TSC2 signaling circuit and in controlling the size of nascent autophagosome [Citation10]. Importantly, there is strong evidence demonstrating the critical role of WIPI2 in autophagy: WIPI2 mediates the recruitment of the ATG12–ATG5-ATG16L1 complex to the class III phosphatidylinositol 3-kinase-positive omegasome by directly interacting with ATG16L1, and such interaction is indispensable for LC3 lipidation and autophagosome biogenesis in starvation-induced autophagy [Citation11]. Thus, targeting WIPI proteins especially WIPI2 would be a direct and efficient way to modulate autophagy activity. However, how these WIPI proteins are regulated remains largely unknown.
At present, the relationship between autophagy and cell cycle remains elusive. On the one hand, autophagy is involved in cell cycle regulation. Activation of autophagy by starvation or by autophagy inducers leads to cell cycle arrest in the G1 or G2 phase [Citation12–Citation14]. Under starvation condition, autophagy has been shown to be required for cell cycle progression and for maintenance of genome stability [Citation15]. Moreover, autophagy has been revealed to be required for midbody ring digestion during the cytokinesis phase to ensure successful separation of the two daughter cells [Citation16–Citation20]. On the other hand, it remains unclear or controversial whether and how cell cycle regulates autophagy. It has been reported that autophagy is activated during mitosis [Citation21,Citation22]. In contrast, there are compelling evidence showing impaired autophagy during mitosis. For instance, autophagy is inhibited during mitosis and the autophagosome structure is only observed in late telophase where the envelope of the nuclear is reformed [Citation23]. Consistently, it has been demonstrated that CDK1 (cyclin dependent kinase 1) phosphorylates PIK3C3/VPS34 (phosphatidylinositol 3-kinase catalytic subunit type 3), which then disrupts the association of PIK3C3 with BECN1/Beclin1 and thereby inhibits autophagy during mitosis [Citation24]. More work is needed to fully understand the regulation of autophagy in mitotic cells.
Ubiquitination is one of the key forms of protein post-translational modifications, a process catalyzed by the coordinated action of the ubiquitin-activating enzyme (E1), ubiquitin-conjugation enzyme (E2) and ubiquitin protein ligase (E3) [Citation25]. The ubiquitin E3 ligases consist of two major families, the HECT (homologous to the E6-AP carboxyl terminus) family and the RING (really interesting new gene) family. The CUL/cullin-RING E3 ligases (CRLs) belongs to the RING family and is the largest family of ubiquitin E3 ligases that account for approximately 20% of the protein substrates degraded [Citation26]. There are 4 main groups of CRLs: CRL1, CRL2/5, CRL3 and CRL4 [Citation27]. Among them, CRL4s (CRL4A and CRL4B) are assembled with CUL4, adaptor protein DDB1, RBX1 and a DWD (or WD) domains-containing-substrate recognition protein. At present, there is substantial evidence demonstrating the critical roles of CRLs in regulation of autophagy. For instance, CRL1-FBXL20 (or SCF-FBXL20) mediate the poly-ubiquitination and proteasomal degradation of PIK3C3, leading to suppression of autophagy [Citation28]. CRL3-ZBTB16 control the initiation of autophagy by mediating the degradation of ATG14, an essential player responsible for mediating PtdIns3P production [Citation29]. Moreover, CRL3-KLHL20 also govern the ubiquitination and proteasomal degradation of ULK1 (unc-51 like autophagy activating kinase 1) and PIK3C3 to terminate autophagy in prolonged starvation [Citation30]. As the studies described above reveal that both CRL1s and CRL3s possess inhibitory effects on autophagy by degradation of key ATG proteins, the involvement of CRL4s in autophagy appears to be rather intriguing. While earlier reports have shown that CRL4s positively regulate the MTORC1 pathway to inhibit autophagy [Citation31,Citation32], CRL4s also mediate K63-linked poly-ubiquitination of BECN1 via AMBRA1 (autophagy and BECN1 regulator 1), thereby facilitating the formation of the PIK3C3 complex and promoting starvation-induced autophagy [Citation33]. However, in prolonged starvation, CRL4s directly targets AMBRA1 for poly-ubiquitination and degradation to terminate autophagy [Citation33].
Apart from their potential roles in autophagy, CRLs are also important in cell cycle regulation [Citation34]. For instance, CRL4A-SKP2 acts to facilitate the transition from G1 to S phase by targeting CDKN1B/p27, one of the main inhibitors of CDK, for proteasomal degradation [Citation35]. CRL4-DCAF11/WDR23 catalyze the non-proteolytic polyubiquitination of SLBP (stem-loop binding protein) to ensure the histone supply during DNA replication [Citation36]. Also, CRL4-DTL/CDT2 mediate the polyubiquitination and degradation of CDT1 (chromatin licensing and DNA replication factor 1) to ensure proper DNA replication during the S phase [Citation37,Citation38]. Moreover, during the mitotic phase, CRL4A mediates the degradation of RASSF1A (Ras association domain family 1, isoform A) to suppress its ability to induce mitotic arrest [Citation39]. These findings thus suggest that CRL4s play an active role in cell cycle progression. Given the fact that CRL4s are activated during mitosis, it remains to be investigated whether CRL4s connect autophagy with cell cycle.
In this study, we identified WIPI2 as a direct substrate of CRL4s. During mitosis, CRL4s are activated via neddylation, and the activated CRL4s recruit WIPI2 via DDB1, leading to its polyubiquitination and proteasomal degradation and eventually suppression of autophagy during mitosis. Our study thus discovers a novel mechanism underlying the defective autophagy during mitosis and provide new insights into the intricate relationship between autophagy and cell cycle regulation.
Results
Autophagy is inhibited during mitosis and rescued by MLN4924, a CRLs inhibitor
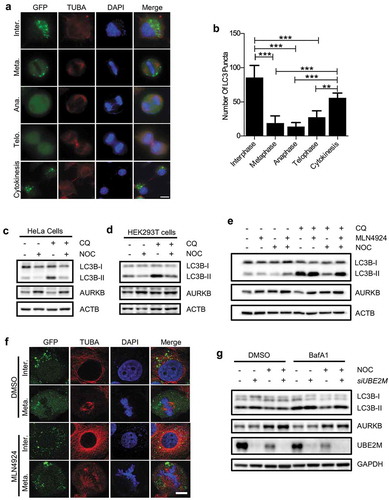
While some studies have indicated that autophagy activity is inhibited during mitosis [Citation23,Citation24], other reports argued that mitotic cells have high autophagic activity [Citation21,Citation22], rendering the regulation of autophagy in mitosis controversial. In this study, we first examined the autophagy level during mitosis by using HeLa cells stably expressing GFP-LC3, a well characterized autophagosome marker. We first studied the autophagy level in asynchronously proliferating cell populations by examining the number of GFP-LC3 puncta in cells at different cell cycle stages. We observed that cells at the mitotic phases have much fewer number of LC3 puncta than cells in the interphase, and the number of the GFP-LC3 puncta recovers after the cells enter the cytokinesis phase ()). It has been reported that GFP-LC3 fluorescence signal could be quenched by lysosome [Citation40]. To exclude the possibility that the reduced GFP-LC3 puncta during mitosis is due to enhanced flux to lysosome, we also performed an immunofluorescence assay using anti-LC3B antibody to examine the endogenous LC3. Similar to the results obtained from the GFP-LC3-HeLa cells, we observed that the endogenous LC3 puncta signal diminishes during the mitotic phase (Figure S1(a,b)). Consistent with this result, cells arrested at the G2/M phase by nocodazole, a microtubule poison that is known to cause mitotic arrest by inhibiting microtubules polymerization and formation of the mitotic spindle, also showed an evident reduction in GFP-LC3 puncta (Figure S1(c)). Next, we further checked the changes of autophagic flux by detection of LC3B-I to LC3B-II conversion in the presence of chloroquine (CQ) using immunoblotting. As expected, reduced autophagic flux was found in cells treated with nocodazole in both HeLa () and HEK293T cells (). Similar results were also found in HeLa cells which were first double-blocked with thymidine at G1 phase and then released into fresh medium until it reached the G2/M phase at 10 h (Figure S1(d)). It has been reported that microtubules play a critical role in stress (such as starvation)-induced autophagosome formation and autophagosome-lysosome fusion [Citation41], while disruption of microtubules does not affect basal autophagy [Citation42–Citation44]. Consistent with these studies, we found that nocodazole has almost no effects on the autophagy flux at the early time point (up to 8 h), while it can strongly inhibit the autophagy flux at the late time point (at 12 and 16 h) where the cells were arrested in the mitotic phase (Figure S1(e)). These results collectively demonstrate that autophagy is indeed inhibited during mitosis.
Figure 1. Autophagy is inhibited during mitosis.
(a) HeLa GFP-LC3 stable cell line were treated with 50 μM chloroquine (CQ) 2 h before being fixed with 4% PFA and stained with anti-TUBA. The coverslips were then mounted with mounting medium containing DAPI. The distribution of LC3 puncta was observed in mitotic cells under microscope. Scale bar: 10 µm.(b) Quantification of the number of LC3 puncta in cells of different mitotic phases (n = 10). Columns, mean; bars, ± S.D. (**, P < 0.01; ***, P < 0.001; One way ANOVA with Dunnett’s multiple comparisons test).(c and d) HeLa cells (c) or HEK293T cells (d) were treated with 250 ng/ml nocodazole (NOC) for 16 h. Cells were treated with either DMSO or 25 μM CQ for 2 h before being harvested and were subsequently subjected to western blot analysis. AURKB/ARK2 was used as a G2/M phase marker.(e) HeLa cells were treated with either MLN4924 (1 μM), NOC (200 ng/ml) or NOC (200 ng/ml) plus MLN4924 (1 μM) for 16 h, the cells were then treated with or without CQ (25 μM) for 2 h and subjected to western blot analysis.(f) HeLa GFP-LC3 stable cell line were treated with either DMSO or MLN4924 (1 μM) for 16 h. Cells were then fixed with 4% PFA and stained with anti-TUBA. The coverslips were then mounted with mounting medium containing DAPI. The coverslips were subsequently subjected to immunofluorescence analysis as indicated. Scale bar: 5 µm.(g) HeLa cells were transfected with siRNA targeting UBE2M for 48 h and were treated with either DMSO or nocodazole (200 ng/ml) for 16 h. The cells were then treated with or without BafA1 (100 nM) for 2 h and subjected to western blot analysis.
To understand the underlying mechanisms that mediate the mitotic inhibition of autophagy, we attempted to rescue autophagy by using different autophagy inducers. MTORC1 is a key negative regulator for autophagy by directly suppressing the ULK1 complex [Citation45,Citation46]. Thus, suppression of MTORC1 by starvation or MTORC1 inhibitors could effectively activate autophagy [Citation2]. We therefore investigated the effects of starvation (EBSS) and 2 MTORC1 inhibitors, rapamycin and PP242, on mitotic inhibition of autophagy. Our results revealed that neither EBSS, nor rapamycin or PP242 was able to fully reactivate autophagy in the mitotic cells synchronized by nocodazole (Figure S1(c and f)). Furthermore, in the naturally occurred mitotic cells, PP242 failed to rescue the inhibition of autophagy (Figure S1(g)). Such observations indicate that the mitotic inhibition of autophagy is possibly independent of the MTORC1 pathway.
MLN4924 is a specific CRLs inhibitor via inhibition of NAE1 [Citation26,Citation47] and it efficiently induces autophagy [Citation48,Citation49]. Given that CRLs also play an important role in mitosis [Citation34], we asked whether MLN4924 can rescue autophagy during mitosis. Indeed, we observed that MLN4924 was capable of elevating the LC3B-II level in nocodazole-treated HeLa cells () and HEK293T cells (Figure S1(h)). Moreover, MLN4924 could dramatically elevate the number of GFP-LC3 puncta in the naturally occurred mitotic cells (). Furthermore, knockdown of UBE2M/UBC12 (ubiquitin-conjugating enzyme E2M; the NEDD8 conjugating enzyme) also resulted in a marked elevation of the autophagic flux in the nocodazole-treated cells () similar to the effect of MLN4924. Hence, our data collectively demonstrate that the mitotic inhibition of autophagy is associated with the functions of CRLs.
WIPI2 is downregulated during mitosis and restored by MG132 and MLN4924
WIPI2 is a WD40 protein that contains 7-bladed β-propeller [Citation50], which could potentially serve as an adaptor protein or substrate for CRL4s. Based on our earlier findings that MLN4924, a CRLs inhibitor, is able to rescue autophagy in mitotic cells (,) and S1(h)), we examined the changes of WIPI2 protein level under such conditions. We first measured the formation of the WIPI2 puncta, a marker of early stage of autophagy [Citation51]. We observed decreased number of WIPI2 puncta in the mitotic cells when compared to that in the interphase cells, similar to the changes of GFP-LC3 puncta (). We further measured and compared the protein level of WIPI2 in different cell cycle phases using immunoblotting. Using the double thymidine block model, we found that WIPI2 remained stable in the G1/S phase similar to that of the asynchronized cells (Figure S2(a,b)). Notably, it dramatically decreased in the G2/M phase cells (about 10–12 h after released from double thymidine block) (Figure S2(a,b)) or in cells arrested in G2/M phase induced by nocodazole (,). Moreover, the protein level of WIPI2 recovered after releasing from nocodazole treatment with concomitant elevation of LC3B-II conversion (,), suggesting that reduced WIPI2 protein level during mitosis may contributes to the reduction of autophagy activity during mitosis. The FRRG motif within the WIPI2 protein is responsible for its binding to PtdIns3P at omegasome and mutation of FRRG to FTTG abolished this binding and leads to defective recruitment of ATG12–ATG5-ATG16L1 complex and impaired LC3 lipidation [Citation11,Citation52]. As shown in Figure S2(c), WIPI2 FTTG mutant protein was also decreased, similar to that of WT WIPI2, in nocodazole-treated cells, indicating that the degradation of WIPI2 is likely to be independent of its binding to PtdIns3P.
Figure 2. WIPI2 is downregulated during mitosis.
(a) HeLa-GFP-LC3 cells were treated with CQ (25 μM) for 2 h. The cells were then fixed with 4% PFA and subjected to immunofluorescence analysis with anti-WIPI2 antibody. Scale bar: 10 µm.(b) HeLa cells were treated with or without NOC (200 ng/ml) for 16 h. One group of the NOC treated cells were released into fresh medium for another 6 h. Subsequently, the cells were harvested for FACS analysis.(c) HeLa cells were treated with or without NOC (200 ng/ml) for 16 h. One group of the NOC treated cells were released into fresh medium for another 6 h. Subsequently, the cells were treated with or without BafA1 (50 nM) for 2 h before being harvested for western blot analysis.(d) HeLa cells were treated with nocodazole (NOC, 200 ng/ml) for 16 h. Cells were treated with either CQ (25 μM) or bafilomycin A1 (BafA1, 50 nM) for 2 h before being harvested and were subsequently subjected to western blot analysis.(e) HeLa cells were treated with 200 ng/ml nocodazole (NOC) for 16 h. The medium was then removed and the cells were cultured in fresh medium containing the indicated concentration of MG132 for 1.5 h and were then subjected to western blot analysis.(f) HeLa cells were treated with nocodazole (NOC, 200 ng/ml) for 16 h to arrest the cells in G2/M phase and were subsequently treated with CHX (100 μg/ml) and harvested at the indicated time points. Cells were lysed and subjected to western blot with the indicated antibodies.(g) HeLa cells stably expressing GFP-WIPI2 were treated with either MLN4924 (1 μM), nocodazole (NOC, 200 ng/ml) or NOC plus MLN4924 (1 μM) for 16 h and were harvested for western blot analysis with the indicated antibodies.(h) HeLa cells were transfected with siRNA targeting UBE2M for 48 h and were treated with either DMSO or nocodazole (NOC, 200 ng/ml) for another 16 h. The cells were then harvested and subjected to western blot analysis.
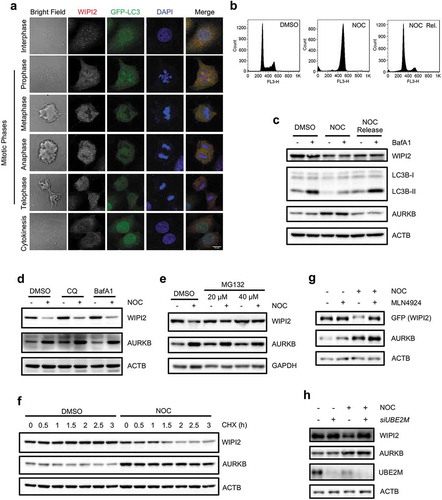
To understand the molecular mechanisms underlying WIPI2 downregulation in mitotic cells, we first measured the mRNA level of WIPI2. RT-PCR analysis revealed that the mRNA level of WIPI2 in cells treated with nocodazole was comparable to that in the untreated cells (Figure S2(d)), indicating that this reduction in WIPI2 protein level is not due to transcriptional downregulation. It is known that WIPI2 localizes on both the inner and outer membrane of the autophagosome [Citation53]. However, given that autophagy is inhibited during mitosis, it is unlikely that this reduction of WIPI2 is resulted from autophagy. Consistent with our speculation, we observed that both CQ and bafilomycin A1 (BafA1) failed to rescue the WIPI2 protein level in the mitotic cells (, S2e)). In contrast, MG132, a proteasome inhibitor, was able to effectively restore WIPI2 level in the mitotic cells ( and S2f)). In addition, nocodazole treatment significantly reduced the WIPI2 protein stability examined by treatment with cycloheximide (CHX) ( and S2g)). Our earlier observations demonstrate that the mitotic inhibition of autophagy could be rescued by MLN4924 (), here we further investigated the effect of MLN4924 on WIPI2 protein level and found that MLN4924 markedly rescued WIPI2 protein level in the mitotic cells ( and S2h)). Consistent with this result, knockdown of UBE2M also effectively rescued WIPI2 protein level in the mitotic cells (). Therefore, data from this part of our study indicate that CRLs are involved in the proteasome-dependent degradation of WIPI2 during mitosis.
CRL4s are activated via neddylation during mitosis
Among the CRLs, CRL4s have been reported to be implicated in the regulation of cell cycles, including G1, S and G2 [Citation36,Citation54,Citation55]. An earlier study showed that Cul4a-deleted cells are deficient in early M phase progression [Citation56], suggesting that CRL4s may possess a role in mitosis regulation. Moreover, it is known that CRL4s recruit and target WD40 domain-containing proteins as substrate receptors or substrates [Citation27]. At present, multiple WD40 domain-containing proteins such as AMBRA1 and RPTOR (regulatory associated protein of MTOR complex 1) have been reported to be regulated via interacting with CRL4s through DDB1 during autophagy [Citation31–Citation33,Citation57]. These findings prompted us to ask whether the downregulation of WIPI2 protein level in mitosis is associated with activated CRL4s. We first checked the E3 ligase activity of CRL4s by examining its neddylation status by western blot. The E3 ligase activity of CRLs is regulated by conjugation of NEDD8 to the CUL (cullin) scaffold protein [Citation58], thus the neddylated form of CUL (active form) migrates slower than the unmodified counterpart during SDS-PAGE electrophoresis. Cells synchronized in the M phase with double thymidine block showed a higher ratio of NEDD8-CUL4A:CUL4A or NEED8-CUL4B:CUL4B than that in asynchronized cells (). Because neddylated CULs are unstable and could be degraded by the proteasome [Citation59], we utilized MG132, a proteasome inhibitor, to block the degradation of neddylated CULs and found that this elevated neddylation in the M phase is much more evident after treatment of MG132 ()). In addition, HeLa cells and HEK293T cells arrested at the M phase by nocodazole also displayed a marked increase in CUL4 neddylation and this neddylation is not affected by CQ treatment ( and S3a)), suggesting that activation of CRL4s are not directly related to the autophagy-lysosomal pathway. More importantly, this elevated neddylation induced by nocodazole could be efficiently abolished by MLN4924 treatment ( and S3b)) or by knockdown of UBE2M (Figure S3(c)). Therefore, data from this part of our study suggest that CRL4s are activated during mitosis and the activated CRL4s may contribute to regulation of autophagy in mitotic cells.
Figure 3. CRL4s are activated via neddylation during mitosis.
(a) HeLa cells were subjected to a double block with thymidine (2.5 μM) and released into fresh medium. After 6 h, the cells were treated with MG132 (10 μM) for another 4 h and were harvested for western blot analysis.(b) HeLa cells were treated with nocodazole (NOC, 200 ng/ml) for 16 h. The medium was then removed and the cells were cultured in fresh medium containing CQ (25 μM) for 2 h before being harvested and were subsequently subjected to western blot analysis.(c) HeLa cells were treated with either MLN4924 (1 μM), nocodazole (NOC, 200 ng/ml) or NOC plus MLN4924 (1 μM) for 16 h and were harvested for western blot analysis with the indicated antibodies.
CRL4s interact with WIPI2
Earlier observations from our study implicate CRL4s in regulation of autophagy during mitosis, possibly via targeting WIPI2. To further establish the regulatory effects of CRL4s on WIPI2, here we examined the protein-protein interaction between CRL4s and WIPI2. Our result showed that CUL4A and CUL4B interacted with both ectopic WIPI2 () and endogenous WIPI2 (Figure S4(a,b)). Consistently, WIPI2 could efficiently interact with CUL4A and CUL4B (,)). To understand the interacting region of CRL4s, we cloned CUL4A N440 (amino acids [aa] 1–440) and CUL4B N594 (aa 1–594) which lack the C terminus responsible for the binding of RBX1 and found that their binding to endogenous WIPI2 was not affected (Figure S4(c,d)), indicating that the N terminus, but not the C terminus of CRL4s, is responsible for the interaction with WIPI2. It is known that the N-terminal domain of CUL4A or CUL4B binds to DDB1, which acts as the adaptor protein for recruiting substrate receptors or substrates [Citation60]. We then evaluated the interaction of WIPI2 with DDB1. We found that DDB1 interacts with both ectopic and endogenous WIPI2 (,)), whereas ectopic WIPI2 could efficiently interact with ectopic DDB1 and endogenous DDB1 (,)). Consistently, endogenous DDB1 also mutually interacts with endogenous WIPI2 (Figure S4(e,f)). Moreover, this mutual interaction between DDB1 and WIPI2 was significantly enhanced in the mitotic cells synchronized by treatment with nocodazole (,)), suggesting that CRL4s are the potential ubiquitin E3 ligases responsible for WIPI2 degradation during mitosis.
Figure 4. WIPI2 interacts with CRL4s.
(a) HEK293T cells were transfected with MYC-WIPI2 and/or FLAG-CUL4A as indicated for 24 h and were lysed with IP lysis buffer. The cell lysates were subjected to FLAG IP and blotted with the indicated antibodies.(b) HEK293T cells were transfected with MYC-WIPI2 and/or FLAG-CUL4B as indicated for 24 h. Cells were lysed with IP lysis buffer. The cell lysates were subjected to FLAG IP and blotted with the indicated antibodies.(c) HEK293T cells were transfected with FLAG-WIPI2 and/or V5-CUL4A as indicated for 24 h and were lysed with IP lysis buffer. The cell lysates were subjected to FLAG IP and blotted with the indicated antibodies.(d) HEK293T cells were transfected with FLAG-WIPI2 and/or MYC-CUL4B as indicated for 24 h and were lysed with IP lysis buffer. The cell lysates were subjected to FLAG IP and blotted with the indicated antibodies.(e) HEK293T cells were transfected with MYC-WIPI2 and/or FLAG-DDB1 as indicated for 24 h. FLAG-DDB1 was pulled down using anti-FLAG M2 agarose and blotted with the indicated antibodies.(f) HEK293T cells were transfected with FLAG-WIPI2 and/or V5-DDB1 as indicated for 24 h. Cells were lysed with IP lysis buffer. The cell lysates were subjected to FLAG IP and blotted with the indicated antibodies.(g) HEK293T cells were transfected with FLAG-DDB1 for 24 h. Subsequently, cells were treated with or without nocodazole (NOC, 200 ng/ml) for 16 h and were then released into fresh medium containing 20 μM MG132 for 1.5 h. The cells were harvested, lysed with IP lysis buffer and subjected to immunoprecipitation with anti-FLAG M2 agarose.(h) HEK293T cells were transfected with MYC-WIPI2 for 24 h. Subsequently, cells were treated with or without nocodazole (NOC, 200 ng/ml) for 16 h and were then released into fresh medium containing 20 μM MG132 for 1.5 h. The cells were harvested, lysed with IP lysis buffer and subjected to immunoprecipitation with anti-MYC agarose.
Knockdown of CRL4s restores WIPI2 protein level and autophagy during mitosis
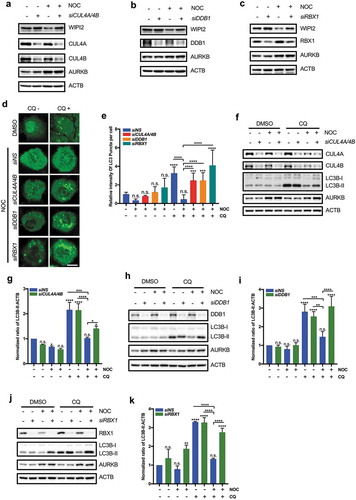
To further study the regulatory effects of CRL4s on WIPI2 and autophagy, we next modulated the expression level of CRL4s and then checked WIPI2 protein level. We observed that overexpression of CUL4A or CUL4B led to a significant reduction in WIPI2 protein level, which could be rescued by the proteasome inhibitor MG132 (Figure S5(a,b)). Furthermore, overexpression of different components of CRL4s including CUL4A, CUL4B and DDB1 all increased the turnover of WIPI2 (Figure S5(c-e)). Next, we used opposite approaches by knocking down the key components of CRL4s in cells synchronized in the mitotic phase. We observed that knockdown of CUL4A and CUL4B significantly restored the protein level of WIPI2 (). Similarly, knockdown of DDB1 or RBX1 significantly mitigated the reduction of WIPI2 in the mitotic cells (,)). Together, these data suggest that downregulation of WIPI2 during mitosis is mediated by CRL4s. To further confirm that the mitotic inhibition of autophagy is mediated by CRL4s, we examined the effects of knocking down CUL4A and CUL4B, DDB1 or RBX1 in nocodazole-treated GFP-LC3-HeLa or HeLa cells and found that knockdown of CUL4A/4B, DDB1 or RBX1 all led to elevated autophagy flux in cells treated with nocodazole, as evidenced by the increased number of the GFP-LC3 puncta (,) and enhanced conversion of LC3B-I to LC3B-II (–). Collectively, these data suggest that CRL4s-mediated proteasomal degradation of WIPI2 is responsible for autophagy inhibition in mitotic cells.
Figure 5. Knockdown of CRL4s rescues the reduction of WIPI2 and autophagy.
(a to c) HEK293T cells were transfected with the siRNA against CUL4A/4B (a), DDB1 (b) or RBX1 (c) for 48 h and were subsequently treated with nocodazole (NOC, 200 ng/ml) for 16 h. The cells were then harvested, lysed and subjected to western blot analysis.(d and e) HeLa-GFP-LC3 cells were transfected with the indicated siRNA for 48 h. The cells were then treated with nocodazole (NOC, 200 ng/ml) for 16 h and released into either fresh medium or fresh medium containing 25 μM CQ for 1.5 h. Cells were subsequently imaged with confocal microscope (d). Scale bar: 5 µm. The relative intensity of LC3 puncta in the samples treated as in (d)was quantified (e). The intensity of the LC3 puncta in the DMSO group without CQ treatment was normalized as 1. Columns, mean; bars, ± S.D. (n.s., no significance; ***, P < 0.001; ****, P < 0.0001; One way ANOVA with Dunnett’s multiple comparisons test).(f and g) HeLa cells were transfected with siCUL4A plus siCUL4B for 48 h. The cells were then treated with NOC (200 ng/ml) for 16 h and released into either fresh medium or fresh medium containing 25 μM CQ for 1.5 h. The cells were harvested, lysed and subjected to western blot analysis (f). The relative ratio of LC3B-II to ACTB was shown in (g). The ratio of LC3B-II:ACTB in the control group was normalized as 1. Columns, mean; bars, ± S.D. of 3 independent experiments (n.s., no significance; *, P < 0.05; ***, P < 0.001; ****, P < 0.0001; One way ANOVA with Dunnett’s multiple comparisons test).(h and i) HeLa cells were transfected with siDDB1 for 48 h. The cells were then treated with NOC (200 ng/ml) for 16 h and released into either fresh medium or fresh medium containing 25 μM CQ for 1.5 h. The cells were harvested, lysed and subjected to western blot analysis (h). The relative ratio of LC3B-II to ACTB was shown in (i). The ratio of LC3B-II:ACTB in the control group was normalized as 1. Columns, mean; bars, ± S.D. of 3 independent experiments (n.s., no significance; **, P < 0.01; ***, P < 0.001; ****, P < 0.0001; One way ANOVA with Dunnett’s multiple comparisons test).(j and k) HeLa cells were transfected with siRBX1 for 48 h. The cells were then treated with NOC (200 ng/ml) for 16 h and released into either fresh medium or fresh medium containing 25 μM CQ for 1.5 h. The cells were harvested, lysed and subjected to western blot analysis (j). The relative ratio of LC3B-II to ACTB was shown in (k). The ratio of LC3B-II:ACTB in the control group was normalized as 1. Columns, mean; bars, ± S.D. of 3 independent experiments (n.s., no significance; **, P < 0.01; ****, P < 0.0001; One way ANOVA with Dunnett’s multiple comparisons test).
CRL4s are the E3 ligases mediating polyubiquitination of WIPI2 in vivo and in vitro
The above-mentioned findings led us reason that CRL4s are the E3 ligases responsible for polyubiquitination and degradation of WIPI2 during mitosis. To confirm this notion, we first examined the ubiquitination level of WIPI2 in the mitotic phase synchronized by nocodazole. We found that nocodazole treatment markedly elevated the K48 polyubiquitination of WIPI2 ( and S6a)), which was significantly attenuated by treatment of MLN4924 ()). Similar effects were also observed in cells with overexpression of CUL4A/4B together with RBX1 ()). Conversely, knockdown of CUL4A or CUL4B, as well as CUL4A plus CUL4B dramatically reduced the K48 polyubiquitination level of WIPI2 (). Of note, knockdown of CUL4A plus CUL4B abolished the K48 polyubiquitination of WIPI2 induced by nocodazole treatment (). Similar effects were observed in cells with knockdown of DDB1 (Figure S6(b)), indicating that the WIPI2 K48 polyubiquitination during mitosis is indeed mediated by CRL4s. Finally, we performed the in vitro ubiquitination assay. To this end, we purified the GST-WIPI2 protein from E. coli (Figure S6(c,d)) and the CRL4s complex using the same method described earlier [Citation61]. The in vitro ubiquitination assay showed that CRL4s could efficiently catalyzed the polyubiquitination of WIPI2 (). Taken together, these data from this part of our study clearly demonstrate that CRL4s directly target WIPI2 for polyubiquitination and proteasomal degradation during mitosis.
Figure 6. CRL4s target WIPI2 for ubiquitination in vivo and in vitro.
(a) HEK293T cells were transfected with FLAG-WIPI2 for 24 h. The cells were then treated with DMSO, nocodazole (NOC, 200 ng/ml) or NOC (200 ng/ml) plus MLN4924 (1 μM) for another 16 h. The cells were subsequently treated with 10 μM MG132 for 4 h and harvested for denature FLAG IP.(b) HEK293T cells were transfected with FLAG-WIPI2 or FLAG-WIPI2 plus V5-CUL4A, MYC-CUL4B and MYC-RBX1 for 24 h. The cells were subsequently treated with or without MLN4924 (1 μM). After 16 h, the cells were treated with 10 μM MG132 for 4 h and harvested for denature FLAG IP.(c) HeLa cells stably expressing FLAG-HA-WIPI2 were transfected with siCUL4A, siCUL4B or siCUL4A plus siCUL4B for 48 h. Cells were lysed with denature IP lysis buffer and subjected for FLAG IP and analyzed with the indicated antibodies.(d) HEK293T cells were transfected with FLAG-WIPI2 and/or siCUL4A plus siCUL4B for 48 h. The cells were then treated with or without nocodazole (200 ng/ml) for 16 h and were then released into fresh medium containing 20 μM MG132 for 1.5 h. The cells were harvested, lysed with RIPA lysis buffer and subjected to immunoprecipitation with anti-FLAG M2 agarose.(e) In vitro ubiquitination assay for WIPI2. GST-WIPI2 purified from Rosetta E. Coli. cells was subject to ubiquitination in the presence of E1, E2, ATP, and/or E3 ligase complex and was analyzed by western blot with anti-GST antibody. The input of E3 ligase complex was shown on the bottom.
Rescue of autophagy by MLN4924 during mitotic phase induces mitotic slippage and senescence
In this part of our study, we attempted to understand the functional implication of autophagy suppression during mitosis. We found that while nocodazole efficiently induced cell cycle arrest at the G2/M phase, MLN4924 dramatically reduced the proportion of the G2/M phase cells arrested by nocodazole (from 72% to 47.3%), which was associated with a concomitant increase in G0/G1 phase cells (from 3.17% to 23.9%) (). Moreover, this rescuing effect by MLN4924 was alleviated in the WIPI2 KO cells (Figure S7(a)). Such data indicate the possibility that activation of autophagy by MLN4924 during mitosis may lead to mitotic slippage. Consistently, MLN4924 treatment led to marked reduction of phospho-Histone H3 at Ser10 (a maker of mitotic cells), degradation of CCNB1, dephosphorylation of BUB1B/BUBR1 (BUB1 mitotic checkpoint serine/threonine kinase B; a maker of the spindle assembly checkpoint), and dephosphorylation of MCL1 (a direct target of CDK1) in the cells treated with nocodazole. (). Taken together, such data support the notion that reactivation of autophagy by MLN4924 may lead to mitotic slippage.
Figure 7. Reactivation of autophagy during mitosis leads to mitotic slippage and senescence.
(a and b) HeLa cells (at the confluency of approximately 30%) were treated with the indicated chemicals (NOC 250 ng/mL, MLN4924 1 µM) for 18 h and subsequently subjected to FACS analysis. Representative histograms were presented for each group (a) and the percentage of cells in different phases were presented as mean ± S.D. (b). Experiments were performed in triplicate. Columns, mean; bars, ± S.D. (**, P < 0.01; ****, P < 0.0001; One way ANOVA with Dunnett’s multiple comparisons test).(c) HeLa cells were treated as in (a). The cells were lysed and subjected to western blot analysis with the indicated antibodies.(d) HeLa cells were treated as in (a). The medium was removed and the cells were cultured with fresh medium for another 24 h and harvested for western blot analysis.(e and f) HeLa cells were treated as in (a) for 16 h. The medium was removed and the cells were cultured with fresh medium for another 24 h. SA-GLB1/β-Gal activity was then analyzed with phase contrast microscopy (e). Scale bar: 25 µm. Five randomly selected areas from each slide were selected to quantify the percentage of GLB1/β-Gal-positive cells (f). All experiments were performed in triplicate. Columns, mean; bars, ± S.D. (****, P < 0.0001; One way ANOVA with Dunnett’s multiple comparisons test).(g) HeLa cells were treated as in (a) for 16 h. The medium was removed and the cells were cultured with fresh medium for another 24 h. Subsequently, the cells were harvested for RT-PCR analysis. The relative fold change of the indicated genes under the indicated treatments was plotted. The mRNA level of DMSO group was normalized as 1. All experiments were performed in triplicate. Columns, mean; bars, ± S.D. (n.s., no significance; *, P < 0.05; ***, P < 0.001; One way ANOVA with Dunnett’s multiple comparisons test).(h) HeLa cells were treated as in (a), the medium was collected for ELISA analysis. The plot shows the relative fold change of IL8 secretion. Columns, mean; bars, ± S.D. of 3 independent experiments. (**, P < 0.01; One way ANOVA with Dunnett’s multiple comparisons test).(i) HeLa cells were transfected with either control siRNA or siRNA targeting WIPI2 for 40 h. The cells were then lysed and subjected to western blot analysis with the indicated antibodies.(j and k) HeLa cells were transfected with or without siWIPI2 for 24 h. Cells were treated with nocodazole (NOC, 250 ng/mL) plus MLN4924 (1 μM) for 16 h. The medium was replaced with fresh medium for another 24 h. SA-GLB1/β-Gal activity was then analyzed with phase contrast microscopy (j). Scale bar: 25 µm. Five randomly selected areas from each slide were selected to quantify the percentage of GLB1/β-Gal positive cells (k). All experiments were performed in triplicate. Columns, mean; bars, ± S.D. (****, P < 0.0001; One way ANOVA with Dunnett’s multiple comparisons test).(l) Schematic model for CRL4s-mediated WIPI2 polyubiquitination and degradation during mitosis.
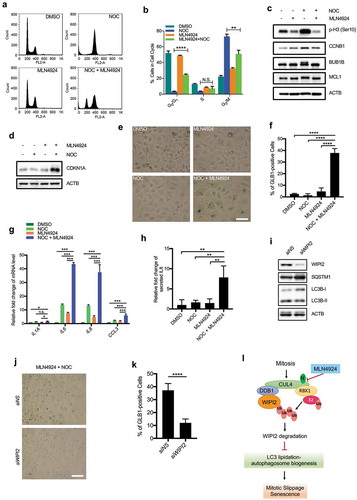
Post-slippage cells undergo either G1 arrest with subsequent senescence, or post-slippage cell death [Citation62]. A previous report demonstrated that autophagosome is able to promote senescence to restrain cell proliferation and thereby prevent tumorigenesis upon oncogenic insults [Citation63]. We thus asked whether activation of autophagy in the mitotic cells leads to senescence. The TP53/p53-CDKN1A/p21 pathway is involved in the process of senescence and accumulation of CDKN1A occurs upon senescence induction [Citation64]. We observed that MLN4924 markedly increased CDKN1A protein level in the nocodazole-treated cells (), which also led to significant reduction of BrdU uptake (Figure S7(b,c)). Next, we evaluated senescence-associated GLB1/β-galactosidase (SA-GLB1/β-gal) activity in the cells with designated treatments and observed that MLN4924 markedly increased the number of SA-GLB1-positive cells in the nocodazole group (,)). Secretion of senescence-associated secretory phenotype (SASP) factors is another characteristic feature of senescence cells [Citation65]. MLN4924 treatment also led to increased mRNA level of SASP factors (including IL1A [interleukin 1 alpha], IL6, IL8 and CCL3 [C-C motif chemokine ligand 3]) in cells treated with nocodazole (). Consistently, MLN4924 treatment lead to increased secretion of IL8 protein in cells treated with nocodazole measured by ELISA (). Therefore, these results collectively indicate that MLN4924 induce senescence in cells treated with nocodazole. Notably, this effect was largely mitigated upon WIPI2 depletion (–)) or by inhibition of autophagy via treatment of Wortmannin (Figure S7(d-g)), suggesting that MLN4924-mediated senescence in the nocodazole-treated cells is regulated in a WIPI2-autophagy-dependent manner. These results are consistent with a recent study demonstrating that autophagy induction during mitotic slippage is required for senescence [Citation66].
Discussion
In this study, we uncover a novel mechanism by which autophagy is inhibited during mitosis via identifying a critical function of CRL4s in this process. During mitosis, activated CRL4s recruit WIPI2 and mediate its polyubiquitination and proteasomal degradation, leading to the mitotic inhibition of autophagy, as summarized in ).
In this study, we first provide compelling evidence demonstrating that autophagy is inhibited in mitotic cells in either naturally occurred mitosis or induced by two commonly used methods: treatment with nocodazole or thymidine block and release (-) and S1(a–d)). Our findings are indeed consistent with the earlier reports in which autophagy is suppressed in the mitotic phase [Citation23,Citation24]. Intriguingly, there are some studies showing robust autophagy flux during the mitotic phase [Citation21,Citation22]. The reasons for such discrepancy are not clear, most probably due to the different cell types and methods of induction of mitosis used. One point to note in our study is that we also examined the formation of WIPI2 puncta, which has also been used as an autophagy marker, representing autophagosome formation [Citation51]. The significant reduction of the number of WIPI2 puncta was found in the mitotic cells ()), further confirming the suppression of autophagy during mitosis.
Mechanistically, it has been demonstrated that CDK1-mediated phosphorylation of PIK3C3 disrupts its interaction with BECN1, leading to abolishment of PtdIns3P generation and subsequent autophagy inhibition during mitosis [Citation24]. We have tried to rescue the inhibited autophagy with the specific CDK1 inhibitor RO3306 in nocodazole-treated cells and found that RO3306 could only slightly elevate the autophagy level in the mitotic cells (data not shown), suggesting the involvement of other important mechanisms in this process. In search of the mechanisms mediating the mitotic inhibition of autophagy, we attempted to reactivate autophagy in the mitotic cells using different autophagy inducers including amino acid starvation (culturing in EBSS) and MTOR inhibitors rapamycin and PP242. Consistent with a previous study [Citation23], we observed that neither starvation nor rapamycin or PP242 is able to effectively reactivate autophagy during mitosis (Figure S1(c and f-g), suggesting that the MTOR pathway does not play an important role in regulation of autophagy during mitosis. Notably, MLN4924, a well characterized specific inhibitor of CRLs, is capable of reactivating autophagy in the mitotic cells (,)), indicating the potential involvement of CRLs in the mitotic inhibition of autophagy.
So far, several CRLs have been reported to regulate the key machinery of autophagy. For instance, CRL3s are able to negatively regulate autophagy via mediating the ubiquitination and proteasomal degradation of the ULK1 and PIK3C3 complexes [Citation30]. CRL4s have also been shown to inhibit autophagy by directly targeting AMBRA1 for polyubiquitination and degradation [Citation33]. In this study, we focused our mechanistic study on CRL4s, based on the following reasons. First, we observed evident activation of CRL4s, especially CRL4B during mitosis ( and Figure S3). Second, knockdown of various components of CRL4s, including CUL4A plus CUL4B, DDB1 and RBX1, led to reactivation of autophagy in mitotic cells (-)), while no similar results were found with knockdown of CUL3 (data not shown). Third and more importantly, we identified WIPI2 as the potential target for CRL4s. WIPI2 is a WD40 protein containing 7-bladed β-propeller [Citation50] and it has been well established the WD40 proteins are recruited and targeted by CRL4s as substrate receptors or substrates [Citation27]. Therefore, it is reasonable to link the reduced WIPI2 protein level during mitosis with the function of CRL4s.
After establishing the critical role of CRL4s in suppression of autophagy during mitosis via targeting WIPI2, there is one important question: why autophagy needs to be inhibited during mitosis? Of note, in the course of mitosis, the nuclear membrane is dissolved and chances are that this event may expose the chromosomes to the cytoplasmic autophagy machinery. In fact, it has been documented that the mitotic chromosomes could be engulfed by autophagosome in the mitotic cells [Citation67]. Moreover, organelles such as mitochondrial or Golgi apparatus undergo fragmentation during mitosis, which is crucial for their distribution between the two daughter cells and degradation of these organelles may lead to mitotic abnormalities [Citation68–Citation70]. Thus, inhibition of autophagy during mitosis is possibly a protective mechanism to avoid unintended chromosome or organelles damage/degradation. It is thus of interest and importance to know the consequence of excessive autophagy activity in the mitotic cells. In our study, we observed that reactivation of autophagy by MLN4924 in the nocodazole-treated cells leads to mitotic slippage and subsequent senescence (). Our findings are indeed consistent with an earlier report in which autophagy mediates the mitotic senescence transition and deletion of ATG5 or ATG7 led to delayed senescence transition [Citation71]. Our findings are also consistent with a recent study demonstrating that autophagy induction during mitotic slippage is required for senescence and deletion of ATG5 led to suppression of senescence post mitotic slippage [Citation66].
The role of CRL4s in mediating WIPI2 ubiquitination and proteasomal degradation and suppression of autophagy in mitosis is also supportive to the reported oncogenic function of CRL4s. For instance, higher levels of CRL4s were observed in various cancers including breast cancer and ovarian cancer and were also associated with poor prognosis [Citation72–Citation74]. Moreover, overexpression or deletion of CRL4B has been found to promote or inhibit tumorigenesis, respectively [Citation75,Citation76]. The main mechanisms underlying the oncogenic functions of CRL4s especially CRL4B include alterations of epigenetic regulation via DNA methylation, histone monoubiquitination, acetylation and methylation [Citation75–Citation78]. Therefore, results from our study provide another possible mechanisms for the oncogenic function of CRL4s: activation of CRL4s during mitosis suppresses autophagy via ubiquitination and proteasomal degradation of WIPI2. Moreover, MLN4924, a specific inhibitor of NEDD8 activating enzyme, possesses broad-spectrum anticancer activity in a number of preclinical studies [Citation47] and has been shown to sensitize breast cancer and ovarian cancer to radiation therapy or chemotherapy [Citation79,Citation80]. Yet, it remains unclear whether this anti-tumor activity of MLN4924 is related to its effects on autophagy. In this study, we find that MLN4924 is able to reactivate autophagy in mitotic cells by stabilizing WIPI2 protein level, leading to mitotic slippage and subsequent senescence. This may represent an important mechanism of MLN4924 to suppress cancer by inducing WIPI2-dependent autophagy. Of note, data from the Human Protein Atlas (www.proteinatlas.org/pathology) showed an inverse correlation between CRL4s and WIPI2 expression in breast cancer, ovarian cancer and cervical cancer (data available from www.proteinatlas.org/ENSG00000157954-WIPI2/pathology). Therefore, manipulation of autophagy by targeting the CRL4s-WIPI2 axis in the mitotic cells may represent a novel strategy for cancer therapy.
In summary, our study identifies a novel mechanism in suppression of autophagy in mitotic cells: activated CRL4s recruit WIPI2 and mediate its polyubiquitination and proteasomal degradation. Understanding such a mechanism provides deeper insights into the intricate relationship between autophagy and cell cycle regulation.
Materials and methods
Reagents and antibodies
Antibodies specific against WIPI2 (8567), CUL4A (2699), RBX1 (4397), UBE2M (5641), CCNB1 (4135), CCNE1 (4129), MYC Tag (2276), GST (2624), K48 Ub (8081), CDKN1A/p21 (2946) and phospho-histone H3 Ser10 (p-H3; 9701) were purchased from Cell Signaling Technology. Antibodies specific against WIPI2 (SAB4200399), CUL4B (HPA011880), CUL4A (C0371), ACTB (A5441), TUBA (T6199), LC3B (L7543), and FLAG-M2 (F1804) were purchased from Sigma-Aldrich. Antibodies specific against WIPI2 (ab105459), LC3B (ab192890) and DDB1 (ab109027) were purchased from Abcam. Antibodies specific against AURKB/ARK2 (sc-25426), HA (sc-7392), V5 (sc-83849R), Ub (sc-8017) and MCL1/MCL-1 (sc-819) were purchased from Santa Cruz Biotechnology. Antibodies specific against BUB1B/BUBR1 (612503) were purchased from BD Transduction Laboratories. For reagents used in this study, nocodazole (M1404), thymidine (T1895), BafA1 (B1793), CQ (C6628), rapamycin (R8781), PP242 (P0037), EBSS (E2888), and CHX (C7698) were purchased from Sigma-Aldrich. MLN4924 (5.05477.0001CN) and MG132 (474790) were purchased from Merck Millipore. For reagents used for in vitro ubiquitination assay, Creatine kinase (C3755), Creatine phosphate (27920), Adenosine 5′-triphosphate disodium salt hydrate (A2383) and Sodium fluoride (67414) were purchased from Sigma-Aldrich; HA-ubiquitin (U-110), Ubiquitin aldehyde (Ub-H) (U-201), UBE1/ubiquitin activating enzyme (E-305) and UBE2D1/UbcH5a (E2-616) were purchased from Boston Biochem.
Cell line, siRNA and plasmids
HEK293T (CRL-3216) and HeLa (CCL-2) cells were purchased from ATCC. siRNA targeting CUL4A #1 (5ʹ UCCUGCAUUAACCUUUGG 3ʹ, used in this study [Citation81]) and CUL4A #2 (5ʹ AUCUUCAUUAUUCUGACG 3ʹ, used in this study [Citation81]) was a gift from Dr. Thilo Hagen from National University of Singapore. CUL4A #3 (5ʹ CCAUGUAAGUAAACGCUUATT 3ʹ, used in this study [Citation82]), CUL4B #2 (5ʹ GGUUCUUACACACCAUUAATT 3ʹ, used in this study [Citation82]) and CUL4B #3 (5ʹ CAAUCUCCUUGUUUCAGAATT 3ʹ, used in this study [Citation82]) were synthesized in Singapore Advanced Biologics company. CUL4B #1 (sc-37573) was purchased from Santa Cruz Biotechnology. siRNA targeting WIPI2 (hs.Ri.WIPI2.13), RBX1 (hs.Ri.RBX1.13) and DDB1(hs.Ri.DDB1.13) were purchased from Integrated DNA Technologies. For plasmids used in this study, FLAG-CUL4A and V5-CUL4A were provided by Dr. Thilo Hagen from National University of Singapore [Citation81]; FLAG-DDB1 was a gift from Dr. Yue Xiong (Addgene, 19918) [Citation32]; GFP-WIPI2 FTTG mutant was generated in Dr. Sharon A. Tooze’s lab [Citation11]; FLAG-CUL4B, MYC-CUL4B, FLAG-HA-CUL4A N440, FLAG-HA-CUL4B N594, FLAG-WIPI2, FLAG-HA-WIPI2, MYC-WIPI2, GST-WIPI2 and GFP-WIPI2 were generated in Dr. Han-Ming Shen’s lab.
Cell culture
HeLa and HEK293T cells were cultured in DMEM (HyClone, SH30022.01) supplemented with 10% fetal bovine serum (HyClone, SV30160.03), 100 U/ml penicillin and 100 μg/ml streptomycin (Gibco, 15140122). All cell lines were maintained at 37°C in a humidified incubator with 5% CO2 and were tested and confirmed to be negative for mycoplasma infection. For serum starvation experiments, cells were washed twice with PBS (GE Healthcare, SH30256.01) and then incubated in EBSS medium for 2 h. To study autophagy flux, cells were treated either with 25 µM CQ or 100 nM BafA1 for 2 h before harvesting the cells. For treatment of cells with the MTORC1 inhibitors, cells were treated either 100 nM rapamycin or 1 µM PP242 for 18 h. For treatment with the NAE1-specific inhibitor MLN4924, cells were treated with 1 µM MLN4924 for 16 h.
Transfection
For plasmid transfection, transfections were by a liposome-mediated method. One day before the transfection, HeLa or HEK293T cells were seeded in the dishes at the confluency of around 40%-50%. After one day’s growth, transfections were performed using certain amounts of plasmids and Lipofectamine 2000 (Invitrogen, 11668019) or Lipofectamine 3000 (Invitrogen, L3000075) according to the manufacturer’s introduction. After transfection for 24–48 h, the cells were harvested and subjected to western blotting or immunoprecipitation etc. For small interfering RNA (siRNA) transfection, the scrambled RNAi and siRNAs targeting specific genes were transfected into HeLa or HEK293T cells with Lipofectamine RNAiMAX reagent (Invitrogen, 13778150). After transfection for 48–72 h, the cells were harvested for western blotting or immunoprecipitation etc.
Establishment of the FLAG-HA-WIPI2-HeLa stable cell line
HeLa cells were transfected with either pcDNA3.1 empty vector (Thermo Fisher Scientific, V87072) or pcDNA3.1-FLAG-HA-WIPI2 plasmids for 24 h. The cells were then reseeded into 10-cm dishes at a confluency of 10%, 1% and 0.1% and selected with hygromycin (Thermo Fisher Scientific, 10687010) (700 μg/ml) for two weeks. The positive cell lines were verified by western blot with anti-FLAG, anti-HA and anti-WIPI2 antibodies.
Western blotting
After the designed treatments, Laemmli SDS buffer (62.5 mM Tris-HCl, pH 6.8, 25% glycerol, 2% SDS, phosphatase inhibitor and proteinase inhibitor cocktail [Thermo Fisher Scientific, 78446]) were used to lyse the harvested cells. An equal amount of protein was resolved by SDS-PAGE and transferred to PVDF membrane (Bio-Rad Laboratories, 1620177). After blocking with 5% non-fat milk (Bio-Rad Laboratories, 1706404) for 1 h or blocking buffer (Thermo Fisher Scientific, 37538) for 10 min, the membrane was probed with primary and secondary antibodies (Jackson ImmunoResearch, 115–035-003 and 111–035-144; Abcam, ab131366; Cell Signaling Technology, 5127), developed with the enhanced chemiluminescence method (Thermo Fisher Scientific, 34076) and visualized with the ImageQuant LAS 500 (GE Healthcare).
Immunoprecipitation
Cells were suspended with the immunoprecipitation (IP) lysis buffer (10 mM Tris-HCl, pH 7.4 [Vivantis Technologies, PB0852], 100 mM NaCl [Vivantis Technologies, PB0570], 2.5 mM MgCl2, 0.5% Triton X-100 [Sigma-Aldrich, T8787], phosphatase inhibitor and proteinase inhibitor cocktail). The suspensions were subjected to sonication and centrifuged at 12,000 g for 10 min. Part of the supernatant (1–1.5 mg) was transferred to a new tube and diluted with the IP lysis buffer to achieve the concentration at 1–1.5 μg/μl. For FLAG IP or MYC IP, the supernatant was incubated with 10 μl ANTI-FLAG M2 Affinity Gel (Sigma-Aldrich, A2220) or Pierce™ Anti-c-Myc Agarose (Thermo Fisher Scientific, 20168) and mixed overnight with gentle rotation at 4°C. Subsequently, the immunoprecipitates were washed with IP lysis buffer 3 times. The immunoprecipitates were then eluted by boiling for 5 min in sample loading buffer (Bio-Rad Laboratories, 1610737). Last, the eluted immunoprecipitates were subject to SDS-PAGE and blotted with specific antibodies. As for endogenous IP, firstly, 10 μl protein A/G (Thermo Fisher Scientific, 20422) was added to the supernatant for the preclear process for 1 h and was subsequently discarded. Second, control IgG or primary antibody was added to the supernatant and incubated at 4°C for 2 h or overnight with gentle rotation. Third, 10 μl protein A/G was added to supernatant incubated with primary antibody and mixed for 6 h with gentle rotation at 4°C. Last, the immunoprecipitates were washed with IP lysis buffer 3 times. The immunoprecipitates were then eluted by boiling for 5 min in sample loading buffer and subjected to western blot analysis.
Reverse transcription and quantitative real-time PCR
After the designed treatments, RNA was extracted from the cells with RNeasy Kit (QIAGEN, 217004). A reverse transcription reaction was performed using 1 μg of total RNA with High Capacity cDNA Reverse Transcription Kit (Applied Biosystems, 4368814). The mRNA levels were evaluated by real-time PCR using SsoFastTM EvaGreen Supermix (Bio-Rad Laboratories, 172–5201) and CFX96 TouchTM Real-Time PCT Detection System (Bio-Rad Laboratories). GAPDH (glyceraldehyde-3-phosphate dehydrogenase) was used as an internal control of RNA integrity. Real-Time PCR was performed in triplicate. The primers used in this study were described in Supplemental online material Table S1.
Immunofluorescence staining and confocal microscopy
GFP-LC3-expressing stable HeLa cells were seeded to a cover glass slide at the confluency of approximately 50%, and after the designed treatment, the cells were fixed with 4% paraformaldehyde (PFA; Santa Cruz Biotechnology, sc-281692) for 10–15 min at room temperature and was washed 3 times with PBS. Followed by permeabilization with 0.25% Triton X-100 for 20 min. The cells were next blocked with 1% BSA (Sigma-Aldrich, A2153) for 4–6 h at room temperature and were incubated with specific primary antibody overnight at 4°C. In the next day, the primary antibody was removed and the cells were washed 3 times with cold PBS for 3 min each, and incubated with Alexa Fluor secondary antibody (1:200 ~ 1:500) (Invitrogen, A-11029, A-11034, A-11032 or A-11037) at room temperature for 1 h. The cells were again washed 3 times with cold PBS for 3 min each. The cells were visualized using a confocal microscope (Olympus Fluoview FV1000, Olympus America Inc., PA) and representative cells were selected and photographed.
Cell synchronization by double thymidine block
At the confluency at 30–40%, HeLa cells were treated with 2.5 µM thymidine and after 18 h, cells were washed 3 times with PBS and were released into fresh medium for 8 h. Subsequently, cells were treated with 2.5 µM thymidine for another 18 h and were again washed 3 times with PBS and released into fresh medium. The cells were collected at 0, 1, 2, 4, 6, 8, 10, 12 and 14 h, and were subjected to western blot analysis. AURKB/ARK2 and CCNB1 were used as a G2/M phase marker, while CCNE1 was used as a G1 phase marker.
In vivo ubiquitination assay
After the designed treatment, the cells were harvested and lysed with denature IP lysis buffer (50 mM Tris-HCl, pH 7.4, 1% SDS, 5 mM EDTA [Vivantis Technologies, PB0245], phosphatase inhibitor and proteinase inhibitor cocktail), heated at 100°C for 10 min and centrifuged at 12,000 g for 10 min. The supernatant was transferred to a new tube and 1–1.5 mg of the lysate was taken out and diluted with 10 volume IP lysis (10 mM Tris-HCl, pH 7.4, 100 mM NaCl, 2.5 mM MgCl2, 0.5% Triton X-100, phosphatase inhibitor and proteinase inhibitor cocktail) to achieve the concentration of SDS at less than 0.1%. The diluted lysates were then subjected to FLAG IP and subsequent western blot analysis of the WIPI2 polyubiquitination level with anti-ubiquitin (P4D1) antibody or anti-K48-specific-polyubiquitination antibody.
In vitro ubiquitination assay
For GST-WIPI2 protein purification, pGEX-6p-3-WIPI2 plasmid was transformed into Rosetta super competent cells (Merck Millipore, 71400). The positive strains were cultured in LB medium (Sigma-Aldrich, L3022) and the expression of GST-WIPI2 was induced by 0.25 M IPTG (Sigma-Aldrich, 6758) at 16°C overnight when the OD600 reached 0.6–0.8. The induced sample was next centrifuged and the supernatant was discarded, while the pellet was lysed by the E. coli lysis buffer (50 mM Tris-HCl, pH 8.0, 150 mM NaCl, 0.1% Triton X-100, 2 mM EDTA, 1 mM PMSF [Sigma-Aldrich, 93482] and 1 mg/ml lysozyme [Sigma-Aldrich, L6876]) and incubated on ice with gentle rotation for 30 min. Followed by sonication and centrifugation. The supernatant was subjected to GST immunoprecipitation using the GST affinity gel (Sigma-Aldrich, G0924) and eluted with L-glutathione (Sigma-Aldrich, G4251). The purified GST-WIPI2 protein was subsequently subjected to SDS-PAGE and verified by Coomassie Brilliant Blue staining and western blot with anti-GST and anti-WIPI2 antibodies. For DDB1-CUL4-RBX1 complex purification, HEK293T cells were transfected with FLAG-CUL4A, FLAG-CUL4B, V5-DDB1 and MYC-RBX1. After 48 h, the cells were harvested, lysed with IP lysis buffer and subjected to FLAG IP. The CRL4s complex bound on the beads were then incubated in a 20-μl reaction mixture as described previously [Citation61].
Senescence assay
HeLa cells were seeded at a confluency of approximately 30% and were treated with either DMSO, NOC (200 ng/mL), MLN4924 (1 µM), or MLN4924 (200 ng/mL) plus NOC (1 µM) for 16 h and were then released into fresh medium for 24 h. The cells were then fixed for senescence-GLB1 staining according to the manufacturer’s protocol (Cell Signaling Technology, 9860).
Measurement of IL8 secretion
IL8 secretion was measured using a commercialized ELISA kit (Thermo Fisher Scientific, 88–8086-77). Briefly, HeLa cells were treated with either DMSO, NOC (200 ng/mL), MLN4924 (1 µM) or MLN4924 (200 ng/mL) plus NOC (1 µM) for 16 h. The supernatants were collected after centrifugation. An ELISA assay was then performed according to the manufacturer’s manual.
BrdU assay
Cells were incubated with BrdU (Sigma-Aldrich, 11296736001) for 1 h and stained with anti-BrdU antibody and visualized with an immunofluorescence microscope according to the manufacturer’s manual.
Statistics analysis
The statistical significance of the mean differences observed between samples was determined by the Student two-tailed t test using GraphPad Prism 7. One-way ANOVA Dunnett’s multiple comparisons test was used to compare means of more than 3 samples using GraphPad Prism 7. Data are shown as means ± SD of the results of at least 3 independent experiments. Values of P < 0.05 were considered significant.
Supplemental Material
Download MS Word (8.7 MB)Acknowledgments
We thank members of Shen’s laboratory for valuable discussion. We thank Dr. Thilo Hagen from National University of Singapore for providing the FLAG-CUL4A plasmid and some related reagents for this study. We thank Dr. Yaoqin Gong from Shandong University for providing the GST-DDB1 plasmid. We also thank Dr. Kah-Leong Lim from National University of Singapore and Dr. Philipp Kaldis from IMCB ASTAR Singapore for their advice and support for this work. This study is supported by research grants from Singapore National Medical Research Council (NMRC/CIRG/1373/2013 and NMRC/CIRG/1430/2015) to HM.S. G.L. is supported by NUS President’s Graduate Fellowship. H.W.S.T. is supported by NUS NGS scholarship. Y.R., C.O., L.W. are all supported by NUS Research Scholarship. S.A.T and A.G. are supported by the Francis Crick Institute which receives its core funding from Cancer Research UK (FC001187,FC001039, FC001999), the UK Medical Research Council (FC001187,FC001039, FC001999), and the Wellcome Trust (FC001187,FC001039, FC001999). Research UK (FC001187, FC001039, FC001999), the UK Medical Research Council (FC001187, FC001039, FC001999), and the Wellcome Trust (FC001187, FC001039, FC001999).
Disclosure statement
No potential conflict of interest was reported by the authors.
Supplementary material
Supplemental data for this article can be accessed here.
Additional information
Funding
Related Research Data
References
- Mizushima N, Komatsu M. Autophagy: renovation of cells and tissues. Cell. 2011 Nov 11;147(4):728–741. . PubMed PMID: 22078875.
- Shen HM, Mizushima N. At the end of the autophagic road: an emerging understanding of lysosomal functions in autophagy. Trends Biochem Sci. 2014 Feb;39(2):61–71. . PubMed PMID: 24369758.
- Ohsumi Y, Mizushima N. Two ubiquitin-like conjugation systems essential for autophagy. Semin Cell Dev Biol. 2004 Apr;15(2):231–236. PubMed PMID: 15209383.
- Mizushima N, Yoshimori T, Ohsumi Y. The role of Atg proteins in autophagosome formation. Annu Rev Cell Dev Biol. 2011;27:107–132. . PubMed PMID: 21801009.
- Levine B, Klionsky DJ. Development by self-digestion: molecular mechanisms and biological functions of autophagy. Dev Cell. 2004 Apr;6(4):463–477. PubMed PMID: 15068787.
- Polson HE, de Lartigue J, Rigden DJ, et al. Mammalian Atg18 (WIPI2) localizes to omegasome-anchored phagophores and positively regulates LC3 lipidation. Autophagy. 2010 May;6(4):506–522. PubMed PMID: 20505359.
- Lamb CA, Yoshimori T, Tooze SA. The autophagosome: origins unknown, biogenesis complex. Nat Rev Mol Cell Biol. 2013 Dec;14(12):759–774. . PubMed PMID: 24201109.
- Proikas-Cezanne T, Waddell S, Gaugel A, et al. WIPI-1alpha (WIPI49), a member of the novel 7-bladed WIPI protein family, is aberrantly expressed in human cancer and is linked to starvation-induced autophagy. Oncogene. 2004 Dec 16;23(58):9314–9325. PubMed PMID: 15602573.
- Itakura E, Mizushima N. Characterization of autophagosome formation site by a hierarchical analysis of mammalian Atg proteins. Autophagy. 2010 Aug;6(6):764–776. PubMed PMID: 20639694; PubMed Central PMCID: PMCPMC3321844.
- Bakula D, Muller AJ, Zuleger T, et al. WIPI3 and WIPI4 beta-propellers are scaffolds for LKB1-AMPK-TSC signalling circuits in the control of autophagy. Nat Commun. 2017 May;31(8):15637. . PubMed PMID: 28561066; PubMed Central PMCID: PMCPMC5460038.
- Dooley HC, Razi M, Polson HE, et al. WIPI2 links LC3 conjugation with PI3P, autophagosome formation, and pathogen clearance by recruiting Atg12-5-16L1. Mol Cell. 2014 Jul 17;55(2):238–252. PubMed PMID: 24954904; PubMed Central PMCID: PMCPMC4104028.
- Barbet NC, Schneider U, Helliwell SB, et al. TOR controls translation initiation and early G1 progression in yeast. Mol Biol Cell. 1996 Jan;7(1):25–42. PubMed PMID: 8741837; PubMed Central PMCID: PMCPMC278610.
- Tasdemir E, Maiuri MC, Tajeddine N, et al. Cell cycle-dependent induction of autophagy, mitophagy and reticulophagy. Cell Cycle. 2007 Sep 15;6(18):2263–2267. PubMed PMID: 17890908.
- Han K, Wang Q, Cao H, et al. The NEDD8-activating enzyme inhibitor MLN4924 induces G2 arrest and apoptosis in T-cell acute lymphoblastic leukemia. Oncotarget. 2016 Apr 26;7(17):23812–23824. PubMed PMID: 26993774; PubMed Central PMCID: PMCPMC5029665.
- Matsui A, Kamada Y, Matsuura A. The role of autophagy in genome stability through suppression of abnormal mitosis under starvation. PLoS Genet. 2013;9(1):e1003245. . PubMed PMID: 23382696; PubMed Central PMCID: PMCPMC3561091.
- Pohl C, Jentsch S. Midbody ring disposal by autophagy is a post-abscission event of cytokinesis. Nat Cell Biol. 2009 Jan;11(1):65–70. . PubMed PMID: 19079246.
- Isakson P, Lystad AH, Breen K, et al. TRAF6 mediates ubiquitination of KIF23/MKLP1 and is required for midbody ring degradation by selective autophagy. Autophagy. 2013 Dec;9(12):1955–1964. PubMed PMID: 24128730.
- Kuo TC, Chen CT, Baron D, et al. Midbody accumulation through evasion of autophagy contributes to cellular reprogramming and tumorigenicity. Nat Cell Biol. 2011 Sep 11;13(10):1214–1223. PubMed PMID: 21909099; PubMed Central PMCID: PMCPMC4208311.
- Mandell MA, Jain A, Kumar S, et al. TRIM17 contributes to autophagy of midbodies while actively sparing other targets from degradation. J Cell Sci. 2016 Oct 1;129(19):3562–3573. PubMed PMID: 27562068; PubMed Central PMCID: PMCPMC5087653.
- Dionne LK, Peterman E, Schiel J, et al. FYCO1 regulates accumulation of post-mitotic midbodies by mediating LC3-dependent midbody degradation. J Cell Sci. 2017 Dec 1;130(23):4051–4062. PubMed PMID: 29196475.
- Liu L, Xie R, Nguyen S, et al. Robust autophagy/mitophagy persists during mitosis. Cell Cycle. 2009 May 15;8(10):1616–1620. PubMed PMID: 19411827; PubMed Central PMCID: PMCPMC3230076.
- Li Z, Ji X, Wang D, et al. Autophagic flux is highly active in early mitosis and differentially regulated throughout the cell cycle. Oncotarget. 2016 Jun 28;7(26):39705–39718. PubMed PMID: 27213594; PubMed Central PMCID: PMCPMC5129964.
- Eskelinen EL, Prescott AR, Cooper J, et al. Inhibition of autophagy in mitotic animal cells. Traffic. 2002 Dec;3(12):878–893. PubMed PMID: 12453151.
- Furuya T, Kim M, Lipinski M, et al. Negative regulation of Vps34 by Cdk mediated phosphorylation. Mol Cell. 2010 May 28;38(4):500–511. PubMed PMID: 20513426; PubMed Central PMCID: PMCPMC2888511.
- Hershko A. The ubiquitin system for protein degradation and some of its roles in the control of the cell-division cycle (Nobel lecture). Angew Chem Int Ed Engl. 2005 Sep 19;44(37):5932–5943. . PubMed PMID: 16142823.
- Soucy TA, Smith PG, Milhollen MA, et al. An inhibitor of NEDD8-activating enzyme as a new approach to treat cancer. Nature. 2009 Apr 09;458(7239):732–736. PubMed PMID: 19360080.
- Jackson S, Xiong Y. CRL4s: the CUL4-RING E3 ubiquitin ligases. Trends Biochem Sci. 2009 Nov;34(11):562–570. . PubMed PMID: 19818632; PubMed Central PMCID: PMCPMC2783741.
- Xiao J, Zhang T, Xu D, et al. FBXL20-mediated Vps34 ubiquitination as a p53 controlled checkpoint in regulating autophagy and receptor degradation. Genes Dev. 2015 Jan 15;29(2):184–196. PubMed PMID: 25593308; PubMed Central PMCID: PMCPMC4298137.
- Zhang T, Dong K, Liang W, et al. G-protein-coupled receptors regulate autophagy by ZBTB16-mediated ubiquitination and proteasomal degradation of Atg14L. Elife. 2015 Mar;30(4):e06734. . PubMed PMID: 25821988; PubMed Central PMCID: PMCPMC4421748.
- Liu CC, Lin YC, Chen YH, et al. Cul3-KLHL20 ubiquitin ligase governs the turnover of ULK1 and VPS34 complexes to control autophagy termination. Mol Cell. 2016 Jan 07;61(1):84–97. PubMed PMID: 26687681.
- Ghosh P, Wu M, Zhang H, et al. mTORC1 signaling requires proteasomal function and the involvement of CUL4-DDB1 ubiquitin E3 ligase. Cell Cycle. 2008 Feb 01;7(3):373–381. PubMed PMID: 18235224.
- Hu J, Zacharek S, He YJ, et al. WD40 protein FBW5 promotes ubiquitination of tumor suppressor TSC2 by DDB1-CUL4-ROC1 ligase. Genes Dev. 2008 Apr 01;22(7):866–871. PubMed PMID: 18381890; PubMed Central PMCID: PMCPMC2279197.
- Antonioli M, Albiero F, Nazio F, et al. AMBRA1 interplay with cullin E3 ubiquitin ligases regulates autophagy dynamics. Dev Cell. 2014 Dec 22;31(6):734–746. PubMed PMID: 25499913.
- Sumara I, Maerki S, Peter M. E3 ubiquitin ligases and mitosis: embracing the complexity. Trends Cell Biol. 2008 Feb;18(2):84–94. . PubMed PMID: 18215523.
- Li B, Jia N, Kapur R, et al. Cul4A targets p27 for degradation and regulates proliferation, cell cycle exit, and differentiation during erythropoiesis. Blood. 2006 Jun 01;107(11):4291–4299. 10.1182/blood-2005-08-3349. PubMed PMID: 16467204; PubMed Central PMCID: PMCPMC1895787.
- Brodersen MM, Lampert F, Barnes CA, et al. CRL4(WDR23)-mediated SLBP ubiquitylation ensures histone supply during DNA replication. Mol Cell. 2016 May 19;62(4):627–635. PubMed PMID: 27203182.
- Jin J, Arias EE, Chen J, et al. A family of diverse Cul4-Ddb1-interacting proteins includes Cdt2, which is required for S phase destruction of the replication factor Cdt1. Mol Cell. 2006 Sep 01;23(5):709–721. PubMed PMID: 16949367.
- Higa LA, Banks D, Wu M, et al. L2DTL/CDT2 interacts with the CUL4/DDB1 complex and PCNA and regulates CDT1 proteolysis in response to DNA damage. Cell Cycle. 2006 Aug;5(15):1675–1680. PubMed PMID: 16861906.
- Jiang L, Rong R, Sheikh MS, et al. Cullin-4A.DNA damage-binding protein 1 E3 ligase complex targets tumor suppressor RASSF1A for degradation during mitosis. J Biol Chem. 2011 Mar 04;286(9):6971–6978. PubMed PMID: 21205828; PubMed Central PMCID: PMCPMC3044953.
- Kimura S, Noda T, Yoshimori T. Dissection of the autophagosome maturation process by a novel reporter protein, tandem fluorescent-tagged LC3. Autophagy. 2007 Sep-Oct;3(5):452–460. PubMed PMID: 17534139.
- Mackeh R, Perdiz D, Lorin S, et al. Autophagy and microtubules - new story, old players. J Cell Sci. 2013 Mar 1;126(Pt 5):1071–1080. PubMed PMID: 23620510.
- Kochl R, Hu XW, Chan EY, et al. Microtubules facilitate autophagosome formation and fusion of autophagosomes with endosomes. Traffic. 2006 Feb;7(2):129–145. PubMed PMID: 16420522.
- Aplin A, Jasionowski T, Tuttle DL, et al. Cytoskeletal elements are required for the formation and maturation of autophagic vacuoles. J Cell Physiol. 1992 Sep;152(3):458–466. PubMed PMID: 1506410.
- Reunanen H, Marttinen M, Hirsimaki P. Effects of griseofulvin and nocodazole on the accumulation of autophagic vacuoles in Ehrlich ascites tumor cells. Exp Mol Pathol. 1988 Feb;48(1):97–102. PubMed PMID: 3335254.
- Laplante M, Sabatini DM. mTOR signaling in growth control and disease. Cell. 2012 Apr 13;149(2):274–293. . PubMed PMID: 22500797; PubMed Central PMCID: PMCPMC3331679.
- Russell RC, Tian Y, Yuan H, et al. ULK1 induces autophagy by phosphorylating Beclin-1 and activating VPS34 lipid kinase. Nat Cell Biol. 2013 Jul;15(7):741–750. PubMed PMID: 23685627; PubMed Central PMCID: PMCPMC3885611.
- Nawrocki ST, Griffin P, Kelly KR, et al. MLN4924: a novel first-in-class inhibitor of NEDD8-activating enzyme for cancer therapy. Expert Opin Investig Drugs. 2012 Oct;21(10):1563–1573. PubMed PMID: 22799561.
- Luo Z, Yu G, Lee HW, et al. The Nedd8-activating enzyme inhibitor MLN4924 induces autophagy and apoptosis to suppress liver cancer cell growth. Cancer Res. 2012 Jul 01;72(13):3360–3371. PubMed PMID: 22562464.
- Zhao Y, Xiong X, Jia L, et al. Targeting Cullin-RING ligases by MLN4924 induces autophagy via modulating the HIF1-REDD1-TSC1-mTORC1-DEPTOR axis. Cell Death Dis. 2012 Sep;06(3):e386. . PubMed PMID: 22951983; PubMed Central PMCID: PMCPMC3461362.
- Dove SK, Piper RC, McEwen RK, et al. Svp1p defines a family of phosphatidylinositol 3,5-bisphosphate effectors. Embo J. 2004 May 05;23(9):1922–1933. PubMed PMID: 15103325; PubMed Central PMCID: PMCPMC404323.
- Klionsky DJ, Abdelmohsen K, Abe A, et al. Guidelines for the use and interpretation of assays for monitoring autophagy (3rd edition). Autophagy. 2016;12(1):1–222. . PubMed PMID: 26799652; PubMed Central PMCID: PMCPMC4835977.
- Nair U, Cao Y, Xie Z, et al. Roles of the lipid-binding motifs of Atg18 and Atg21 in the cytoplasm to vacuole targeting pathway and autophagy. J Biol Chem. 2010 Apr 09;285(15):11476–11488. PubMed PMID: 20154084; PubMed Central PMCID: PMCPMC2857026.
- Proikas-Cezanne T, Takacs Z, Donnes P, et al. WIPI proteins: essential PtdIns3P effectors at the nascent autophagosome. J Cell Sci. 2015 Jan 15;128(2):207–217. PubMed PMID: 25568150.
- Hrecka K, Gierszewska M, Srivastava S, et al. Lentiviral Vpr usurps Cul4-DDB1[VprBP] E3 ubiquitin ligase to modulate cell cycle. Proc Natl Acad Sci U S A. 2007 Jul 10;104(28):11778–11783. PubMed PMID: 17609381; PubMed Central PMCID: PMCPMC1906728.
- Hu J, McCall CM, Ohta T, et al. Targeted ubiquitination of CDT1 by the DDB1-CUL4A-ROC1 ligase in response to DNA damage. Nat Cell Biol. 2004 Oct;6(10):1003–1009. PubMed PMID: 15448697.
- Kopanja D, Stoyanova T, Okur MN, et al. Proliferation defects and genome instability in cells lacking Cul4A. Oncogene. 2009 Jul 02;28(26):2456–2465. PubMed PMID: 19430492; PubMed Central PMCID: PMCPMC2705479.
- Katiyar S, Liu E, Knutzen CA, et al. REDD1, an inhibitor of mTOR signalling, is regulated by the CUL4A-DDB1 ubiquitin ligase. EMBO Rep. 2009 Aug;10(8):866–872. PubMed PMID: 19557001; PubMed Central PMCID: PMCPMC2726664.
- Wei N, Deng XW. The COP9 signalosome. Annu Rev Cell Dev Biol. 2003;19:261–286. . PubMed PMID: 14570571.
- Stuttmann J, Lechner E, Guerois R, et al. COP9 signalosome- and 26S proteasome-dependent regulation of SCFTIR1 accumulation in Arabidopsis. J Biol Chem. 2009 Mar 20;284(12):7920–7930. PubMed PMID: 19147500; PubMed Central PMCID: PMCPMC2658085.
- Higa LA, Wu M, Ye T, et al. CUL4-DDB1 ubiquitin ligase interacts with multiple WD40-repeat proteins and regulates histone methylation. Nat Cell Biol. 2006 Nov;8(11):1277–1283. PubMed PMID: 17041588.
- Wang YT, Chen J, Chang CW, et al. Ubiquitination of tumor suppressor PML regulates prometastatic and immunosuppressive tumor microenvironment. J Clin Invest. 2017 Aug 01;127(8):2982–2997. PubMed PMID: 28691927; PubMed Central PMCID: PMCPMC5531412.
- Cheng B, Crasta K. Consequences of mitotic slippage for antimicrotubule drug therapy. Endocr Relat Cancer. 2017 Sep;24(9):T97–T106. . PubMed PMID: 28684541.
- Dou Z, Xu C, Donahue G, et al. Autophagy mediates degradation of nuclear lamina. Nature. 2015 Nov 5;527(7576):105–109. PubMed PMID: 26524528; PubMed Central PMCID: PMCPMC4824414.
- Herbig U, Jobling WA, Chen BP, et al. Telomere shortening triggers senescence of human cells through a pathway involving ATM, p53, and p21(CIP1), but not p16(INK4a). Mol Cell. 2004 May 21;14(4):501–513. PubMed PMID: 15149599.
- Young AR, Narita M. SASP reflects senescence. EMBO Rep. 2009 Mar;10(3):228–230. . PubMed PMID: 19218920; PubMed Central PMCID: PMCPMC2658552.
- Jakhar R, Luijten MNH, Wong AXF, et al. Autophagy governs pro-tumorigenic effects of mitotic slippage-induced senescence. Mol Cancer Res. 2018 Jul 23. DOI:10.1158/1541-7786.mcr-18-0024. PubMed PMID: 30037855; eng.
- Sit KH, Paramanantham R, Bay BH, et al. Sequestration of mitotic (M-phase) chromosomes in autophagosomes: mitotic programmed cell death in human Chang liver cells induced by an OH* burst from vanadyl(4). Anat Rec. 1996 May;245(1):1–8. PubMed PMID: 8731032.
- Colanzi A, Deerinck TJ, Ellisman MH, et al. A specific activation of the mitogen-activated protein kinase kinase 1 (MEK1) is required for Golgi fragmentation during mitosis. J Cell Biol. 2000 Apr 17;149(2):331–339. PubMed PMID: 10769026; PubMed Central PMCID: PMCPMC2175149.
- Alvarez-Fernandez M, Malumbres M. Preparing a cell for nuclear envelope breakdown: spatio-temporal control of phosphorylation during mitotic entry. Bioessays. 2014 Aug;36(8):757–765. . PubMed PMID: 24889070.
- Mathiassen SG, De Zio D, Cecconi F. Autophagy and the cell cycle: A complex landscape. Front Oncol. 2017;7:51. . PubMed PMID: 28409123; PubMed Central PMCID: PMCPMC5374984.
- Young AR, Narita M, Ferreira M, et al. Autophagy mediates the mitotic senescence transition. Genes Dev. 2009 Apr 1;23(7):798–803. PubMed PMID: 19279323; PubMed Central PMCID: PMCPMC2666340.
- Lee J, Zhou P. Cullins and cancer. Genes Cancer. 2010 Jul;1(7):690–699. 10.1177/1947601910382899. PubMed PMID: 21127736; PubMed Central PMCID: PMCPMC2994581.
- Wei W, Lin HK. The key role of ubiquitination and sumoylation in signaling and cancer: a research topic. Front Oncol. 2012;2:187. PubMed PMID: 23227454; PubMed Central PMCID: PMCPMC3514534.
- Li Y, Wang X. The role of cullin4B in human cancers. Exp Hematol Oncol. 2017;6:17. . PubMed PMID: 28630798; PubMed Central PMCID: PMCPMC5471934.
- Yuan J, Jiang B, Zhang A, et al. Accelerated hepatocellular carcinoma development in CUL4B transgenic mice. Oncotarget. 2015 Jun 20;6(17):15209–15221. PubMed PMID: 25945838; PubMed Central PMCID: PMCPMC4558146. eng.
- Hu H, Yang Y, Ji Q, et al. CRL4B catalyzes H2AK119 monoubiquitination and coordinates with PRC2 to promote tumorigenesis. Cancer Cell. 2012 Dec 11;22(6):781–795. PubMed PMID: 23238014.
- Ji Q, Hu H, Yang F, et al. CRL4B interacts with and coordinates the SIN3A-HDAC complex to repress CDKN1A and drive cell cycle progression. J Cell Sci. 2014 Nov 1;127(Pt 21):4679–4691. PubMed PMID: 25189618; eng.
- Yang Y, Liu R, Qiu R, et al. CRL4B promotes tumorigenesis by coordinating with SUV39H1/HP1/DNMT3A in DNA methylation-based epigenetic silencing. Oncogene. 2015 Jan 2;34(1):104–118. PubMed PMID: 24292684; eng.
- Yang D, Tan M, Wang G, et al. The p21-dependent radiosensitization of human breast cancer cells by MLN4924, an investigational inhibitor of NEDD8 activating enzyme. PLoS One. 2012;7(3):e34079. . PubMed PMID: 22457814; PubMed Central PMCID: PMCPMC3310880.
- Pan WW, Zhou JJ, Yu C, et al. Ubiquitin E3 ligase CRL4(CDT2/DCAF2) as a potential chemotherapeutic target for ovarian surface epithelial cancer. J Biol Chem. 2013 Oct 11;288(41):29680–29691. PubMed PMID: 23995842; PubMed Central PMCID: PMCPMC3795265.
- Boh BK, Ng MY, Leck YC, et al. Inhibition of cullin RING ligases by cycle inhibiting factor: evidence for interference with Nedd8-induced conformational control. J Mol Biol. 2011 Oct 21;413(2):430–437. PubMed PMID: 21903097.
- Li X, Lu D, He F, et al. Cullin 4B protein ubiquitin ligase targets peroxiredoxin III for degradation. J Biol Chem. 2011 Sep 16;286(37):32344–32354. PubMed PMID: 21795677; PubMed Central PMCID: PMCPMC3173229.