
ABSTRACT
Impaired macroautophagy/autophagy has been implicated in experimental and human pancreatitis. However, the transcriptional control governing the autophagy-lysosomal process in pancreatitis is largely unknown. We investigated the role and mechanisms of TFEB (transcription factor EB), a master regulator of lysosomal biogenesis, in the pathogenesis of experimental pancreatitis. We analyzed autophagic flux, TFEB nuclear translocation, lysosomal biogenesis, inflammation and fibrosis in GFP-LC3 transgenic mice, acinar cell-specific tfeb knockout (KO) and tfeb and tfe3 double-knockout (DKO) mice as well as human pancreatitis samples. We found that cerulein activated MTOR (mechanistic target of rapamycin kinase) and increased the levels of phosphorylated TFEB as well as pancreatic proteasome activities that led to rapid TFEB degradation. As a result, cerulein decreased the number of lysosomes resulting in insufficient autophagy in mouse pancreas. Pharmacological inhibition of MTOR or proteasome partially rescued cerulein-induced TFEB degradation and pancreatic damage. Furthermore, genetic deletion of tfeb specifically in mouse pancreatic acinar cells increased pancreatic edema, necrotic cell death, infiltration of inflammatory cells and fibrosis in pancreas after cerulein treatment. tfeb and tfe3 DKO mice also developed spontaneous pancreatitis with increased pancreatic trypsin activities, edema and infiltration of inflammatory cells. Finally, decreased TFEB nuclear staining was associated with human pancreatitis. In conclusion, our results indicate a critical role of impaired TFEB-mediated lysosomal biogenesis in promoting the pathogenesis of pancreatitis.
Abbreviations: AC: acinar cell; AMY: amylase; ATP6V1A: ATPase, H+ transporting, lysosomal V1 subunit A; ATP6V1B2: ATPase, H+ transporting, lysosomal V1 subunit B2; ATP6V1D: ATPase, H+ transporting, lysosomal V1 subunit D; ATP6V1H: ATPase, H+ transporting, lysosomal V1 subunit H; AV: autophagic vacuole; CDE: choline-deficient, ethionine-supplemented; CLEAR: coordinated lysosomal expression and regulation; CQ: chloroquine; EIF4EBP1: eukaryotic translation initiation factor 4E binding protein 1; EM: electron microscopy; GAPDH: glyceraldehyde-3-phosphate dehydrogenase; GFP: green fluorescent protein; H & E: hematoxylin and eosin; KO: knockout; LAMP1: lysosomal-associated membrane protein 1; MAP1LC3/LC3: microtubule associated protein 1 light chain 3; MAPK1/ERK2: mitogen-activated protein kinase 1; MTORC1: mechanistic target of rapamycin kinase complex 1; ND: normal donor; NEU: neutrophil; PPARGC1A/PGC1α: peroxisome proliferator-activated receptor, gamma, coactivator 1 alpha; RIPA: radio-immunoprecipitation; RPS6: ribosomal protein S6; SQSTM1/p62: sequestosome 1; TFEB: transcription factor EB; TM: tamoxifen; WT: wild-type; ZG: zymogen granule
Introduction
Pancreatitis is an inflammatory disease caused by the damage of the exocrine acinar cells, which is the most common cause of hospitalization of gastrointestinal disorders in the United States. The pathogenesis of pancreatitis remains unclear and thus no successful treatment for pancreatitis is available [Citation1]. Recent evidence suggests that pancreatitis is prevented by controlling the homeostasis and quality of zymogen granules (ZGs) and lysosomes through autophagy [Citation2–Citation4]. Autophagy – one component of the lysosomal degradation pathway – is a highly conserved survival and quality control mechanism that is activated in response to stresses such as the deprivation of nutrients or growth factors [Citation5,Citation6]. The direct connection between the autophagy-lysosomal pathway and pancreatitis is demonstrated by deletion of lysosomal and essential Atg (autophagy related) genes, which leads to spontaneous pancreatitis [Citation7,Citation8]. In addition, impaired lysosomal function and decreased pancreatic LAMP1/2 (lysosomal-associated membrane protein 1/2) expression have also been reported in experimental pancreatitis models [Citation7,Citation9]. However, the transcriptional control governing the autophagy-lysosomal process in pancreatitis is largely unknown. Moreover, the exact step that is impaired in the autophagic process in pancreatitis also remains poorly understood.
It has been reported that fragile ZGs can be removed by autophagy to avoid intracellular activation of trypsinogen and subsequent pancreatitis in cerulein-induced pancreatitis [Citation4]. Dysfunctional and abnormal autolysosomes or lysosomes manifest as large vacuoles, which are common phenotypes in experimental pancreatitis and human pancreatitis [Citation1,Citation2]. Since lysosomes sit at the last step of autophagy by fusing with autophagosomes, accumulation of dysfunctional lysosomes can lead to impaired autophagic degradation. Therefore, maintaining the quantity and quality of lysosomes through lysosomal biogenesis is critical to maintaining sufficient autophagic degradation for removal of damaged and fragile ZGs to protect against the pathogenesis of pancreatitis.
TFEB (transcription factor EB) is a master transcription regulator of a subset of genes for lysosomal biogenesis and autophagy [Citation10,Citation11]. TFEB is a basic helix-loop-helix leucine zipper transcription factor belonging to the coordinated lysosomal expression and regulation (CLEAR) gene network [Citation12]. In response to increased autophagic degradation needs, TFEB coordinates an efficient transcription program to upregulate genes that are responsible for both early (autophagosome formation) and late (lysosome biogenesis) phases of autophagy. TFEB is mainly regulated at its posttranslational level via phosphorylation of specific amino acid residues. MTOR (mechanistic target of rapamycin kinase) and MAPK1/ERK2 (mitogen-activated protein kinase 1) phosphorylate TFEB at Ser142 and Ser211 to enhance its binding with the cytosolic chaperone YWHA/14–3-3 (tyrosine 3-monooxygenase/tryptophan 5-monooxygenase activation protein), resulting in TFEB sequestration in the cytosol and reduced TFEB transcription activity [Citation12]. Conversely, lysosomal Ca2+ release activates the phosphatase calcineurin, which dephosphorylates TFEB at Ser142 and Ser211 and promotes TFEB nuclear translocation [Citation13].
In the present study, we found that pancreatic levels of TFEB protein decreased in human pancreatitis and in experimental mouse models of pancreatitis. Decreased TFEB-mediated lysosomal biogenesis induced by cerulein resulted in insufficient autophagy and subsequent pancreatic injury. Genetic deletion of tfeb specifically in mouse pancreatic acinar cells exacerbated the pathogenesis of experimental pancreatitis induced by cerulein.
Results
Cerulein induces acute pancreatitis in mice
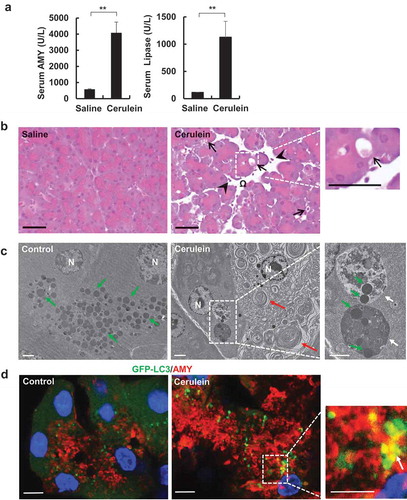
We first established the acute experimental pancreatitis in mice. Mice were given cerulein by 7 hourly injections as described previously [Citation14]. Cerulein significantly increased serum AMY (amylase) and lipase activities compared with control mice that received saline (). Histological analysis showed markedly increased pancreatic edema, intracellular vacuoles in acinar cells and increased infiltration of inflammatory cells in cerulein-treated mouse pancreas (). EM studies further revealed accumulated aberrant endoplasmic reticulum membranes and large autolysosome-like structures that enveloped with ZGs in acinar cells of cerulein-treated mice (), typical hall markers of pancreatitis. Using GFP-LC3 transgenic mice, increased colocolization of GFP-LC3 puncta with AMY-positive ZG was readily detected by confocal microscopy (), further confirming with the EM data. These data indicate that cerulein induces pancreatitis in mice, which is likely associated with autophagic removal of ZG.
Figure 1. Cerulein induces pancreatitis in mice. Pancreatitis was induced by 7 hourly intraperitoneal injections of cerulein (50 μg/kg) in male C57BL/6J mice. (a) Serum AMY and lipase levels were measured. Data shown are mean ± SE (n = 4). **p < 0.01 by Student t test. (b) Representative H&E staining images of mouse pancreas from cerulein treatment. Right panel was an enlarged photograph from the indicated boxed area. Arrows denote vacuolized acinar cells. Arrow heads denote infiltrated inflammatory cells. Omega denotes edema. Bar: 50 μm. (c) Representative EM images from saline and cerulein-treated mouse pancreas. N: nucleus. White arrows: large autolysosomes. Green arrows: zymogen granule. Red arrows: aberrant ER membranes. Bar: 2 µm. (d) Male GFP-LC3 transgenic mice were administrated with 7 hourly intraperitoneal injections of cerulein (50 μg/kg). Cryo-sections of pancreas were subjected to immunostaining for AMY (red) and nuclei were stained with Hoechst33342 followed by confocal microscopy. Arrows denote the co-localization of GFP-LC3 (green) and AMY. Bar: 10 µm.
Cerulein induces insufficient autophagy with decreased number of acinar cell lysosomes in mouse pancreas
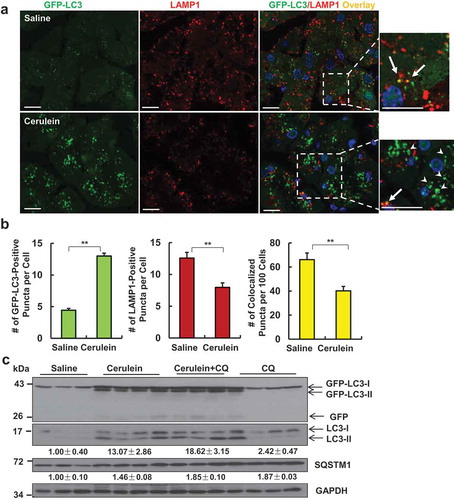
GFP-LC3 transgenic mice were treated with cerulein to determine autophagic flux in mouse pancreas. As shown in , GFP-LC3 displayed a diffuse pattern in the cytosol of acinar cells in control mice with a few number of puncta that represented the basal autophagy. Following cerulein treatment, the number of GFP-LC3 puncta increased significantly due to their targeting to autophagosomal membranes (). Autophagy is a dynamic process and newly synthesized autophagosomes need to fuse with lysosomes to form autolysosomes where autophagic cargos are degraded to complete the autophagy process (autophagic flux). We found that the number of lysosomes decreased in acinar cells after cerulein treatment as judged by LAMP1-positive vesicles/puncta (labelled as red, ). We further found that the percentage of overlayed GFP-LC3 puncta with LAMP1 was significantly lower in cerulein-treated mouse pancreas than that of control mice (). These data suggest that there are more accumulated autophagosomes in cerulein-treated pancreatic acinar cells than that of control mice, which is likely due to the lack of sufficient number of lysosomes to fuse with autophagosomes. To further determine the autophagic flux, GFP-LC3 mice were further treated with chloroquine (CQ) with or without cerulein. We found that cerulein treatment alone increased the levels of GFP-LC3-II and endogenous LC3-II with minimal but detectable free GFP, the latter is generated from the degradation of GFP-LC3-II in the autolysosomes [Citation15]. CQ alone also increased endogenous LC3-II, which reflects the basal autophagy in pancreas. However, the combination of CQ with cerulein treatment had higher levels of GFP-LC3-II and endogenous LC3-II than either cerulein or CQ alone treatment. Similar results were also found in C57BL/6J mice after ceruelin and CQ treatment (Figure S1A). According to the autophagy guidelines [Citation16], these data suggest that cerulein increases autophagic flux in pancreas. However, the levels of SQSTM1/p62 (sequestosome 1), a substrate protein of autophagy, markedly increased after cerulein treatment ( and Figure S1A), suggesting that cerulein-induced autophagy is not sufficient to degrade SQSTM1 in pancreas. Because SQSTM1 is also regulated at the transcription level, we determined the levels of Sqstm1 mRNA after cerulein. We found that cerulein treatment significantly increased gene expression of Sqstm1 but not Lc3b in pancreas (Figure S1B). Collectively, based on the increased pancreatic SQSTM1 and decreased lysosome numbers, cerulein may induce insufficient autophagy in mouse pancreas, a scenario similar to what we have recently described in mouse livers after chronic alcohol exposure [Citation17,Citation18].
Figure 2. Cerulein decreases acinar cell lysosome numbers and induces insufficient autophagy in mouse pancreas. Male GFP-LC3 transgenic mice were administrated with 7 hourly intraperitoneal injections of cerulein (50 μg/kg). Cryo-sections of pancreas were subjected to immunostaining for LAMP1 and nuclei were stained with Hoechst33342. (a) Representative confocal microscopy images of cryo-sections of pancreas are shown. Arrows represent colocalized puncta of GFP-LC3 with LAMP1. Arrowheads indicate green-only GFP-LC3 puncta. Bar: 20 µm. (b) The numbers of GFP-LC3 puncta, LAMP1 puncta and GFP-LC3/LAMP1 overlay puncta per cell in each group were quantified. More than 120 cells were counted in each mouse. Data are mean ± SE (n = 4). **p < 0,01; Student t-test analysis. (c) Male GFP-LC3 transgenic mice were administrated with chloroquine (CQ, 60 mg/kg, i.p) or saline followed by 7 hourly intraperitoneal injections of cerulein (50 μg/kg) or saline. Total pancreatic lysates were subjected to immunoblotting analysis. Densitometry analysis were performed for SQSTM1 and LC3-II (normalized to loading control GAPDH) and data shown are mean ± SE (n = 3–4).
Cerulein impaires TFEB-mediated lysosomal biogenesis in mouse pancreas
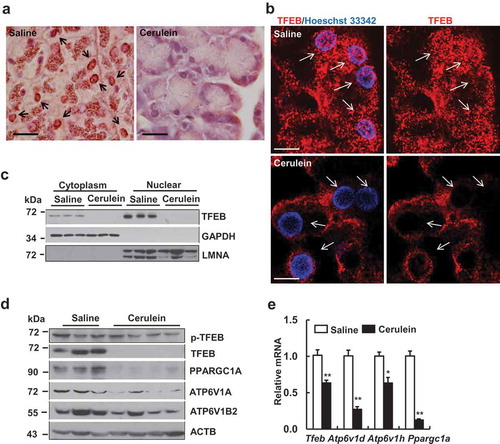
Since TFEB is the master regulator for lysosomal biogenesis and cerulein decreased lysosome numbers in pancreatic acinar cells, we next determined the cellular localization of TFEB in acinar cells after cerulein treatment. Both immunohistochemical and immunofluorescence staining of TFEB revealed decreased nuclear staining of TFEB in cerulein-treated mouse pancreas acinar cells whereas TFEB showed both cytoplasm and nuclei staining in control mouse pancreas acinar cells (). We also found increased nuclear staining of TFEB in pancreas acinar cells in starved mice (Figure S2A), which validates the specificity of TFEB staining. Starvation also decreased the levels of phosphorylated TFEB but increased total TFEB as well as LC3-II levels in pancreas (Figure S2B). In addition to acinar cells, we found that TFEB also expressed in pancreatic duct cells in both mouse and human pancreas (Figure S3A). Consistent with the immunostaining data, cellular fractionation studies also revealed that cerulein decreased both cytosolic and nuclear TFEB levels dramatically to almost undetectable levels compared with control mice (). Moreover, we found that the total pancreatic levels of TFEB and PPARGC1A, ATP6V1A and ATP6V1B2, all encoded by TFEB-targeted genes, markedly decreased after cerulein treatment (). We further confirmed that cerulein decreased TFEB proteins in a dose-dependent manner in mouse pancreas (Figure S4A). In addition to cerulein-induced pancreatitis, we also found that pancreatic TFEB protein decreased in a choline-deficient ethionine-supplemented (CDE)-diet induced pancreatitis (Figure S4B) as well as in chronic alcohol plus binge alcohol-treated mice that induced mild pancreatitis (data not shown). To further determine whether TFEB transcription activity was impaired by cerulein, we performed qRT-PCR analysis for the mRNA levels of TFEB target genes. We found that the mRNA levels of several TFEB target genes including tfeb, Ppargc1a as well as several known ATPase H+ transporting V1 subunits significantly decreased compared to control mice (). Collectively, these data indicate that TFEB-mediated lysosomal biogenesis is impaired in cerulein-induced pancreatitis in mice.
Figure 3. Cerulein inactivates TFEB in mouse pancreas. Male C57BL/6J mice were injected 7 hourly with cerulein (50 μg/kg) or saline. (a) Representative images of immunohistochemical staining of TFEB in mouse pancreas are shown. Arrows denote the nuclear TFEB. Bar: 50 µm. (b) Immunofluorescence analysis of TFEB staining using cryo-pancreatic tissues. Nuclei were stained with Hoechst33342. Arrows denote nuclear staining of TFEB. Bar: 20 µm. (c) Immunoblotting analysis using cytoplasmic and nuclear fractions from pancreatic tissues. (d) Immunoblotting analysis using total lysates from pancreatic tissues. (e) Pancreatic RNA was extracted followed by qPCR analysis. Results were normalized to Rn18s and expressed as fold change compared to control group. Data shown are mean ± SE (n = 4–6). *p < 0.05; **p < 0,01; Student t-test analysis.
Cerulein increases proteasome activity and likely activates MTOR and induces TFEB degradation in mouse pancreas
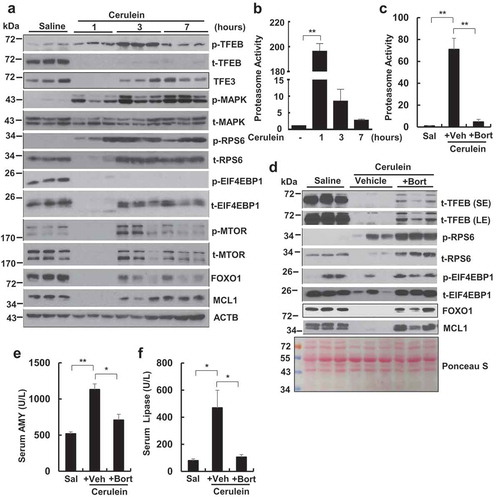
To determine the temporal changes of TFEB in pancreas after cerulein treatment, we performed a time-course study of cerulein treatment. We found that cerulein increased the levels of phosphorylated TFEB as early as at 1 h, which were further increased at 3 h and declined at 7 h although the total TFEB levels dramatically decreased as early as 1 h and remained such a low level for up to 7 h. Interestingly, the levels of pancreatic TFE3 also decreased at 1 h but recovered at 3 and 7 h following cerulein treatment, indicating a different protein change kinetics of TFEB and TFE3 in response to cerulein. The levels of phosphorylated MAPK1 increased in all the time points in cerulein-treated mouse pancreas without affecting the total MAPK1. Activation of MTOR often leads to increased phosphorylation of RPS6 and EIF4EBP1, two well-known MTOR substrate proteins. We found the levels of phosphorylated RPS6 increased as early as 1 h and sustained for up to 7 h but the total RPS6 decreased at 1 h and recovered at 3 and 7 h in cerulein-treated mouse pancreas. Similar to the changes of total RPS6, the total EIF4EBP1 and MTOR also decreased at 1 h and recovered at 3 and 7 h in cerulein-treated mouse pancreas. To our surprise, the levels of phosphorylated EIF4EBP1 decreased in all the time points but the levels of phosphorylated MTOR decreased at 1 h but increased at 3 h and then declined at 7 h in cerulein-treated mouse pancreas. The levels of FOXO1 (forkhead box O1) and MCL1 (myeloid cell leukemia sequence 1), two well-known proteins that degraded by proteasome, also decreased at 1 h but recovered at 3 and 7 h in cerulein-treated mouse pancreas (). Moreover, we found that the proteasome activities increased to almost 200-fold in cerulein-treated mouse pancreas at 1 h compared with control. While the proteasome activities declined at 3 and 7 h in cerulein-treated mouse pancreas, it remained significantly higher than the control group (). Cerulein-induced proteasome activation was significantly inhibited by the proteasome inhibitor bortezomib (). Interestingly, bortezomib markedly increased the total proteins of RPS6, EIF4EBP1, FOXO1 and MCL1 and partially recovered TFEB protein that were degraded by cerulein at 1 h in mouse pancreas (). As a result, bortezomib also significantly inhibited serum AMY and lipase activities induced by cerulein (). We did not find significant changes on the phosphorylation of AKT and its substrate GSK3B/GSK3β in cerulein-treated mouse pancreas (Figure S5A and B). Torin 1, a specific MTOR inhibitor, partially rescued cerulein-induced decreased TFEB (rescued from 9% to 32% of control TFEB level) and inhibited cerulein-induced serum AMY and lipase levels although it only partially decreased cerulein-induced phosphorylation of RPS6 by 40% (Figure S6A and B). In contrast, SCH772984, a specific MAPK inhibitor markedly inhibited cerulein-induced phosphorylation of MAPK but had only minimal effects on cerulein-induced decreased TFEB and had little effects on cerulein-induced serum AMY and lipase levels (Figure S6C and D). Taken together, these data indicate that cerulein increases proteasome activities that may lead to increased proteasome-mediated degradation of various proteins including TFEB in mouse pancreas. Activation of MTOR but not MAPK seems play more important roles in cerulein-induced TFEB degradation and pancreatic damage.
Figure 4. Time-course study of pancreatic TFEB and proteasome changes after cerulein administration in mice. Male C57BL/6J mice were injected hourly with cerulein (20 μg/kg) or saline for 1, 3 and 7 h. All mice were sacrificed 1 h after the last injection. (a) Immunoblotting analysis using total lysates from pancreatic tissues. p-TFEB, phosphorylated TFEB; t-TFEB, total TFEB. (b) Pancreatic proteasome activities were measured. Data are mean ± SE (n = 3–4). (c) Male C57BL/6J mice were pretreated with bortezomib (Bort, 1 mg/kg, i.p.) for overnight followed by a second booster treatment 1 h before one dose of cerulein treatment (1 h). Sal: Saline; Veh: Vehicle. Pancreatic proteasomal activities were measured. Data are expressed as fold change compared to control group. Data shown are mean ± SE (n = 3–4). **p < 0.01; One-way ANOVA analysis. (d) Immunoblotting analysis using total lysates from pancreatic tissues. Activities of serum AMY (e) and lipase (f) were quantified. Data shown are mean ± SE (n = 3–4). *p < 0.05; **p < 0.01; One-way ANOVA analysis.
Acinar cell-specific tfeb knockout mice exacerbate cerulein-induced pancreatitis
To test the role of genetic ablation of tfeb in pancreatitis, we generated inducible acinar cell-specific tfeb knockout (KO) mice. As can be seen, immunostaining for TFEB revealed that acinar cell-specific tfeb KO mice had decreased staining of TFEB in acinar cells, suggesting an efficient deletion of tfeb in acinar cells by BAC-Ela-Cre. Interestingly, we still could detect very strong TFEB staining signals in islets, suggesting that the deletion of tfeb is not only efficient but also specific in acinar cells (). Deletion of tfeb was also confirmed by immunoblotting analysis (). The pancreatic levels of SQSTM1 and LC3-II further increased in cerulein-treated acinar cell-specific tfeb KO mice compared with matched WT (Tfebf/f) mice (). Increased SQSTM1 and LC3-II levels may reflect the impaired autolysosomal degradation due to the lack of TFEB-mediated lysosomal biogenesis in tfeb KO mouse pancreatic acinar cells. Indeed, immunostaining for SQSTM1 also revealed significant accumulation of SQSTM1 in cerulein-treated tfeb KO pancreas than in WT mice (Figure S7A).
Figure 5. Acinar cell-specific tfeb knockout mice decrease zymogen granules and AMY protein levels after cerulein treatment. BAC-Ela-Cre−; Tfebf/f (Tfebf/f) and BAC-Ela-Cre+; Tfebf/f (tfeb KO) mice were injected with tamoxifen (75 mg/kg) once a day for consecutive 5 days. Five days later after the last injection, these mice were further treated with 7 hourly injections of cerulein (20 μg/kg). (a) Immunohistochemistry analysis of TFEB staining using paraffin-embedded pancreas tissues from saline-treated mice. Bar: 50 μm. (b) Immunoblotting analysis using total pancreatic lysates from saline-treated mice. (c) Immunoblotting analysis using total lysates from pancreatic tissues. (d) Representative images of Toluidine blue staining of pancreatic tissues. Bar: 50 μm.
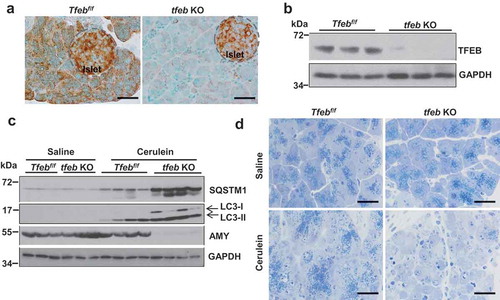
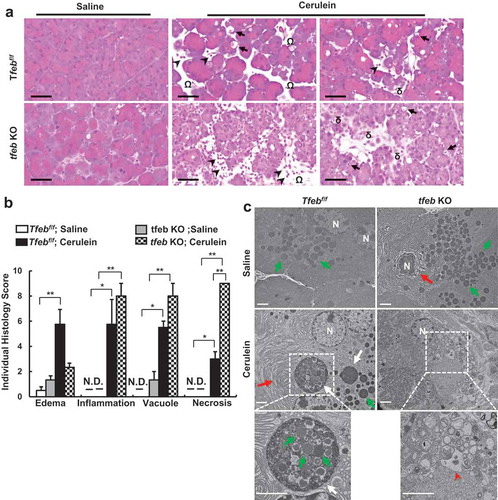
Interestingly, we found that the levels of pancreatic AMY markedly decreased in cerulein-treated acinar cell-specific tfeb KO mice (). Toluidine blue staining revealed few ZG in cerulein-treated tfeb KO mouse pancreas (). Notably, we found that acinar cell-specific tfeb KO mice had mild pancreatic histological changes with the same basal trypsin activities as well as serum levels of AMY activities as the matched WT mice (Figure S8A and Figure S9 and ), suggesting deletion of tfeb alone in mouse acinar cells does not cause spontaneous pancreatitis. H&E staining revealed increased infiltration of inflammatory cells, number of necrotic cells and vacuolized cells in cerulein treated mouse pancreas, which were further increased in acinar cell-specific tfeb KO mice (). Most acinar cells lacked the pink color staining of ZG in cerulein-treated acinar cell-specific tfeb KO mice (). EM studies showed that cerulein increased the formation of large autolysosome structures and aberrant ER membranes in wild type mice. In contrast, ZGs were barely seen in acinar cells of cerulein-treated acinar cell-specific tfeb KO mice, and these acinar cells showed massive vacuolization and disrupted organelles that are typical features of necrotic cell death (). Sirius red, MPO and TUNEL staining revealed that increased pancreatic fibrosis, infiltrated MPO-positive neutrophils and acinar cell death in cerulein-treated acinar-cell specific tfeb KO mice than their matched wild type mice (). Experimental pancreatitis induced by cerulein generally takes around 7 h after hourly repeated cerulein injection. However, we found that one single injection of cerulein for 1 h already induced typical features of pancreatitis including edema, cell death and infiltration of inflammatory cells as well as increased pancreatic trypsin activities in tfeb KO mice whereas only mild edema was found in WT mice (Figure S8A and B). Intriguingly, the AMY activity in pancreatic tissues significantly deceased in cerulein-treated tfeb KO mice as early as at 1 h for up to 7 h but not in WT mice (Figure S9A). The levels of serum AMY activity increased in a time-dependent manner in cerulein-treated WT mice but remained unchanged in tfeb KO mice (Figure S9B). However, the ratio of serum vs pancreatic AMY increased dramatically in cerulein-treated tfeb KO mice compared with WT mice (Figure S9C). Together, these data suggest that deletion of tfeb in acinar cells exacerbated the pathogenesis of cerulein-induced experimental pancreatitis.
Figure 6. Acinar cell-specific tfeb knockout mice exacerbate cerulein-induced pancreatitis. BAC-Ela-Cre−; Tfebf/f (Tfebf/f) and BAC-Ela-Cre+; Tfebf/f (tfeb KO) mice were injected with tamoxifen (75 mg/kg) once a day for consecutive 5 days. Five days later after the last injection, these mice were further treated with 7-hourly injections of cerulein (20 μg/kg). (a) Representative images of H&E staining are shown. Arrows denote for acinar cells with vacuoles; arrow heads denote for infiltrated inflammatory cells, omega denotes for edema and delta denotes for necrosis. Bar: 50 μm. (b) Individual histology score was graded and data are mean ± SE (n = 3–4). *p < 0.05; **p < 0.01; One-way ANOVA analysis. (c) Representative EM images of pancreatic tissues are shown. Lower panels are enlarged photographs from the boxed areas. White arrows: autolysosome, green arrows: ZG; red arrows: ER; arrow heads: disrupted organelles. Bar: 2 µm.
tfe3 and acinar cell-specific tfeb double-knockout mice develop spontaneous pancreatitis
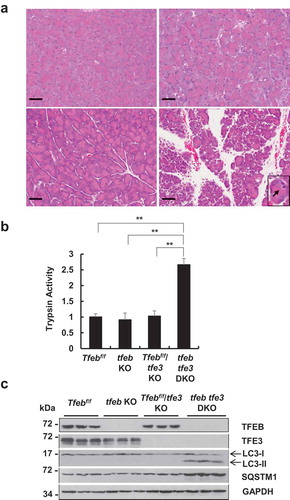
To determine whether TFE3 would compensate for the loss of TFEB and vice versa, we generated tfe3 and acinar cell-specific tfeb double-knockout (tfeb tfe3 DKO) mice. Histological analysis of H&E staining showed largely normal with only mild edema in either tfe3 KO mice or acinar cell-specific tfeb KO mice. However, tfeb tfe3 DKO mice showed typical features of pancreatitis with marked edema, increased infiltration of inflammatory cells and acinar cell vacuolization as well as increased pancreatic trypsin activities (). Immunoblotting analysis confirmed the deletion of tfe3 and tfeb in mouse pancreas with increased levels of LC3-II and SQSTM1 in tfeb tfe3 DKO mouse pancreas, suggesting a defect of removal of LC3-II and SQSTM1 likely due to the impaired TFEB- and TFE3-mediated lysosomal biogenesis (). These results indicate that tfeb tfe3 DKO mice develop spontaneous pancreatitis, suggesting a possible reciprocal compensatory role of TFEB and TFE3 in pancreas.
Figure 7. Increased fibrosis, MPO staining and TUNEL-positive cells in cerulein-treated acinar cell-specific tfeb knockout mice. BAC-Ela-Cre−; Tfebf/f (Tfebf/f) and BAC-Ela-Cre+; Tfebf/f (tfeb KO) mice were injected with tamoxifen (75 mg/kg) once a day for consecutive 5 days. Five days later after the last injection, these mice were further treated with 7-hourly injections of cerulein (20 μg/kg). (a) Representative images of Sirius Red staining (fibrosis), MPO staining (for neutrophils, arrows) and TUNEL staining (DNA fragmentation, arrow heads) are shown. Bar: 50 μm. (b) Sirius Red staining-positive areas, MPO and TUNEL-positive cells from (a) were quantified. Data are mean ± SE (n = 3–5). **p < 0.01; One-way ANOVA analysis.
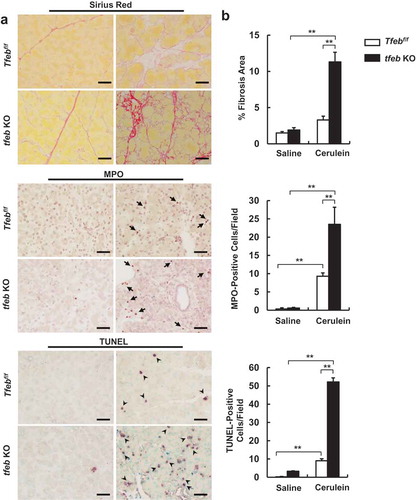
Figure 8. tfe3 and acinar cell-specific tfeb double-knockout (DKO) mice develop spontaneous pancreatitis. BAC-Ela-Cre−; Tfebf/f (Tfebf/f), BAC-Ela-Cre+; Tfebf/f (tfeb KO), BAC-Ela-Cre−; Tfebf/f tfe3 KO (Tfebf/f tfe3 KO) and BAC-Ela-Cre+; Tfebf/f tfe3 KO (tfeb tfe3 DKO) mice were injected with tamoxifen (75 mg/kg) once a day for consecutive 5 days and these mice were sacrificed 5 days later after the last injection of tamoxifen. (a) Representative images of H & E staining of Tfebf/f, tfeb KO, Tfebf/f tfe3 KO and tfeb tfe3 DKO mice are shown. Bar: 50 μm. (b) Pancreatic trypsin activity was measured. Data shown are mean ± SE (n = 3–4). **p < 0.01; One-way ANOVA analysis. (c) Total pancreatic lysates were subjected to Immunoblotting analysis.
Decreased nuclear TFEB in pancreatic acinar cells is associated with human pancreatitis
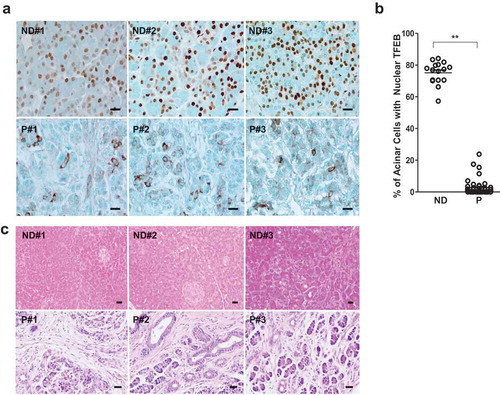
To determine whether impaired TFEB in mouse experimental pancreatitis that we observed would also occur in human pancreatitis, we performed immunohistochemistry staining for TFEB in pancreatic tissues from normal healthy donors and patients with chronic pancreatitis that we obtained from the Liver Center of KUMC and US Biomax. We found that TFEB mainly localized in the nuclei of acinar cells in normal human pancreatic tissues but TFEB largely displayed a cytosolic pattern in acinar cells of human pancreatitis tissues (). Increased SQSTM1 staining was also evident in pancreatitis tissues compared with normal pancreatic tissues (Figure S10A), likely reflecting the insufficient lysosome-mediated degradation similar to cerulein-treated mice ( and Figure S7). H&E staining revealed increased infiltration of inflammatory cells and ductal reactions in pancreatic tissues from pancreatitis patients (), confirming the typical features of chronic pancreatitis. These data suggest that decreased nuclear TFEB is associated with the human pancreatitis.
Figure 9. Decreased acinar cell nuclear TFEB staining in human pancreatitis samples. (a) Representative images of TFEB immunohistochemistry staining in normal donor (ND) and pancreatitis patients (P) tissues are shown. Bar: 20 μm. (b) The number of cells with nuclear TFEB staining were counted in each group (N = 16 for ND; n = 45 for P). Data are mean ± SE and at least 6 images were counted in each sample. **: p < 0.01 by Student t test. (c) Representative H&E staining images of pancreas from ND and P are shown. Numbers of 1, 2, 3 represent 3 different human samples. Bar: 20 μm.
Discussion
In the present study, we found that cerulein decreased TFEB proteins and TFEB-mediated lysosomal biogenesis, resulting in decreased lysosome numbers and insufficient autophagic flux in mouse pancreas. Genetic deletion of tfeb specifically in acinar cells in mice exacerbated cerulein-induced experimental pancreatitis. Mice with double deletion of tfe3 and acinar cell tfeb develop spontaneous pancreatitis. Moreover, we found that decreased nuclear TFEB in acinar cells is associated with human pancreatitis.
TFEB is a basic helix-loop-helix leucine zipper transcription factor, which binds specifically to a 10-bp (GTCACGTGAC) motif, also called CLEAR motif, found in the promoter regions of many genes encoding for lysosomal biogenesis and autophagy [Citation11]. In response to conditions that have high autophagy demand, TFEB coordinates an efficient transcription program to upregulate genes involved in lysosomal biogenesis to meet the needs of autophagy. At least three kinases, including MAPK1, MTORC1 and PRKCβ (protein kinase Cβ), regulate TFEB functions by phosphorylating TFEB [Citation12]. MAPK1 phosphorylates TFEB at Ser142 whereas MTORC1 phosphorylates TFEB at Ser142, Ser211 and Ser122, leading to cytosolic retention and proteasomal degradation of TFEB [Citation11,Citation12,Citation19]. In contrast, PRKCβ induces phosphorylation of Ser461, Ser466, and Ser468, which stabilizes and activates TFEB [Citation20]. We found that cerulein increased the levels of phosphorylated MAPK in all the time points that we assessed in mouse pancreas. However, pharmacological inhibition of MAPK by SCH772984 had very minimal effects on cerulein-induced TFEB degradation and pancreatitis despite SCH772984 markedly inhibited ceruein-induced MAPK activation. It has been reported that cholecystokinin can activate MTOR at the early time points (1 h) to promote pancreatic growth [Citation21]. In the present study, we found that cerulein increased the levels of phosphorylated RPS6 in all the time points and increased the levels of phosphorylated MTOR at 3 h, which is consistent with the activation of MTOR as previously reported [Citation21]. To our surprise, the levels of phosphorylated EIF4EBP1, another substrate protein that is generally also phosphorylated by MTOR, decreased dramatically by cerulein. Currently we still do not understand why the levels of phosphorylated RPS6 and EIF4EBP1 were not consistent in response to cerulein treatment in mouse pancreas. It is likely that other kinases in addition to MTOR may also phosphorylate RPS6 and EIF4EBP1. Indeed, MTOR-independent phosphorylation of EIF4EBP1 has been reported in colorectal cancer cells [Citation22]. Future studies are needed to identify the unknown kinase(s) that phosphorylates EIF4EBP1 in pancreas. Nevertheless, Torin 1 rescued cerulein-induced decrease of TFEB protein and pancreatic damage partially despite it only inhibited 40% of cerulein-induced MTOR activation in mouse pancreas. It is likely that a more potent MTOR inhibitor in the pancreas (if available) may be able to recover TFEB to a higher level and in turn offer better protection against cerulein-induced pancreatitis. Collectively, these data would support that MTOR but not MAPK activation plays a more important role in cerulein-induced TFEB degradation and pancreatitis.
Three observations in our present study support that cerulein-induced decreased pancreatic TFEB protein is most likely mediated by the proteasomal degradation. First, cerulein markedly increased proteasome activities in mouse pancreas. Second, cerulein activated MTOR and increased the levels of phosphorylated TFEB. Third, inhibition of MTOR or proteasome partially rescued cerulein-induced TFEB degradation. Phosphorylated TFEB has been shown to be ubiquitinated by an E3 ligase STUB1 (STIP1 homology and U-box containing protein 1) and degraded by proteasome [Citation23]. Whether cerulein also activated STUB1 and contributed to TFEB degradation in pancreas needs to be further studied. Inhibition of proteasome protects against experimental pancreatitis has been recently reported, which is generally thought that proteasome inhibitors may have anti-inflammatory effects by blocking NFκB activation [Citation24,Citation25]. In addition to inhibiting NFκB, our data suggest that activation of TFEB could be another important mechanism in protection against pancreatitis by proteasome inhibitors. However, it is highly likely that other mechanisms could also be involved in the protection against pancreatitis because many various proteins are accumulated after proteasome inhibition.
The macromolecular 26S proteasome is a multicatalytic protease complex responsible for the degradation of intracellular ubiquitinated proteins. The proteasome complex is mainly composed of the 20S core particle and a 19S regulatory particle. How cerulein rapidly increased the pancreatic proteasome activities is currently unclear. A previous study showed that genetic activation of MTORC1 by deletion of TSC1 (tuberous sclerosis complex 1) led to the activation of the transcription factor NFE2L1/NRF1 (nuclear factor, erythroid 2 like 1), which promoted the expression of proteasome genes [Citation26]. However, cerulein-induced proteasome activation is very rapid within an hour and it is unlikely that NFE2L1-mediated transcription would be responsible for the increased proteasome activity in such a short time. Future work is needed to determine whether cerulein would promote the assembly of proteasome components to increase proteasome activity in acinar cells.
Perhaps another intriguing finding in our present study was after the remarkable degradation of various proteins including TFEB at 1 h of cerulein treatment, most proteins recovered at 3 and 7 h of cerulein treatment except TFEB. The mechanisms behind these observations are currently unclear. However, the decrease of cerulein-induced proteasome activation at 3 and 7 h together with increased phosphorylated RPS6 that could enhance protein translation, which may contribute to the recovery of these proteins that were degraded at 1 h. Since TFEB promotes its own transcription, the early degradation of TFEB may impair the late phase of re-synthesize of new TFEB, which may explain why other proteins recovered at the late phase of cerulein treatment but not TFEB.
Dysfunctional and abnormal autolysosomes or lysosomes manifest as large vacuoles that contain undegraded or partially degraded contents is a common feature of pancreatitis in humans [Citation1,Citation2]. More recently, impaired autophagic flux has been observed in many experimental models of pancreatitis [Citation8,Citation27,Citation28]. In addition, several genetic animal models that have defects in autophagy also show the development of pancreatitis in these mice. For instance, pancreas-specific deletion of atg5 or atg7 using Ptf1a-cre or Pdx-Cre or whole body lamp2 KO mice have impaired autophagy and these mice all develop spontaneous pancreatitis [Citation7,Citation8,Citation28]. These data clearly support a protective role of autophagy against the pathogenesis of pancreatitis. However, it should be noted that Ptf1-or Pdx-cre can delete atg5 or atg7 in both endocrine and exocrine cells in pancreas. To achieve a higher deletion efficiency and specificity to acinar cells, we generated acinar cell-specific tfeb KO mice by crossing Tfeb flox/flox mice with BAC-Ela-CreErt transgenic mice that express Cre-ERT driven by the Cela1 (chymotrypsin-like elastase family, member 1) promoter region on the bacterial artificial chromosome (BAC) transgene. Unlike the pan-pancreas atg5 and atg7 KO mice and whole body lamp2 KO mice, acinar cell-specific tfeb KO mice only have mild changes of pancreas histology and serum AMY and lipase levels compared with their matched WT mice. However, acinar cell-specific tfeb KO mice showed more severe pathology of pancreatitis in response to cerulein treatment compared with the WT mice. These data clearly suggest that loss of TFEB sensitizes the mice to the insult of cerulein, and cerulein may activate multiple mechanisms to induce pancreatitis in addition to impaired TFEB.
One intriguing finding in our present study was that tfeb KO mice were more susceptible to cerulein-induced pancreatitis based on the histological analysis, but tfeb KO mice had lower pancreatic and blood AMY activities than WT mice after cerulein treatment. However, cerulein-treated tfeb KO mice have fewer acinar cells with markedly decreased ZGs than WT mice. This could explain why the serum levels of AMY did not increase in cerulein-treated tfeb KO mice. Nevertheless, increased pancreatic trypsin activities and the increased ratio of serum AMY vs pancreatic AMY in cerulein-treated tfeb KO mice support the conclusion that tfeb KO mice are more susceptible to pancreatitis. TFEB belongs to the microphthalmia-associated transcription factor (MIT-TFE) family of transcription factors that have four members: MITF, TFEB, TFE3 and TFEC [Citation29]. All of the four MIT-TFE transcription factors bind to consensus DNA sequences in the promoter region of target genes (CLEAR motif). However, results from the genetic KO mice of each of these transcription factors indicate they may also have distinctive functions in addition to their overlapping regulation of gene expression [Citation29]. Our recent data also showed TFE3 could compensate for the loss of TFEB in regulating lysosomal biogenesis in liver-specific tfeb KO mice [Citation18]. Therefore, the lack of obvious phenotype and changes in acinar-specific tfeb KO mice could also be likely due to the compensatory effects of other MIT-TFE members at the basal conditions. Indeed, this notion is further supported by our observation that the tfeb tfe3 DKO mice developed spontaneous pancreatitis.
Multiple mechanisms may account for the protective effects offered by autophagy and TFEB activation against the pathogenesis of pancreatitis. In acinar cells, fragile ZGs can be removed by autophagy to avoid intracellular activation of trypsinogen and subsequent pancreatitis, a process termed as zymophagy [Citation4]. Large autolysosomes that enveloped with ZGs in cerulein-treated pancreas that we found in EM studies may support the notion that autophagy may help to attenuate pancreatic injury by directly removing damaged fragile ZGs. How zymophagy selectively recognizes and removes fragile ZGs and whether zymophagy also requires the known autophagy receptor proteins such as SQSTM1, OPTINEURIN etc remain to be studied. In addition to removal of ZGs, excess endoplasmic reticulum (ER) can also be removed via autophagy that is termed reticulophagy [Citation30,Citation31]. Acinar cells have abundant ER to meet the high demand of protein synthesis. The accumulation of aberrant and whorl-like ER membranes in cerulein-treated pancreatic acinar cells is likely due to the impaired TFEB-mediated insufficient autophagy. Whether reticulophagy would contribute to the pathogenesis of pancreatitis needs to be further studied in the future.
Another consequence of impaired autophagy and lysosomal degradation is the accumulation of SQSTM1 in pancreas. SQSTM1 is a multiple domain scaffold protein that plays roles in cell survival, cell death and antioxidant stress response [Citation32–Citation34]. SQSTM1 promotes the activation of NFκB via interacting with TRAF6, leading to increased production of inflammatory cytokines/chemokines. SQSTM1 accumulation also promotes ER stress and, furthermore, deletion of sqstm1 attenuates pancreatitis in pan-pancreas atg7 KO mice [Citation28]. Accumulation of SQSTM1 also leads to the activation of NFE2L2/NRF2 (nuclear factor, erythroid 2 like 2), a key transcription factor that regulates the expression of various antioxidant and drug metabolism genes [Citation33,Citation34]. We previously showed that persistent activation of NFE2L2 promotes liver injury, fibrosis and tumorigenesis in liver-specific atg5 KO mice [Citation35]. However, the role of SQSTM1 and NFE2L2 activation in cerulein-induced pancreatitis and human pancreatitis are largely unknown. Future work is needed to further elucidate the role of SQSTM1 and NFE2L2 in experimental and human pancreatitis.
In conclusion, we found that TFEB-mediated lysosomal biogenesis is impaired in cerulein-induced experimental pancreatitis, which is associated with human pancreatitis. Impaired TFEB is likely mediated by MTORC1 activation and subsequent proteasomal degradation. Genetic deletion of tfeb in mouse acinar cells exacerbated cerulein-induced pancreatitis and mice with double deletion of tfeb and tfe3 develop spontaneous pancreatitis. Therefore, targeting TFEB-mediated lysosomal biogenesis may be a beneficial approach for preventing and treating pancreatitis.
Materials and methods
Animal models of pancreatitis
GFP-LC3 transgenic mice were generated by Dr. Noboru Mizushima (University of Tokyo, Japan) and purchased from RIKEN (Wako, Japan). Acute cerulein pancreatitis was induced as described previously [Citation14]; 8–12 week old male C57BL/6J GFP-LC3 or C57BL/6J WT mice received 7 hourly intraperitoneal injections of 50 μg/kg cerulein (Sigma Aldrich, C9026). Control mice received similar injections of saline. For some experiments, one dose of chloroquine (CQ, 60 mg/kg, i.p.; Sigma Aldrich, C6628) or Torin 1 (2 mg/kg, i.p.; Tocris Bioscience, 4247) was given right before the first injection of cerulein. For MAPK inhibition experiments, SCH772984 (25 mg/kg, i.p.; Sigma Aldrich, ADV465749270) was given every other hour for a total of 4 injections right before cerulein injections. For proteasome inhibition experiments, the mice were pretreated with bortezomib (1 mg/kg, i.p.; Selleck Chemicals, S1013) overnight followed a second booster treatment 1 h before one dose of cerulein treatment. All mice were sacrificed 1 h after the last injection of cerulein. Pancreas injury was determined by measuring serum AMY and lipase activities using commercial kits (Pointe Scientific Inc, A7564 and L7503-40) according to the manufacturer’s instructions. All procedures were approved by the Institutional Animal Care and Use Committee of the University of Kansas Medical Center.
Choline-deficient, ethionine-supplemented (CDE) diet-induced pancreatitis
CDE diet pancreatitis was induced as described previously [Citation36]. Briefly, 5-weeks-old CD-1 mice received CDE diet every 12 h in 3-g aliquots and food intake was measured. At every feeding, the CDE diet was supplemented with 0.5% ethionine. Mice were sacrificed 48 h after the initiation of the diet.
Generation of pancreatic acinar cell-specific tfeb KO mice and tfeb tfe3 DKO mice
Tfeb flox/flox (tfebf/f) mice were generated as described previously [Citation10,Citation37] and crossed with BAC-Ela-CreErT transgenic mice (The Jackson Laboratory, 025736) to generate tamoxifen-inducible pancreatic acinar cell-specific tfeb KO mice. Tamoxifen-inducible Cre-ErT was activated by intraperitoneal injection of 75 mg/kg tamoxifen (Sigma Aldrich, T5648) to 8-weeks-old mice for 5 days. Cre-negative littermates also received same tamoxifen treatment as above described and served as controls. Mice were further treated with the cerulein model.
tfe3 KO mice were generated as described previously [Citation38] and obtained from Dr. David Fisher (Harvard Medical School, Boston, MA, USA). tfe3 KO mice were crossed with the BAC-Ela-Cre+, Tfebf/f mice to generate tfeb tfe3 DKO mice.
Human samples
Consent, corresponding case reports, and sixteen healthy human donors were facilitated and provided by the KUMC Liver Center in a de-identified manner. Forty-five de-identified chronic pancreatitis samples were purchased from US Biomax Inc (BBS14011).
Preparation of tissue lysate, cellular fractionation and immunoblot analysis
Frozen pancreatic tissues were sonicated on ice in RIPA buffer supplemented with protease inhibitor cocktail. Lysates were centrifuged for 30 minutes at 12,500 g and supernatants were collected and stored at −80°C. Nuclear and cytoplasmic fractions of pancreas tissue were prepared by using a commercial kit (Thermo scientific, 78835). Protein (30 μg) was separated by 10 ~ 12% SDS-PAGE gel before transfer to a PVDF membrane. Membranes were probed using appropriate primary and secondary antibodies and developed with SuperSignal West Pico chemiluminescent substrate (Life Technologies, 34080).
Antibodies
The antibodies used for this study were: ACTB (Sigma Aldrich, A5441), AMY/AMYLASE (Sigma Aldrich, A8273), EIF4EBP1 (Cell Signaling Technology, 9452), FOXO1 (Cell Signaling Technology, 2880), GAPDH (Cell Signaling Technology, 2118), GFP (Santa Cruz Biotechnology, sc-9996), LMNA (Cell Signaling Technology, 2032), LAMP1 (Developmental Studies Hybridoma Bank, 1D4B), MAPK (Cell Signaling Technology, 9102), MCL1 (Rockland Immunochemicals, 600–401-394), MPO (Biocare Medical, PP023AA), MTOR (Cell Signaling Technology, 2972), phos-EIF4EBP1 (Cell Signaling Technology, 9451), phos-MAPK (Cell Signaling Technology, 9101), phos-MTOR (Cell Signaling Technology, 2971), phos-TFEB (Millipore, ABE1971), phos- RPS6 (Cell Signaling Technology, 4858), PPARGC1A/PPARGC1α (Abnova, PAB12061), RPS6 (Cell Signaling Technology, 2217), SQSTM1 (Abnova, H00008878-M01), TFE3 (Sigma Aldrich, HPA023881) and TFEB (Bethyl Laboratories, A303-673A). Antibodies for ATP6V1A and ATP6V1B2 are gifts from Dr. Dennis Brown (Harvard Medical School). The anti-LC3 antibody was generated as previously described [Citation39]. HRP-conjugated goat anti-mouse (115–035-062), HRP-conjugated goat anti-rabbit (111–035-045), DyLight 549 goat anti-mouse (115–505-146), CY3-conjugated goat anti-rabbit (111–165-144) and CY3-conjugated goat anti-rat (112–165-143) secondary antibodies were from Jackson ImmunoResearch.
RNA isolation and real-time qPCR
RNA was isolated from mouse pancreas using TRIzol reagent (Thermo Fisher Scientific, 15596–026) and was reverse-transcribed into cDNA using RevertAid Reverse Transcriptase (Thermo Fisher Scientific, EP0442). qPCR was performed using SYBR Green chemistry (Bio-Rad Laboratories, 1725124). Primer sequences (5ʹ – 3ʹ) for primers used in qPCR are: Tfeb F: CCAGAAGCGAGAGCTCACAGAT, Tfeb R: TGTGATTGTCTTTCTTCTGCCG; Ppargc1α F: ATGTGTCGCCTTCTTGCTCT, Ppargc1α R: ATCTACTGCCTGGGGACCTT; Atp6v1d F: GAGCACAGACTGGTCGAAA, Atp6v1d R: AGCTGTCAGTTCCTTCGTGG; Atp6v1h F: ATGAGTACCGGTTTGCCTGG, Atp6v1h R: GACTGAATGCCAGGAGCCAT; Rn18s F: TAGAGGGACAAGTGGCGTTC, Rn18s R: CGATGAGCCAGTCAGTGT. Lc3b F: CCGAGAAGACCTTCAAGCAG; Lc3b R: ACACTTCGGAGATGGGAGTG; Sqstm1 F: AGAATGTGGGGGAGAGTGTG; Sqstm1 R: TCGTCTCCTCCTGAGCAGTT.Real-time qPCR results were normalized to Rn18s and expressed as fold over saline group.
Immunostaining and confocal microscopy
Immunostaining for LAMP1 and TFEB was performed on pancreatic tissue cryosections. Images were acquired using a Leica TSC SPE confocal microscope with a 63x objective (Leica, Mannheim, Germany). Nuclei were counterstained with Hoechst33342 (Thermo Fisher Scientific, H3570). GFP-LC3- and LAMP1-positive puncta were quantified by ImageJ (http://imagej.nih.gov/ij/). Images were first converted to 8-bit format, after adjusting the threshold, applied ‘Analyze particles’, the positive puncta had higher intensity than the threshold were counted. The number of positive puncta then divided by the nuclei number to get positive puncta per cell. To assess the intensities of colocalization of two proteins, ImageJ colocalization plug-in software was used (http://imagej.nih.gov/ij/).
Histology and immunohistochemistry
Paraffin-embedded pancreas sections were stained with hematoxylin and eosin (H&E) and immunostaining for MPO and TFEB. Sirius red staining was conducted with Direct red 80 (Sigma-Aldrich, 365548). Terminal deoxynucleotidyl transferase dUTP nick end labeling (TUNEL) staining was performed as we described previously [Citation40]. Images were taken using a Nikon Eclipse Ni microscope (Nikon, Tokyo, Japan).
20S proteasome activity
Total 15 μg pancreas lysates were used for 20S proteasome activity analysis using Suc-LLVY-AMC substrate (Enzo Life Sciences, BML-P802-0005) as we described previously [Citation41]. Briefly, 15 μg pancreas lysates were diluted in 5 μl of RIPA buffer and added to Corning 96-well white flat bottom plate. A total of 95 μl of assay buffer containing 50 mM Tris (Sigma Aldrich, T1503) pH 7.5, 25 mM KCl (Sigma Aldrich, P9541), 10 mM NaCl (Amresco, 0241), and 1 mM MgCl2 (Sigma Aldrich, M8266) diluted in dH2O along with Suc-LLVY-AMC substrate (final concentration 65 μM) were added to each well. Proteasome activity was determined by measuring AMC release using an excitation/emission 380/460 test filter on a Tecan plate reader at 1 h. Data were expressed as fold of control.
Trypsin activity
Trypsin activity was measured in pancreatic tissue homogenates by fluorimetric assay as described previously [Citation42]. Briefly, pancreas tissues were homogenized using a tight Teflon glass homogenizer in ice-cold buffer containing 5 mM MES (Sigma Aldrich, M3671), pH 6.5, 1 mM MgSO4 (Sigma Aldrich, M7506), 250 mM sucrose (Sigma Aldrich, S7903). The homogenates were added to the assay buffer containing 50 mM Tris-HCl, pH 8.0, 150 mM NaCl, 1 mM CaCl2 (Sigma Aldrich, C4901), 0.1 mg/mL bovine serum albumin (Sigma Aldrich, A3803). The reaction was initiated by incubating with a specific trypsin substrate, Boc-Gln-Ala-Arg-AMC (Enzo Life Sciences, BML-P237-0005), which is converted to a fluorescent product by trypsin. The product was excited at 380 nm and emitted at 440 nm using Tecan plate reader and was followed for 6–10 min. Data were expressed as fold of control.
Toluidine blue staining
Small pancreas specimens were fixed in 2.5% glutaraldehyde followed with 1% OsO4 for 1 h. After dehydration, the specimens were embedded in epoxy resin. Thin sections (1 μm) were cut and stained with 1% toluidine blue buffer. Images were taken using Nikon Eclipse Ni microscope (Nikon, Tokyo, Japan).
Electron microscopy
Tissues were fixed with 2% glutaraldehyde in 0.1 M phosphate buffer, pH 7.4 followed by 1% OsO4. After dehydration, thin sections were stained with uranyl acetate and lead citrate for observation under a JEM 1016CX electron microscope (JEOL). Images were acquired digitally.
Statistical analysis
All experimental data were expressed as mean ± SE and subjected to One-way ANOVA analysis with Bonferroni post hoc test or Student’s t-test where appropriate. p < 0.05 was considered significant.
Author contributions
W.X.D designed the research, analyzed data and wrote the manuscript. S.W., H.M.N., X.J.C., H.W., O.M., A.G. performed experiments and analyzed data. R.C.D. assisted the isolation of mouse acinar cells. A.B. and P.P. assisted the mouse models. B.B., S.K. and T.S. collected the human samples and assisted the human studies.
Supplemental Material
Download Zip (1 MB)Acknowledgments
The authors would like to thank Drs. David Fisher and Dennis Brown from Harvard Medical School for providing tfe3 KO mice and ATP6V1A and ATP6V1B2 antibodies. We wish to acknowledge the University of Kansas Medical Center Electron Microscopy Research Lab facility for assistance with the TEM. The EMRL is supported in part, by NIH COBRE grant 9P20GM104936. The JEOL JEM-1400 TEM used in the study was purchased with funds from NIH grant S10RR027564.
Disclosure statement
No potential conflict of interest was reported by the authors.
Supplementay material
Supplemental data for the article can be accessed here.
Additional information
Funding
References
- Pandol SJ, Lugea A, Mareninova OA, et al. Investigating the pathobiology of alcoholic pancreatitis. Alcohol Clin Exp Res. 2011 May;35(5):830–837. PubMed PMID: 21284675; PubMed Central PMCID: PMCPMC3083481.
- Gukovsky I, Pandol SJ, Mareninova OA, et al. Impaired autophagy and organellar dysfunction in pancreatitis. J Gastroenterol Hepatol. 2012 Mar;27 Suppl 2:27–32. PubMed PMID: 22320913; PubMed Central PMCID: PMCPMC3281514.
- Gukovskaya AS, Gukovsky I. Autophagy and pancreatitis. Am J Physiol Gastrointest Liver Physiol. 2012 Nov 1;303(9):G993–G1003. PubMed PMID: 22961802; PubMed Central PMCID: PMCPMC3517664.
- Grasso D, Ropolo A, Lo Re A, et al. Zymophagy, a novel selective autophagy pathway mediated by VMP1-USP9x-p62, prevents pancreatic cell death. J Biol Chem. 2011 Mar 11;286(10):8308–8324. PubMed PMID: 21173155; PubMed Central PMCID: PMCPMC3048716.
- Klionsky DJ, Emr SD. Autophagy as a regulated pathway of cellular degradation. Science. 2000 Dec 1;290(5497):1717–1721. PubMed PMID: 11099404; PubMed Central PMCID: PMCPMC2732363.
- Mizushima N, Levine B, Cuervo AM, et al. Autophagy fights disease through cellular self-digestion. Nature. 2008 Feb 28;451(7182):1069–1075. PubMed PMID: 18305538; PubMed Central PMCID: PMCPMC2670399.
- Mareninova OA, Sendler M, Malla SR, et al. Lysosome associated membrane proteins maintain pancreatic acinar cell homeostasis: LAMP-2 deficient mice develop pancreatitis. Cell Mol Gastroenterol Hepatol. 2015 Nov 1;1(6):678–694. PubMed PMID: 26693174; PubMed Central PMCID: PMCPMC4673685.
- Diakopoulos KN, Lesina M, Wormann S, et al. Impaired autophagy induces chronic atrophic pancreatitis in mice via sex- and nutrition-dependent processes. Gastroenterology. 2015 Mar;148(3):626–638 e17. PubMed PMID: 25497209.
- Fortunato F, Burgers H, Bergmann F, et al. Impaired autolysosome formation correlates with Lamp-2 depletion: role of apoptosis, autophagy, and necrosis in pancreatitis. Gastroenterology. 2009 Jul;137(1):350–60, 360 e1-5. PubMed PMID: 19362087.
- Settembre C, Zoncu R, Medina DL, et al. A lysosome-to-nucleus signalling mechanism senses and regulates the lysosome via mTOR and TFEB. Embo J. 2012 Mar 7;31(5):1095–1108. PubMed PMID: 22343943; PubMed Central PMCID: PMCPMC3298007.
- Settembre C, Di Malta C, Polito VA, et al. TFEB links autophagy to lysosomal biogenesis. Science. 2011 Jun 17;332(6036):1429–1433. PubMed PMID: 21617040; PubMed Central PMCID: PMCPMC3638014.
- Settembre C, Fraldi A, Medina DL, et al. Signals from the lysosome: a control centre for cellular clearance and energy metabolism. Nat Rev Mol Cell Biol. 2013 May;14(5):283–296. PubMed PMID: 23609508; PubMed Central PMCID: PMCPMC4387238.
- Medina DL, Di Paola S, Peluso I, et al. Lysosomal calcium signalling regulates autophagy through calcineurin and TFEB. Nat Cell Biol. 2015 Mar;17(3):288–299. PubMed PMID: 25720963; PubMed Central PMCID: PMCPMC4801004.
- Gukovskaya AS, Vaquero E, Zaninovic V, et al. Neutrophils and NADPH oxidase mediate intrapancreatic trypsin activation in murine experimental acute pancreatitis. Gastroenterology. 2002 Apr;122(4):974–984. PubMed PMID: 11910350.
- Ni HM, Bockus A, Wozniak AL, et al. Dissecting the dynamic turnover of GFP-LC3 in the autolysosome. Autophagy. 2011 Feb;7(2):188–204. PubMed PMID: 21107021; PubMed Central PMCID: PMCPMC3039769.
- Klionsky DJ, Abdelmohsen K, Abe A, et al. Guidelines for the use and interpretation of assays for monitoring autophagy (3rd edition). Autophagy. 2016;12(1):1–222. PubMed PMID: 26799652; PubMed Central PMCID: PMC4835977.
- Chao X, Ni HM, Ding WX. Insufficient autophagy: a novel autophagic flux scenario uncovered by impaired liver TFEB-mediated lysosomal biogenesis from chronic alcohol-drinking mice. Autophagy. 2018 Jul 4. PubMed PMID: 29969942. DOI:10.1080/15548627.2018.1489170
- Chao X, Wang S, Zhao K, et al. Impaired TFEB-mediated lysosome biogenesis and autophagy promote chronic ethanol-induced liver injury and steatosis in mice. Gastroenterology. 2018 May 18 PubMed PMID: 29782848. DOI:10.1053/j.gastro.2018.05.027.
- Vega-Rubin-de-Celis S, Pena-Llopis S, Konda M, et al. Multistep regulation of TFEB by MTORC1. Autophagy. 2017 Mar 4;13(3):464–472. PubMed PMID: 28055300; PubMed Central PMCID: PMCPMC5361595.
- Ferron M, Settembre C, Shimazu J, et al. A RANKL-PKCbeta-TFEB signaling cascade is necessary for lysosomal biogenesis in osteoclasts. Genes Dev. 2013 Apr 15;27(8):955–969. PubMed PMID: 23599343; PubMed Central PMCID: PMCPMC3650231.
- Crozier SJ, Sans MD, Guo L, et al. Activation of the mTOR signalling pathway is required for pancreatic growth in protease-inhibitor-fed mice. J Physiol. 2006 Jun 15;573(Pt 3):775–786. PubMed PMID: 16613881; PubMed Central PMCID: PMCPMC1779746.
- Zhang Y, Zheng XF. mTOR-independent 4E-BP1 phosphorylation is associated with cancer resistance to mTOR kinase inhibitors. Cell Cycle. 2012 Feb 1;11(3):594–603. PubMed PMID: 22262166; PubMed Central PMCID: PMCPMC3315097.
- Sha Y, Rao L, Settembre C, et al. STUB1 regulates TFEB-induced autophagy-lysosome pathway. Embo J. 2017 Sep 1;36(17):2544–2552. PubMed PMID: 28754656; PubMed Central PMCID: PMCPMC5579343.
- Letoha T, Somlai C, Takacs T, et al. The proteasome inhibitor MG132 protects against acute pancreatitis. Free Radic Biol Med. 2005 Nov 1;39(9):1142–1151. PubMed PMID: 16214030.
- Zhu Q, Lin X, Liu X, et al. Dynamic changes of proteasome and protective effect of bortezomib, a proteasome inhibitor, in mice with acute pancreatitis. Biochem Biophys Res Commun. 2018 Oct 20;505(1):126–133. PubMed PMID: 30236985.
- Zhang Y, Nicholatos J, Dreier JR, et al. Coordinated regulation of protein synthesis and degradation by mTORC1. Nature. 2014 Sep 18;513(7518):440–443. PubMed PMID: 25043031; PubMed Central PMCID: PMCPMC4402229.
- Mareninova OA, Hermann K, French SW, et al. Impaired autophagic flux mediates acinar cell vacuole formation and trypsinogen activation in rodent models of acute pancreatitis. J Clin Invest. 2009 Nov;119(11):3340–3355. PubMed PMID: 19805911; PubMed Central PMCID: PMCPMC2769194.
- Antonucci L, Fagman JB, Kim JY, et al. Basal autophagy maintains pancreatic acinar cell homeostasis and protein synthesis and prevents ER stress. Proc Natl Acad Sci U S A. 2015 Nov 10;112(45):E6166–74. PubMed PMID: 26512112; PubMed Central PMCID: PMCPMC4653219.
- Puertollano R, Ferguson SM, Brugarolas J, et al. The complex relationship between TFEB transcription factor phosphorylation and subcellular localization. Embo J. 2018 May 15 PubMed PMID: 29764979. DOI:10.15252/embj.201798804.
- Khaminets A, Heinrich T, Mari M, et al. Regulation of endoplasmic reticulum turnover by selective autophagy. Nature. 2015 Jun 18;522(7556):354–358. PubMed PMID: 26040720.
- Yang H, Ni HM, Guo F, et al. Sequestosome 1/p62 protein is associated with autophagic removal of excess hepatic endoplasmic reticulum in mice. J Biol Chem. 2016 Sep 2;291(36):18663–18674. PubMed PMID: 27325701; PubMed Central PMCID: PMCPMC5009243.
- Moscat J, Diaz-Meco MT. p62 at the crossroads of autophagy, apoptosis, and cancer. Cell. 2009 Jun 12;137(6):1001–1004. PubMed PMID: 19524504; PubMed Central PMCID: PMCPMC3971861.
- Komatsu M, Kageyama S, Ichimura Y. p62/SQSTM1/A170: physiology and pathology. Pharmacol Res. 2012 Dec;66(6):457–462. . PubMed PMID: 22841931.
- Manley S, Williams JA, Ding WX. Role of p62/SQSTM1 in liver physiology and pathogenesis. Exp Biol Med (Maywood). 2013 May;238(5):525–538. PubMed PMID: 23856904; PubMed Central PMCID: PMCPMC4096157.
- Ni HM, Woolbright BL, Williams J, et al. Nrf2 promotes the development of fibrosis and tumorigenesis in mice with defective hepatic autophagy. J Hepatol. 2014 Sep;61(3):617–625. PubMed PMID: 24815875; PubMed Central PMCID: PMCPMC4143992.
- Lu SC, Gukovsky I, Lugea A, et al. Role of S-adenosylmethionine in two experimental models of pancreatitis. FASEB J. 2003 Jan;17(1):56–58. PubMed PMID: 12424217.
- Hara T, Nakamura K, Matsui M, et al. Suppression of basal autophagy in neural cells causes neurodegenerative disease in mice. Nature. 2006 Jun 15;441(7095):885–889. PubMed PMID: 16625204.
- Steingrimsson E, Tessarollo L, Pathak B, et al. Mitf and Tfe3, two members of the Mitf-Tfe family of bHLH-Zip transcription factors, have important but functionally redundant roles in osteoclast development. Proc Natl Acad Sci U S A. 2002 Apr 2;99(7):4477–4482. PubMed PMID: 11930005; PubMed Central PMCID: PMCPMC123673.
- Ding WX, Li M, Chen X, et al. Autophagy reduces acute ethanol-induced hepatotoxicity and steatosis in mice. Gastroenterology. 2010 Nov;139(5):1740–1752. PubMed PMID: 20659474; PubMed Central PMCID: PMCPMC4129642.
- Ni HM, McGill MR, Chao X, et al. Caspase inhibition prevents tumor necrosis factor-alpha-induced apoptosis and promotes necrotic cell death in mouse hepatocytes in vivo and in vitro. Am J Pathol. 2016 Oct;186(10):2623–2636. PubMed PMID: 27616656; PubMed Central PMCID: PMCPMC5222974.
- Wang S, Ni HM, Dorko K, et al. Increased hepatic receptor interacting protein kinase 3 expression due to impaired proteasomal functions contributes to alcohol-induced steatosis and liver injury. Oncotarget. 2016 Apr 5;7(14):17681–17698. PubMed PMID: 26769846; PubMed Central PMCID: PMCPMC4951242.
- Gukovsky I, Gukovskaya AS, Blinman TA, et al. Early NF-kappaB activation is associated with hormone-induced pancreatitis. Am J Physiol. 1998 Dec;275(6 Pt 1):G1402–14. PubMed PMID: 9843778.