
ABSTRACT
We previously reported autophagic structures in rod photoreceptors expressing a misfolding RHO (rhodopsin) mutant (RHOP23H), suggesting that autophagy may play a role in degrading the mutant RHO and/or be involved in photoreceptor cell death. To further examine autophagy in normal and diseased rods, we generated transgenic Xenopus laevis tadpoles expressing the dually fluorescent autophagy marker mRFP-eGFP-LC3 in rods, which changes from green to yellow and finally red as autophagic structures develop and mature. Using transgenic lines with constitutive and inducible expression, we determined the time-course of autophagy in rod photoreceptors: autophagosomes last for 6 to 8 hours before fusing with lysosomes, and acidified autolysosomes last for about 28 hours before being degraded. Autophagy was diurnally regulated in normal rods, with more autophagic structures generated during periods of light, and this regulation was non-circadian. We also found that more autophagosomes were produced in rods expressing the misfolding RHOP23H mutant. The RHO chromophore absorbs photons to initiate phototransduction, and is consumed in this process; it also promotes RHO folding. To determine whether increased autophagy in light-exposed normal rods is caused by increased RHO misfolding or phototransduction, we used CRISPR/Cas9 to knock out the RPE65 and GNAT1 genes, which are essential for chromophore biosynthesis and phototransduction respectively. Both knockouts suppressed light-induced autophagy, indicating that although light and misfolded rhodopsin can both induce autophagy in rods, light-induced autophagy is not due to misfolding of RHO, but rather due to phototransduction.
Abbreviations: CYCS: cytochrome c; bRHOP23H: bovine RHOP23H; Cas9: CRISPR associated protein 9; dpf: days post-fertilization; eGFP: enhanced green fluorescent protein; GNAT1: guanine nucleotide-binding protein G(t) subunit alpha-1 aka rod alpha-transducin; HSPA1A/hsp70: heat shock protein of 70 kilodaltons; LAMP1: lysosomal-associated membrane protein 1; LC3: microtubule-associated protein 1A/1B light chain 3; mRFP: monomeric red fluorescent protein; RHO: rhodopsin; RP: retinitis pigmentosa; RPE65: retinal pigment epithelium-specific 65 kDa protein: sfGFP: superfolding GFP; sgRNA: single guide RNA; WGA: wheat germ agglutinin; RHOp: the Xenopus laevis RHO.2.L promoter.
Introduction
Rod photoreceptors are specialized retinal neurons responsible for visual responses under dim light conditions; they possess a unique organelle, the rod outer segment, which is a highly modified non-motile cilium consisting of thousands of stacked membranous disks surrounded by a plasma membrane [Citation1]. The disks contain very high levels of the photosensitive G-protein coupled receptor rod opsin, which is covalently coupled to a chromophore, 11-cis retinal; the complex is referred to as RHO (rhodopsin) [Citation2]. Rod photoreceptor outer segment membranes are continuously turned over, necessitating continuous production of large quantities of disk membranes and rod opsin. Absorption of a photon by the RHO chromophore is the primary event of vision, and initiates a well characterized signal transduction cascade that leads to hyperpolarization of the rod plasma membrane [Citation3]. In this process, the chromophore is converted to all-trans retinal and is released from the rod opsin protein [Citation4].
Retinitis pigmentosa (RP) is a genetic disorder involving death of rod photoreceptors [Citation5,Citation6]. Symptoms include night blindness and tunnel vision that can progress to complete blindness due to secondary death of cone photoreceptors [Citation7]. Although mutations in over 60 different genes cause RP, one of the most common causes is mutations in the RHO gene [Citation5,Citation8]. The majority of these mutations cause destabilization of the RHO molecule and defects in biosynthesis [Citation9]. Due to the very high levels of RHO expression, this results in gain of function phenotypes that likely cause cell death via overload of cellular proteostasis mechanisms [Citation10,Citation11].
The most commonly occurring cause of RP in North America is the RHO destabilizing mutation P23H [Citation5,Citation9,Citation12]. Interestingly, biosynthesis of this RHO mutant is significantly enhanced in the presence of the 11-cis retinal chromophore [Citation9,Citation13–Citation15]. Patients with this mutation often exhibit a phenotype in which the lower retina is more affected, referred to as ‘sector’ or ‘B1’ RP [Citation16]. This is hypothesized to be due to greater levels of illumination from overhead light sources [Citation17,Citation18]. Transgenic animals expressing RHOP23H exhibit retinal degeneration that is exacerbated by light [Citation19–Citation22]. These phenotypes are likely due to reduced chromophore availability in light exposed retinas, in which rod opsin and light act as a catalyst for destruction of 11-cis retinal, thereby promoting misfolding of the mutant rod opsin [Citation18].
Macroautophagy (hereafter called autophagy) is a lysosomal turnover process that degrades cytoplasmic proteins, damaged organelles and other cellular components, releasing small molecules for recycling [Citation23]. It plays essential roles in maintaining cellular homeostasis, and is a normal and conserved process in eukaryotic cells. It can be induced by nutrient or growth factor starvation and other forms of cellular stress, such as hypoxia, DNA damage, protein aggregates, and damaged organelles [Citation23]. Autophagy is one of the two major protein degradation pathways in eukaryotic cells, together with the ubiquitin-proteasome pathway, and can degrade misfolded or aggregated proteins that cannot be processed by the ubiquitin-proteasome pathway, including those associated with neurodegenerative disorders [Citation24]. Furthermore, conditional knockout experiments have demonstrated that autophagy is essential for photoreceptor survival [Citation25–Citation27].
We previously observed that autophagic structures were induced in the inner segments of rod photoreceptors expressing the misfolding-prone RHOP23H mutant [Citation28], suggesting that autophagy may be involved in degrading misfolded mutant RHO or executing rod cell death in retinitis pigmentosa. However, the role that autophagy plays in retinal degeneration is unclear; we also found that histone deacetylase inhibitors such as valproic acid ameliorated retinal degeneration associated with RHOP23H and induced autophagy in rod photoreceptors [Citation29] suggesting a possible protective effect of autophagy, while a recent study suggests autophagy may contribute to retinal degeneration [Citation30].
In order to facilitate investigation of the autophagy process in normal and diseased retina, we have now generated transgenic X. laevis frogs expressing a standard marker of autophagy, mRFP-eGFP-LC3 [Citation31], in rod photoreceptors, driven by either a RHO promoter [Citation32,Citation33], or an inducible HSPA1A promoter [Citation34]. Here we report that these animals allow us to visualize autophagic flux, and to monitor light-induced induction of autophagy in photoreceptors. We determined that this induction was non-circadian, and requires chromophore and an intact phototransduction cascade. We found that photoreceptors can degrade RHO by autophagy, and that expression of misfolded RHOP23H induces increases in autophagy via a mechanism that is distinct from light exposure.
Results
Development of transgenic X. laevis reporter lines
To study autophagy in rod photoreceptors, we established transgenic X. laevis lines expressing the dually fluorescent autophagy marker mRFP-eGFP-LC3 [Citation31]. LC3, the microtubule-associated protein 1A/1B light chain 3, is an ubiquitin-like protein conjugated to the membranes of autophagic vacuoles, and associates with autophagic membranes throughout the autophagy process [Citation23]. Two transgene constructs containing the mRFP-eGFP-LC3 cDNA linked to either the heat shock inducible HSPA1A/hsp70 promoter or the Xenopus laevis RHO.2.L promoter (RHOp, referred to as ‘XOP’ in our previous publications) were generated, and referred to as HSPA1A/hsp70p-mRFP-eGFP-LC3 and RHOp-mRFP-eGFP-LC3 respectively. X. laevis tadpoles carrying either the HSPA1A/hsp70p -mRFP-eGFP-LC3 or RHOp-mRFP-eGFP-LC3 transgenes were generated via the restriction-enzyme-mediated integration method [Citation35,Citation36]. Tadpoles were screened for fluorescence, raised to maturity, and bred with wildtype X. laevis. Two transgenic founders were identified for RHOp-mRFP-eGFP-LC3, and one founder was identified for HSPA1A/hsp70p -mRFP-eGFP-LC3.
Initial characterization of fluorescence in transgenic reporter lines
Upon induction of autophagy, the dually fluorescent LC3 marker mRFP-eGFP-LC3 is incorporated into early autophagic structures (phagophores and autophagosomes) appearing as dually fluorescent puncta in micrographs [Citation31]. In late stages, autophagsomes fuse with lysosomes and acid hydrolases destroy the acid-labile eGFP signal, while the acid-resistant mRFP signal remains, allowing tracking of the dynamic process of autophagy.
We examined retinas of animals constitutively expressing dual fluorescent LC3 in rod photoreceptor cells. Fluorescent LC3 was only observed in rods ()). There was no evidence that the transgene caused retinal degeneration in these animals. The offspring of both founders showed mosaic expression of the transgene [Citation37], such that diffuse eGFP signal was only present in a subset of rods, while other rods showed red puncta only, indicating gradual transgene silencing. Thus, individual transgene-expressing photoreceptors were easily imaged with the cellular boundary defined by the diffuse green signal; only cells with diffuse green signal present were further analyzed. In these cells, we observed abundant green, yellow and red puncta in rod inner segments ()), with a fainter diffuse green fluorescent background that also extended into the outer segment along the microtubules of the ciliary axoneme. No diffuse red mRFP signal was observed. The three categories of puncta were consistent with the previously reported slower maturation time of mRFP or dsRed relative to eGFP [Citation38,Citation39]. Previous studies have also used differences in maturation time in similar dually fluorescent proteins as a timer [Citation40], and the effect is likely fortuitously exaggerated by the relatively low (18°C) temperatures of our normal X. laevis housing. In some photoreceptors, orderly lines of puncta were observed that appeared to follow defined tracks, possibly microtubules and/or contours of the ER (Fig. S1). The diffuse green signal and puncta were consistent with LC3 transitioning from a soluble form to a membrane-associated form during autophagosome formation, while the absence of diffuse mRFP signal suggests that in rod photoreceptors LC3 is rapidly turned over by autophagic activity.
Figure 1. Initial characterization of transgenic reporter lines by confocal microscopy. (a) A retina section from a RHOp-mRFP-eGFP-LC3 transgenic X. laevis tadpole at 6 dpf. Scale bars: 100 μm. (b) Rods of RHOp-mRFP-eGFP-LC3 transgenic X. laevis tadpoles at 6 dpf . Note the presence of green puncta (green arrowhead), yellow puncta (yellow arrowhead), red puncta (red arrowhead) and the large red structure (white arrowhead) in the rod inner segment. The fainter diffuse green fluorescent background extends into the outer segment along the microtubules of the cilliary axoneme (white arrows). Rod outer segments were labeled with WGA-Alexa Fluor 647, represented by the magenta color in the confocal micrograph. Scale bars: 5 μm. (c) A retina section from a HSPA1A/hsp70p -mRFP-eGFP-LC3 transgenic tadpole euthanized without heat-shock at 6 dpf. Scale bars: 100 μm. (d) A retina section from a HSPA1A/hsp70p -mRFP-eGFP-LC3 transgenic tadpole that received a 1 h heat-shock at 6 dpf and was euthanized 24 h later. Scale bars: 100 μm. (e) Quantification of the number of autophagic structures per rod of RHOp-mRFP-eGFP-LC3 line1 and line2. The numbers of green, yellow, red and total puncta per rod were quantified respectively. Error Bars = S.E.M. The number of autophagic structures did not differ significantly between the two transgenic lines. (T-test for green, yellow, red, total puncta, P = 0.53, 0.67, 0.34, 0.54 respectively). (F) A rod expressing RHOp-mRFP-eGFP-LC3 containing a large green autophagic structure (white arrowhead) in the inner segment. Scale bars: 5 μm. (Gi) Co-localization of a large red structure with CYCS labeling (cyan). Scale bars: 5 μm. (Gii) Isolated CYCS signal. CA, cilliary axoneme; IS, inner segment; RPE: retinal pigmented epithelium; PR: photoreceptor; ONL: outer nuclear layer; INL: inner nuclear layer; GC: ganglion cell. Green: eGFP; Red: mRFP; Magenta: WGA-Alexa 647; Blue: Hoechst 33,342; Cyan: CYCS.
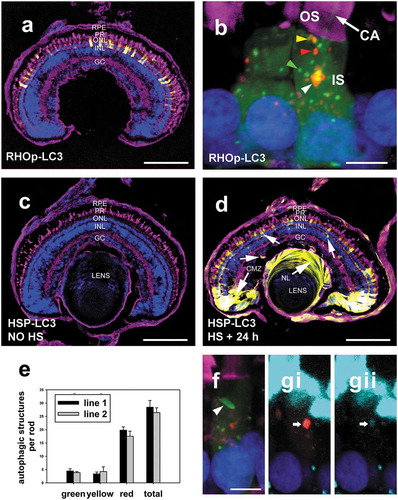
In HSPA1A/hsp70p -mRFP-eGFP-LC3 transgenic animals, expression of the dually fluorescent autophagy marker was inducible by heat shock. Prior to heat shock there was no observable expression of dually fluorescent LC3 in the retina ()); after heat shock, dually fluorescent LC3 was observed in the entire tadpole body (not shown), and abundant fluorescent LC3 expression was observed in all layers of retina ()). Interestingly, expression was particularly high in cells of the ciliary marginal zone and nucleated cells of the lens, potentially indicating more robust heat shock responses in these cell types.
The number of autophagic structures per rod photoreceptor were measured and compared between the offspring of the 2 RHOp-mRFP-eGFP-LC3 founders. The number of structures did not differ significantly between the 2 lines (). On average, 27 structures were observed per rod for animals killed after 4 h of light exposure.
In transgenic lines generated using RHOp-mRFP-eGFP-LC3, we consistently observed large fluorescent structures in rod inner segments (), F-G), which were about 3 to 6 times larger in diameter than the predominant smaller autophagic structures (1.3 to 1.7 µm vs 0.3 to 0.5 µm). These were almost exclusively red in confocal micrographs, but very rare green ()) or yellow examples were seen. Each rod normally contained a single large red structure, typically located immediately below the connecting cilium and below the mitochondria, adjacent to the microtubule organizing center, but occasionally other localizations or more than one structure were observed. To further determine the contents of these structures, we labelled them with anti-CYCS (cytochrome c, somatic) antibody, a standard marker for mitochondria, and found some minor colocalization with CYCS (Fig. 1Gi, Gii), suggesting that at least some of these large structures may be connected to the mitophagy pathway. However, as the nature of these structures was unclear, and as they comprised a small minority of the total puncta, they were excluded from subsequent analyses except where specified. This had only minor effects on the total numbers of structures counted.
Time course of autophagy in rods
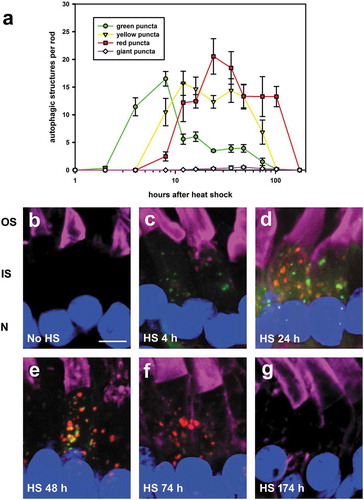
We examined the time-course of autophagy in rods using the inducible HSPA1A/hsp70p -mRFP-eGFP-LC3 line. F1 offspring were raised in cyclic light, and euthanized at regular intervals; eyes were fixed and examined by confocal microscopy. The number of autophagic structures per rod were counted and plotted for each time point (). Diffuse green signal and green puncta were first detected at 2 hours post heat-shock, indicating the minimum time required for LC3 biosynthesis, acquisition of green fluorescence, and incorporation into autophagosomes. Yellow (green and red simultaneously) puncta were detected at 8 hours, indicating mRFP maturation required a six hour delay relative to eGFP, and a few red puncta were also observed, indicating some autophagosomes fused with lysosomes and became acidified as early as 8 hours after heat shock (). Thus, autophagosomes persisted for 6 hours before starting to fuse with lysosomes and acidification, resulting in red-only puncta. Although the number of these acidified autolysosomes began to decline by 28 hours, some red puncta persisted for a considerable period of time. In contrast, the number of large red structures peaked at 48 hours after heat-shock, indicating that they form relatively slowly. The peak numbers obtained for each of the small green, yellow and red structures were similar, suggesting each matures directly into the next without co-fusion or alternate routes of removal. Finally, the lack of observable soluble red fluorescent signal () in combination with the time-course data () suggests that the lifetime of soluble LC3 in rods is less than 2 h on average.
Figure 2. Time-course of autophagy in rods. (a) Quantification of the number of autophagic structures per rod in HSPA1A/hsp70p -mRFP-eGFP-LC3 transgenic tadpoles following a 1 h heat shock initiated at T = 0. The numbers of green, yellow, red and large puncta per rod were quantified respectively at the indicated times following heat shock. Error Bars = S.E.M. N = 5 animals per group, at least 3 rods were imaged per animal. (b–g) 3D-projection confocal micrographs showing rods of HSPA1A/hsp70p -mRFP-eGFP-LC3 transgenic tadpoles euthanized either without heat-shock or at 4, 24, 48, 74 and 174 h after the heat-shock respectively. HS, heat-shock; OS, outer segment; IS, inner segment; N, nucleus. Green: eGFP; Red: mRFP; Magenta: WGA-Alexa 647; Blue: Hoechst 33,342. Scale bar: 5 μm.
Diurnal variation in autophagy
Previous reports suggest increased numbers of autophagic vacuoles under light illumination in frog photoreceptors in vitro [Citation41]. To examine how autophagy levels in X. laevis rod photoreceptors vary in vivo throughout the day, F1 RHOp-mRFP-eGFP-LC3 offspring were raised on a 12L: 12D light cycle and euthanized every 3 hours for 24 hours. Eyes were fixed and imaged by confocal microscopy.
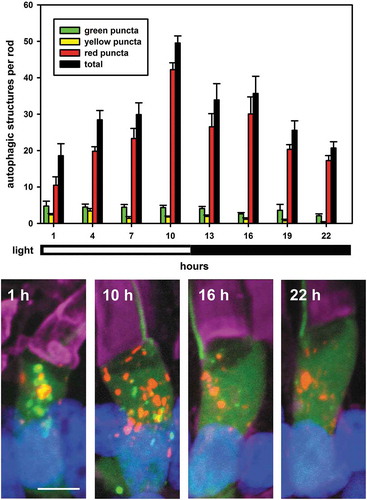
The number of autophagic structures in rod photoreceptors showed a diurnal variation with more autophagic structures generated in the light and fewer in the dark (). The number of autophagic structures started to increase at 1 h of light exposure, peaked at 10 h, and then started to decrease after 1 h of darkness (). The average number of autophagic structures per rod photoreceptor increased from 19 to 50, up to 1.6 fold, after 10 h of 1,700 lux light illumination (). This compares well with the peak value of about 36 total structures seen in , in which numbers are expected to be slightly lower due to lack of carryover of labeled structures from time points prior to T = 0. The composition of the autophagosome population also varied. An immediate increase in the number of green puncta at light onset indicated increased autophagic activity; in contrast, the number of red puncta gradually increased throughout the day, consistent with their relatively long lifespan, and always exceeded the number of green puncta. The results suggest an increase in the rate of generation of autophagic structures during light exposure, with minimal compensating increase in the rate of autophagosome processing, leading to an accumulation of structures throughout the day, until a higher equilibrium number of structures is reached. The observation of diurnal variation in the numbers of red puncta is also consistent with the observed lifetime of about 28 h () (i.e. if the lifetime was substantially longer it would mask diurnal variation in production). The large red structures were excluded from this analysis, as they did not occur in sufficient numbers for analysis, although they appeared to be relatively invariant, consistent with a slow rate of formation and long lifetime.
Figure 3. Diurnal variation of autophagy in X. laevis rods expressing RHOp-mRFP-eGFP-LC3. RHOp-mRFP-eGFP-LC3 transgenic tadpoles were raised in cyclic light and euthanized every 3 hours for 24 hours (from 12 dpf to 13 dpf). Light onset was at T = 0 h, light offset was at T = 12 h. The numbers of green, yellow, red and total puncta per rod were quantified and are indicated as green, yellow, red and black bars respectively in the chart. Error Bars = S.E.M. N ≥ 5 animals per time-point, and at least 3 rods were imaged per animal. The numbers of green, yellow, red and total puncta showed a diurnal variation, with more generated in the light and fewer in the dark. (1-way ANOVA, for green, yellow, red, total puncta, P = 0.31, 2.8 X 10⁻⁴, 2.6 X 10⁻⁸, 1.2 × 10⁻⁶ respectively; T-test: number of green puncta in the light (all time points) vs. in the dark (all time points), P = 2.1 X 10⁻²). Representative 3D projection confocal micrographs are shown below the plot. Green: eGFP; Red: mRFP; Magenta: WGA-Alexa 647; Blue: Hoechst 33,342. Scale bar: 5 μm.
Autophagy in non-transgenic animals
To determine whether autophagy in transgenic X. laevis expressing mRFP-eGFP-LC3 varied similarly to autophagy in non-transgenic siblings, a female RHOp-mRFP-eGFP-LC3 transgenic X. laevis (line 1) was mated to a non-transgenic male. Fifty percent of the resulting offspring carried the transgene. The offspring were raised in 12L: 12D light cycles. On day12-13, tadpoles were euthanized after 10 hours of light or 10 hours of darkness. Eyes were fixed and processed for electron microscopy.
The resulting electron micrographs demonstrate that transgenic X. laevis expressing mRFP-eGFP-LC3 behaved similarly to wild-type siblings; both genotypes showed more autophagic structures after 10 hours of light exposure relative to 10 hours of darkness (). Consistent with published observations that LC3 is not involved in initiation of autophagy, there was no evidence that expression of mRFP-eGFP-LC3 significantly enhanced autophagy in the transgenic animals.
Figure 4. Similar diurnal variation of autophagy in wildtype and transgenic X. laevis rods. Electron micrographs of the inner segments of rods from (a) a wildtype tadpole that was euthanized after 12 h of 1,700 lux light illumination, (b) a wildtype tadpole that was euthanized after 12 h of darkness, (c) a RHOp-mRFP-eGFP-LC3 transgenic tadpole that was euthanized after 12 h of 1,700 lux light illumination, (d) a RHOp-mRFP-eGFP-LC3 transgenic tadpole that was euthanized after 12 h of darkness. N = 2 animals per group. Autophagic structures are indicated by white arrowheads. Scale bar: 500 nm.
Diurnal variation in autophagy is due to light illumination, not circadian rhythms
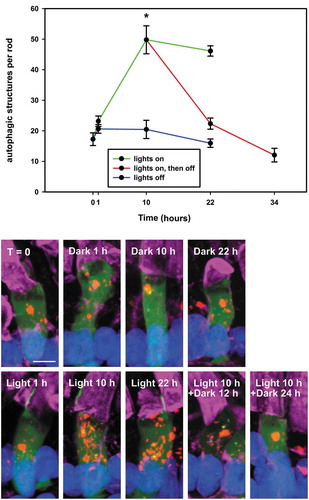
To determine whether the diurnal variation of autophagy observed in was regulated via circadian rhythms, RHOp-mRFP-eGFP-LC3 line 1 F1 offspring were raised in 12L: 12D cyclic light incubator from fertilization onwards. On day 12, a subset of tadpoles was transferred into constant darkness prior to light onset (indicated by blue line in ), a subset was transferred to darkness at 10 hours after light onset (indicated by red line at T10-T34 in ), and a third subset was transferred to constant light at 10 hours after light onset (indicated by green line at T10-T22 in ). Tadpoles were euthanized at different time points, and the numbers of autophagic structures were compared. The large red puncta were excluded from the analysis. In contrast to animals exposed to cyclic light, animals in extended dark or light conditions showed little variation in autophagy levels (), indicating that the diurnal increases and decreases in autophagy in rod photoreceptors are controlled exclusively by the level of illumination and are not influenced by circadian rhythms. Hereafter, we will call this diurnal variation ‘light-dependent autophagy’.
Figure 5. Diurnal variation of autophagy is due to light illumination, not circadian rhythms. The plot shows the average number of total autophagic structures per rod in RHOp-mRFP-eGFP-LC3 tadpoles that were transferred from cyclic light at T = 0 and euthanized at different time points and under different lighting conditions. The blue line indicates tadpoles that were transferred into constant darkness. The green line indicates tadpoles that were kept in the light. The red line indicates tadpoles that were kept in the light for 10 hours and then transferred into darkness. Error Bars = S.E.M. N ≥ 4 animals per group, at least 2 rods were imaged per animal. 10 h of light illumination resulted in significantly greater numbers of autophagic structures in tadpole rods relative to 10 h of darkness (t-test, *P = 1.1 X 10⁻³); the number of autophagic structures in tadpole rods maintained in the light did not vary significantly between T10 and T22 (t-test, P = 0.48); the number of autophagic structures in tadpole rods maintained in the dark did not vary significantly between T10 and T22 (t-test, P = 0.22). Representative 3D projection confocal micrographs are shown below the plot. Green: eGFP; Red: mRFP; Magenta: WGA-Alexa 647; Blue: Hoechst 33,342. Scale bar: 5 μm.
Autophagy induced by the misfolding RHO mutant RHOP23H
To determine whether misfolding of RHO can cause increased autophagy, we generated tadpoles co-expressing the retinitis pigmentosa-associated destabilized RHO mutant RHOP23H and dually fluorescent LC3 autophagy marker. The P23H mutation promotes instability and misfolding of RHO, and can cause retinal degeneration in many species; in many cases this degeneration is light dependent or light-exacerbated [Citation18–Citation22,Citation42]. In transgenic X. laevis, retinal degeneration caused by bovine RHOP23H (bRHOP23H) can be fully prevented by constant darkness, and is induced by light exposure [Citation15,Citation22,Citation28,Citation43,Citation44].
A RHOp-mRFP-eGFP-LC3 female frog (line 2) was mated to a heterozygous bRHOP23H male frog of a previously described lineage [Citation15,Citation22,Citation28,Citation43,Citation44]. Embryos were collected, and raised in constant darkness. At 6 dpf (days post-fertilization), tadpoles expressing the fluorescent autophagy marker were identified by mRFP/eGFP fluorescence and returned to the dark. At 10 dpf tadpoles were euthanized under dim red light (T = O), or exposed to 12 hours of 1700 lux light (T = 12 h), or 12 hours of 1700 lux light + 12 hours of darkness (one complete light cycle) (T = 24 h). Genotypes were determined by qPCR of tail tissue using bovine RHO-specific primers and a TaqMan probe. Autophagic structures were counted and compared between tadpoles expressing only endogenous RHO and tadpoles expressing bRHOP23H.
In both dark reared animals and animals euthanized after 12 hours of light exposure, we found that tadpole rods expressing bRHOP23H had higher autophagy levels than rods expressing only endogenous RHO, with 52% and 39% increase in dark and light-exposed groups respectively (), indicating that bRHOP23H expression can upregulate autophagy in rods. This is in agreement with results recently described by Yao et al. derived from mouse retina [Citation30]. We also noted that basal autophagy levels were higher in the dark reared control animals in this experiment, with minimal change in the total number of autophagic structures on light exposure; this is likely attributable to the younger age of the animals (d10 vs d13) in this group, suggesting developing photoreceptors may have higher basal levels of autophagy. However, the number of green puncta was similarly upregulated in the light exposed non-transgenic animals. Greater numbers of all types of puncta (green, yellow and red) were observed in the bRHOP23H-expressing animals (), consistent with increased autophagic flux rather than prolonged lifetimes of autophagic structures. As previously observed for this line, light exposure also induced dramatic and rapid retinal degeneration [Citation28]. The relative increase in autophagy caused by bRHOP23H expression was greater in dark-reared than in light-exposed animals, although the total number of autophagic structures was very similar, suggesting this may represent the maximal level of autophagy that can be achieved in these cells.
Figure 6. Increased autophagy in bP23H RHO-expressing rods. The chart shows the quantification of the number of autophagic structures per rod of RHOp-mRFP-eGFP-LC3 transgenic tadpoles co-expressing bRHOP23H relative to siblings expressing only endogenous RHO, euthanized under dim red light (T0) or after 12 h of 1,700 lux light exposure (T12). The numbers of green, yellow, red and total puncta per rod were quantified respectively. Error Bars = S.E.M. N = 6 animals per group, at least 3 rods were imaged per animal. Rods expressing bRHOP23H had higher autophagy levels than rods expressing only endogenous RHO at both T0 and T12. T-test, for green, yellow, red and total puncta, P = 7.4 X 10⁻³, 3.3 X 10⁻², 8.3 X 10⁻⁴, 6.8 × 10⁻⁵ respectively (T0); P = 2.3 X 10⁻², 6.4 X 10⁻², 6.8 X 10⁻², 1.6 × 10⁻² respectively (T12). * indicates P < 0.05. Representative 3D-projection confocal micrographs are shown below the plot, as well as images from a 24 h timepoint (T24). Note the presence of condensed nuclei in rods at T24 marked by white arrowheads. Green: eGFP; Red: mRFP; Blue: Hoechst 33,342. Scale bar: 5 μm.
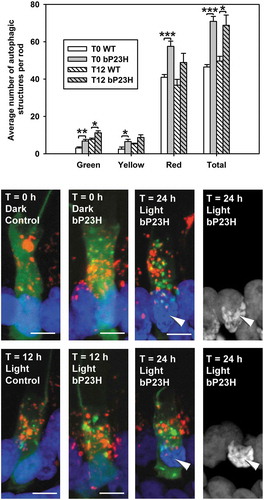
After one complete light cycle (12 hours of light + 12 hours of darkness) (T = 24 h), extensive retinal degeneration had occurred; in combination with the mosaic transgene expression, this greatly limited the number of rods expressing mRFP-eGFP-LC3 available for examination at this and further time points; therefore similar counting of structures was not attempted. The few remaining rods frequently showed abnormal nuclear morphologies indicating cell death was in progress (). Qualitatively, in comparison to other samples observed throughout this study, the autophagic structures in these rods appeared atypical, with a higher proportion of green structures and abnormally large morphologies (), suggesting either enhanced initiation of autophagy, or failure of autophagosomes to mature. These large autophagic structures were consistent with our previous electron microscopy studies [Citation28]. The results suggest that in light exposed retinas, RHO misfolding may place demands on the autophagy pathway that exceed the cells’ capacity, possibly contributing to retinal degeneration.
RHOP23H may be a target of autophagy
As expression of bRHOP23H upregulated autophagy, we wondered whether misfolded bP23H RHO protein was also degraded by autophagy. We immunolabeled cryosections from transgenic retinas co-expressing both bRHOP23H and mRFP-eGFP-LC3 with monoclonal antibody 2B2, which labels mammalian RHO, but not the endogenous amphibian RHO [Citation45]. Consistent with our previously published results [Citation22,Citation46], confocal microscopy demonstrated that bRHOP23H was diffusely distributed within rod inner segments consistent with localization to the ER (7A, arrow), and also concentrated in some structures of the secretory pathway (Fig. 7Ai-Bii, arrowheads). mRFP-eGFP-LC3-positive autophagic structures were frequently adjacent to or surrounded bRHOP23H-containing structures (Fig. 7Ai-Bii, see also Fig. S1). In apoptotic cells, there was evidence of autophagic structures forming from membranes enriched in bRHOP23H with isolated regions of green eGFP signal overlapping with regions of prominent bRHOP23H antibody labeling (), arrowhead). This is in agreement with results presented by Yao et al [Citation30] and Kaushal [Citation47] indicating RHO and RHOP23H are targets of autophagy. However, bRHOP23H signal was generally absent from mRFP-positive puncta (Fig. 7Aii, 7Bii), and did not appear to accumulate within green puncta to levels beyond what was observed elsewhere in inner segment membranes (7Ai-Bii) suggesting two possibilities: 1) bRHOP23H is not a target of autophagy or 2) the 2B2 antibody epitope is rapidly destroyed on incorporation into autophagosomes.
Figure 7. RHO targeting to the autophagy pathway. (ai,bii) Confocal micrographs showing dually transgenic photoreceptors expressing both bRHOP23H and eGFP-mRFP-LC3. (ai-aii): Photoreceptor from a dark-reared retina (T = 0). (bi-bii) Photoreceptor exposed to one light cycle (T = 24). Nuclear morphology indicates this photoreceptor is undergoing cell death. (ai,bi): Green: eGFP; Red: anti-mammalian RHO (2B2). (aii,bii): Green: mRFP, Red: anti-mammalian RHO (2B2). ai-bii: arrow indicates diffuse 2B2 labeling; arrowheads indicate regions of higher intensity 2B2 labeling. Panels Ai-Bii are also reproduced in quadruple label format in Fig. S1. (c,d): Confocal micrographs showing transgenic rod photoreceptors expressing bRHO-mRFP-sfGFP. Arrowhead indicates plasma membrane label. (e–g): Confocal micrographs showing transgenic rod photoreceptors expressing bRHOP23H-mRFP-sfGFP. Arrow indicates diffuse sfGFP signal. (h,i): Confocal micrographs showing transgenic rod photoreceptors expressing bRHO-mRFP-sfGFP (H) or bRHOP23H-mRFP-sfGFP (i) imaged under conditions that give equal green and red signals from outer segment membranes. Arrows indicate red puncta located in rod inner segments, which differ substantially in signal between the two genotypes. (c–i): Green: sfGFP Red: mRFP OS: outer segment IS: inner segment N: nucleus ONL: outer nuclear layer INL: inner nuclear layer. (Ji-Jii): Confocal micrographs showing transgenic rod photoreceptors expressing bRHOP23H-mRFP-sfGFP labeled with anti-LAMP1. Ji: Red: anti-LAMP1, Green: sfGFP. Jii: Red: mRFP, Green: anti-LAMP1. Arrows indicate sfGFP-positive structures that are negative for LAMP1. Filled arrowheads indicate mRFP-positive structures that are positive for LAMP1. Concave arrowheads indicate LAMP1-positive structures lacking both sfGFP and mRFP fluorescence. Blue: Hoechst 33,342 throughout the figure. Scale bars = 2 µm (a,b’) 5 µm (c–g and j–j’) or 20 µm (h,i).
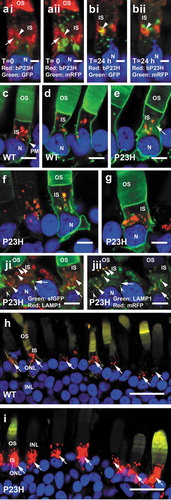
To further examine these possibilities, we constructed RHO transgenes for expression of protein fusions in which bovine RHO was dually tagged with mRFP and the GFP derivative superfolding GFP [Citation48] (sfGFP) (i.e. bRHO-mRFP-sfGFP). The design was based on that used by Jin et al. for eGFP-tagged bRHO [Citation49], with the dual tag following the bRHO C-terminal outer segment localization signal, and followed by a duplicate outer segment localization signal [Citation50]. We generated both WT and P23H variants, and expressed these in rod photoreceptors under control of the X. laevis RHO.2.L promoter (RHOp) in F0 transgenic X. laevis. For the WT variant, we observed abundant green fluorescence in rod outer segments (,d)), indicating that the fusion proteins were incorporated into disk membranes. However, prominent green fluorescence was also observed in the inner segment plasma membrane (), arrowhead), indicating that the dual tag may interfere with the outer segment localization signal, or reduce the efficiency of incorporation into disk membranes, as this localization was not previously observed with singly-tagged RHO variants [Citation37,Citation49]. Additionally, intense red-only puncta were observed in inner segments. These were similar to those obtained with the RHOp-mRFP-eGFP-LC3 transgene, and likely indicate incorporation of the fusion protein into acidified structures of the autophagic pathway that quench the sfGFP signal (,d)). Significant red fluorescence was also observed in outer segments, but imaging this signal required overexposure of the much brighter inner segment puncta (7H-I). The localization of the P23H variant was similar, but diffuse green signal was also present in the IS (), arrow) consistent with bRHOP23H localization determined by antibody labeling () arrow). As F0 animals were utilized, expression levels varied significantly between animals [Citation33,Citation45]. However, relative distributions of mRFP to sfGFP could be compared by adjusting imaging conditions such that outer segment mRFP and sfGFP signals (located where both of the fluorophores had sufficient time to mature) were similar (,i)). With outer segment signals normalized, the P23H variant showed relatively greater inner segment red puncta signals, suggesting that relative to WT, a higher proportion of RHOP23H-mRFP-sfGFP is targeted to the inner segment red puncta.
In order to confirm that the red bRHOP23H-mRFP-sfGFP puncta were located in the lysosomal degradation pathway, we also labeled retina sections with anti-LAMP1 (lysosomal-associated membrane protein 1), a lysosomal marker. In X. laevis retina, anti-LAMP1 labeling showed diffuse background labeling with brighter puncta superimposed (Fig. 7Ji, Jii). sfGFP-positive puncta were generally not LAMP1 positive (Fig. 7Ji, Jii, arrows), while mRFP-positive puncta were LAMP-1 positive (Fig. 7Ji, Jii, arrowheads). This likely indicates fusion of bRHOP23H-mRFP-sfGFP positive-puncta with lysosomes to form acidified autolysosomes, in which sfGFP fluorescence is quenched. sfGFP-positive puncta may represent early stages of autophagy, RHO transport, or both. In addition, some LAMP1-positive puncta were negative for both sfGFP and mRFP, likely representing unfused lysosomes (Fig. 7Ji, Jii, concave arrowheads).
Overall, our results suggest that RHO and RHOP23H derivatives are targets of autophagy in photoreceptor cells.
Autophagy regulation by chromophore availability
RHO is composed of the protein moiety rod opsin and the chromophore 11-cis retinal, which is responsible for absorbing photons and initiating phototransduction; 11-cis retinal is converted to all-trans retinal in this process, after which it dissociates from the opsin component [Citation2]. The chromophore can act as a pharmacological chaperone to promote the folding of P23H and wild-type rod opsins [Citation9,Citation14,Citation51]. We hypothesized that the increases in autophagy caused by bRHOP23H and light exposure may be related, because light exposure may promote misfolding of wildtype RHO by limiting chromophore availability during biosynthesis, albeit at non-pathological levels. To test this hypothesis we knocked out the genes encoding the enzyme RPE65 (retinal pigment epithelium-specific 65 kDa protein), the isomerohydrolase that is essential for chromophore regeneration [Citation52]. X. laevis have two RPE65 isoforms (RPE65.L and RPE65.S) [Citation53]. We injected Cas9 mRNA and a single guide RNA (sgRNA) that targeted both RPE65 genes into single-cell embryos derived from RHOp-mRFP-eGFP-LC3 line 1. Embryos without Cas9 and sgRNA injection served as controls. Both the knock-out and control groups were raised in 12L: 12D light cycles for 12 days and euthanized at either 12 dpf after 12 hours of light exposure or 13 dpf after 12 hours of darkness. Genomic DNA was isolated from tail tissue, and eyes were fixed, cryosectioned and examined by confocal microscopy.
We examined editing of the REP65.L and RPE65.S genes by amplifying regions of genomic DNA containing the predicted cut site by PCR, and analyzing the PCR products by Sanger sequencing. Sequencing traces showed markedly decreased sequencing fidelity just prior to the predicted cut site in samples injected with Cas9 and sgRNA ()), indicating the presence of multiple PCR products differing in size by a small number of bases. These results were consistent with our previous use of CRISPR/Cas9 in X. laevis [Citation54]. Control retinal sections showed abundant labelling in the RPE cell layer using an anti-RPE65 antibody, while the majority of animals in the sgRNA-injected group showed much fainter or no RPE65 antibody labelling ()), although knockout efficiency varied between samples. We then selected samples with no or very minimal RPE65 antibody labelling, indicating high knockout efficiency, for quantification of autophagic structures.
Figure 8. Autophagy regulation by chromophore availability. (a) Confocal micrographs showing retinal sections labeled with anti-RPE65 antibody derived from either the control animals or RPE65 knock-out animals reared in cyclic light and euthanized after either 12 h of light or 12 h of darkness. Magenta: anti-RPE65; Blue: Hoechst33,342. Scale bar: 20 μm. (b) Sanger sequence analysis of the predicted cut sites within the REP65.L and RPE65.S genes. Sequencing traces from a control animal and a RPE65 knock out animal are shown respectively. The sgRNA target (red underline), protospacer adjacent motif (green underline) and predicted cut site (blue line) are shown on the control trace. (c) Representative 3D-projection confocal micrographs showing rods from control and RPE65-knock out tadpoles euthanized after 12 h of light or 12 h of darkness. The bar chart shows the quantification of the number of autophagic structures per rod, with the black and gray bars indicating control and RPE65 knock out tadpoles respectively. N = 7 animals per group, at least 3 rods were imaged per animal. The results were significant by two-way ANOVA with P = 3.7 X 10⁻¹⁰. The effects of lighting (P = 2.2 X 10⁻⁷) and knock-out (P = 2.5 X 10⁻⁷) were both significant, as was the interaction between lighting and knockout (P = 2.1 X 10⁻⁶). Green: eGFP; Red: mRFP; Magenta: WGA-Alexa 647; Blue: Hoechst 33,342. Scale bar: 5 μm.
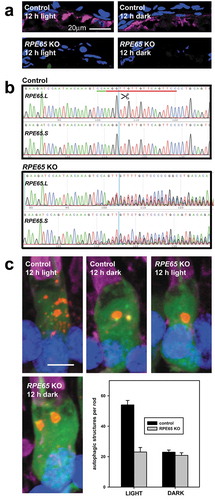
Consistent with experimental results shown in , rods of the control group showed light-dependent autophagy. We observed abundant autophagic structures in rod inner segments of tadpoles euthanized after 12 hours of light exposure, and very few autophagic structures in rods of tadpoles euthanized after 12 hours of darkness (). In the knockout group, the number of autophagy structures did not show light-dependent regulation, with low numbers of autophagic structures in both light and dark ()). The results were significant by two-way ANOVA with P = 3.7 X 10⁻¹⁰. The effects of lighting (P = 2.2 X 10⁻⁷) and knockout (P = 2.5 X 10⁻⁷) were both significant, as was the interaction between lighting and knockout (P = 2.1 X 10⁻⁶), indicating that RPE65 knockout specifically reduces autophagy in light-exposed animals. This combination of results suggests that increased autophagy in light-exposed rods is not caused by misfolding of wild-type RHO due to lack of chromophore, and instead suggests that autophagy in photoreceptors is regulated by phototransduction.
Autophagy regulation by phototransduction
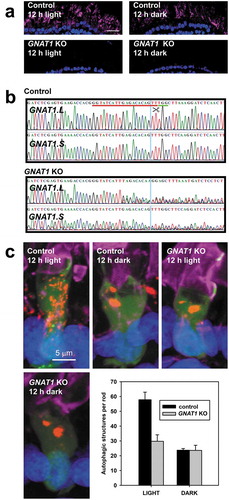
To confirm that the phototransduction cascade contributes to the regulation of autophagy in rods, we conducted a second similar experiment in which we examined the effects of knocking out the GNAT1 gene (encoding GNAT1, the alpha subunit of transducin, the heterotrimeric G-protein that mediates RHO signaling [Citation1]). Similarly, X. laevis have two GNAT1 isoforms (GNAT1.L and GNAT1.S), and we were again able to design a sgRNA that simultaneously targeted both genes, which we injected along with Cas9 mRNA into single-cell embryos derived from RHOp-mRFP-eGFP-LC3 line 1. Both the knockout and control groups were raised in 12L: 12D light cycles for 12 days and euthanized at 12 dpf after 12 hours of light exposure or 13 dpf after 12 hours of darkness. Genomic DNA was isolated from tail tissue, and eyes were fixed, cryosectioned and examined by confocal microscopy.
DNA sequence analysis showed that the sgRNA effectively targeted both GNAT1 genes ()), and immunolabeling of cryosections showed dramatically reduced GNAT1 labeling in retinas in which the GNAT1 genes were disrupted (). In these retinas, autophagy levels were low regardless of the lighting conditions at the time the animals were euthanized ()), with a reduction in autophagy levels in light-exposed animals very similar to that seen with RPE65 knockout ()). The results were significant by two-way ANOVA (P = 3.6 X 10⁻⁵). The effects of lighting (P = 9.9 X 10⁻⁵) and knockout (P = 2.6 X 10⁻³) were both significant, as was the interaction between lighting and knockout (P = 2.9 X 10⁻³), indicating that GNAT1 knockout specifically reduces autophagy in light-exposed animals. Overall, these results confirm the involvement of at least the initial steps of the G-protein coupled visual transduction cascade in the regulation of autophagy in X. laevis rod photoreceptors.
Figure 9. Autophagy regulation by phototransduction. (a) Confocal micrographs showing retinal sections labeled with anti-GNAT1 antibody (magenta) derived from either the control animals or GNAT1 knock out animals reared in cyclic light and euthanized after either 12 h of light or 12 h of darkness. Magenta: anti-GNAT1; Blue: Hoechst33342. Scale bar: 20 μm. (b) Sanger sequence analysis of the predicted cut sites within the GNAT1.L and GNAT1.S genes. Sequencing traces from a control animal and a GNAT1 knock out animal are shown respectively. The sgRNA target (red underline), Protospacer adjacent motif (green underline) and predicted cut site (blue line) are shown on the control trace. (c) Representative 3D-projection confocal micrographs showing rods of control and GNAT1-knock out tadpoles euthanized after 12 h of light or 12 h of darkness. The bar chart shows the quantification of the number of autophagic structures per rod, with the black and gray bars indicating control and GNAT1 knock out tadpoles respectively. N ≥ 5 animals per group, at least 3 rods were imaged per animal. The results were significant by two-way ANOVA with P = 3.6 X 10⁻⁵. The effects of lighting (P = 9.9 X 10⁻⁵) and knock-out (P = 2.6 X 10⁻³) were both significant, as was the interaction between lighting and knockout (P = 2.9X 10⁻³), indicating that GNAT1 knock-out specifically reduces autophagy in light-exposed animals. Green: eGFP; Red: mRFP; Magenta: WGA-Alexa 647; Blue: Hoechst 33342. Scale bar: 5 μm.
Discussion
In this study, we used expression of a fluorescent mRFP-eGFP-LC3 fusion protein to characterize autophagy in X. laevis photoreceptors in terms of time-course, light dependence, and regulatory mechanisms. We found that autophagy levels were regulated by light and misfolded RHO, with more autophagic structures generated under bright light illumination and less in dark (), and more autophagic structures generated in cells expressing a misfolding mutant RHO associated with RP (). Furthermore, we determined that light-dependent autophagy is not due to circadian rhythms (), and is mechanistically distinct from autophagy induced by misfolded RHO ( and ).
We successfully expressed fluorescent mRFP-eGFP-LC3 in X. laevis rod photoreceptors under the control of both heat shock and RHO promoters (). As expected, the fluorescent proteins had a punctate distribution that allowed us to track autophagic structures, and as previously documented, matured to red-only puncta on acidification [Citation31]. An added benefit of the X. laevis system is an exaggeration in the discrepancy between maturation times of eGFP and the dsRed derivative mRFP at low temperatures [Citation38,Citation39], which allowed us to distinguish green-only puncta as an early stage of autophagy.
Our time course experiments using mRFP-eGFP-LC3 expression under control of a heat shock promoter indicate that autophagy is highly active in rods, and has a time course compatible with diurnal regulation (), i.e. the time from production of an autophagic structure to its loss is on the order of 24 hours, while the time required for acidification of autophagosomes is approximately 6 hours. Our results parallel those of Reme et al [Citation41], who found a low ratio of new to old autophagic vacuoles at all times of the light cycle. Time-course experiments using constitutive expression of mRFP-eGFP-LC3 from a RHO promoter indicates that autophagy is diurnally regulated in rod photoreceptors, with more autophagosomes produced during periods of illumination (). This is in agreement with previous studies of amphibian retina in vitro, and mouse retina [Citation41,Citation55,Citation56]. Moreover, we demonstrate that this variation is linked to light exposure, and neither induction nor suppression of autophagy is linked to circadian rhythms (). A significant difference between our results and a previous report on autophagy in mouse retina is that we found a single peak in autophagy in a 24-hour light cycle, whereas Yao et al. [Citation57] found a second peak following light offset via western blot and eGFP-LC3-based methods. While this could easily be attributed to species-specific differences, our approaches also differ in some respects; first, it is likely that our standard light intensity (1700 lux) was significantly higher than that used in mice, and may emphasize the light-induced peak. Second, our method reports on the entire autophagy pathway, with the majority of signal derived from stages not identifiable by eGFP-LC3 fluorescence. In fact, we did observe a small increase in green puncta at T = 19 (seven hours after light offset) () that could represent a second more limited induction of autophagy, although this was not statistically significant in our analysis. Interestingly, Reme and Sulser report a single peak of autophagic activity in rat photoreceptors, which occurs 5 hours after light onset [Citation58].
Using this system, we were also able to confirm upregulation of autophagy in rod photoreceptors expressing a misfolding-prone mutant RHO that is associated with retinitis pigmentosa, in agreement with our results previously obtained by electron microscopy [Citation59]. Significantly, our results also agree with recent reports by Yao et al. [Citation30] indicating that RHOP23H induces increased autophagic flux and that RHO is a target of autophagy in mouse rod photoreceptors. These observations led us to question whether upregulation of autophagy by light and misfolded RHO share a common pathway. As it is known that the 11-cis retinal chromophore can act as a pharmacological chaperone for both RHO and RHOP23H [Citation13,Citation51], we reasoned that light exposure may deplete the supply of chromophore, causing non-pathological levels of wildtype RHO misfolding, and producing diurnal variations in autophagy in normal rods. However, our results using CRISPR-Cas9-mediated knockout of the RPE65 genes that are essential for chromophore production refute this hypothesis, and instead suggest that photoactivation of RHO is necessary for upregulation of autophagy, implicating the phototransduction pathway as the exclusive mechanism for light-dependent regulation of autophagy in rods. Moreover, because we also determined that misfolded RHO can induce autophagy via a separate pathway (), we can also conclude that light exposure does not induce significant levels of RHO misfolding in wildtype photoreceptors.
An important question is the role of regulated autophagy in rods. Increased autophagy in response to misfolded RHO could be a route for removal of the toxic misfolded proteins, or for removal of damaged biosynthetic membranes such as ER or Golgi. Results presented here () suggest that misfolded RHO is a target of autophagy, consistent with previous electron microscopy analysis indicating RHO can be targeted by autophagy [Citation60] as well as cell culture studies [Citation47]. Our previous electron microscopy analysis also indicated the presence of ER membranes in autophagosomes of photoreceptors expressing RHOP23H [Citation59]. Our results are also consistent with the hypothesis that overload of protein quality control mechanisms, including autophagy, may be a trigger for cell death caused by mutant RHO, as we did not observe significant increases in autophagic structures on exposure of bRHOP23H-expressing animals to light (), but rather impaired autophagosome maturation or inadequate autophagy, and altered morphologies associated with cell death (). With this in mind, it is interesting that recent experiments published by Yao et al. [Citation30] indicate standard enhancers of autophagy actually exacerbate retinal degeneration caused by RHOP23H in mice, while inhibiting autophagy is beneficial, possibly by enhancing degradation via the proteasome. Our own results (manuscript submitted) similarly show no benefit of the autophagy enhancer rapamycin in preventing retinal degeneration in X. laevis.
The role of regulation of autophagy by light exposure is less clear. Since it is not directly linked to an increase in need for RHO quality control, it may be linked to the presence of increased biosynthetic membrane damage caused by higher rates of outer segment disk membrane synthesis in the light [Citation61], or increased reactive oxygen species generated by light exposure [Citation62–Citation64]; however, our results indicate that autophagy is primarily regulated by the visual transduction cascade (), and not by other light dependent processes such as increased reactive oxygen, which would be unaffected by GNAT1 knockout. It is also possible that regulation of autophagy may serve more exotic purposes, such as contributing to regulation of the size of the ER, or turnover of signal transduction components such as transducin, possibly influencing photosensitivity or ameliorating toxic effects associated with these proteins, as suggested by other researchers [Citation26,Citation56]. Notably, RPE65 mutations cause recessive Leber’s congenital amaurosis, a blindness due to loss of photoreceptor light sensitivity coupled with a slow loss of photoreceptors [Citation65,Citation66]. Our studies suggest that dysregulation of autophagy is a potential cause of the retinal degeneration in these individuals.
Although we have established that light can regulate autophagy in photoreceptors independently of protein misfolding, we do not know how visual transduction signaling (an outer segment process) is communicated to the rod inner segment. Possibilities include the movement of the visual transduction components GNAT1 and GRK1/arrestin, membrane hyperpolarization, and intracellular calcium levels. However, in X. laevis GNAT1 and GRK1 migrations are transient [Citation67,Citation68], whereas the effects of light on autophagy are not (&). Calcium is reported to positively and negatively regulate autophagy in other cell types [Citation69,Citation70], and therefore is a potential second messenger candidate, although further investigations are necessary. In photoreceptors, light is known to increase levels of PtdIns3P [Citation25], which is produced by PtdIns3K and is required to initiate autophagy [Citation71]. Therefore it is likely that the regulatory mechanism begins with RHO and GNAT1 activation, and terminates with production of PtdIns3P by PtdIns3K.
Autophagy can degrade various aggregate-prone disease-causing proteins and provide neuroprotection in various animal models of neurodegenerative diseases [Citation72–Citation74]. Although these findings suggest that autophagy is a common protective mechanism in various neurodegenerative diseases, and may be a potential therapeutic target in the treatment of retinitis pigmentosa, more recent results suggest enhancing autophagy may be detrimental in retinitis pigmentosa [Citation30]. Moreover, our previous results suggest that the effects of pharmacological therapies for RP may differ dramatically between genotypes [Citation29]. Our transgenic animals will provide a useful tool for identifying pharmacological agents that promote or inhibit autophagy in amphibian rod photoreceptors in order to examine their effects in multiple transgenic X. laevis models of RP [Citation22,Citation45,Citation75], and for further investigation of protein quality control mechanisms in photoreceptors.
Materials and methods
Generation of transgenic X. laevis
The original mRFP-eGFP-LC3 sequence was amplified from the plasmid ptfLC3 (Addgene 21,074 deposited by Tamotsu Yoshimori) using primers flanked by EcoRI and NotI sites, and cloned into our standard X. laevis transgene vector RHOp0.8-2DI-eGFP-N1 [Citation36], which utilizes 0.8 kb of the X. laevis RHO.2.L promoter to drive transgene expression in rods. To generate the heat shock inducible variant, the X. laevis HSPA1A/Hsp70 heat shock promoter was obtained by PCR amplification from genomic DNA using primers based on the published sequence [Citation76], and was ligated into the same vector to replace the X. laevis RHO promoter. The bovine RHO-mRFP-sfGFP cDNA and its P23H variant (bRHOP23H) were generated by Gibson assembly [Citation77] of PCR products derived from Addgene plasmid 21,074, Addgene plasmid 54,579 (deposited by Michael Davidson), and previously described constructs containing the bRHO and bRHOP23H cDNAs [Citation22]. Phusion DNA polymerase was used for amplifications, and the final cDNAs were similarly cloned into the EcoR1 and NotI sites of RHOp0.8-2DI-eGFP-N1.
Transgenic embryos expressing the transgenes HSPA-1A/hsp70p -mRFP-eGFP-LC3, RHOp-mRFP-eGFP-LC3, RHOp-bRHO-mRFP-sfGFP or RHOp-bRHOP23H-mRFP-sfGFP were generated using the restriction-enzyme-mediated integration method [Citation78] modified as previously described [Citation36]. Fertilized embryos were kept in 10 mM NaCl, 0.2 mM KCl, 0.1 mM MgCl2, 0.2 mM CaCl2, 0.5 mM HEPES pH 7.4 (0.1 x MMR) solution with 6% ficoll and 10 mg/ml gentamycin overnight, and then transferred to 0.1 x MMR solution without HEPES. The resulting tadpoles were euthanized as described below, or raised to adulthood.
F1 tadpoles were generated by mating the primary transgenic frogs to wildtype frogs. Dual transgenic bRHOP23H/RHOp-mRFP-eGFP-LC3 animals were generated by mating RHOp-mRFP-eGFP-LC3 animals with the previously described bRHOP23H transgenic line [Citation15,Citation22,Citation28,Citation43,Citation44]. Embryos were housed in 4 L tanks in 18°C incubator on a 12 h light/dark cycle. Constant darkness was achieved by wrapping the tanks in aluminum foil, while constant light used a similar incubator with constant illumination. Animals were euthanized at 6 (stage 47), 12 (stage 49), or 13 dpf (stage 49) depending on the experiments performed. Eyes were fixed for microscopy as described below, and tails were clipped for analysis of genomic DNA where necessary.
Generation of gene knockout X. laevis
Gene disruption using CRISPR-Cas9 was carried out as previously described [Citation54]. Briefly, oligonucleotides corresponding to the genomic targets were cloned into the pDR274 vector (gift of Keith Joung; Addgene, 42,250) and single guide RNAs (sgRNAs) were transcribed using the MAXIscript in vitro transcription kit (ThermoFisher, AM1312) after linearizing the resulting plasmids with Dra1. The target sequences were GGGGAACTGAACAACAACCT (present in exon 7 of both RPE65.L and RPE65.S) and GGTATCATTGAGACACAGTT (present in exon 5 of both GNAT1.L and GNAT1.S). sgRNAs were purified using the miRNeasy kit (Qiagen, 217,004). Eggs obtained from female RHOp-mRFP-eGFP-LC3 animals were fertilized in-vitro using wildtype sperm, dejellied, and injected with Cas9 mRNA, sgRNA, and eGFP mRNA prior to the first cell division. After 24 h, the resulting embryos were examined using a dissecting microscope equipped with epifluorescence optics for eGFP expression (used to confirm successful RNA injection). eGFP-positive embryos were retained for further analysis. Controls were in-vitro fertilized siblings. Embryos were raised to tadpoles as described above.
Extraction of genomic DNA
Tail clippings were immersed in 100 µl genomic DNA extraction buffer (50 mM Tris, pH 8.5, 0.5% Tween-20 (ThermoFisher, BP337-100), 200 µg/ml proteinase K (ThermoFisher, 25,530,015) and incubated at 55°C for 2 h and 95°C for 10 min. The resulting lysate was used as a template for PCR.
Confirmation of gene disruption by sanger sequencing
200–300 bp fragments of the RPE65.L, RPE65.S, GNAT1.L and GNAT1.S genes were amplified by PCR from extracted genomic DNA. After treatment of the PCR products with shrimp alkaline phosphatase and exonuclease 1 to remove primers and free dNTPs [Citation79], Sanger sequencing was performed using the forward primer by a commercial DNA sequencing facility (Genewiz).
Genotyping of animals for the brhop23h transgene
This was performed as previously described [Citation29]. Briefly, transgenic DNA was amplified from extracted genomic DNA using the primers ‘5ʹ-TCA CAG TCC AGC ACA AGA AG-3ʹ’ and ‘5ʹ-TAC CCA TGG AGA GAG GTG TAG-3ʹ’, which amplify a sequence within the bRHO cDNA. Amplification was detected by qPCR using a FAM-labelled probe (“5ʹ-/56-FAM/CAC ACC GCT/ZEN/CAA CTA CAT CC).
Confocal microscopy
Eyes were fixed in 4% paraformaldehyde with 0.1 M sodium phosphate buffer pH 7.4 overnight. Fixed eyes were embedded in optimal cutting temperature compound (Tissue Tek, 4583) and cryosectioned (12 µm) as previously described [Citation54,Citation80]. Sections were stained with Alexa Fluor 647-conjugated wheat germ agglutinin (WGA; ThermoFisher, W32466; 1:10,000) and Hoechst 33,342 (Sigma-Aldrich, 14,533) (1 µg/ml), and imaged using a Zeiss LSM 510 META laser scanning confocal microscope, with a 40X N.A. 1.2 water-immersion objective. Three dimensional Z-stack images were collected for individual retinal rod photoreceptors within the central third of the retina. For a given experiment, all data was collected using the same microscope settings. For publication, signal intensity was adjusted linearly in the eGFP and mRFP channels. To best emphasize detail, non-linear adjustments were made in the WGA and Hoechst 33,342 counterstain channels. Final figures were assembled using Adobe Photoshop software.
Immunohistochemistry
For immunolabeling experiments, cryosections were obtained as described above. For RPE65 labeling, sections were blocked with 137 mM NaCl, 2.7 mM KCl, 1.5 mM KH2PO4, 8.5 mM Na2HPO4 (PBS) containing 0.1% TX-100 (ThermoFisher, BP151-100) and 1% goat serum (Sigma-Aldrich, G6767). Sections were labelled with a rabbit polyclonal anti-RPE65 antibody YZS437 at a 1:3,000 dilution, followed by anti-rabbit secondary antibody conjugated to Cy5 (1:750; Jackson Immunoresearch, 711–176-152) and counterstained with Hoechst 33,342 (Sigma-Aldrich, 14,533; 1 µg/ml). YZS437 was raised against the X. laevis RPE65-derived peptide sequence PLQADKEDPVTKSK. All labeling steps were carried out in PBS containing 0.1% TX100 and 0.1% goat serum.
For GNAT1 and LAMP1 labeling, procedures were similar, except that frozen retinal sections were labelled with primary rabbit polyclonal anti-GNAT1 (gift of W.D. Smith) or anti-LAMP1 antibody (Abcam, 24,170) followed by Cy5-conjugated secondary anti-rabbit antibody (1:750) and counterstained with Hoechst 33,342. Anti-GNAT1 was used at 1:1000 dilution, anti-LAMP1 was used at 1:250. All labeling steps were carried out in PBS containing 0.1% TX-100 and 0.1% goat serum.
For CYCS labeling, procedures were similar, except that an antigen retrieval step was included prior to sectioning. Antigen retrieval was performed on intact fixed eyes, and followed the procedure described by Inoue et al [Citation81]. Subsequently, cryosections were obtained and labeled as above with mouse anti-CYCS (Novus Biologicals, 56,503) at 1:100 dilution followed by Cy5-conjugated secondary anti-mouse antibody (1:750) and counterstained with Hoechst 33,342 (1 µg/ml). All labeling steps were carried out in PBS containing 0.1% TX100 and 0.1% goat serum.
Counting fluorescent puncta
Fluorescent puncta were counted manually in 3D projections using the original Zeiss data files. While counting, the red and green channels were examined independently and together to score puncta as dually fluorescent. Gain was adjusted freely in both channels to better visualize all puncta regardless of intensity. Green puncta that colocalized with red signal were scored as dually fluorescent regardless of red signal intensity.
Transmission electron microscopy
Samples were prepared for electron microscopy as previously described [Citation82]. Briefly, eyes were fixed in 4% paraformaldehyde 1% glutaraldehyde in 0.1 M phosphate buffer pH 7.4 and infiltrated with 2.3 M sucrose in 0.1 M phosphate, embedded in OCT (TissueTek, 4583) and cryosectioned (20 µm). Cryosections were osmicated, dehydrated, infiltrated with Eponate 12 resin (Pelco 18,010), and finally embedded in Eponate 12 resin. Sections (70 nm) were cut, collected on Formvar films, stained with uranyl acetate and lead citrate, and examined using a Hitachi H7600 transmission electron microscope.
Statistical analyses
Statistical analysis was carried out using Student’s T-test, one-way ANOVA or two-way ANOVA for various experiments as indicated in Results and Figure Legends. Tests were performed using SPSS v. 20 statistical analysis software (IBM). T-tests were two-tailed, and equal variance was not assumed.
Supplemental Material
Download Zip (11.1 MB)Acknowledgments
This research was funded by grants to OLM from the Foundation Fighting Blindness (Canada), NSERC RGPIN-2015-04326, CIHR PJT-155937, CIHR PJT-156072, and the Paul and Edwina Heller Memorial Foundation.
Disclosure statement
No potential conflict of interest was reported by the authors.
Supplementary material
Supplemental data for this article can be accessed here.
Additional information
Funding
Related Research Data
References
- Molday RS, Moritz OL. Photoreceptors at a glance. J Cell Sci. [ Internet]. 2015 [ cited 2015 Dec 31];128:4039–4045. Available at http://www.ncbi.nlm.nih.gov/pubmed/26574505
- Palczewski K. G protein-coupled receptor rhodopsin. Annu Rev Biochem. [ Internet]. 2006 [ cited 2015 Nov 13];75:743–767. Available at http://www.pubmedcentral.nih.gov/articlerender.fcgi?artid=1560097&tool=pmcentrez&rendertype=abstract
- Arshavsky VY, Burns ME. Current understanding of signal amplification in phototransduction. Cell Logist. [ Internet]. 2014 [ cited 2016 Feb 3];4:e29390. Available at http://www.pubmedcentral.nih.gov/articlerender.fcgi?artid=4160332&tool=pmcentrez&rendertype=abstract
- Saari JC. Biochemistry of visual pigment regeneration: the Friedenwald lecture. Invest Ophthalmol Vis Sci. [ Internet]. 2000 [ cited 2015 Jan 27];41:337–348. Available at http://www.ncbi.nlm.nih.gov/pubmed/10670460
- Daiger SP, Sullivan LS, Bowne SJ. Genes and mutations causing retinitis pigmentosa. Clin Genet. [ Internet]. 2013 [ cited 2015 Aug 18];84:132–141. Available at http://www.pubmedcentral.nih.gov/articlerender.fcgi?artid=3856531&tool=pmcentrez&rendertype=abstract
- Berson EL. Retinitis pigmentosa. The Friedenwald Lecture. [ Internet]. Invest Ophthalmol Vis Sci. 1993;34;1659–1676. Available at http://www.ncbi.nlm.nih.gov/htbin-post/Entrez/query?db=m&form=6&dopt=r&uid=8473105
- Papermaster DS. Necessary but insufficient. [ Internet]. Nat Med. 1995;1;874–875. Available at http://www.ncbi.nlm.nih.gov/htbin-post/Entrez/query?db=m&form=6&dopt=r&uid=7585205
- Sohocki MM, Daiger SP, Bowne SJ, et al. Prevalence of mutations causing retinitis pigmentosa and other inherited retinopathies. Hum Mutat. Internet. 2001;17:42–51. Available at: http://www.ncbi.nlm.nih.gov/htbin-post/Entrez/query?db=m&form=6&dopt=r&uid=11139241
- Athanasiou D, Aguila M, Bellingham J, et al. The molecular and cellular basis of rhodopsin retinitis pigmentosa reveals potential strategies for therapy. Prog Retin Eye Res. [ Internet]. 2018 [ cited 2018 Jun 6];62:1–23. Available at http://www.ncbi.nlm.nih.gov/pubmed/29042326
- Lobanova ES, Finkelstein S, Skiba NP, et al. Proteasome overload is a common stress factor in multiple forms of inherited retinal degeneration. Proc Natl Acad Sci U S A. [ Internet]. 2013 [ cited 2015 Feb 25];110:9986–9991. Available at http://www.pnas.org/content/110/24/9986.long
- Lin JH, Li H, Yasumura D, et al. IRE1 signaling affects cell fate during the unfolded protein response. [ Internet]. Science. 2007;318;944–949. Available at http://www.ncbi.nlm.nih.gov/pubmed/17991856
- Dryja TP, McGee TL, Reichel E, et al. A point mutation of the rhodopsin gene in one form of retinitis pigmentosa. [ Internet]. Nature. 1990;343;364–366. Available at http://www.ncbi.nlm.nih.gov/entrez/query.fcgi?cmd=Retrieve&db=PubMed&dopt=Citation&list_uids=2137202
- Noorwez SM, Malhotra R, McDowell JH, et al. Retinoids assist the cellular folding of the autosomal dominant retinitis pigmentosa opsin mutant P23H. [ Internet]. J Biol Chem. 2004;279;16278–16284. Available at http://www.ncbi.nlm.nih.gov/entrez/query.fcgi?cmd=Retrieve&db=PubMed&dopt=Citation&list_uids=14769795
- Mendes HF, Cheetham ME. Pharmacological manipulation of gain-of-function and dominant-negative mechanisms in rhodopsin retinitis pigmentosa. [ Internet]. Hum Mol Genet. 2008;17;3043–3054. Available at http://www.ncbi.nlm.nih.gov/entrez/query.fcgi?cmd=Retrieve&db=PubMed&dopt=Citation&list_uids=18635576
- Tam BM, Qazalbash A, Lee HC, et al. The dependence of retinal degeneration caused by the rhodopsin P23H mutation on light exposure and vitamin a deprivation. [ Internet]. Invest Ophthalmol Vis Sci. 2010;51;1327–1334. Available at http://www.ncbi.nlm.nih.gov/pubmed/19933196
- A V C, Hood DC, Huang Y, et al. Disease sequence from mutant rhodopsin allele to rod and cone photoreceptor degeneration in man. Proc Natl Acad Sci U S A. [ Internet]. 1998 [ cited 2015 Jan 19];95:7103–7108. Available at http://www.pubmedcentral.nih.gov/articlerender.fcgi?artid=22754&tool=pmcentrez&rendertype=abstract
- Paskowitz DM, Lavail MM, Duncan JL. Light and Inherited Retinal Degeneration. Br J Ophthalmol. [ Internet]. 2006 Available at http://www.ncbi.nlm.nih.gov/entrez/query.fcgi?cmd=Retrieve&db=PubMed&dopt=Citation&list_uids=16707518
- Moritz OL, Tam BM. Recent insights into the mechanisms underlying light-dependent retinal degeneration from x. Laevis models of retinitis pigmentosa. [ Internet]. Adv Exp Med Biol. 2010;664;509–515. Available at http://www.ncbi.nlm.nih.gov/pubmed/20238053
- Organisciak DT, Darrow RM, Barsalou L, et al. Susceptibility to retinal light damage in transgenic rats with rhodopsin mutations. [ Internet]. Invest Ophthalmol Vis Sci. 2003;44;486–492. Available at http://www.ncbi.nlm.nih.gov/entrez/query.fcgi?cmd=Retrieve&db=PubMed&dopt=Citation&list_uids=12556372
- Galy A, Roux MJ, Sahel JA, et al. Rhodopsin maturation defects induce photoreceptor death by apoptosis: a fly model for RhodopsinPro23His human retinitis pigmentosa. Hum Mol Genet. [ Internet]. 2005 [ cited 2017 Sep 6];14:2547–2557. Available at https://academic.oup.com/hmg/article-lookup/doi/10.1093/hmg/ddi258
- Naash ML, Peachey NS, Li ZY, et al. Light-induced acceleration of photoreceptor degeneration in transgenic mice expressing mutant rhodopsin. [ Internet]. Invest Ophthalmol Vis Sci. 1996;37;775–782. Available at http://www.ncbi.nlm.nih.gov/htbin-post/Entrez/query?db=m&form=6&dopt=r&uid=8603862
- Tam BM, Moritz OL. Dark rearing rescues P23H rhodopsin-induced retinal degeneration in a transgenic Xenopus laevis model of retinitis pigmentosa: a chromophore-dependent mechanism characterized by production of N-terminally truncated mutant rhodopsin. J Neurosci. [ Internet] 2007;27;9043–9053. Available at http://www.ncbi.nlm.nih.gov/pubmed/17715341
- Mizushima N. Autophagy: process and function. Genes Dev. [ Internet]. 2007 [ cited 2018 Jun 8];21:2861–2873. Available at http://www.ncbi.nlm.nih.gov/pubmed/18006683
- Ciechanover A, Kwon YT. Degradation of misfolded proteins in neurodegenerative diseases: therapeutic targets and strategies. Exp Mol Med. [ Internet]. 2015 [ cited 2018 Jun 6];47:e147–e147. Available at http://www.ncbi.nlm.nih.gov/pubmed/25766616
- He F, Agosto MA, Anastassov IA, et al. Phosphatidylinositol-3-phosphate is light-regulated and essential for survival in retinal rods. Sci Rep. [ Internet]. 2016 [ cited 2018 Jun 11];6:26978. Available at http://www.nature.com/articles/srep26978
- Zhou Z, Doggett TA, Sene A, et al. Autophagy supports survival and phototransduction protein levels in rod photoreceptors. Cell Death Differ. [ Internet]. 2015 [ cited 2018 Jun 11];22:488–498. Available at http://www.ncbi.nlm.nih.gov/pubmed/25571975
- Chen Y, Sawada O, Kohno H, et al. Autophagy protects the retina from light-induced degeneration. J Biol Chem. [ Internet]. 2013 [ cited 2018 Jun 11];288:7506–7518. Available at http://www.ncbi.nlm.nih.gov/pubmed/23341467
- Bogéa TH, Wen RH, Moritz OL. Light induces ultrastructural changes in rod outer and inner segments, including autophagy, in a transgenic Xenopus laevis P23H rhodopsin model of retinitis pigmentosaautophagy in P23H light-induced retinal degeneration. Invest Ophthalmol Vis Sci. [ Internet]. 2015 [ cited 2015 Dec 31];56:7947–7955. Available at http://iovs.arvojournals.org/article.aspx?articleid=2478409&resultClick=1
- Ryj V-S, Wen RH, Zong Z, et al. Opposing effects of valproic acid treatment mediated by histone deacetylase inhibitor activity in four transgenic X. laevis models of retinitis pigmentosa. J Neurosci. [ Internet]. 2017 [ cited 2017 Aug 18];37:1039–1054. Available at http://www.jneurosci.org/lookup/doi/10.1523/JNEUROSCI.1647-16.2016
- Yao J, Qiu Y, Frontera E, et al. Inhibiting autophagy reduces retinal degeneration caused by protein misfolding. Autophagy. [ Internet]. 2018 [ cited 2018 Sep 27];14:1226–1238. Available at https://www.tandfonline.com/doi/full/10.1080/15548627.2018.1463121
- Kimura S, Noda T, Yoshimori T. Dissection of the autophagosome maturation process by a novel reporter protein, tandem fluorescent-tagged LC3. Autophagy. [ Internet]. [ cited 2015 Oct 29]; 3:452–460. Available at http://www.ncbi.nlm.nih.gov/pubmed/17534139
- Batni S, Scalzetti L, Moody SA, et al. Characterization of the Xenopus rhodopsin gene. J Biol Chem. [ Internet] 1996;271;3179–3186. Available at http://www.ncbi.nlm.nih.gov/htbin-post/Entrez/query?db=m&form=6&dopt=r&uid=8621718
- Moritz OL, Tam BM, Knox BE, et al. Fluorescent photoreceptors of transgenic Xenopus laevis imaged in vivo by two microscopy techniques. Invest Ophthalmol Vis Sci.[ Internet]. 1999;40;3276–3280. Available at http://www.ncbi.nlm.nih.gov/pubmed/10586953
- Voellmy R, Ahmed A, Schiller P, et al. Isolation and functional analysis of a human 70,000-dalton heat shock protein gene segment. Proc Natl Acad Sci U S A. [ Internet]. 1985 [ cited 2018 Jun 6];82:4949–4953. Available at http://www.ncbi.nlm.nih.gov/pubmed/3927293
- Kroll KL, Amaya E. Transgenic Xenopus embryos from sperm nuclear transplantations reveal FGF signaling requirements during gastrulation. Development. [ Internet]. 1996;122;3173–3183. Available at http://www.ncbi.nlm.nih.gov/pubmed/8898230
- Tam BM, Lai CC-L, Zong Z, et al. Generation of transgenic X. laevis models of retinal degeneration. Methods Mol Biol. [ Internet]. 2013 [ cited 2013 Oct 18];935:113–125. Available at http://www.ncbi.nlm.nih.gov/pubmed/23150364
- Moritz OL, Tam BM, Papermaster DS, et al. A functional rhodopsin-green fluorescent protein fusion protein localizes correctly in transgenic Xenopus laevis retinal rods and is expressed in a time-dependent pattern. J Biol Chem. [ Internet]. 2001;276;28242–28251. Available at http://www.ncbi.nlm.nih.gov/pubmed/11350960
- Campbell RE, Tour O, Palmer AE, et al. A monomeric red fluorescent protein. Proc Natl Acad Sci U S A. [ Internet]. 2002 [ cited 2015 Sep 22];99:7877–7882. Available at http://www.pnas.org/content/99/12/7877.full
- Balleza E, Kim JM, Cluzel P. Systematic characterization of maturation time of fluorescent proteins in living cells. Nat Methods. [ Internet]. 2017 [ cited 2018 Jun 7];15:47–51. Available at http://www.nature.com/doifinder/10.1038/nmeth.4509
- Khmelinskii A, Keller PJ, Bartosik A, et al. Tandem fluorescent protein timers for in vivo analysis of protein dynamics. Nat Biotechnol. [ Internet]. 2012 [ cited 2017 Aug 31];30:708–714. Available at http://www.nature.com/doifinder/10.1038/nbt.2281
- Remé CE, Knop M. Autophagy in frog visual cells in vitro. Invest Ophthalmol Vis Sci. [ Internet]. 1980 [ cited 2013 Oct 31];19:439–456. Available at http://www.ncbi.nlm.nih.gov/pubmed/6966276
- Scott PA, de Castro JPF, DeMarco PJ, et al. Progression of Pro23His retinopathy in a miniature swine model of retinitis pigmentosa. Transl Vis Sci Technol. [ Internet]. 2017 [ cited 2017 Sep 6];6:4. Available at http://www.ncbi.nlm.nih.gov/pubmed/28316877
- Lee DC, Vazquez-Chona FR, Ferrell WD, et al. Dysmorphic photoreceptors in a P23H mutant rhodopsin model of retinitis pigmentosa are metabolically active and capable of regenerating to reverse retinal degeneration. J Neurosci. [ Internet]. 2012 [ cited 2013 Oct 18];32:2121–2128. Available at http://www.pubmedcentral.nih.gov/articlerender.fcgi?artid=3710121&tool=pmcentrez&rendertype=abstract
- Bocchero U, Tam BM, Chiu CN, et al. Electrophysiological changes during early steps of retinitis pigmentosa. Invest Ophthalmol Vis Sci. 2019 Mar 1;60(4):933–943. doi:10.1167/iovs.18-25347.
- Tam BM, Xie G, Oprian DD, et al. Mislocalized rhodopsin does not require activation to cause retinal degeneration and neurite outgrowth in Xenopus laevis. J Neurosci. 2006;26(1):203–209.
- Tam BM, Moritz OL. Characterization of rhodopsin P23H-induced retinal degeneration in a Xenopus laevis model of retinitis pigmentosa. Invest Ophthalmol Vis Sci. [ Internet] 2006;47;3234–3241. Available at http://www.ncbi.nlm.nih.gov/pubmed/16877386
- Kaushal S. Effect of rapamycin on the fate of P23H opsin associated with retinitis pigmentosa (an American Ophthalmological Society thesis). Trans Am Ophthalmol Soc. [ Internet]. 2006 [ cited 2015 Sep 24];104:517–529. Available at http://www.pubmedcentral.nih.gov/articlerender.fcgi?artid=1809918&tool=pmcentrez&rendertype=abstract
- Pédelacq J-D, Cabantous S, Tran T, et al. Engineering and characterization of a superfolder green fluorescent protein. Nat Biotechnol. [ Internet]. 2006 [ cited 2018 Jun 14];24:79–88. Available at http://www.ncbi.nlm.nih.gov/pubmed/16369541
- Jin S, McKee TD, Oprian DD. An improved rhodopsin/EGFP fusion protein for use in the generation of transgenic Xenopus laevis. FEBS Lett. [ Internet]. 2003 [ cited 2016 Nov 3];542:142–146. Available at http://www.ncbi.nlm.nih.gov/pubmed/12729914
- Tam BM, Moritz OL, Hurd LB, et al. Identification of an outer segment targeting signal in the COOH terminus of rhodopsin using transgenic Xenopus laevis. J Cell Biol. 2000;151(7):1369–1380.
- Noorwez SM, Kuksa V, Imanishi Y, et al. Pharmacological chaperone-mediated in vivo folding and stabilization of the P23H-opsin mutant associated with autosomal dominant retinitis pigmentosa. J Biol Chem. [ Internet]. 2003;278;14442–14450. Available at http://www.ncbi.nlm.nih.gov/entrez/query.fcgi?cmd=Retrieve&db=PubMed&dopt=Citation&list_uids=12566452
- Redmond TM, Yu S, Lee E, et al. Rpe65 is necessary for production of 11-cis-vitamin A in the retinal visual cycle. Nat Genet. [ Internet]. 1998 [ cited 2015 Jan 19];20:344–351. Available at http://www.ncbi.nlm.nih.gov/pubmed/9843205
- Am S, Uno Y, Kwon T, et al. Genome evolution in the allotetraploid frog Xenopus laevis. Nature. [ Internet]. 2016 [ cited 2016 Nov 3];538:336–343. Available at http://www.nature.com/doifinder/10.1038/nature19840
- Jm F, Cn C, Stanar P, et al. Modeling dominant and recessive forms of retinitis pigmentosa by editing three rhodopsin-encoding genes in Xenopus laevis using Crispr/Cas9. Sci Rep. [ Internet]. 2017 cited 2017 Aug 14;7:6920. Available at http://www.nature.com/articles/s41598-017-07153-4
- Remé C, Drinker CK, Aeberhard B. Modification of autophagic degradation by medium- and illumination conditions in frog visual cells in vitro. Doc Ophthalmol. [ Internet]. 1984 [ cited 2013 Oct 31];56:377–383. Available at http://www.ncbi.nlm.nih.gov/pubmed/6609054
- Yao J, Jia L, Feathers K, et al. Autophagy-mediated catabolism of visual transduction proteins prevents retinal degeneration. Autophagy. [ Internet]. 2016 [ cited 2017 Sep 6];12:2439–2450. Available at http://www.ncbi.nlm.nih.gov/pubmed/27753525
- Yao J, Jia L, Shelby SJ, et al. Circadian and noncircadian modulation of autophagy in photoreceptors and retinal pigment epithelium. Invest Opthalmol Vis Sci. [ Internet]. 2014 [ cited 2018 Jun 11];55:3237. Available at.
- Remé CE, Sulser M. Diurnal variation of autophagy in rod visual cells in the rat. Albrecht Von Graefes Arch Klin Exp Ophthalmol. [ Internet]. 1977 [ cited 2018 Jun 21];203:261–270. Available at http://www.ncbi.nlm.nih.gov/pubmed/303474
- Bogéa TH, Wen RH, Moritz OL. Light induces ultrastructural changes in rod outer and inner segments, including autophagy, in a transgenic Xenopus laevis P23H rhodopsin model of retinitis pigmentosa. Investig Ophthalmol Vis Sci. 2015;56(13):7947–7955.
- Remé CE, Wolfrum U, Imsand C, et al. Photoreceptor autophagy: effects of light history on number and opsin content of degradative vacuoles. Invest Ophthalmol Vis Sci. [ Internet]. 1999 [ cited 2013 Oct 31];40:2398–2404. Available at http://www.ncbi.nlm.nih.gov/pubmed/10476808
- Besharse JC, Hollyfield JG, Rayborn ME. Turnover of rod photoreceptor outer segments. II. Membrane addition and loss in relationship to light. J Cell Biol. [ Internet]. 1977;75;507–527. Available at http://www.ncbi.nlm.nih.gov/entrez/query.fcgi?cmd=Retrieve&db=PubMed&dopt=Citation&list_uids=264121
- Komeima K, Rogers BS, Campochiaro PA. Antioxidants slow photoreceptor cell death in mouse models of retinitis pigmentosa. J Cell Physiol. [ Internet]. 2007 [ cited 2018 Jun 7];213:809–815. Available at http://www.ncbi.nlm.nih.gov/pubmed/17520694
- Komeima K, Rogers BS, Lu L, et al. Antioxidants reduce cone cell death in a model of retinitis pigmentosa. Proc Natl Acad Sci U S A. [ Internet]. 2006;103;11300–11305. Available at http://www.ncbi.nlm.nih.gov/entrez/query.fcgi?cmd=Retrieve&db=PubMed&dopt=Citation&list_uids=16849425
- Organisciak DT, Vaughan DK. Retinal light damage: mechanisms and protection. Prog Retin Eye Res. [ Internet]. 2010 [ cited 2013 Oct 30];29:113–134. Available at http://www.pubmedcentral.nih.gov/articlerender.fcgi?artid=2831109&tool=pmcentrez&rendertype=abstract
- Marlhens F, Bareil C, Griffoin JM, et al. Mutations in RPE65 cause Leber’s congenital amaurosis. Nat Genet. [ Internet]. 1997 [ cited 2015 Jan 19];17:139–141. Available at http://www.ncbi.nlm.nih.gov/pubmed/9326927
- Cideciyan AV, Jacobson SG, Beltran WA, et al. Human retinal gene therapy for Leber congenital amaurosis shows advancing retinal degeneration despite enduring visual improvement. Proc Natl Acad Sci. [ Internet]. 2013 [ cited 2018 Jun 7];110:E517–25. Available at http://www.ncbi.nlm.nih.gov/pubmed/23341635
- Peterson JJ, Tam BM, Moritz OL, et al. Arrestin migrates in photoreceptors in response to light: A study of arrestin localization using an arrestin-GFP fusion protein in transgenic frogs. Exp Eye Res. 2003;76(5):553–563.
- Peterson JJ, Orisme W, Fellows J, et al. A role for cytoskeletal elements in the light-driven translocation of proteins in rod photoreceptors. Invest Ophthalmol Vis Sci. [ Internet]. 2005 [ cited 2015 Apr 15];46:3988–3998. Available at http://www.pubmedcentral.nih.gov/articlerender.fcgi?artid=1578685&tool=pmcentrez&rendertype=abstract
- Bootman MD, Chehab T, Bultynck G, et al. The regulation of autophagy by calcium signals: do we have a consensus? Cell Calcium. [ Internet]. 2018 [ cited 2018 Jun 8];70:32–46. Available at http://www.ncbi.nlm.nih.gov/pubmed/28847414
- R-J L, Xu J, Fu C, et al. Regulation of mTORC1 by lysosomal calcium and calmodulin. Elife. [ Internet]. 2016 [ cited 2018 Jun 8]; 5, Available at http://www.ncbi.nlm.nih.gov/pubmed/27787197
- Axe EL, Walker SA, Manifava M, et al. Autophagosome formation from membrane compartments enriched in phosphatidylinositol 3-phosphate and dynamically connected to the endoplasmic reticulum. J Cell Biol. [ Internet]. 2008 [ cited 2018 Jun 11];182:685–701. Available at http://www.ncbi.nlm.nih.gov/pubmed/18725538
- Ravikumar B, Duden R, Rubinsztein DC. Aggregate-prone proteins with polyglutamine and polyalanine expansions are degraded by autophagy. Hum Mol Genet. [ Internet]. 2002 [ cited 2015 Feb 23];11:1107–1117. Available at http://www.ncbi.nlm.nih.gov/pubmed/11978769
- Webb JL, Ravikumar B, Atkins J, et al. Alpha-Synuclein is degraded by both autophagy and the proteasome. J Biol Chem. [ Internet]. 2003 [ cited 2015 Jan 10];278:25009–25013. Available at http://www.ncbi.nlm.nih.gov/pubmed/12719433
- Yu WH, Cuervo AM, Kumar A, et al. Macroautophagy–a novel Beta-amyloid peptide-generating pathway activated in Alzheimer’s disease. J Cell Biol. 2005;171:87–98.
- Tam BM, Noorwez SM, Kaushal S, et al. Photoactivation-induced instability of rhodopsin mutants T4K and T17M in rod outer segments underlies retinal degeneration in X. laevis transgenic models of retinitis pigmentosa. J Neurosci. 2014;34(40):13336–13348.
- Bienz M. Xenopus hsp 70 genes are constitutively expressed in injected oocytes. Embo J. 1984;3:2477–2483.
- Gibson DG, Young L, Chuang R-Y, et al. Enzymatic assembly of DNA molecules up to several hundred kilobases. Nat Methods. [ Internet]. 2009 [ cited 2017 Feb 2];6:343–345. Available at http://www.nature.com/doifinder/10.1038/nmeth.1318
- Ishibashi S, Kroll KL, Amaya E. Generating transgenic frog embryos by restriction enzyme mediated integration (REMI). Methods Mol Biol. 2012;917:185–203.
- Bell J. A simple way to treat PCR products prior to sequencing using ExoSAP-IT. Biotechniques. [ Internet]. 2008 [ cited 2017 Feb 6];44:834. Available at http://www.biotechniques.com/article/000112890
- Tam BM, Noorwez SM, Kaushal S, et al. Photoactivation-induced instability of rhodopsin mutants T4K and T17M in rod outer segments underlies retinal degeneration in X. laevis Transgenic models of retinitis pigmentosa. J Neurosci. [ Internet]. 2014 [ cited 2014 Oct 7];34:13336–13348. Available at http://www.ncbi.nlm.nih.gov/pubmed/25274813
- Inoue D, Wittbrodt J. One for all-a highly efficient and versatile method for fluorescent immunostaining in fish embryos. PLoS One. 2011;6(5):e19713.
- Tam BM, Yang LL, Bogėa TH, et al. Preparation of Xenopus laevis retinal cryosections for electron microscopy. Exp Eye Res. [ Internet]. 2015 [ cited 2015 Sep 23];136:86–90. Available at http://www.ncbi.nlm.nih.gov/pubmed/26008144