
ABSTRACT
PSEN2 (presenilin 2) is one of the 3 proteins that, when mutated, causes early onset familial Alzheimer disease (FAD) cases. In addition to its well-known role within the γ-secretase complex (the enzyme ultimately responsible for Aβ peptides formation), PSEN2 is endowed with some γ-secretase-independent functions in distinct cell signaling pathways, such as the modulation of intracellular Ca2+ homeostasis. Here, by using different FAD-PSEN2 cell models, we demonstrate that mutated PSEN2 impairs autophagy by causing a block in the degradative flux at the level of the autophagosome-lysosome fusion step. The defect does not depend on an altered lysosomal functionality but rather on a decreased recruitment of the small GTPase RAB7 to autophagosomes, a key event for normal autophagy progression. Importantly, FAD-PSEN2 action on autophagy is unrelated to its γ-secretase activity but depends on its previously reported ability to partially deplete ER Ca2+ content, thus reducing cytosolic Ca2+ response upon IP3-linked cell stimulations. Our data sustain the pivotal role for Ca2+ signaling in autophagy and reveal a novel mechanism by which FAD-linked presenilins alter the degradative process, reinforcing the view of a causative role for a dysfunctional quality control pathway in AD neurodegeneration.
Abbreviations: Aβ: amyloid β; AD: Alzheimer disease; ACTB: actin beta; AMPK: AMP-activated protein kinase; APP: amyloid-beta precursor protein; BafA: bafilomycin A1; BAPTA-AM: 1,2-bis(o-aminophenoxy)ethane-N,N,N′,N′-tetraacetic acid acetoxymethyl ester; CFP: cyan fluorescent protein; EGTA-AM: ethylene glycol-bis(β-aminoethyl ether)-N,N,N′,N′-tetraacetic acid acetoxymethyl ester; ER: endoplasmic reticulum; EGFP-HDQ74: enhanced GFP-huntingtin exon 1 containing 74 polyglutamine repeats; FAD: familial Alzheimer disease; FCS: fetal calf serum; FRET: fluorescence/Förster resonance energy transfer; GFP: green fluorescent protein; IP3: inositol trisphosphate; KD: knockdown; LAMP1: lysosomal associated membrane protein 1; MAP1LC3-II/LC3-II: lipidated microtubule-associated protein 1 light chain 3; MCU: mitochondrial calcium uniporter; MICU1: mitochondrial calcium uptake 1; MEFs: mouse embryonic fibroblasts; MFN2: mitofusin 2; MTOR: mechanistic target of rapamycin kinase; MTORC1: MTOR complex 1; SQSTM1/p62: sequestosome 1; PSEN1: presenilin 1; PSEN2: presenilin 2; RAB7: RAB7A: member RAS oncogene family; RFP: red fluorescent protein; ATP2A/SERCA: ATPase sarcoplasmic/endoplasmic reticulum Ca2+ transporting; siRNA: small interference RNA; V-ATPase: vacuolar-type H+-ATPase; WT: wild type
Introduction
Macroautophagy (hereafter called autophagy) is a vital pathway for the turnover of proteins and organelles which controls the quality of cellular components and maintains cell homeostasis. The catabolic process is present at basal level in all cells but it can be also activated by particular stimuli, such as nutrient deprivation or low cellular energy levels.
Autophagy is particularly important in neurons, where it regulates the removal of aggregate-prone proteins, as well as neurogenesis and axon homeostasis. Indeed, autophagy dysfunctions are believed to contribute to the pathogenesis of different neurodegenerative diseases, such as Parkinson disease, Huntington disease, amyotrophic lateral sclerosis and Alzheimer disease (AD) (see [Citation1] for a recent review). In particular, AD, the most common form of dementia, is characterized by an accumulation of misfolded proteins, intracellular tau tangles and extracellular amyloid β (Aβ) plaques [Citation2], and a key role for autophagy has been reported in the formation of both protein aggregates [Citation1,Citation3]. Moreover, an accumulation of damaged mitochondria in neurons, likely caused by a defective mitophagy, has been proposed as an event of utmost importance in AD pathogenesis [Citation4]. Indeed, considerable accumulation of autophagosomes and late autophagic vacuoles has been observed in dystrophic neurites of AD patients and animal models’ brains, as well as in different AD cellular models, suggesting a common process involving impaired autophagy [Citation5,Citation6].
AD may have both sporadic and familial etiology. Sporadic forms account for about 98% of the cases and have a late age of onset (around 65), while familial cases present earlier onset phenotypes. In familial AD (FAD), mutations in the genes encoding APP (amyloid beta precursor protein), PSEN1 (presenilin 1) and PSEN2 (presenilin 2) have been extensively reported, all associated with an altered Aβ accumulation [Citation7]. Indeed, APP represents the substrate from which Aβ peptides are generated, while the homologous proteins PSEN1 and PSEN2 form, alternatively, the catalytic core of the γ-secretase enzymatic complex, ultimately responsible for Aβ generation [Citation8]. More recently, different cellular functions have been discovered for these disease-associated proteins, rendering FAD cases, although very rare, extremely useful to get insights into other possible pathogenic mechanisms. In particular, FAD-linked PSEN1 and PSEN2 mutations have been shown to result in dysfunctions of multiple and diverse cell pathways (see for example [Citation9] for a recent review), such as lipid metabolism [Citation10], Ca2+ homeostasis [Citation11–Citation18] and autophagy [Citation19,Citation20]. For example, FAD-PSEN2 mutants, independently from their γ-secretase activity, are able to significantly alter cell Ca2+ signaling, by reducing the Ca2+ content of intracellular stores, mainly the endoplasmic reticulum (ER [Citation11–Citation16]), and reinforcing ER-mitochondria physical and functional coupling [Citation15,Citation17,Citation18]. Of note, alterations in Ca2+ homeostasis have been extensively reported to be associated with defective autophagy (see [Citation21,Citation22] for recent reviews) and the Ca2+ signal has been found to be both stimulatory and inhibitory for autophagosomes formation and maturation.
As far as autophagy is concerned, mutations in PSENs have been differently involved in the process. Initially, FAD-associated PSEN1 mutations were shown to disrupt vacuolar-type H+-ATPase (V-ATPase)-mediated lysosome acidification necessary for efficient lysosomal Ca2+ signaling and proteolysis, and hence autophagy [Citation19,Citation20,Citation23]. These results, however, have been subsequently challenged and different mechanisms have been proposed for the PSENs-induced impaired autophagy, such as a deficiency in lysosomal Ca2+ storage/release [Citation24] or a block in autophagosome-lysosome fusion [Citation25]. Moreover, an altered lysosomal biogenesis has been suggested also as autophagy-impairing mechanism in PSENs-ablated cells [Citation26,Citation27].
Here, we provide evidence for an additional effect of FAD-linked PSEN2 forms on autophagy, affecting autophagosome maturation and blocking the autophagy flux. This was due to the specific ability of FAD-PSEN2 mutants to partially deplete ER Ca2+ content [Citation11–Citation16], thus reducing cytosolic Ca2+ signals that follow cell stimulations.
Taken as a whole, our data supported the well-accepted link between cellular Ca2+ handling and autophagy [Citation21,Citation22] and suggested that the mechanisms by which FAD-PSENs impaired autophagy can be multiple, involving direct PSEN interactions with different targets or, indirectly, modulating distinct Ca2+ signaling pathways.
Results
Expression of FAD-PSEN2 blocks the autophagy pathway
In order to investigate the effects of FAD-PSEN2 expression on autophagy, the levels of classical autophagy markers were firstly investigated in neuroblastoma SH-SY5Y cells expressing or not the FAD-PSEN2 mutant T122R, one of the most effective in inducing Ca2+ homeostasis alterations [Citation11–Citation14,Citation16,Citation17] and potentiation of ER-mitochondria tethering [Citation17,Citation18]. In fed conditions, lipidated LC3-II (microtubule-associated protein 1 light chain 3) showed a significant increase (almost 2 fold) in cells expressing PSEN2T122R compared to controls ()). In agreement, confocal microscopy analysis of GFP (green fluorescent protein)-LC3 dots (representing autophagosomes) revealed an increase in their number in PSEN2T122R-expressing cells, compared to controls ()). Similar results were also found for the autophagy receptor SQSTM1/p62 (sequestosome 1) [Citation28], with both protein level and dot number increased in PSEN2T122R-expressing cells, compared to controls (Fig. S1A, B).
Figure 1. Expression of FAD-PSEN2 mutants blocks autophagy. (a) Representative western blot for LC3-I, LC3-II and PSEN2 (left) and quantification (right) of LC3-II basal levels (normalized to ACTB levels) in SH-SY5Y cells (control and PSEN2T122R-expressing). Mean ± SEM, n = 4 independent experiments. **p < 0.01. (b) Left, representative confocal images of SH-SY5Y cells (control and PSEN2T122R-expressing) co-transfected with a GFP-LC3 cDNA. Green dots represent autophagosomes at basal conditions. Scale bar: 10 µm. Right, quantification of GFP-LC3 dots in the different cell types. Mean ± SEM, n = 45 and 16 cells for control and PSEN2T122R-expressing, respectively, from 3 independent experiments. **p < 0.01. (c) SH-SY5Y cells (control and PSEN2T122R-expressing) were incubated for 1 h at 37°C with complete medium (DMEM + 10% FCS; fed) or with an extracellular solution supplemented with 1 mM CaCl2 (starv), in the absence or presence of BafA (100 nM). Endogenous LC3 (LC3-I and LC3-II) and PSEN2 levels are shown in a representative western blot (left) and levels of LC3-II (normalized to ACTB) are quantified in the different conditions (right). Mean ± SEM, n = 9 independent experiments. *p < 0.05; **p < 0.01. (d) SH-SY5Y cells (control and PSEN2T122R-expressing, co-transfected with mitochondrial RFP to select transfected cells) were treated as in (c) and immuno-stained for endogenous LC3. Representative confocal images (left) and LC3 dots quantification (right) are shown. Scale bar: 10 µm. Mean ± SEM, n = 60–90 cells, from 4 independent experiments. (e) Primary human fibroblasts (from a heathy control, and a FAD-PSEN2N141I subject; see Materials and Methods) were treated as in (c) and immuno-stained for endogenous LC3. Representative images (left) and LC3 dots quantification (right) are shown. Scale bar: 10 µm. Mean ± SEM, n = 18–29 cells, from 3 independent experiments. *p < 0.05; **p < 0.01; ***p < 0.001.
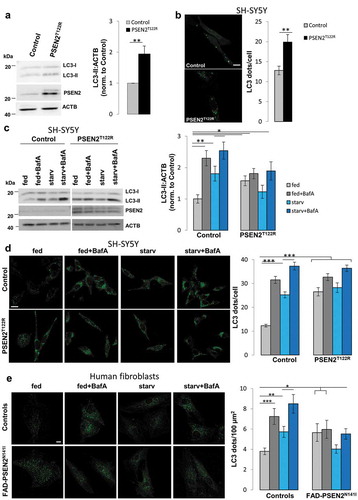
The increase in LC3 and SQSTM1/p62 levels/dots could be due to a potentiated autophagy or rather to a blockage in some late phases of the pathway. We thus investigated the autophagy flux by measuring the above parameters upon induction of autophagy (by nutrient deprivation) and after cell treatment with bafilomycin A1 (BafA), an inhibitor of the V-ATPase H+ pump that blocks autolysosome content degradation by lysosome pH neutralization [Citation29] (but see also [Citation30] for an additional mechanism of action). In starved control cells, an increase in LC3-II levels and LC3 dots was observed ()), indicating a strengthened formation of autophagosomes. Both parameters resulted higher upon BafA treatment (,d)). Conversely, in PSEN2T122R-expressing cells, the already higher levels, compared to controls, of LC3-II and LC3 dots found in fed conditions did not significantly further increase either in starvation or after BafA treatment, suggesting an impairment in the autophagy pathway, both basal and activated ()). An impaired autophagy in PSEN2T122R-expressing cells was also suggested by the analysis of SQSTM1/p62 processing in the same conditions (Fig. S1A, B). Similar results were obtained in mouse embryonic fibroblasts (MEFs; Fig. S2A), or SH-SY5Y cells expressing a different FAD-PSEN2 mutant (PSEN2N141I, similarly affecting Ca2+ homeostasis [Citation11]; Fig. S2B), suggesting that the autophagy defect was cell-type and FAD-PSEN2 mutant independent. Moreover, the defect was not due to protein over-expression, since cortical neurons from FAD-PSEN2N141I transgenic mice (Fig. S2C), where PSEN2 is expressed only two-fold compared to wild type (WT) animals [Citation15], and FAD patient-derived fibroblasts ()), carrying the PSEN2N141I mutation in heterozygosity, showed a similar impairment. In these latter cells, compared to fibroblasts from an age and sex-matched healthy subject, the number of LC3 dots was higher and did not significantly increase in starvation or after blocking lysosomal degradation ()).
FAD-PSEN2 mutants can affect several cellular pathways either by altering the activity of γ-secretase, being PSEN2 the catalytic core of the enzymatic complex [Citation8], or independently, as a single, full-length protein, as it was previously shown for its effects on ER-mitochondria tethering [Citation17], Ca2+ [Citation14] and lipid [Citation10] homeostasis. We thus investigated whether the FAD-PSEN2-induced autophagy defect depended on γ-secretase activity by expressing in SH-SY5Y cells the loss-of-function mutant PSEN2D366A. The expression of this mutant has been shown to blunt γ-secretase enzymatic activity, yet showing an effect on Ca2+ homeostasis, altering it similarly to other FAD-PSEN2 mutants [Citation11,Citation14]. Cells expressing the PSEN2D366A protein showed a similar accumulation of LC3 dots at fed conditions and no further increases in starvation or upon BafA treatment (Fig. S3A). Moreover, experiments performed in cells treated with DAPT and L-685,458, two γ-secretase inhibitors [Citation31], showed that PSEN2T122R expression was still able to induce the accumulation of LC3 dots, compared to inhibitor-treated controls (Fig. S3B), indicating that the FAD-PSEN2 effect on autophagy was independent of γ-secretase activity.
PSEN2T122R expression might also lead to autophagosome accumulation by accelerating the start of the autophagy process. To verify this hypothesis, we assessed the phosphorylation levels of two key, early players in autophagy induction: the serine/threonine MTOR kinase (mechanistic target of rapamycin kinase), which is inactivated and de-phosphorylated at Ser2481 upon autophagy induction by nutrient deprivation or rapamycin treatment [Citation32], and the AMPK (AMP-activated protein kinase), which is a key sensor of the cellular energy status, activated and phosphorylated at Thr172 in conditions of AMP excess [Citation33]. In fed conditions, PSEN2T122R-expressing cells showed, compared to controls, an increased MTOR phosphorylation (Fig. S3C) and a decrease in AMPK phosphorylation (Fig. S3D), indicating a general slowing down of the process, possibly as a compensatory mechanism to prevent further accumulation of autophagosomes, due to the block described above. However, in starvation, both signaling pathways were similarly activated in control and PSEN2T122R-expressing cells (Fig S3C, D), suggesting that initial steps of autophagy were not impaired by the expression of the FAD-associated protein.
Expression of FAD-PSEN2 blocks autophagosome-lysosome fusion
To investigate further the mechanism by which FAD-PSEN2 blocks autophagy, the tandem-tagged GFP-mCherry-LC3 probe was used. This tool helps to unravel whether, throughout the autophagy flux, autophagosomes fuse with lysosomes, based on the distinct chemical properties of GFP and mCherry fluorophores [Citation34]. Under non-lysosomal, near-neutral pH conditions, both GFP and mCherry are fluorescent and, accordingly, autophagosomes are visualized as yellow dots (i.e., mCherry and GFP double-positive dots); on the other hand, the low pH in the lumen of lysosomes quenches the GFP but not the mCherry signal, visualizing autophagosomes fused with acidic lysosomes (autolysosomes) as red dots (i.e., mCherry single-positive dots). Accordingly, if autophagy flux is increased, both yellow and red dots are increased; instead, if autophagosome maturation into autolysosomes is blocked, only yellow dots increase, without a concomitant rise in red ones.
Control SH-SY5Y cells expressing the GFP-mCherry-LC3 probe, and grown in complete medium, presented a certain number of autophagosomes (,b)), depending on their basal autophagy flux rate. This number correctly increased upon BafA treatment (approaching the value of 1; ) and S4A), as the drug inhibits V-ATPase-dependent lysosomal acidification, while decreased in starvation () and S4B), as the autophagy process is pushed. Interestingly, and in agreement with LC3 results (), cells expressing PSEN2T122R presented a higher number of autophagosomes already at fed conditions (,b) and S4A, B), and no significant increase or decrease in this parameter was observed upon BafA treatment () and S4A) or in starvation () and S4B), respectively. These results confirm that FAD-PSEN2 expression induced an impairment in the autophagy flux, blocking the lysosomal-dependent degradation step. Accordingly, the average size of LC3 dots in FAD-PSEN2 expressing cells was significantly bigger than that observed in control cells (), further indicating an autophagy arrest at the autophagosome level.
Table 1. Autophagosome size is increased in FAD-PSEN2 expressing cells.
Figure 2. Expression of FAD-PSEN2T122R induces a blocks in the autophagy flux. (a and b) SH-SY5Y cells (control or PSEN2T122R-expressing) transfected with cDNA for the mCherry-GFP-LC3 probe were (a) incubated, or not (not-treated, NT), with BafA (100 nM) for 8 h, or (b) left for 2 h in complete medium (fed) or extracellular saline (starv), and analyzed by confocal microscopy for GFP (Ex, 488 nm) and mCherry (Ex, 555 nm) fluorescence (see Fig. S4 for single fluorescence images). Representative confocal images (left) are shown; white dots represent GFP+, RFP+ vesicles, thus autophagosomes, while red dots represent autolysosomes. Scale bar, 10 µm. Histograms (right) represent white dot (GFP+, RFP+) quantification over total dots [(GFP+, RFP+) plus RFP+]. Mean ± SEM, n = 29–65 cells, from 3 independent experiments. ***p < 0.001. (c) Representative confocal images and relative quantification of SH-SY5Y cells (control or PSEN2T122R-expressing) transfected with the EGFP-HDQ74 cDNA and incubated, or not (not-treated, NT), with BafA (100 nM) for 2 h, as indicated. The percentage of cells displaying EGFP-HDQ74 aggregates (indicated by arrows) was calculated (right). Cells without aggregates are marked by dotted ROIs. Scale bar: 10 μm. Mean ± SEM, n = 90–230 cells from 3 independent experiments. *p < 0.05; **p < 0.01.
![Figure 2. Expression of FAD-PSEN2T122R induces a blocks in the autophagy flux. (a and b) SH-SY5Y cells (control or PSEN2T122R-expressing) transfected with cDNA for the mCherry-GFP-LC3 probe were (a) incubated, or not (not-treated, NT), with BafA (100 nM) for 8 h, or (b) left for 2 h in complete medium (fed) or extracellular saline (starv), and analyzed by confocal microscopy for GFP (Ex, 488 nm) and mCherry (Ex, 555 nm) fluorescence (see Fig. S4 for single fluorescence images). Representative confocal images (left) are shown; white dots represent GFP+, RFP+ vesicles, thus autophagosomes, while red dots represent autolysosomes. Scale bar, 10 µm. Histograms (right) represent white dot (GFP+, RFP+) quantification over total dots [(GFP+, RFP+) plus RFP+]. Mean ± SEM, n = 29–65 cells, from 3 independent experiments. ***p < 0.001. (c) Representative confocal images and relative quantification of SH-SY5Y cells (control or PSEN2T122R-expressing) transfected with the EGFP-HDQ74 cDNA and incubated, or not (not-treated, NT), with BafA (100 nM) for 2 h, as indicated. The percentage of cells displaying EGFP-HDQ74 aggregates (indicated by arrows) was calculated (right). Cells without aggregates are marked by dotted ROIs. Scale bar: 10 μm. Mean ± SEM, n = 90–230 cells from 3 independent experiments. *p < 0.05; **p < 0.01.](/cms/asset/5e448404-7f5a-4157-a88c-1483d47f5731/kaup_a_1596489_f0002_oc.jpg)
Additional evidence of a blocked autophagy process in the presence of FAD-PSEN2 came from an impaired clearance of a widely used autophagy substrate, the enhanced GFP (EGFP)-huntingtin exon 1 containing 74 polyglutamine repeats (EGFP-HDQ74 [Citation35,Citation36]). As shown in ), transfected EGFP-HDQ74 formed discernible aggregates in ~20% of control cells, a fraction that clearly increased blocking autophagy by BafA treatment, in agreement with previous studies [Citation35,Citation36]. Interestingly, PSEN2T122R expression appeared to reduce clearance of EGFP-HDQ74 aggregates, since an increased percentage of cells displaying aggregates was observed already in fed conditions, and did not further increase upon BafA treatment.
The above results could be due to two main defects in the autophagy process: an altered lysosomal number/acidification or a block in the autophagosome-lysosome fusion; both events, indeed, could impede/delay lysosome-dependent degradation and progression of the autophagy flux, leading to a large accumulation of autophagosomes. We thus firstly evaluated, in control and PSEN2T122R-expressing cells, the number of acidic and total lysosomes, by either loading cells with the LysoTracker Red probe (a weak amine that accumulates in acidic vesicles), or staining them with a specific antibody for LAMP1 (lysosomal associated membrane protein 1). No significant differences between control and PSEN2T122R-expressing cells were found in both parameters (Fig. S5A), suggesting that the number and/or maturation of these organelles were not affected by PSEN2T122R expression. As control, in both cell types, BafA treatment (to neutralize the pH) induced a strong reduction in acidic, LysoTracker Red-positive vesicles (Fig. S5A). Importantly, similar results were obtained also in FAD-PSEN2N141I patient-derived fibroblasts, compared to cells from healthy individuals (Fig. S5B). Mean lysosomal size was also evaluated and it showed an increase in cells expressing FAD-PSEN2, compared to controls (), possibly indicating a block in the last steps of autophagosome/autolysosome clearance.
Table 2. Lysosome size is increased in FAD-PSEN2 expressing cells.
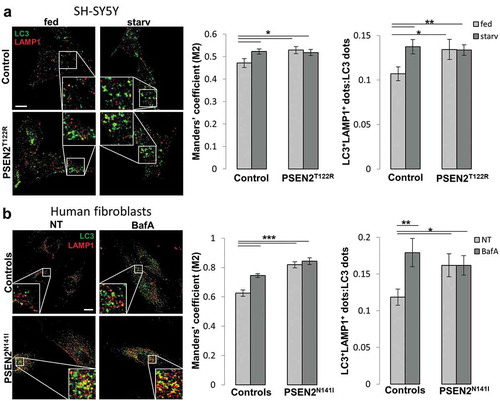
We next evaluated autophagosome-lysosome fusion by co-staining, in control and PSEN2T122R-expressing SH-SY5Y cells, autophagosomes and lysosomes (by LC3 and LAMP1 immuno-staining, respectively) and analyzing the autophagosome-lysosome co-localization signal, as well as the number of co-localized dots over total dots ()). While in starved control cells there was an increase, compared to fed cells, in both co-localization signal and number of co-localized dots (as nutrient deprivation induces autophagy and, thus, the docking/fusion of autophagosomes with lysosomes), in PSEN2T122R-expressing cells the two parameters were already higher at fed condition and did not increase further in starvation ()). Interestingly, when the resolution of LC3 dots was increased, collecting their fluorescent signal by stimulated emission depletion (STED) microscopy, we observed a marked increase in LC3/LAMP1 co-localization in control cells upon nutrient deprivation, as evidenced by the presence of several LC3 dots perfectly overlapped with a LAMP1 dot (Fig. S6A, white arrowheads; see also the net increase in the Manders’ co-localization coefficient). On the contrary, in FAD-PSEN2-expressing cells, the number of LC3 dots completely overlapped with LAMP1 dots was lower, with several LC3 dots only partially co-localized (Fig. S6A, cyan arrowheads). Importantly, in the latter cell type, starvation did not change the outcome (Fig. S6A). While, compared to controls, Manders’ co-localization coefficient was higher in FAD-PSEN2-expressing cells in fed conditions (possibly indicating an accumulation of docked vesicles), a significantly lower co-localization was observed in starvation, suggesting that the process of autophagosome-lysosome fusion was defective. These results might also justify the accumulation of autophagosomes observed in different FAD-PSEN2 cellular models ( and ). Importantly, FAD-PSEN2N141I patient-derived fibroblasts show a similar defect: compared to controls, FAD cells displayed an increased co-localization signal and co-localized dots at basal, fed conditions that did not rise further upon BafA treatment ()).
Figure 3. Expression of FAD-PSEN2 impairs autophagosome-lysosome fusion. (a) SH-SY5Y cells (control or PSEN2T122R-expressing, co-transfected with a nuclear CFP to select transfected cells) were incubated for 2 h with complete medium (fed) or extracellular saline (starv). Cells were immuno-stained for endogenous LC3 and LAMP1 (secondary Alexa Fluor 488 and Alexa Fluor 555 conjugated antibodies were used, respectively) and visualized by confocal microscopy. Merged images are shown (left) together with Manders’ M2 co-localization coefficient and the proportion of double positive LC3+LAMP1+ dots over total LC3+ dots (right), for each condition. Scale bar, 10 µm. Mean ± SEM, n = 30–37 cells, from 3 independent experiments. *p < 0.05; **p < 0.01. (b) Primary human fibroblasts (from a healthy and a FAD-PSEN2N141I subject) were incubated, or not (not-treated, NT), with BafA (100 nM) for 2 h, and immuno-stained for endogenous LC3 and LAMP1. Representative confocal images (left) and Manders’ M2 co-localization coefficient and the proportion of double positive LC3+LAMP1+ dots over total LC3+ dots (right) are presented for each condition. Scale bar, 10 µm. Mean ± SEM, n = 21–38 cells, from 3 independent experiments. *p < 0.05; **p < 0.01; ***p < 0.001.
To clarify the mechanism by which FAD-PSEN2 mutants block autophagosome-lysosome fusion, we focused our attention on RAB7 (RAB7A, member RAS oncogene family), a small GTPase that plays a key role in the progression of the autophagy pathway in mammalian cells [Citation37]. Firstly, we checked the total levels of RAB7 in control and PSEN2T122R-expressing cells: no significant difference was found in the two cell types (Fig. S6B). We then evaluated RAB7 recruitment to autophagosomes by a co-localization analysis between the endogenous autophagosome marker LC3 and RAB7 ()). In control cells, LC3-RAB7 co-localization signal, as well as the number of colocalized dots, significantly increased in starvation ()), indicating a correct autophagy progression associated with autophagosome maturation. On the contrary, no differences in both parameters were found between fed and starved PSEN2T122R-expressing cells and a lower co-localization, compared to control cells, was observed in starvation ()), suggesting a defective recruitment of the small GTPase to autophagosomes upon autophagy induction. Similar results were obtained evaluating the co-localization signal between endogenous LC3 and a RAB7-GFP fusion protein transiently expressed in the different cell types (Fig. S7A).
Figure 4. Expression of FAD-PSEN2 affects RAB7 recruitment to autophagic vesicles. (a and b) SH-SY5Y cells (control or PSEN2T122R-expressing, co-transfected with a mitochondrial RFP to select transfected cells) were incubated for 2 h with complete medium (fed) or extracellular saline (starv) and immuno-stained for endogenous RAB7 and LC3 (a) or endogenous RAB7 and LAMP1 (b). Secondary Alexa Fluor 488 and Alexa Fluor 647 conjugated antibodies were used, respectively. Single confocal images were collected separately and the merged ones (left) together with the Pearson’s co-localization coefficient and the proportion of double positive LC3+RAB7+ (or LAMP1+RAB7+) dots over total LC3+ (or LAMP1+) dots (right) are shown for each condition, as indicated. Scale bar, 10 µm. Mean ± SEM, n = 23–34 cells, from 3 independent experiments. *p < 0.05; **p < 0.01; ***p < 0.001.
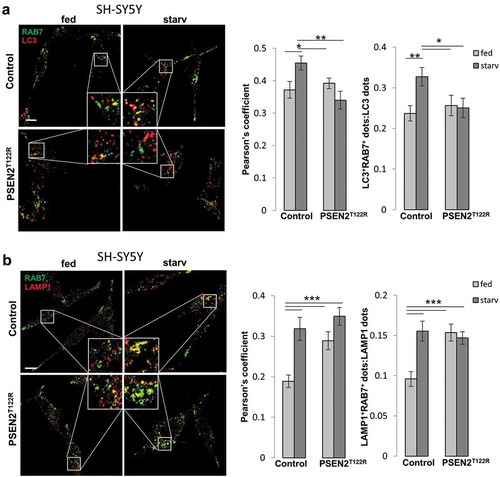
When the association of endogenous RAB7 with lysosomes (stained by an anti-LAMP1 antibody) was analyzed using a similar approach ()), starved control cells showed an increased co-localization signal, as well as an increased number of co-localized dots, compared to fed conditions. On the contrary, in PSEN2T122R-expressing cells, similar RAB7-LAMP1 co-localization was observed in fed and starved conditions, yet with both parameters higher compared to those observed in fed controls ()). Again, GFP-RAB7-LAMP1 co-localization analysis gave similar results (Fig. S7B). Overall, these results suggest that, while FAD-PSEN2 expression impaired RAB7 recruitment to autophagosomes, the capacity of RAB7 to associate with lysosomes was maintained (and actually increased at basal, fed conditions, possibly because of a block in subsequent steps of the autophagy flux).
The FAD-PSEN2-induced autophagy defect depends on Ca2+ dysregulation
We have previously demonstrated that FAD-PSEN2 expression decreases the Ca2+ content of intracellular stores [Citation11–Citation13], mainly the endoplasmic reticulum (ER), by inhibiting ATP2A/SERCA (ATPase sarcoplasmic/endoplasmic reticulum Ca2+ transporting) activity and increasing Ca2+ leak [Citation14]. Moreover, PSEN2 (more potently its FAD mutants) is able to increase the physical and functional ER-mitochondria coupling [Citation17], by inhibiting the antagonistic role of MFN2 (mitofusin 2 [Citation18]). Since both features, i.e., Ca2+ signaling and ER-mitochondria apposition, have been shown to modulate autophagy by different means [Citation22,Citation38] (see also below), we wondered whether the FAD-PSEN2-induced autophagy defect might depend on the two previously reported effects.
We first checked whether the increased ER-mitochondria tethering induced by FAD-PSEN2 expression [Citation17] could be responsible for the observed autophagy defect; to do this, the autophagy flux was analyzed in MEFs, WT or knockout for Mfn2 (mfn2−/−). Although these cells do not represent a relevant cell model for AD, they are useful for this purpose because, in mfn2−/− MEFs, FAD-PSEN2 expression is unable to modulate organelles’ tethering, while maintaining its effects on ER Ca2+ content [Citation18]. Control WT MEFs, expressing the autophagy GFP-mCherry-LC3 probe, showed a certain number of mCherry/GFP double-positive dots (autophagosomes; )), which correctly either increased or decreased upon BafA treatment or in starvation, respectively (), bottom). The expression of FAD-PSEN2 in WT MEFs induced a block in the autophagy flux, with a higher autophagosome number at fed condition that did not change upon both treatments (showing a ratio of mCherry/GFP double-positive dots over total dots close to 1, in all the conditions; ), bottom). This result is in agreement with the data obtained in SH-SY5Y cells (). In mfn2−/− MEFs, the number of mCherry/GFP double-positive dots (autophagosomes; )) in fed conditions was higher than that found in WT MEFs and underwent a smaller but significant either increase or decrease after BafA treatment or nutrient deprivation, respectively (), bottom). These results indicate that MFN2 played per se a role in the normal proceeding of autophagy, in agreement with previous studies showing that the absence of the protein leads to impaired autophagy-mediated protein degradation [Citation39–Citation41]. Notwithstanding, the expression of PSEN2T122R in mfn2−/− MEFs ()) was still able to further impair the already altered autophagy flux present in these cells, since it abrogated the small but significant changes observed upon the two treatments (), bottom), yet independent from its action on ER-mitochondria tethering, which is null in these cells [Citation18].
Figure 5. Autophagy flux is impaired by MFN2 ablation and PSEN2T122R expression. (a and b) MEFs (a) wt or (b) mfn2−/− (control or PSEN2T122R-expressing) were transfected with cDNA for the mCherry-GFP-LC3 probe and incubated, or not (not-treated, NT), with BafA (100 nM) for 8 h (left), or subjected, or not, to starvation for 2 h (right). Cells were then analyzed by confocal microscopy for GFP (Ex, 488 nm) and mCherry (Ex, 555 nm) fluorescence. Representative confocal images (white and red dots represent autophagosomes and autolysosomes, respectively) and quantification of white dots (GFP+RFP+) over total dots [(GFP+RFP+) plus RFP+] are shown. Scale bar, 20 µm. Mean ± SEM, n = 28–61 cells, from 3 independent experiments. *p < 0.05; **p < 0.01; ***p < 0.001.
![Figure 5. Autophagy flux is impaired by MFN2 ablation and PSEN2T122R expression. (a and b) MEFs (a) wt or (b) mfn2−/− (control or PSEN2T122R-expressing) were transfected with cDNA for the mCherry-GFP-LC3 probe and incubated, or not (not-treated, NT), with BafA (100 nM) for 8 h (left), or subjected, or not, to starvation for 2 h (right). Cells were then analyzed by confocal microscopy for GFP (Ex, 488 nm) and mCherry (Ex, 555 nm) fluorescence. Representative confocal images (white and red dots represent autophagosomes and autolysosomes, respectively) and quantification of white dots (GFP+RFP+) over total dots [(GFP+RFP+) plus RFP+] are shown. Scale bar, 20 µm. Mean ± SEM, n = 28–61 cells, from 3 independent experiments. *p < 0.05; **p < 0.01; ***p < 0.001.](/cms/asset/bbf41e03-717a-4884-b449-ccfb8feb8472/kaup_a_1596489_f0005_oc.jpg)
The contribution of FAD-PSEN2-induced Ca2+ dysregulation on autophagy was then evaluated. FAD-PSEN2 mutants have been shown to negatively modulate ATP2A/SERCA activity, inducing a partial depletion in ER Ca2+ content [Citation14]. Interestingly, ATP2A/SERCA pump inhibition by thapsigargin has been described to prevent autophagosome-lysosome fusion by interfering with RAB7 recruitment to autophagic vesicles [Citation42,Citation43], a feature that resembles the impairment of RAB7 association to LC3-positive vesicles observed in starved FAD-PSEN2 expressing cells (). Thapsigargin, however, induces a complete block of the pump (and consequently a complete depletion of intracellular Ca2+ stores) and a strong ER stress response, extensively reported to be linked to autophagy deregulation [Citation44,Citation45], thus masking any possible pure Ca2+-mediated effect on the process. We thus preferred to investigate the correlation between ATP2A/SERCA inhibition and autophagy by mimicking the partial block of the ATP2A/SERCA pump induced by FAD-PSEN2. To this aim, we knocked-down (KD) ATP2A/SERCA expression by specific siRNA (small interference RNA; see Materials and Methods) in control cells, inducing a partial reduction in the pump expression level (Fig. S8A), which should be likely reflected in a decrease in its activity and a lower ER Ca2+ content, similarly to what has been observed in FAD-PSEN2 expressing cells [Citation14]. Thus, ER Ca2+ content was directly measured at the steady state by the fluorescence/Förster resonance energy transfer (FRET)-based Ca2+ probe D4ER [Citation16] in the different conditions. As already reported [Citation16], cells expressing the PSEN2T122R protein showed a significant reduction in the D4ER FRET efficiency (−20%), which was similar to that observed in control cells upon ATP2A/SERCA-KD (Fig. S7B).
In these cells, we then analyzed the autophagy flux. In fed conditions, ATP2A/SERCA-KD control cells (compared to scramble siRNA-transfected cells) showed a marked increase in LC3-II levels ()) and LC3-positive dots ()), which did not further augment upon BafA treatment ()). In PSEN2T122R-expressing cells, however, these two parameters, already higher due to the presence of the mutated protein, were not significantly modified by both ATP2A/SERCA-KD and BafA treatment () and S9A), suggesting that the two experimental maneuvers were not additive, possibly impinging on the same cellular pathway. Moreover, when LC3-RAB7 co-localization was analyzed in ATP2A/SERCA-KD cells ()), a null starvation-induced RAB7 recruitment to autophagosomes was found, similarly to what observed in PSEN2T122R-expressing cells ()) or in ATP2A/SERCA-KD, PSEN2T122R-expressing cells ()).
Figure 6. Partial depletion of ER Ca2+ content mimics the autophagy defect induced by FAD-PSEN2 expression. (a) Representative western blot (left) and quantification (right) of LC3 basal levels (normalized to ACTB) in SH-SY5Y cells (control or PSEN2T122R-expressing) transfected with scramble (scr-siRNA) or anti-ATP2A/SERCA (ATP2A/SERCA-siRNA) siRNAs. Mean ± SEM, n = 4 independent experiments. *p < 0.05; **p < 0.01. (b) Representative images and quantification of LC3 dots, revealed by immuno-staining, in SH-SY5Y cells transfected with the indicated siRNAs and treated, or not (not-treated, NT), with BafA (100 nM; 2 h). Mean ± SEM, n = 26–51 cells, from 3 independent experiments. ***p < 0.001. (c) Representative images and quantification of endogenous RAB7 and LC3-GFP co-localization (Pearson’s coefficient) in SH-SY5Y cells (control or PSEN2T122R-expressing) transfected as in (a) and incubated with complete medium (fed) or extracellular saline (starv) for 2 h. Mean ± SEM, n = 14–34 cells, from 3 independent experiments. *p < 0.05; **p < 0.01. (d) Quantification of LC3 dots, revealed by immuno-staining, in SH-SY5Y cells treated, or not (NT), with BAPTA-AM or EGTA-AM (5 µM) for 3 h, or EGTA (2 mM) over night (on), in the presence, or not, of BafA (100 nM). Mean ± SEM, n = 20–53 cells, from 3 independent experiments. ***p < 0.001.
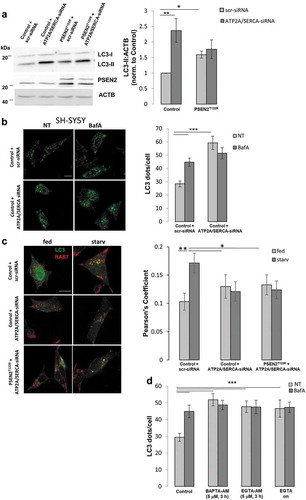
Overall, these data suggest that proper ATP2A/SERCA activity, which guaranteed a correct level of Ca2+ within the ER, was important to maintain a normal autophagy process. Indeed, its damping (experimentally obtained by siRNA-mediated protein down-regulation or as an effect of FAD-PSEN2 expression [Citation14]) determined a lower steady-state ER Ca2+ content and impaired autophagy, by interfering with the correct RAB7 recruitment to autophagosomes and their following fusion with lysosomes. Interestingly, three other treatments, known to interfere with cellular Ca2+ homeostasis, i.e., extended (3 h) cell treatments with the high affinity cell-permeable Ca2+ chelating agent BAPTA-AM (1,2-bis(o-aminophenoxy)ethane-N,N,N′,N′-tetraacetic acid acetoxymethyl ester) or EGTA-AM (ethylene glycol-bis(β-aminoethyl ether)-N,N,N′,N′-tetraacetic acid acetoxymethyl ester) (5 μM), or overnight (on) cell incubation in a Ca2+-free, EGTA-containing medium, induced similar reductions in ER Ca2+ content (Fig. S8B) and affected similarly the autophagy process, as revealed by the analysis of LC3 dots, with or without BafA addition, in cells treated as described above () and S9B).
A reduction in ER Ca2+ content could cause a decreased cytosolic Ca2+ signal upon inositol trisphosphate (IP3)-linked cell stimulations, a feature that has been described also in cells expressing different FAD-PSEN2 mutants [Citation11–Citation13,Citation15,Citation17]. To understand whether the observed block in the autophagy flux (in FAD-PSEN2 expressing cells, and ; or in control BAPTA/EGTA-AM treated cells, )), was due to a reduction in ER Ca2+ content or was a consequence of lower cytosolic Ca2+ rises, following ER Ca2+ releases induced by cell stimulations, the following experiment was carried out. Control cells were incubated with the Ca2+ buffers BAPTA-AM or EGTA-AM, but at lower concentration (2 μM) and for a shorter time (1 h). This protocol led to an unchanged ER Ca2+ content (Fig. S8B) but significantly blunted cytosolic Ca2+ rises occurring upon cell stimulations (Fig. S8C), similarly to those observed in FAD-PSEN2 expressing cells [Citation11,Citation17,Citation18] (see also Fig. S12B). Interestingly, cytosolic-Ca2+-buffered cells showed, compared to untreated controls, an accumulation of LC3 and SQSTM1/p62 dots that did not increase further upon lysosome alkalinization by BafA () and S10A). This behaviour resembled the autophagy block observed in FAD-PSEN2 expressing cells and suggested that, rather than the ER Ca2+ content per se, a proper cytosolic Ca2+ signal was crucial for autophagy progression. Moreover, when BAPTA-AM-treated control cells were analyzed for endogenous RAB7-LC3 and RAB7-LAMP1 co-localization ()), similar results compared to those observed in FAD-PSEN2 expressing cells () were found. In fact, these cells showed an impaired RAB7 recruitment to autophagosomes in starvation and a maintained (or even higher at fed) RAB7 recruitment to lysosomes, further strengthening the link between PSEN2-induced cytosolic Ca2+ dyshomeostasis and autophagy defects. Similar results were obtained analysing GFP-RAB7-LC3 or -LAMP1 co-localization (Fig. S10B, C). Importantly, PSEN2T122R-expressing cells in which the partial ER Ca2+ depletion was recovered by ATP2A/SERCA pump over-expression showed an amount of Ca2+ released into the cytosol, upon stimulation, similar to that of control cells (Fig. S8D) and a normally proceeding autophagy flux, as shown by the increase in LC3 dots observed upon BafA treatment ()).
Figure 7. Cytosolic Ca2+ signal is essential in mediating the autophagy defect induced by FAD-PSEN2 expression. (a) Representative images and quantification of LC3 dots, revealed by immuno-staining, in SH-SY5Y cells incubated, or not (control), with BAPTA-AM or EGTA-AM (2 μM, 1 h) and treated, or not (not-treated, NT) with BafA (100 nM). Mean ± SEM, n = 26–51 cells, from 3 independent experiments. *p < 0.05; ***p < 0.001. (b and c) SH-SY5Y cells were incubated with, or without (control), BAPTA-AM (2 μM) for 1 h in complete medium (fed) or extracellular saline (starv). Cells were immuno-stained for (b) endogenous RAB7 and LC3 or (c) endogenous RAB7 and LAMP1. Merged images (left) together with the Pearson’s co-localization coefficients (right) and the proportion of double positive LC3+RAB7+ (or LAMP1+RAB7+) dots over total LC3+ (or LAMP1+) dots are shown, for each condition. Scale bar, 10 µm. Mean ± SEM, n = 25–33 cells, from 3 independent experiments. *p < 0.05; **p < 0.01; ***p < 0.001.
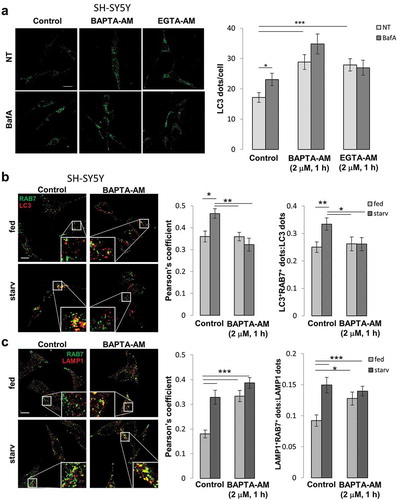
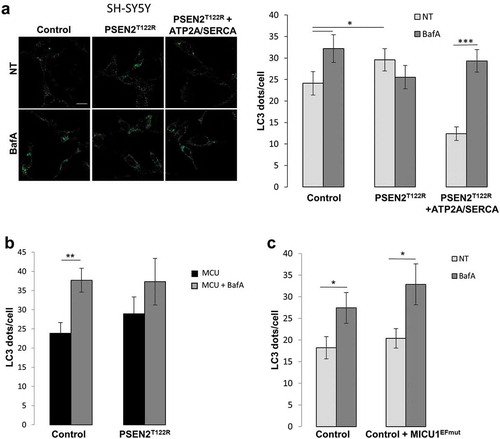
Figure 8. Mitochondrial Ca2+ signal is not involved in mediating FAD-PSEN2-induced autophagy defects. (a–c) Representative images and quantification of LC3 dots, revealed by immuno-staining, in SH-SY5Y cells, control or expressing the indicated proteins (PSEN2T122R and ATP2A/SERCA, (a); PSEN2T122R and MCU, (b); MICU1EFmut, (c)), and treated, or not (not-treated, NT) with BafA (100 nM; 2 h). Mean ± SEM, n = 18–23 cells, from 3 independent experiments. *p < 0.05; **p < 0.01; ***p < 0.001.
Since overexpression of WT PSEN2 in different cell types has been shown to induce, although less potently than its FAD mutants, similar Ca2+ handling defects, reducing ER Ca2+ content and cytosolic Ca2+ signals upon IP3-linked cell stimulations [Citation12–Citation14,Citation17], we wondered whether an upregulation of the WT protein expression could also affect autophagy. Indeed, SH-SY5Y cells expressing WT PSEN2 showed, in fed condition, an increase in LC3 levels/dots, compared to control cells, that was not significantly modified by nutrient deprivation or BafA treatment (Fig. S11), further supporting a key role for Ca2+ dysregulation in the mechanism through which FAD-PSEN2 mutants affected autophagy.
Reduced cytosolic Ca2+ rises caused by IP3-linked cell stimulations are often reflected on blunted mitochondrial Ca2+ responses. Indeed, this Ca2+ signaling defect has been described for different FAD-PSEN2 mutants [Citation17]. Since reduced mitochondrial Ca2+ responses, as those induced by FAD-PSEN2, could impact on ATP production, cell energy balance, AMPK activation and eventually autophagy, we investigated whether and how this feature could also play a role in the FAD-PSEN2-induced autophagy block. For this purpose, MCU (mitochondrial calcium uniporter), the channel subunit of the MCU complex [Citation46], was over-expressed in control and PSEN2T122R-expressing cells (Fig. S12A) and autophagy flux was evaluated. This experimental maneuver is known to potentiate the uptake of the cation by mitochondria following stimulated ER Ca2+ release [Citation47]. Indeed, in these conditions, upon an IP3-linked stimulation, MCU-overexpressing SH-SY5Y cells (both control and PSEN2T122R-expressing) showed a potentiated mitochondrial Ca2+ uptake (Fig. S12B). Interestingly, only in control MCU-overexpressing cells, autophagy flux proceeded normally, as shown by the significant increase in LC3 dots upon BafA treatment () and S8C). On the contrary, even if the defect in mitochondrial Ca2+ uptake was recovered (Fig. S8B), PSEN2T122R/MCU-expressing cells still showed a blocked autophagy flux, as revealed by the LC3 dot number not significantly modified by BafA treatment () and S9C).
To further confirm that altered mitochondrial Ca2+ signaling does not mainly contribute to the observed FAD-PSEN2 autophagy defect, we reduced the capability of mitochondria to take up Ca2+ in control cells, thus mimicking the FAD-PSEN2 effect on this pathway. To do this, the MCU complex component MICU1 (mitochondrial calcium uptake 1) mutated in its EF-hands (MICU1EFmut) was expressed in control cells. Indeed, it has previously been show that this MICU1 mutant, when over-expressed, acts as a dominant negative on the entire complex and reduces mitochondrial Ca2+ uptake upon cell stimulations [Citation48]. Cells expressing MICU1EFmut showed blunted mitochondrial Ca2+ signals upon stimulation, compared to controls, similar to those found in PSEN2T122R-expressing cells (Fig. S12C), but the number of autophagosomes (LC3 dots) increased normally upon BafA treatment () and S9D), indicating that, in this condition, autophagy progressed normally.
Finally, since it has been suggested recently that lysosomal Ca2+ release is a key signal for autophagy [Citation49], we wondered whether FAD-PSEN2 could modify this specific signaling pathway. Thus, the effect of FAD-PSEN2 expression on lysosomal Ca2+ content has been investigated. Lysosomal Ca2+ release was analyzed by the cytosolic Ca2+ probe GCaMP6f in control and PSEN2T122R-expressing SH-SY5Y cells upon stimulation with ML-SA1 (an agonist of the lysosomal Ca2+ channel MCOLN1 (mucolipin 1 [Citation49]) and the lysosomotropic agent GPN (glycyl-l-phenylalanine2-naphthylamide), which induces lysosomes osmolysis and their Ca2+ release [Citation50]. No variation in the lysosomal Ca2+ pool was found in PSEN2T122R-expressing cells compared to controls (Fig. S12D). This result confirms our previous data, obtained in cortical neurons from FAD-PSEN2N141I transgenic mice, showing no significant effects of mutant PSEN2 on total acidic Ca2+ pools [Citation15].
Altogether, these data suggest that FAD-PSEN2 likely affected autophagy by altering ER Ca2+ content and, consequently, cytosolic Ca2+ rises, regardless of the effects on mitochondrial Ca2+ uptake. Indeed, the FAD-PSEN2-induced reduction in ER Ca2+ content was reflected into dull cytosolic Ca2+ signals, determinant in blocking the autophagy flux. As a proof, common cytosolic Ca2+ chelators, such as BAPTA or EGTA, used to dampen cytosolic Ca2+ increases but not perturb ER Ca2+ content, were able to modify the process in a similar way. Importantly, the recovery of normal cytosolic Ca2+ signals in cells expressing FAD-PSEN2 removed the block in the autophagy flux.
Discussion
Alterations in autophagy have been extensively linked to the pathogenesis of neurodegenerative diseases (see [Citation1,Citation51] for comprehensive reviews). The mammalian nervous system requires autophagy for its development, functions and homeostasis, to prevent the accumulation of dysfunctional organelles and cellular waste, not relying on cell division (a process used by mitotic cells to dilute these toxic components). Impairments of distinct steps of the autophagy flux, including autophagosome formation, cargo recognition and transport, autophagosome-lysosome fusion, autolysosome clearance and cargo degradation, have been reported in neurodegenerative diseases, such as AD, Parkinson disease, Huntington disease and amyotrophic lateral sclerosis; all these events lead to the buildup of pathogenic proteins or damaged organelles that could significantly contribute to neuronal death. However, most of the molecular components/mechanisms responsible for an altered autophagy, associated with these pathologies, remain still unknown.
In AD studies, PSENs (whose mutations are linked to FAD) have received much attention, and different mechanisms of action in the autophagy process have been proposed for them, mostly independent from their γ-secretase activity. In particular, PSEN1 mutations have been shown to alter V-ATPase maturation and lysosome acidification, leading to a defective lysosomal Ca2+ signaling and autolysosome degradation [Citation19,Citation20,Citation23]. Another study, however, showed that the FAD-PSEN1-dependent blocked autophagy does not depend on V-ATPase dysfunctions, since lysosomes acidification results unperturbed in both human fibroblasts carrying FAD-PSEN1 mutations and PSEN1 ablated cells, but only on a deficient lysosomal Ca2+ storage/release, required for an efficient lysosomal fusion [Citation24]. The V-ATPase dysfunction hypothesis has been challenged also by Neely and colleagues, demonstrating that both PSENs, PSEN1 and PSEN2, are indeed required for efficient lysosomal proteolysis, without inducing the acidification defect previously reported [Citation52]. Instead, loss of PSENs causes an impairment in autophagosome-lysosome fusion, a mechanism previously suggested also by others [Citation53,Citation54]. Moreover, no evidence of defective turnover of autophagic substrates, vesicle pH, V-ATPase maturation or lysosome function has been reported in mammalian cells or in brains of double PSEN conditional knockout mice, but only an increased expression of a set of genes controlling lysosomal biogenesis [Citation26]. Recently, an additional mechanism has been proposed to explain the autophagy defect associated with AD: in PSENs ablated cells, the amino acid sensor and autophagy key player MTORC1 (MTOR complex 1) results excessively tethered to lysosomes, due to a low Ca2+-regulated expression of the MTOR-interacting protein Sestrin2. Increased lysosomal MTORC1 leads to a higher phosphorylation of the key transcription factor for lysosomal biogenesis, TFEB (transcription factor EB), its partial inactivation and attenuated clearance pathways [Citation27]. Interestingly, correcting the Ca2+ signal defect induced by PSENs deficiency restores Sestrin2 levels, MTORC1 localization/activity and TFEB-mediated transcription, strongly sustaining a molecular link between Ca2+ dysregulation and autophagy impairment.
We here show that FAD-linked PSEN2 mutants caused a defective autophagy by an additional mechanism linked to altered Ca2+ signaling: cells expressing FAD-PSEN2 showed a clear accumulation of autophagosomes, due to a block in the distal step of the autophagy degradation pathway, rather than an increase in the proximal step of autophagosome formation. Although the FAD-PSEN2-dependent autophagy defect was similar to that reported for FAD-PSEN1 mutants, i.e., a block in autophagosome clearance [Citation19], it was not caused by lysosomal pH/Ca2+ dysfunctions [Citation20,Citation23] but, instead, by a disturbance in cellular Ca2+ handling, as it is for several other conditions/cell models in which an impairment in autophagy has been described (see [Citation22] for a recent review).
FAD-PSEN2 mutants have been shown to alter distinct Ca2+ signaling pathways: their inhibitory action on ATP2A/SERCA pump [Citation14] leads to a partial ER Ca2+ depletion [Citation11,Citation15,Citation16], which is reflected in reduced cytosolic Ca2+ rises upon cell stimulations inducing ER Ca2+ release [Citation11–Citation13,Citation15,Citation17,Citation18]. Moreover, FAD-PSEN2 proteins, by interacting with MFN2, increase ER-mitochondria physical apposition, modulating the organelles’ Ca2+ crosstalk [Citation15,Citation17,Citation18]. All these FAD-PSEN2-modified Ca2+ handling branches can lead to a defective autophagy. In general, intracellular Ca2+ signal modulates a plethora of Ca2+-sensitive pathways, and both positive and negative effects of cytosolic Ca2+ on autophagy have been reported (see [Citation22] for a recent comprehensive review). Additionally, ER-mitochondria Ca2+ coupling itself can have a direct role on autophagy, independently from cytosolic Ca2+ signaling. Under basal conditions, the constitutive, low level, IP3-mediated ER to mitochondria Ca2+ transfer is essential for the maintenance of optimal cellular bioenergetics [Citation55,Citation56]. Consequently, autophagy is preserved at low levels in healthy cells. On the other hand, disturbances in ER-mitochondria Ca2+ shuttling triggers autophagy by increasing the AMP:ATP ratio (due to a decreased mitochondrial bioenergetics) and activating the highly sensitive indicator of cell energy, AMPK [Citation55]. The importance of a correct ER-mitochondria Ca2+ crosstalk for a proper autophagy process has been also confirmed by molecular and pharmacological modulation of mitochondrial Ca2+ uptake [Citation36,Citation57,Citation58]. Importantly, it has been shown recently that autophagosomes can originate at ER-mitochondria contact sites [Citation59], and fundamental processes of the autophagy flux, such as lipidation of LC3-I into LC3-II, depend on ER-mitochondria connection [Citation60], placing this inter-organelle interface at the heart of the autophagy process.
By different genetic and pharmacological approaches, we here demonstrate that FAD-PSEN2 blocked the autophagy flux by altering the correct RAB7-dependent autophagosome-lysosome fusion step. This event relied on reduced cytosolic Ca2+ signals linked to ER Ca2+ release. Importantly, the reduction of cytosolic Ca2+ signals, as a consequence of the partial ER Ca2+ depletion induced by FAD-PSEN2 mutants [Citation11,Citation14,Citation16], was pivotal in causing the autophagy block, since pharmacological treatments that blunted cytosolic Ca2+ rises (with or without altering ER Ca2+ content) perfectly mimicked the FAD-PSEN2-induced autophagy defect, leading to autophagosomes accumulation. Moreover, the reduced ER-to-mitochondria Ca2+ transfer, observed upon IP3-generating cell stimulations, in cells expressing FAD-PSEN2 mutants, although able to impact on the entity of the autophagy process, was not decisive for blocking the autophagy flux, since the defect was still present even if mitochondrial Ca2+ uptake was restored in FAD-PSEN2 expressing cells by genetically modulating the MCU complex. Finally, also the capacity of FAD-PSEN2 to reinforce ER-mitochondria juxtaposition, that could potentially contribute to the autophagy block, seemed not to have a starring, unique role. Indeed, an increased ER-mitochondria tethering, as induced by the ablation/depletion of MFN2 [Citation61–Citation63], has been shown to have similar effects on autophagy, blocking autophagosome-lysosome fusion, impairing autophagosome clearance and causing their extensive accumulation [Citation39–Citation41]. These features were also supported by our own data obtained in mfn2−/− cells ()). Notwithstanding, we found an additional block in autophagy induced by FAD-PSEN2 expression in mfn2−/− cells, yet independent from the PSEN2-mediated effect on organelles’ juxtaposition (which is null in these cells [Citation62]). These results suggest a double, additive action of the mutated protein on the autophagy pathway. Alterations in ER-mitochondria tethering could indeed have different functional consequences, for example, on cell Ca2+ handling [Citation38], reducing or enhancing the buffering capacity of mitochondria, hence tuning the overall bulk cytosolic Ca2+ signal, which, in turn, can affect autophagy. On this line, FAD-PSEN2 mutants could behave as a double-edged sword, affecting autophagy directly, by increasing ER-mitochondria coupling, and indirectly, altering Ca2+ handling by both intracellular stores and mitochondria. On the contrary, the lysosomal Ca2+ pool, recently proposed as a key player in vesicle fusion and autophagy flux [Citation49,Citation64–Citation66], seemed not to be affected by FAD-PSEN2 expression, excluding the contribution of this signaling pathway in the PSEN2-mediated defective autophagosome-lysosome fusion step.
A precise Ca2+ signal within the cell was, however, essential for the correct progression of autophagy: when, in FAD-PSEN2 expressing cells, the defective cytosolic Ca2+ signal was corrected, the autophagy flux proceeded normally. Moreover, dull cytosolic Ca2+ rises, obtained in control cells by loading cell-permeable Ca2+ chelators, caused a similar block in the autophagy flux. The Ca2+ signal needed by autophagy to progress correctly could originate by specific intracellular sources (ER, Golgi apparatus, lysosomes or other acidic vesicles) or coming from the extracellular medium through different Ca2+ channels [Citation67], and be transient in time and compartmentalized in space. Indeed, either global cytosolic Ca2+ increases, activating several downstream effectors, such as Ca2+/calmodulin-dependent kinase kinase β linked to the AMKP signaling pathway [Citation68,Citation69], or locally restricted Ca2+ rises, originated by specific intracellular Ca2+ stores, such as lysosomes [Citation49,Citation65], have been implicated in activating and sustaining autophagy. In our conditions, the fact that both Ca2+-chelating agents, BAPTA and EGTA (that differ in their kinetics of buffering Ca2+ microdomains [Citation70,Citation71]), similarly impacted on autophagy progression, likely excluded a role for local cytosolic fast Ca2+ rises in the process. Moreover, FAD-PSEN2 expression, by altering the Ca2+ content of intracellular stores, and thus cytosolic Ca2+ signaling, did not modify the very early molecular steps of autophagy, i.e., MTOR inactivation and AMPK activation, although a lower basal AMPK phosphorylation was present in FAD-PSEN2 expressing cells, likely due to a compensatory mechanism to prevent further accumulation of autophagosomes. Significantly, it altered autophagy progression, not affecting lysosomal number/maturation but blocking RAB7-dependent autophagosome-lysosome fusion. A similar defect in autophagy has been reported in cells treated with the ATP2A/SERCA inhibitor thapsigargin, independently from its effect on ER stress response [Citation42], thus supporting the link between a dysregulated cytosolic Ca2+ signal and impaired autophagosome clearance.
Expression of FAD-PSEN2 in different cell types (SH-SY5Y, MEFs, human fibroblasts, cortical neurons) affected autophagy similarly, sustaining a not cell-specific effect. Notwithstanding, this defect could have a primary role for AD since neurons, as non-dividing cells, are particularly vulnerable to defects in this cell pathway. Indeed, misfolded protein aggregates or damaged organelles in neurons cannot be diluted by cell division, making autophagy a key quality control mechanism for these cells, removing defective structures/organelles and ensuring cell survival. Moreover, the finding that overexpression of WT PSEN2 induced an alteration in the autophagy pathway similar to that observed in cells expressing FAD-PSEN2 mutants at endogenous levels (as it is demonstrated for FAD-PSEN2-dependent Ca2+ dysregulation [Citation12–Citation14,Citation17]) could be relevant, and have important implications, to the majority of sporadic AD cases. Indeed, an increased expression of PSEN2 has been reported in prefrontal cortex of several patients affected by sporadic AD, due to the loss of REST (repressor element 1-silencing transcription factor), a neuronal repressor of transcription which regulates genes (and among them, the PSEN2 gene) promoting cell death and AD [Citation72]. Thus, even in the absence of any FAD mutation, a PSEN2-dependent defective autophagy could contribute to the pathogenesis of the disease. Interestingly, PSEN2-containing γ-secretase complexes have been shown to be selectively targeted to late endosomes and lysosomes (generating long intracellular Aβ peptides), with some FAD-PSEN1 mutants resembling the peculiar PSEN2 distribution [Citation73]. Though our results showed that the effects of FAD-PSEN2 on Ca2+ signaling and autophagy did not depend on its enzymatic activity, it is possible that the specific intracellular distribution of PSEN2 compared to PSEN1, and of FAD mutants compared to the WT counterparts, differentially impact on the autophagy flux. While we here demonstrated a PSEN2-specific Ca2+-mediated impairment in the late phase of autophagy, a similar phenotype, although by a different mechanism (i.e., a defective lysosome acidification) has been reported for FAD-PSEN1 [Citation19]. This suggests that different pathways regulated by PSs may converge on autophagy, whose alterations, however, represent a common hallmark in AD.
How a defective cytosolic Ca2+ signal causes a block in autophagosome-lysosome fusion remains to be investigated. Our data suggest that RAB7 recruitment to autophagosomes, but not to lysosomes, was impaired by the FAD-PSEN2-induced effects on Ca2+ homeostasis (Fig. S13). Among other functions, RAB7 has been repetitively and differentially involved in the control of the autophagy pathway, playing a crucial role in autophagosome retrograde and anterograde transport along microtubules [Citation74], lysosomal acidification by organelle recruitment/stabilization of the V-ATPase component V1G1 [Citation75], autophagosome maturation [Citation76] and autophagosome-lysosome docking [Citation77] and fusion [Citation37]. The possibility that the activity of different Ca2+-sensitive adaptors or RAB7 partners, such as Calnuc, EPG5, PLEKHM1 or HOPS complex [Citation78–Citation81], could be affected by FAD-PSEN2 expression and specifically impact on RAB7 association with autophagosomes appears attractive for future investigations. Intriguingly, UVRAG, that has been suggested to promote RAB7 recruitment and activation to autophagosomes, is endowed with a C2 Ca2+-dependent lipid-binding domain [Citation81]; importantly, the C2 domain has been shown to be critical for determining UVRAG distribution in early endosomes, ER and autophagosomes, but not in lysosomes [Citation81]. Alternatively, other components found to associate with lysosomal membranes in a Ca2+-dependent manner and necessary for autophagy to proceed, such as the membrane-binding proteins annexin A5, A1 and copine 1 [Citation82–Citation84], might play a crucial role in forming specific domains for the subsequent binding of other molecules, eventually promoting vesicle fusion (Fig. S12). Although Ca2+ is a well-established regulator of membrane fusion events, little is known about its precise role in these processes during autophagy. Further investigations will need to decipher the complex Ca2+-based code modulating several molecules involved in the different steps, from autophagosome formation, to autophagosome-lysosome docking and fusion, autolysosome clearance and cargo degradation.
Materials and methods
Cell culture and transfection
SH-SY5Y cells were grown in DMEM containing 10% FCS (fetal calf serum), supplemented with L-glutamine (2 mM), penicillin (100 U/ml) and streptomycin (100 µg/ml). MEFs (WT and mfn2−/−) were mantained in the same medium supplemented with MEM non essentials amino acids solution. Human fibroblasts (from Coriell Institute for Medical Research: FAD-PSEN2N141I (AG09908); control fibroblasts (AG08525-control 1; AG08269-control 2)) were grown in DMEM (Sigma Aldrich, D5671) containing 15% FCS, supplemented with L-glutamine (2 mM), penicillin (100 U/ml) and streptomycin (100 µg/ml). All cells were kept in a humidified atmosphere containing 5% CO2. SH-SY5Y and MEF cells were transfected at 60% confluence using Lipofectamine 2000 Transfection Reagent (Thermo Fisher Scientific, 11668027). All the experiments were performed 24 h after transfection. Control cells were transfected with the corresponding void vector.
For siRNA experiments, universal negative control (SIC001) and ATP2A/SERCA-specific siRNA (SASI_Hs01_00047711), from Sigma-Aldrich, were used. siRNAs (40 nM) were co-transfected together with the specified cDNAs.
All the cDNAs used were previously described: GFP-LC3 [Citation58]; PSEN2 mutants and ATP2A/SERCA [Citation14]; GFP-RAB7 [Citation85]; EGFP-HDQ74 [Citation35,Citation36]; GFP-mCherry-LC3 [Citation34]; MCU and MICU1EFmut [Citation48]; GCaMP6f [Citation86] and D4ER [Citation16]. For experiments in which PSEN2 was expressed without a fluorescent probe, co-transfection with GFP-based constructs (nuclear CFP (cyan fluorescent protein) or mitochondrial RFP (red fluorescent protein)) was performed to select only transfected cells for the following analyses.
Cell treatments
To induce autophagy, cells were incubated for 1 h with fresh complete medium, then washed 3 times and incubated for 2 h (or the indicated time) with an extracellular-like medium (135 mM NaCl, 5 mM KCl, 0.4 mM KH2PO4, 1mM MgCl2, 20 mM HEPES, 1 mM CaCl2; starved condition). In fed conditions, cells were grown in a complete medium. To evaluate autophagic flux, cells (fed or starved) were incubated with 100 nM BafA (Sigma Aldrich, B1793) for the indicated time.
EGTA-AM or BAPTA-AM (Thermo Fisher Scientific, E1219 and B6769, respectively) treatments were performed by incubating cells for the indicated time with 2 or 5 μM of each compound, while over night (on) EGTA incubation was performed by adding 2 mM EGTA (Thermo Fisher Scientific, E3889) (pH 7.4) and 2 mM MgCl2 directly to the cell medium. DATP (N-[N-(3,5-Difluorophenacetyl)-L-alanyl]-S-phenylglycine t-butyl ester) (Sigma Aldrich, D5942; 2 μM) and L-685,458 ((5S)-(t-butoxycarbonylamino)-6-phenyl-(4R)hydroxy-(2R)benzylhexanoyl)-L-leu-L-phe-amide) (Sigma Aldrich, L1790; 1 μM) were added for 18 h.
Confocal analysis
Cells expressing different fluorescent proteins were imaged with a Leica SP5 Confocal system (DM IRE2). STED analysis was performed on a Leica TCS-II SP5 STED CW microscope, equipped with a 100x/1.4 N.A. Plan Apochromat objective. A WLL laser (488 nm line) was used to excite LC3 labelled with an Alexa Fluor 488 (LifeTechnologies, A21206) secondary antibody; HyD was employed for signal collection. Green and red channels images were acquired independently and multiplier gain for each channel was adjusted to minimize background noise and saturated pixels. Once acquired, images were background subtracted and not modified further before analysis. Manders’ and Pearson’s coefficients [Citation87,Citation88] were calculated on randomly taken, single confocal plane images, applying the Image-J Co-localization Analysis plugin. Pearson’s correlation coefficient was used for analyzing proteins co-localization (RAB7-LC3 or RAB7-LAMP1; , (c), 7(b,c)), taking into consideration the fluorescence intensity of each pixel, which is indicative of the abundance of the protein in specific points (co-localization). Manders’ coefficient, instead, was used to analyze organelles’ juxtaposition (autophagosomes-lysosomes; ), only considering pixel co-localization irrespectively of their fluorescence intensity (co-occurrence). Analyses of the number/surface of LC3 puncta was performed by the 3D Object counter function of Fiji. The threshold was set manually and objects with a volume below 5 or above 500 voxels were removed in order to reduce noise and avoid aggregation artifacts, respectively. For GFP-mCherry-LC3 images analyses ( and ), a threshold corresponding to the cytosolic fluorescence was imposed to better visualize dots. Co-localized dots were visualized (white pixels) with the Co-localization highlighter ImageJ plugin, using automatic thresholds. To calculate the proportion of co-localized LC3 or LAMP1 dots ( and ), an object-based method was employed based on the Fiji JACOP plugin, imposing automatically generated thresholds.
In human fibroblasts, dots number (autophagosomes or lysosomes) was normalized to cell surface (dots/100 µm2), because of a marked different cell area found in FAD-PSEN2 patient (larger) and healthy individual-derived fibroblasts. In FAD-PSEN2 transient expression experiments, in order to analyse only transfected cells by confocal microscopy, cell co-transfection, with either GFP-fused relevant constructs (GFP-LC3; mCherry-GFP-LC3; EGFP-HDQ74; GFP-RAB7) or neutral CFP- or RFP-constructs (targeted to either nucleus or mitochondrial matrix), was always performed.
Immunofluorescence (IF) staining of different proteins was performed according to manufacturer’s instructions, using the following antibodies: anti-LC3 (Cell Signaling Technology, 2275); anti-SQSTM1/p62 (Sigma Aldrich, P0067), anti-LAMP1 (Abcam, Ab24170, or Cell Signaling Technology, D401S), anti-RAB7 (Cell Signaling Technologies, 9367; Santa Cruz Biotechnology, sc-376362). For LysoTracker-Red staining, living cells were incubated for 30 min at 37°C with 75 nM LysoTracker Red DND-99 (Life Technologies), and direcly analyzed by confocal microscopy.
Protein extraction and western blotting
For protein extraction, 5 × 10⁵ were solubilized in 80 µl of RIPA Buffer (50 mM Tris, 150 mM NaCl, 1% Nonidet P-40, 0.5% deoxycolic acid, 0.1% SDS, pH 7.5), supplemented with proteases and phosphatases inhibitors mixtures (Roche, 04693132001 and 04906837001), and kept on ice for 30 min. Insolubilized material was spun down at 10,000 g for 15 min at 4°C, and proteins were quantified using the BCA protein assay kit (EuroClone, EMP014250) following manufacturer’s instructions. Proteins (40 µg) were separated by SDS-PAGE, transferred into nitrocellulose membranes (GE Healthcare, 10600001) and probed using the following antibodies: anti-LC3 (Cell Signaling Technologies, 2275); anti-SQSTM1/p62 (Sigma Aldrich, P0067); anti-ATP2A/SERCA (Santa Cruz Biotechnology, N-19); anti-MTOR (Cell Signaling Technologies, 2972); anti-pMTOR (Cell Signaling Technologies, 2974); anti-AMPK (Cell Signaling Technologies, 2532); anti-pAMPK (Cell Signaling Tecnhologies, #2535); anti-RAB7 (Cell Signaling Technologies, #9367); anti-MCU (Cell signaling Tecnhologies, #14997); anti-ACTB (beta-actin) (Sigma Aldrich, A2228). Proteins were visualized by the chemoluminescence reagent ECL (GE Healthcare, RPN2106) and the intensity of the bands was analysed using the ImageJ software package.
Aequorin Ca2+ measurements
Twenty-four h after plating (0.5 × 10⁵/13 mm diameter coverslips), SH-SY5Y cells were trasfected with either cytosolic aequorin or mitochondrial aequorin together with specific cDNA as indicated in the figures; cells were used for Ca2+ measurments 24 h after trasfection. The measurements were performed in a modified Krebs–Ringer buffer (mKRB, in mM: 135 NaCl, 5 KCl, 0.4 KH2PO4, 1 MgCl2, 20 HEPES, pH 7.4 at 37°C). Cells were incubated at 37°C with coelenterazine (5 µM) for 1 h in mKRB containing 1 mM CaCl2 and 10 mM glucose and then transferred to the perfusion chamber for the experiment. Cells were perfused with: (1) mKRB containing 1 mM CaCl2 and 10 mM glucose (30 s); (2) mKRB containing 500 µM EGTA and 10 mM glucose for 2 min; (3) mKRB containing 500 µM EGTA, 10 mM glucose and bradykinin (BK, 100 nM) (Sigma Aldrich, B3259), an IP3-generating agonist, to stimulate the ER Ca2+ release and mitochondrial Ca2+ uptake. The experiments ended permeabilizing cells with digitonin (100 µM) (Sigma Aldrich, D5628) in a hypotonic Ca2+-rich solution (10 mM CaCl2 in H2O) to discharge the remaining unused aequorin pool. The light signal was collected and analyzed as previously described [Citation89].
FRET and GCAMP Ca2+ measurements
To measure ER Ca2+ levels, 24 h after plating, SH-SY5Y cells were transfected with the D4ER probe together with the specific cDNA and/or siRNA, as indicated in the figures. Measurements were performed by mounting coverslips into an open-topped chamber, maintaining cells in mKRB (see above) supplemented or not with CaCl2 (1 mM). Cells were analyzed using a DM6000 inverted microscope (Leica) with a 40× oil objective (HCX Plan Apo, NA 1.25). Upon excitation (at 410 nm; Led Engin, LZ1-00UA00 LED), emission light was collected as previously described [Citation16,Citation18]. Images were acquired every 5 s. Analysis of FRET experiments was performed off-line with ImageJ. CpV-YFP and CFP images were background subtracted and separately analysed by tracing specific regions of interest (ROIs) on each cell. A ratio (R) between cpV-YFP and CFP signals was calculated (R = F530/F480).
For measurements of lysosomal Ca2+ content, SH-SY5Y were co-transfected with GCAMP6f and void vector or PSEN2T122R cDNAs. Coverslips were mounted into an open-topped chamber, 24 h after transfection, and cells were maintained in a Ca2+-free mKRB (see above). ER Ca2+ content was completely discharged by stimulating cells with bradykinin (BK, 100 nM), to activate IP3 receptors, and cyclopiazonic acid (CPA, 20 μM) (Abcam, ab120300), to inhibit ATP2A/SERCA. After 5 min, lysosomal Ca2+ content was released into the cytosol by treating cells with ML-SA1 (10 μM) and GPN (200 μM), as previously described [Citation49]. Fluorescence was recorded in the 500–530 nm range (by using a band-pass filter from Chroma Technologies) using an inverted microscope (Zeiss, Axiovert 100) with a 40× oil objective (Fluar, NA 1.30), by sequentially exciting GCAMP6f at 475 nm and at 410 nm (the isosbestic point). Light was produced by a monochromator (TILL Photonics, Polychrome V) and filtered with a 505 nm DRLP filter (Chroma Technologies, 505DRLP). Acquisitions were performed every 2 s. After background subtraction, images were analyzed with ImageJ. The ratio (R) between emissions upon excitation at 475 nm and at 410 nm, respectively, was calculated by tracing proper ROIs comprising the entire cells.
Primary neuronal cultures
Primary neuronal cultures were obtained from cortices, dissected from 0-to-1 day new-born mice as previously described [Citation15]. All the procedures were approved by the Italian Ethics Committee of Human Experimentation. Briefly, cells were seeded on poly-L-lysine (100 μg/mL) (Millipore, A-005-C) coated coverslips (3x10⁵ cells/well) in MEM (Gibco, 32360026) containing glucose (20 mM), L-glutamine (0.5 mM), B27 supplement (0.5%) (Gibco, 17504-044), N2 supplement (1%) (Gibco, 17502-048), pyruvic acid (1 mM), biotin (3.6 µM), penicillin (25 μg/mL), streptomycin (25 μg/mL), neomycin (50 μg/mL) and horse serum (10%). The complete MEM was replaced with serum- and antibiotic-free Neurobasal medium (Gibco, 10888022) containing B27 (2%) and L-glutamine (2 mM) 24 h after plating. Fresh medium was added (1/5 of total volume) every 4 days. Experiments were performed between 10–12 days in vitro (DIV).
Statistical analyses
All data are representative of at least 3 different experiments. Data were analyzed with Origin 7.5 SR5 (OriginLab) and ImageJ (NIH). Numerical values presented throughout the text refer to mean ± SEM (n = number of independent experiments or cells from at least 3 different transfection/treatments; *p < 0.05, **p < 0.01, and ***p < 0.001, unpaired Student’s t test for normally distributed data or Wilcoxon rank-sum test).
Author contributions
CF, RF and PP designed the experiments; CF, RF and AR performed the experiments and analyzed the results; CF, RF, AR, CM and PP discussed the results; CF, RF and PP wrote the paper. PP secured funding.
Supplemental Material
Download PDF (3.3 MB)Acknowledgments
We thank Chris Miller and Patricia Gomez-Suaga for proving us the EGFP-HDQ74 construct, Fiorella Tonello for helpful discussion on RAB7 functionality and Paulo Magalhães for critical reading of the manuscript and useful suggestions. This study was supported by the Italian Ministry of University and Scientific Research, the University of Padua; the EU Joint Programme-Neurodegenerative Disease Research (CeBioND) to PP.
Disclosure statement
No potential conflict of interest was reported by the authors.
Supplementary material
Supplemental data for this article can be accessed here.
Additional information
Funding
Related Research Data
References
- Menzies FM, Fleming A, Caricasole A, et al. Autophagy and neurodegeneration: pathogenic mechanisms and therapeutic opportunities. Neuron. 2017;93:1015–1034.
- Querfurth HW, LaFerla FM. Alzheimer’s disease. N Engl J Med. 2010;362:329–344.
- Nixon RA. Amyloid precursor protein and endosomal-lysosomal dysfunction in Alzheimer’s disease: inseparable partners in a multifactorial disease. FASEB J. 2017;31:2729–2743.
- Cai Q, Tammineni P. Alterations in mitochondrial quality control in Alzheimer’s disease. Front Cell Neurosci. 2016;10:24.
- Yu WH, Cuervo AM, Kumar A, et al. Macroautophagy–a novel Beta-amyloid peptide-generating pathway activated in Alzheimer’s disease. J Cell Biol. 2005;171:87–98.
- Nixon RA, Wegiel J, Kumar A, et al. Extensive involvement of autophagy in Alzheimer disease: an immuno-electron microscopy study. J Neuropathol Exp Neurol. 2005;64:113–122.
- Cacace R, Sleegers K, Van Broeckhoven C. Molecular genetics of early-onset Alzheimer’s disease revisited. Alzheimers Dement. 2016;12:733–748.
- Andrew RJ, Kellett KA, Thinakaran G, et al. A greek tragedy: the growing complexity of Alzheimer amyloid precursor protein proteolysis. J Biol Chem. 2016;291:19235–19244.
- Duggan SP, McCarthy JV. Beyond gamma-secretase activity: the multifunctional nature of presenilins in cell signalling pathways. Cell Signal. 2016;28:1–11.
- Area-Gomez E, Del Carmen Lara Castillo M, Tambini MD, et al. Upregulated function of mitochondria-associated ER membranes in Alzheimer disease. Embo J. 2012;31:4106–4123.
- Zatti G, Burgo A, Giacomello M, et al. Presenilin mutations linked to familial Alzheimer’s disease reduce endoplasmic reticulum and Golgi apparatus calcium levels. Cell Calcium. 2006;39:539–550.
- Zatti G, Ghidoni R, Barbiero L, et al. The presenilin 2 M239I mutation associated with familial Alzheimer’s disease reduces Ca2+ release from intracellular stores. Neurobiol Dis. 2004;15:269–278.
- Giacomello M, Barbiero L, Zatti G, et al. Reduction of Ca2+ stores and capacitative Ca2+ entry is associated with the familial Alzheimer’s disease presenilin-2 T122R mutation and anticipates the onset of dementia. Neurobiol Dis. 2005;18:638–648.
- Brunello L, Zampese E, Florean C, et al. Presenilin-2 dampens intracellular Ca2+ stores by increasing Ca2+ leakage and reducing Ca2+ uptake. J Cell Mol Med. 2009;13:3358–3369.
- Kipanyula MJ, Contreras L, Zampese E, et al. Ca2+ dysregulation in neurons from transgenic mice expressing mutant presenilin 2. Aging Cell. 2012;11:885–893.
- Greotti E, Wong A, Pozzan T, et al. Characterization of the ER-Targeted Low Affinity Ca(2+) Probe D4ER. Sensors (Basel). 2016;16i:E1419.
- Zampese E, Fasolato C, Kipanyula MJ, et al. Presenilin 2 modulates endoplasmic reticulum (ER)-mitochondria interactions and Ca2+ cross-talk. Proc Natl Acad Sci USA. 2011;108:2777–2782.
- Filadi R, Greotti E, Turacchio G, et al. Presenilin 2 modulates endoplasmic reticulum-mitochondria coupling by tuning the antagonistic effect of mitofusin 2. Cell Rep. 2016;15:2226–2238.
- Lee JH, Yu WH, Kumar A, et al. Lysosomal proteolysis and autophagy require presenilin 1 and are disrupted by Alzheimer-related PSEN1 mutations. Cell. 2010;141:1146–1158.
- Wolfe DM, Lee JH, Kumar A, et al. Autophagy failure in Alzheimer’s disease and the role of defective lysosomal acidification. Eur J Neurosci. 2013;37:1949–1961.
- Filippi-Chiela EC, Viegas MS, Thome MP, et al. Modulation of autophagy by calcium signalosome in human disease. Mol Pharmacol. 2016;90:371–384.
- Bootman MD, Chehab T, Bultynck G, et al. The regulation of autophagy by calcium signals: do we have a consensus? Cell Calcium. 2017;70:32–46.
- Lee JH, McBrayer MK, Wolfe DM, et al. Presenilin 1 maintains lysosomal Ca2+ homeostasis via TRPML1 by regulating vATPase-mediated lysosome acidification. Cell Rep. 2015;12:1430–1444.
- Coen K, Flannagan RS, Baron S, et al. Lysosomal calcium homeostasis defects, not proton pump defects, cause endo-lysosomal dysfunction in PSEN-deficient cells. J Cell Biol. 2012;198:23–35.
- Neely KM, Green KN, LaFerla FM. Presenilin is necessary for efficient proteolysis through the autophagy-lysosome system in a gamma-secretase-independent manner. J Neurosci. 2011;31:2781–2791.
- Zhang X, Garbett K, Veeraraghavalu K, et al. A role for presenilins in autophagy revisited: normal acidification of lysosomes in cells lacking PSEN1 and PSEN2. J Neurosci. 2012;32:8633–8648.
- Reddy K, Cusack CL, Nnah IC, et al. Dysregulation of nutrient sensing and CLEARance in presenilin deficiency. Cell Rep. 2016;14:2166–2179.
- Russell RC, Yuan HX, Guan KL. Autophagy regulation by nutrient signaling. Cell Res. 2014;24:42–57.
- Mauvezin C, Nagy P, Juhasz G, et al. Autophagosome-lysosome fusion is independent of V-ATPase-mediated acidification. Nat Commun. 2015;6:7007.
- Mauvezin C, Neufeld TP. Bafilomycin A1 disrupts autophagic flux by inhibiting both V-ATPase-dependent acidification and Ca-P60A/SERCA-dependent autophagosome-lysosome fusion. Autophagy. 2015;11:1437–1438.
- Florean C, Zampese E, Zanese M, et al. High content analysis of gamma-secretase activity reveals variable dominance of presenilin mutations linked to familial Alzheimer’s disease. Biochim Biophys Acta. 2008;1783:1551–1560.
- Soliman GA, Acosta-Jaquez HA, Dunlop EA, et al. mTOR Ser-2481 autophosphorylation monitors mTORC-specific catalytic activity and clarifies rapamycin mechanism of action. J Biol Chem. 2010;285:7866–7879.
- Salminen A, Kaarniranta K, Kauppinen A. Age-related changes in AMPK activation: role for AMPK phosphatases and inhibitory phosphorylation by upstream signaling pathways. Ageing Res Rev. 2016;28:15–26.
- Kimura S, Noda T, Yoshimori T. Dissection of the autophagosome maturation process by a novel reporter protein, tandem fluorescent-tagged LC3. Autophagy. 2007;3:452–460.
- Ravikumar B, Berger Z, Vacher C, et al. Rapamycin pre-treatment protects against apoptosis. Hum Mol Genet. 2006;15:1209–1216.
- Gomez-Suaga P, Paillusson S, Stoica R, et al. The ER-mitochondria tethering complex VAPB-PTPIP51 regulates autophagy. Curr Biol. 2017;27:371–385.
- Gutierrez MG, Munafo DB, Beron W, et al. Rab7 is required for the normal progression of the autophagic pathway in mammalian cells. J Cell Sci. 2004;117:2687–2697.
- Filadi R, Theurey P, Pizzo P. The endoplasmic reticulum-mitochondria coupling in health and disease: molecules, functions and significance. Cell Calcium. 2017;62:1–15.
- Ding Y, Gao H, Zhao L, et al. Mitofusin 2-deficiency suppresses cell proliferation through disturbance of autophagy. PLoS One. 2015;10:e0121328.
- Zhao T, Huang X, Han L, et al. Central role of mitofusin 2 in autophagosome-lysosome fusion in cardiomyocytes. J Biol Chem. 2012;287:23615–23625.
- Sebastian D, Sorianello E, Segales J, et al. Mfn2 deficiency links age-related sarcopenia and impaired autophagy to activation of an adaptive mitophagy pathway. Embo J. 2016;35:1677–1693.
- Ganley IG, Wong PM, Gammoh N, et al. Distinct autophagosomal-lysosomal fusion mechanism revealed by thapsigargin-induced autophagy arrest. Mol Cell. 2011;42:731–743.
- Ganley IG, Wong PM, Jiang X. Thapsigargin distinguishes membrane fusion in the late stages of endocytosis and autophagy. Autophagy. 2011;7:1397–1399.
- Cai Y, Arikkath J, Yang L, et al. Interplay of endoplasmic reticulum stress and autophagy in neurodegenerative disorders. Autophagy. 2016;12:225–244.
- Cybulsky AV. Endoplasmic reticulum stress, the unfolded protein response and autophagy in kidney diseases. Nat Rev Nephrol. 2017;13:681–696.
- Mammucari C, Gherardi G, Rizzuto R. Structure, activity regulation, and role of the mitochondrial calcium uniporter in health and disease. Front Oncol. 2017;7:139.
- De Stefani D, Raffaello A, Teardo E, et al. A forty-kilodalton protein of the inner membrane is the mitochondrial calcium uniporter. Nature. 2011.
- Patron M, Checchetto V, Raffaello A, et al. MICU1 and MICU2 finely tune the mitochondrial Ca2+ uniporter by exerting opposite effects on MCU activity. Mol Cell. 2014;53:726–737.
- Medina DL, Di Paola S, Peluso I, et al. Lysosomal calcium signalling regulates autophagy through calcineurin and TFEB. Nat Cell Biol. 2015;17:288–299.
- Shen D, Wang X, Li X, et al. Lipid storage disorders block lysosomal trafficking by inhibiting a TRP channel and lysosomal calcium release. Nat Commun. 2012;3:731.
- Nixon RA. The role of autophagy in neurodegenerative disease. Nat Med. 2013;19:983–997.
- Neely KM, Green KN. Presenilins mediate efficient proteolysis via the autophagosome-lysosome system. Autophagy. 2011;7:664–665.
- Esselens C, Oorschot V, Baert V, et al. Presenilin 1 mediates the turnover of telencephalin in hippocampal neurons via an autophagic degradative pathway. J Cell Biol. 2004;166:1041–1054.
- Wilson CA, Murphy DD, Giasson BI, et al. Degradative organelles containing mislocalized alpha-and beta-synuclein proliferate in presenilin-1 null neurons. J Cell Biol. 2004;165:335–346.
- Cardenas C, Miller RA, Smith I, et al. Essential regulation of cell bioenergetics by constitutive InsP3 receptor Ca2+ transfer to mitochondria. Cell. 2010;142:270–283.
- Filadi R, Leal NS, Schreiner B, et al. TOM70 sustains cell bioenergetics by promoting IP3R3-mediated er to mitochondria Ca(2+) transfer. Curr Biol. 2018;28:369–382 e366.
- Mallilankaraman K, Cardenas C, Doonan PJ, et al. MCUR1 is an essential component of mitochondrial Ca2+ uptake that regulates cellular metabolism. Nat Cell Biol. 2012;14:1336–1343.
- Granatiero V, Giorgio V, Cali T, et al. Reduced mitochondrial Ca(2+) transients stimulate autophagy in human fibroblasts carrying the 13514A>G mutation of the ND5 subunit of NADH dehydrogenase. Cell Death Differ. 2016;23:231–241.
- Hamasaki M, Furuta N, Matsuda A, et al. Autophagosomes form at ER-mitochondria contact sites. Nature. 2013;495:389–393.
- Garofalo T, Matarrese P, Manganelli V, et al. Evidence for the involvement of lipid rafts localized at the ER-mitochondria associated membranes in autophagosome formation. Autophagy. 2016;12:917–935.
- Cosson P, Marchetti A, Ravazzola M, et al. Mitofusin-2 independent juxtaposition of endoplasmic reticulum and mitochondria: an ultrastructural study. PLoS One. 2012;7:e46293.
- Filadi R, Greotti E, Turacchio G, et al. Mitofusin 2 ablation increases endoplasmic reticulum-mitochondria coupling. Proc Natl Acad Sci USA. 2015;112:E2174–E2181.
- Cieri D, Vicario M, Giacomello M, et al. SPLICS: a split green fluorescent protein-based contact site sensor for narrow and wide heterotypic organelle juxtaposition. Cell Death Differ. 2018;25:1131–1145.
- Luzio JP, Bright NA, Pryor PR. The role of calcium and other ions in sorting and delivery in the late endocytic pathway. Biochem Soc Trans. 2007;35:1088–1091.
- Tian X, Gala U, Zhang Y, et al.. A voltage-gated calcium channel regulates lysosomal fusion with endosomes and autophagosomes and is required for neuronal homeostasis. PLoS Biol. 2015; 13: e1002103.
- Ruas M, Rietdorf K, Arredouani A, et al. Purified TPC isoforms form NAADP receptors with distinct roles for Ca(2+) signaling and endolysosomal trafficking. Curr Biol. 2010;20:703–709.
- Kondratskyi A, Kondratska K, Skryma R, et al. Ion channels in the regulation of autophagy. Autophagy. 2018;14:1–19.
- Hoyer-Hansen M, Bastholm L, Szyniarowski P, et al. Control of macroautophagy by calcium, calmodulin-dependent kinase kinase-beta, and Bcl-2. Mol Cell. 2007;25:193–205.
- Ghislat G, Patron M, Rizzuto R, et al. Withdrawal of essential amino acids increases autophagy by a pathway involving Ca2+/calmodulin-dependent kinase kinase-beta (CaMKK-beta). J Biol Chem. 2012;287:38625–38636.
- Kidd JF, Fogarty KE, Tuft RA, et al. The role of Ca2+ feedback in shaping InsP3-evoked Ca2+ signals in mouse pancreatic acinar cells. J Physiol. 1999;520(Pt 1):187–201.
- Morgan AJ, Davis LC, Wagner SK, et al. Bidirectional Ca(2)(+) signaling occurs between the endoplasmic reticulum and acidic organelles. J Cell Biol. 2013;200:789–805.
- Lu T, Aron L, Zullo J, et al. REST and stress resistance in ageing and Alzheimer’s disease. Nature. 2014;507:448–454.
- Sannerud R, Esselens C, Ejsmont P, et al. Restricted location of PSEN2/gamma-secretase determines substrate specificity and generates an intracellular abeta pool. Cell. 2016;166:193–208.
- Guerra F, Bucci C. Multiple roles of the small GTPase Rab7. Cells. 2016;5.
- De Luca M, Cogli L, Progida C, et al. RILP regulates vacuolar ATPase through interaction with the V1G1 subunit. J Cell Sci. 2014;127:2697–2708.
- Jager S, Bucci C, Tanida I, et al. Role for Rab7 in maturation of late autophagic vacuoles. J Cell Sci. 2004;117:4837–4848.
- Bento CF, Puri C, Moreau K, et al. The role of membrane-trafficking small GTPases in the regulation of autophagy. J Cell Sci. 2013;126:1059–1069.
- Larkin H, Costantino S, Seaman MN, et al. Calnuc function in endosomal sorting of lysosomal receptors. Traffic. 2016;17:416–432.
- Wang Z, Miao G, Xue X, et al. The vici syndrome protein EPG5 is a Rab7 effector that determines the fusion specificity of autophagosomes with late endosomes/lysosomes. Mol Cell. 2016;63:781–795.
- Marwaha R, Arya SB, Jagga D, et al. The Rab7 effector PLEKHM1 binds Arl8b to promote cargo traffic to lysosomes. J Cell Biol. 2017;216:1051–1070.
- Liang C, Lee JS, Inn KS, et al. Beclin1-binding UVRAG targets the class C Vps complex to coordinate autophagosome maturation and endocytic trafficking. Nat Cell Biol. 2008;10:776–787.
- Ghislat G, Aguado C, Knecht E. Annexin A5 stimulates autophagy and inhibits endocytosis. J Cell Sci. 2012;125:92–107.
- Kang JH, Li M, Chen X, et al. Proteomics analysis of starved cells revealed Annexin A1 as an important regulator of autophagic degradation. Biochem Biophys Res Commun. 2011;407:581–586.
- Overbye A, Fengsrud M, Seglen PO. Proteomic analysis of membrane-associated proteins from rat liver autophagosomes. Autophagy. 2007;3:300–322.
- Rowland AA, Chitwood PJ, Phillips MJ, et al. ER contact sites define the position and timing of endosome fission. Cell. 2014;159:1027–1041.
- Chen BT, Yau HJ, Hatch C, et al. Rescuing cocaine-induced prefrontal cortex hypoactivity prevents compulsive cocaine seeking. Nature. 2013;496:359–362.
- Adler J, Parmryd I. Quantifying colocalization by correlation: the Pearson correlation coefficient is superior to the Mander’s overlap coefficient. Cytometry. 2010;77: 733–742.
- Manders EMM, Verbeek FJ, Aten JA. Measurement of co-localization of object in dual-colour confocal images. J Microsc. 1993;169:375–382.
- Brini M, Marsault R, Bastianutto C, et al. Transfected aequorin in the measurement of cytosolic Ca2+ concentration ([Ca2+]c): a critical evaluation. J Biol Chem. 1995;270:9896–9903.