
ABSTRACT
Imatinib is the first molecularly targeted compound for chronic myeloid leukemia (CML) capable to inhibit BCR-ABL kinase activity. However, recent clinical evidence indicates that a substantial proportion of CML patients exhibit BCR-ABL-dependent or independent resistance to imatinib. Despite the importance of imatinib resistance in CML, the underlying molecular mechanisms of this resistance are largely unknown. Here, we identified GCA (grancalcin) as a critical regulator of imatinib resistance in chronic phase CML via activation of autophagy. Mechanistically, we demonstrated that GCA activates TRAF6 ubiquitin ligase activity to induce Lys63 ubiquitination of ULK1, a crucial regulator of autophagy, resulting in its stabilization and activation. We also highlighted the role of GCA-TRAF6-ULK1 autophagy regulatory axis in imatinib resistance. Our findings represent the basis for novel therapeutic strategies against CML.
Abbreviation: ACTB/β-actin: actin beta; ADM: adrenomedullin; AMBRA1: autophagy and beclin 1 regulator 1; AMPK: AMP-activated protein kinase; ANXA5: annexin A5; CP: cytogenetic response; CML: chronic myeloid leukemia; CUL3: cullin 3; GAPDH: glyceraldehyde-3-phosphate dehydrogenase; GCA: grancalcin; Dx: at diagnosis; E-64-d: (2S,3S)-trans-Epoxysuccinyl-L-leucylamido-3-methylbutane ethyl ester; IMres: Imatinib resistance; KLHL20: Kelch-like protein 20; LRMP: lymphoid-restricted membrane protein; MAP1LC3/LC3: microtubule associated protein 1 light chain 3; MMR: major molecular response; NH4Cl: ammonium chloride; PBMCs: peripheral blood mononuclear cells; PTPRC: protein tyrosine phosphatase, receptor type, C; SQSTM1/p62: sequestosome 1; SYK: spleen associated tyrosine kinase; TAP1: transporter 1, ATP binding cassette subfamily B member; TKIs: ABL-specific tyrosine kinase inhibitors; TLR9: toll- like receptor 9; TRAF6: TNF receptor associated factor 6; ULK1: unc-51 like autophagy activating kinase 1
Introduction
Chronic myeloid leukemia (CML) is a malignant myeloproliferative disorder resulting from the clonal expansion of a transformed multipotent hematopoietic stem cell [Citation1]. CML is characterized by the formation of BCR-ABL chimeric oncoprotein with constitutive ABL tyrosine kinase activity [Citation2,Citation3]. The deregulated ABL tyrosine kinase activity promotes cell survival and proliferation while inhibiting apoptosis [Citation4]. ABL-specific tyrosine kinase inhibitors (TKIs) that selectively inhibit the growth of BCR-ABL–positive CML cells in vitro [Citation5] and in vivo [Citation6] are widely used to treat CML [Citation7]. Imatinib, the first designed TKI, represents effective therapy for CML [Citation8]. Despite these impressive results, a few patients are resistant to imatinib. Approximately 10% of CML patients show primary imatinib resistance within 3 months of imatinib treatment [Citation9,Citation10]. Furthermore, nearly 20% of CML patients in chronic phase (CML-CP), who were previously sensitive to imatinib, develop resistance [Citation11,Citation12].
The most frequently identified mechanism of acquired secondary imatinib resistance involves point mutations associated with BCR-ABL kinase domain that inhibit imatinib binding [Citation13]. However, mutation or amplification is not observed in 50% or more of IM-resistant CML patients [Citation14–Citation16] and the molecular basis of such BCR-ABL-independent imatinib resistance is poorly understood.
Autophagy (self [auto]-eating [phagy]) is a lysosomal recycling mechanism that leads to sequestration of intracellular components into autophagosomes and lysosomal degradation by autophagosome-lysosome fusion [Citation17]. Autophagy initiation starts with the activation of ULK1 and AMBRA1 complexes following AMPK activation and MTOR inhibition [Citation18,Citation19]. Interestingly, autophagy induction leads to dephosphorylation of AMBRA1 and interaction with the E3-ligase TRAF6 to support Lys63-linked ubiquitination of ULK1, and its subsequent activation [Citation19]. Notably, the inhibition of BCR-ABL by TKIs induces autophagy [Citation20] that is a cell-survival response in CML stem cells [Citation21]. Several recent studies have shown that the combination of TKIs and autophagy inhibitors represent an effective treatment for CML [Citation22–Citation25]. However, the molecular bridge linking autophagy with imatinib resistance remains in vague.
GCA (grancalcin) is a cytosolic protein that is translocated to the granule membrane upon neutrophil activation [Citation26,Citation27]. It belongs to a group of EF-hand Ca2+ binding proteins including CAPN (calpain), ALG2, and SRI (sorcin), which show structural rather than functional similarity [Citation28]. Although it has been reported that GCA modulates Toll-like receptor 9 (TLR9)-mediated signaling via direct interaction with TLR9 [Citation29], a genetic knockout of GCA in mice failed to show relevant phenotypes and the physiological role of GCA remains to be elucidated [Citation30].
In this report, we identified GCA as a potential novel molecule driving imatinib resistance in CML-CP through activating autophagy. Our study showed that GCA facilitates K63-linked ubiquitination of ULK1 by activating TRAF6, resulting in autophagy induction, which is critical for imatinib resistance in CML patients. These findings open new perspectives for the treatment of CML.
Results
GCA was highly expressed in imatinib-resistant CML-CP patients
To identify candidate genes for imatinib resistance in CML-CP patients, we performed microarray-based transcriptome profiling of peripheral blood mononuclear cells (PBMCs) obtained from two groups: imatinib-sensitive (achieving major molecular response within 6 months of imatinib treatment, with no BCR-ABL mutations detected; n = 5) and resistant (CP but, no cytogenetic response within 6 months of imatinib treatment, and BCR-ABL mutations were not detected; n = 6) patients (). We also confirmed BCR-ABL mRNA expression in the same samples indicating that imatinib treatment was effective in sensitive but not in the resistant group (Figure S1a). We selected 970 candidate genes based on fold change greater than 1.5 and a p-value less than 0.01 (Supplementary Material 1) and performed unsupervised clustering. Two major clusters emerged: one group of 5 imatinib-sensitive patients clustered; another group of 6 imatinib-resistant samples clustered, of which most genes are upregulated while some portion of genes are downregulated in imatinib-resistant CML-CP patients (Figure S1b). Accordingly, principal component analysis (PCA) showed successful transcriptomic reprogramming in imatinib-resistant patient group away from imatinib sensitive patient group (Figure S1c). For further analysis, microarray data were submitted to Ingenuity Pathway Analysis (IPA). The differentially expressed genes were categorized to specific diseases and biological functions based on Ingenuity pathway knowledge base (IPKB). The top 15 enriched categories of specific diseases and biological functions are listed in Table S2 and GCA belongs to 11th (Figure S1D).
Figure 1. GCA was induced in imatinib-resistant CML patient-derived primary leukemia cells. (a) The workflow for the screening of genes is related to imatinib resistance. (b) Venn diagram showing the overlap between K562IMresist cells and imatinib resistant CML patient group (top panel). The differential gene expression for the overlapped 6 genes with a change in their expression between good response (GS) patients and primary resistant (PR) patients plus hierarchical clustering on entities using euclidean distance with averaged linkage analysis (bottom panel). (c) The knockdown effect of 6 overlapped genes on imatinib resistance. K562 cells were transfected with indicated siRNAs, treated with imatinib (0 or 250 nM) for 48 h and stained with ANXA5 for FACS analysis. The ratio (%) of the apoptotic cell was graphed with S.D. as an error bar; Student’s t-test, **p < 0.01, ***p < 0.001, ns = non-significant. (d) The mRNA levels of GCA were analyzed by qRT-PCR in CML patient-derived PBMCs; Dx (after diagnosis), MMR (major molecular response), Resist (resistance). (e) The protein levels of GCA were analyzed by immunoblotting with the samples from two imatinib-sensitive patients after diagnosis (Dx) and 6 months imatinib treatment with MMR (left panel) and a imatinib-resistant patient after diagnosis, 6 and 12 months imatinib treatment with Resist (right panel). (f) GCA and phosphorylated CrkL (p-CrkL) were analyzed by flow cytometry using PBMC from CML-CP patients (#1420) at diagnosis and after 12 months of IM (imatinib) treatment.
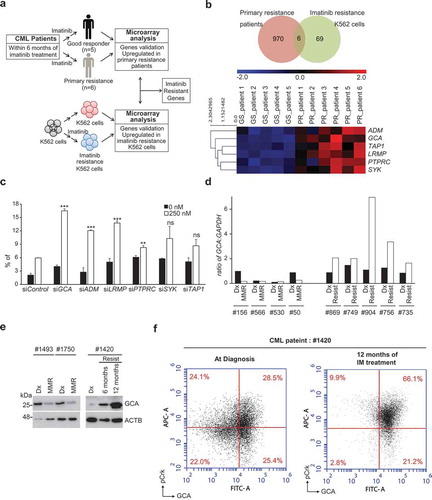
Since imatinib treatment depleted BCR-ABL-positive CML cells in sensitive patients, the CML patient array data set compared normal PBMC with CML cells rather sensitive cells with resistant CML cells. To identify the genes involved in imatinib resistance, we used previous transcriptome analysis of imatinib-resistant K562 (K562IMres) and parental K562 cells (). We previously reported 69 genes specifically induced in K562IMres cells [Citation31]. Interestingly, cross-analysis of two transcriptomes revealed that mRNA of 6 genes are overlapped. ADM (adrenomedullin), GCA (grancalcin), TAP1 (transporter 1, ATP binding cassette subfamily B member), LRMP (lymphoid restricted membrane protein), PTPRC (protein tyrosine phosphatase, receptor type C) and SYK (spleen associated tyrosine kinase) were significantly upregulated both in K562IMres cells and imatinib-resistant CML patient group ( and Supplementary Material 2). In reviewing previous literature, ADM, TAP1, SYK, and PTPRC were reported as induced genes after imatinib treatment. ADM highly expressed in mouse heart tissue after imatinib treatment [Citation32]. TAP1 is upregulated by imatinib treatment in dermatofibrosarcoma protuberans patients carrying fibrosarcomatous transformation [Citation33]. Imatinib binds an unphosphorylated kinase domain of SYK to inhibit its kinase activity [Citation34]. PTPRC is highly expressed in primary CML cells and negatively modulates imatinib and nilotinib response [Citation35]. Among those genes, GCA and LRMP have not been explored in the aspect of imatinib resistance. Next, we tested whether reduced expression of 6 genes with siRNAs could increase cellular sensitivity to imatinib in K562 cells. We found that knockdown of 4 genes, including GCA, ADM, LRMP, or PTPRC, significantly increased cellular sensitivity to imatinib while knockdown of SYK and TAP1 did not significantly improve the response to imatinib ( and S2a-b). Of note, the effect of GCA knockdown on imatinib treatment was most pronounced compared to other genes and further confirmed with 3 independent siRNA of GCA (Fig. S2C-D). Taken together, we focus on the function of GCA on imatinib resistance in CML.
To emphasize the clinical significance, we evaluated the GCA mRNA level in 9 paired clinical samples from 4 imatinib-sensitive patients and 5 imatinib-resistant patients at diagnosis (Dx) and after imatinib treatment using qRT-PCR assay. As shown in , imatinib treatment strongly induced GCA mRNAs only in patients with primary resistance but not in imatinib-sensitive patients. Imatinib treatment greatly reduced major BCR-ABL1:ABL1 mRNA ratio (IS) in sensitive patients with low level of GCA expression, but not in resistant patients with high level of GCA expression (Figure S3a and S3b-c). Importantly, the protein levels of GCA from the imatinib-resistant patient were gradually increased by following imatinib treatment for 6 to 12 months (, right panel). In striking contrast, GCA protein levels were reduced by 6 months of imatinib treatment in sensitive patients (, left panel). The level of GCA protein is positively correlated with major BCR-ABL1:ABL1 mRNA ratio after imatinib treatment (Figure S3b-c), indicating that GCA played a critical role in primary imatinib resistance of CML-CP patients.
To address whether GCA is induced in Ph+ CML cells after imatinib treatment, we performed the co-immunostaining for p-CrkL and GCA of the imatinib-restitant patient sample (#1420) followed by FACS analysis. As shown in , the portion of p-CrkLhighGCAhigh cells was 28.5% at diagnosis and greatly increased to 66.1% after 12 months of imatinib treatment in a resistant patient (#1420). Interestingly, the portion of p-CrkLlow GCAhigh cells was not significantly reduced. Taken together, GCA was mainly induced in the p-CRkL positive CML cells to get imatinib resistance.
GCA inhibited imatinib-induced apoptotic cell death in K562 and primary CML cells
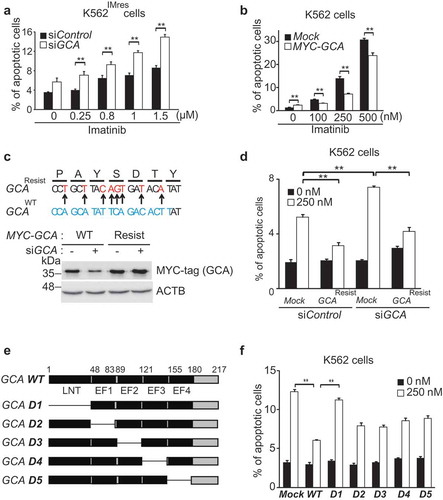
To investigate the role of GCA in imatinib resistance, we used imatinib-resistant (K562IMres) and GCA overexpressed K562 (K562GCA) cells for the viability test after imatinib treatment (250–1000nM). Of note, K562IMres cells expressed higher levels of GCA protein than parental K562 cells (Figure S4a). We observed a significant resistance to imatinib in K562GCA similar to K562IMres (Figure S4b). We further showed that imatinib-induced apoptosis was significantly increased by GCA knockdown in K562IMres cells ( and S5a-b). Conversely, GCA overexpression reduced imatinib-induced apoptosis ( and S5c) indicating GCA protein level is crucial for imatinib resistance. The expression of siRNA-resistant wild-type GCA restored the resistance to imatinib-induced apoptosis (-d and S5d). We also found that the LNT (lipophilic N-terminal extension) region of GCA was mainly responsible for imatinib resistance (-f and S5e).
Figure 2. GCA inhibited imatinib-induced apoptosis through its LNT region. (a) K562IMres cells were transfected with control and GCA siRNA and treated with imatinib (0.25, 0.8, 1.0 and 1.5 µM) for 48 h. Cells were stained with ANXA5 and analyzed by FACS. (b) K562 cells were transfected with MYC-tagged GCA (MYC-GCA) expression plasmid and treated with imatinib (0, 100, 250 and 500 nM) for 48 h. ANXA5 positive apoptotic cells were analyzed by FACS. (c) Diagram of wild-type and siRNA resistant mutants of GCA (Top panel). K562 cells were transfected with indicated combination and subject to western blot for GCA and ACTB. (d) K562 cells were cotransfected with indicated combination of GCA siRNA and siRNA-resistant GCA expression plasmid (MYC-GCA Resist). The cells were treated with imatinib (0 or 250 nM) and subjected to the FACS analysis to analyze apoptotic cells. (e) Diagram of wild-type and five deletion mutants of GCA. (f) K562 cells were transfected with wild-type and deletion mutants of GCA plasmid and treated with imatinib (0 or 250 nM) and subjected to the FACS analysis for apoptotic cells. (a, b, d, f) All graphs illustrated the ratio (%) of ANXA5-positive apoptotic cells. The graphs show the average of three independent experiments. The error bars indicate the S.D. Student’s t-test, **p < 0.01.
To further investigate the clinical significance of GCA, we evaluated the loss- and gain-of-function of GCA in PBMCs from CML-CP patients. Using PBMCs from 5 independent CML-CP patients, we demonstrated that GCA knockdown significantly increased imatinib-induced apoptosis ( and S6a). Conversely, GCA overexpression significantly reduced imatinib-induced apoptosis in PBMCs from 5 independent CML-CP patients ( and S6b). Together, our data strongly suggested that GCA induces imatinib resistance in primary CML cells.
Figure 3. GCA regulated imatinib resistance in CML patient-derived primary leukemia cells. (a) PBMCs derived from 5 independent CML-CP patients were transfected with control and GCA siRNAs and (b) PBMCs from 5 independent CML-CP patients were transfected with MYC-tagged GCA (MYC-GCA) expression plasmid. The cells were treated with imatinib (0, 250 nM) for 48 h and stained with ANXA5 for FACS analysis. All graphs illustrated the ratio (%) of ANXA5-positive apoptotic cells. The graphs show the average of three independent experiments. The error bars indicate the S.D. Student’s t-test, **p < 0.01.
GCA induced autophagy related to imatinib resistance
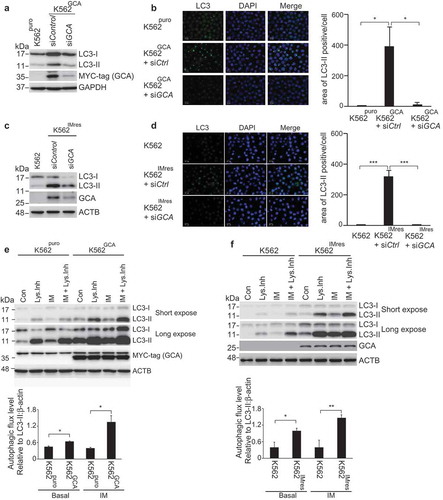
It has been reported that imatinib treatment induces autophagy in various mammalian cells [Citation20]. More importantly, autophagy promotes imatinib resistance in CML [Citation24] and autophagy inhibitor was clinically tested in combination with imatinib (ClinicalTrials.gov Identifier: NCT01227135) [Citation36]. Consistent with previous reports, K562 cells showed a higher sensitivity to imatinib when autophagy was inhibited by ATG5 siRNA (Figure S7). To investigate the role of GCA in autophagy, we assessed autophagy activation by monitoring autophagosome-associated LC3-II using western blot and immunofluorescence staining of LC3. K562GCA cells showed more autophagosome-associated LC3-II than K562puro cells (Figure S8a), which was reversed by GCA knockdown (-b). Consistently, K562IMres cells showed greater levels of autophagosome-associated LC3-II than K562 cells (Figure S8b), which were reversed by GCA knockdown (-). We also showed that SQSTM1/p62, the autophagy marker, was decreased in K562GCA and K562IMres cells, indicating autophagy activation (Figure S8a-b, left panel). To further demonstrate autophagy activation by GCA, we performed autophagy flux analysis in which the clearance of autophagosomes by lysosomes was determined by the rate of LC3-II degradation [Citation37]. As shown in -, autophagic flux of K562GCA and K562IMres cells was higher than their control in basal state. After imatinib treatment, autophagic flux was increased in K562GCA and K562IMres cells. Together, our data indicate that GCA is a novel positive regulator of autophagy.
Figure 4. GCA activated autophagy to induce imatinib resistance. (a) K562GCA cells were transfected with control and GCA siRNAs and subjected to immunoblotting for LC3-I, LC3-II, MYC-tag and ACTB along with K562puro. (b) The same cells were immunostained for LC3 to visualize autophagosomes (green) and stained with DAPI for nuclei (blue). Scale bar, 10 μm. The area of LC3 is quantified by ImageJ software. The graph showed the average of three independent experiments with error bar (S.D.). Student’s t-test, *p < 0.05, ***p < 0.001 (c-d) K562 and K562IMres cells were subjected to the same experiment in Figure 4a–b. (e) The autophagic flux quantification of K562puro and K562GCA cells. The cells were treated with imatinib (0.5 µM) for 3 h with/without lysosomal inhibitors (NH4Cl & E-64-d). Representative western blots (left panel) and the graph show the average of three independent experiments (right panel). The error bars indicate the S.D. Student’s t-test, *p < 0.05, **p < 0.01. (f) K562 and K562IMres cells were subjected to the same experiment for the autophagy flux quantification in Figure 4e.
GCA inhibited proteasomal degradation of ULK1
The regulation of ULK1 is a key mechanism underlying autophagy activation [Citation19]. Interestingly, K562IMres cells showed high-level expression of ULK1 (), which was reduced by GCA knockdown (). Consistently, K562GCA showed higher levels of ULK1 protein (), suggesting that GCA expression is positively correlated with ULK1 expression. The protein stability assay of ULK1 using cyclohexamide revealed that ULK1 was more stable when GCA was highly expressed and vice versa ( and S9a). As shown in , ULK1 was greatly increased within the imatinib treatment period in K562GCA cells compared with K562puro cells. In striking contrast, ULK1 was almost unchanged during imatinib treatment when GCA was knocked down (Figure S9b). These results suggested that GCA stabilized ULK1 under imatinib treatment.
Figure 5. GCA stabilized ULK1 by inhibiting its K48-linked ubiquitination. (a) K562 and K562IMres cells were subjected to immunoblotting for ULK1, GCA, and ACTB. (b) K562IMres cells were transfected with control, GCA #1 and #2 siRNAs. Cell lysates were subjected to immunoblotting for ULK1, GCA and ACTB. (c) K562puro and K562GCA cells were lysed and subjected to immunoblotting for ULK1, MYC-tag (GCA) and ACTB. (d) K562puro and K562GCA cells were treated with cycloheximide (CHX) for the indicated times and subjected to immunoblotting for ULK1, MYC-tag (GCA) and ACTB (top panel). Relative expression of ULK1 is graphed (bottom panel). (e) K562puro and K562GCA cells were treated with 250 nM imatinib for the indicated time. The cell lysates were immunoblotted analysis of ULK1, MYC-tag (GCA) and ACTB (top panel). Relative expression of ULK1 from 3 independent experiments is plotted (bottom panel). The error bars indicate the S.D. Student’s t-test, **p < 0.01. (f) K562puro and K562GCA cells were transfected with control (defined as ‘C’) and GCA siRNA and treated with/without 20 μM MG132 for 6 h. Cells were lysed and subjected to immunoblotting for ULK1, MYC-tag (GCA) and ACTB. (g) K562 cells were transfected with the indicated expression plasmids. Cell lysates were subjected to immunoprecipitation with anti-Flag antibody (for SFB-ULK1, SFB: S-tag, Flag-tag, and Biotin-tag). Cell lysates and immunoprecipitated samples were subjected to immunoblotting for HA (ubiquitin), Flag (ULK1) and MYC-tag (GCA).
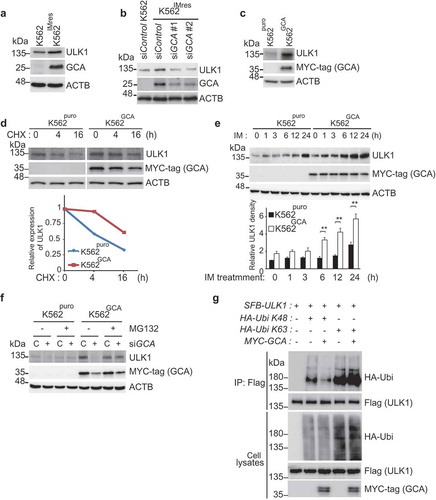
ULK1 protein level is controlled by proteasomal degradation [Citation38]. As shown in , the protein level of ULK1 was increased in K562GCA cells (lane 5) and successfully decreased by GCA knockdown (lane 6). Interestingly, treatment with proteasomal inhibitor (MG132) restored ULK1 protein level in GCA knocked down cells (lane 8) suggesting that GCA stabilized ULK1 by inhibiting its proteasomal degradation. K48-linked and K63-linked polyubiquitination of ULK1 mediates proteasomal degradation [Citation39] and self-association respectively [Citation19,Citation40]. To determine the polyubiquitination chain type of ULK1 induced by GCA, HA-tagged K48 only or K63 only ubiquitin was expressed with ULK1 and GCA (). Overexpressed GCA inhibited K48-linked polyubiquitination of ULK1 (lane 3), which is extensively linked to proteasomal degradation [Citation39]. In contrast, GCA overexpression induced K63-linked polyubiquitination of ULK1 (lane 5) linked to autophagy activation [Citation19,Citation40].
GCA induced k63-linked polyubiquitination of TRAF6 resulting in its dimerization and activation to ubiquitinate ULK1
TRAF6 is an ubiquitin ligase mediating K63-linked polyubiquitination for itself and ULK1 resulting in their homodimerization and autophagy activation [Citation19]. We showed that self-ubiquitination of TRAF6 was increased by GCA overexpression (), which was inhibited by knockdown of endogenous GCA () indicating the role of GCA in the self-ubiquitination of TRAF6. To determine the chain type of polyubiquitination by GCA, HA-tagged K48 only or K63 only ubiquitin was expressed with TRAF6 and GCA (). Importantly, overexpressed GCA induced K63-linked polyubiquitination (lane 5) but not K48-linked polyubiquitination of TRAF6 (lane 3). It has been reported that K63-linked polyubiquitination of TRAF6 induces its dimerization to activate downstream signaling [Citation41]. To address the role of GCA in TRAF6 dimerization, we transfected Flag-TRAF6, HA-TRAF6 and GCA expression plasmids into K562 cells followed by immunoprecipitation with anti-Flag antibody (). HA-TRAF6 was co-immunoprecipitated with Flag-TRAF6 (lane 1), which was induced by GCA expression (lane 3). Taken together, GCA activated self K63-linked polyubiquitination of TRAF6 resulting in its homo-dimerization.
Figure 6. GCA activated TRAF6-dependent K63-linked ubiquitination of ULK1. (a) The effect of GCA expression in TRAF6 ubiquitination. Flag-TRAF6, MYC-tagged GCA (MYC-GCA) and HA-Ubi expression plasmids were transfected into the K562 cell as an indicated combination. Cells were lysed and subjected to immunoprecipitation using anti-Flag antibody. Cell lysates and immunoprecipitated samples were analyzed by immunoblotting using anti-Flag, HA and MYC antibodies. (b) Flag-TRAF6, HA-Ubi were co-transfected into K562 cells with control and GCA specific siRNA as indicated combination and ‘C’ indicated a control siRNA. Cell lysates and immunoprecipitated samples were subjected to immunoblotting using anti-Flag and -HA antibodies. (c) GCA activates TRAF6-dependent K63-linked ubiquitination. K562 cells were transfected with the indicated expression plasmids and immunoprecipitated with anti-Flag antibody (TRAF6). Cell lysates and immunoprecipitated samples were subjected to immunoblotting analysis of HA (ubiquitin), Flag (TRAF6) and MYC-tag (GCA). (d) The effect of GCA expression in TRAF6 dimerization. K562 cells were transfected with Flag-TRAF6, HA-TRAF6 and MYC-GCA as an indicated combination. Cell lysates were subjected to immunoprecipitation with anti-Flag antibody. Cell lysates and immunoprecipitated samples were subjected to immunoblotting using anti-HA, Flag and MYC antibodies. (e) GCA induces TRAF6-dependent ubiquitination of ULK1. K562 cells were transfected with the indicated expression plasmids and immunoprecipitated with anti-Flag antibody (ULK1). Cell lysates and immunoprecipitated samples were subjected to immunoblotting analysis for MYC-tag (ubiquitin), Flag (ULK1) and HA (TRAF6). (f) K562 cells were cotransfected with SFB-ULK1, MYC-Ubi and HA-TRAF6 expression plasmids in combination with control ‘C’ and GCA siRNA. Cell lysates and immunoprecipitated samples were subjected to immunoblotting using anti-Flag, -MYC and -HA antibodies. (g) K562 cells were cotransfected with the indicated expression plasmids in combination with control and TRAF6 siRNA. Cell lysates were immunoprecipitated with anti-Flag antibody (ULK1). Cell lysates and immunoprecipitated samples were subjected to immunoblotting analysis of MYC-tag and Flag.
To investigate TRAF6 activation by GCA to ubiquitinate ULK1, we tested whether GCA induces a TRAF6-dependent ubiquitination of ULK1. As shown in , the overexpressed GCA induced ULK1 ubiquitination by TRAF6 (lane 4). We also showed inhibition of TRAF6-mediated ubiquitination of ULK1 by endogenous GCA knockdown (). Importantly, GCA-induced ULK1 ubiquitination was inhibited by endogenous TRAF6 knockdown (, lane 4). Taken together, GCA activates TRAF6 via K63-linked polyubiquitination to promote the K63-linked ubiquitination of ULK1.
GCA-TRAF6-ULK1 regulatory axis controlled imatinib resistance through induction of autophagy
To address the role of the GCA-TRAF6-ULK1 regulatory axis in autophagy, we investigated the role of endogenous TRAF6 or ULK1 knockdown in the inhibition of autophagy of K562IMres cells and K562GCA cells. As shown in -d, TRAF6 or ULK1 knockdown inhibited LC3-II and autophagosome formation in both K562GCA and K562IMres, suggesting that the GCA-TRAF6-ULK1 regulatory axis controls autophagy. Notably, the ULK1 protein level was increased in K562IMres and K562GCA cells, which was not reduced by TRAF6 knockdown indicating that TRAF6 was not responsible for ULK1 stabilization in those cells ( and , lane 4).
Figure 7. GCA induced autophagy through ULK1-TRAF6 regulatory axis to control imatinib resistance. (a) K562 and K562IMres cells were transfected with control, ULK1 or TRAF6 siRNAs. Cell lysates were subjected to immunoblotting analysis of LC3-I, LC3-II, ULK1, TRAF6, GCA and ACTB. (b) The same samples were immunostained with LC3 to visualize autophagosomes (green) and DAPI for nuclei (blue). Scale bar: 10 μm. (c) K562puro and K562GCA cells were transfected with control, ULK1 or TRAF6 siRNAs. Cell lysates were subjected to immunoblotting for LC3-I, LC3-II, ULK1, TRAF6, MYC-tag GCA and ACTB. (d) The same samples were immunostained with LC3 to visualize autophagosomes (green) and DAPI for nuclei (blue). Scale bar: 10 μm. (e-f) K562 cells were transfected with control and 3 independent ULK1 siRNAs (e) or 3 independent TRAF6 siRNAs (f) and subjected to apoptosis analysis by FACS. The ratio (%) of the apoptotic cell was graphed with S.D. as error bar (top panel) and knockdown efficiency checked using western blot indicated antibodies (bottom panel). Student’s t-test, **p < 0.01.
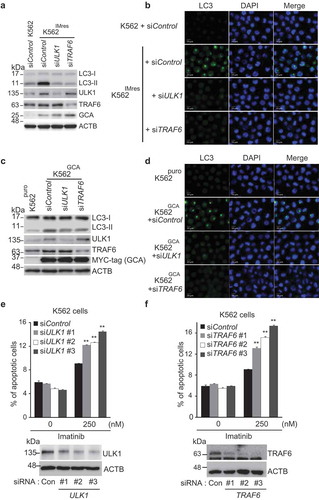
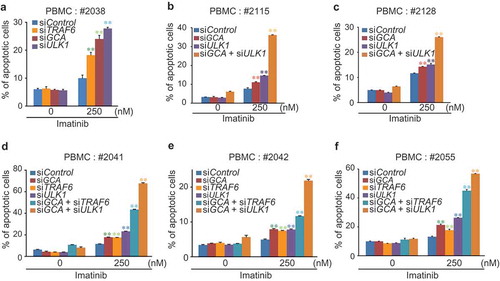
To determine if the GCA-TRAF6-ULK1 regulatory axis controlled imatinib resistance, we showed that imatinib-induced apoptosis was significantly increased in three independent TRAF6 or ULK1 siRNA-transfected K562 cells (-f and S10a-b). Importantly, we examined the hypothesis in primary CML cells derived from CML-CP patients. Although the degree of apoptosis varied among patient-derived primary CML cells, a single knockdown of GCA, ULK1 or TRAF6 consistently induced higher levels of apoptosis after imatinib treatment ( and S11a). In addition, a double-knockdown of GCA & ULK1 or GCA & TRAF6 significantly increased apoptotic cell death after imatinib treatment (-f and S11b-f) indicating synergistic effect. These data indicated that GCA plays a critical role in imatinib-induced apoptosis via TRAF6-ULK1 autophagy regulatory axis.
Figure 8. GCA-TRAF6-ULK1 regulatory axis controlled imatinib resistance in CML-CP patient-derived primary CML cells. PBMCs from 6 independent CML-CP patients (a) #2038, (b) #2115, (c) #2128, (d) #2041, (e) #2042 and (f) #2055 were transfected with indicated siRNAs and treated with/without 250 nM imatinib for 48 h followed by FACS analysis for apoptotic cells. The graph shows the average of three independent experiments. The error bars indicate the S.D. Student’s t-test, **p < 0.01.
GCA controlled imatinib resistance without altering tumor growth
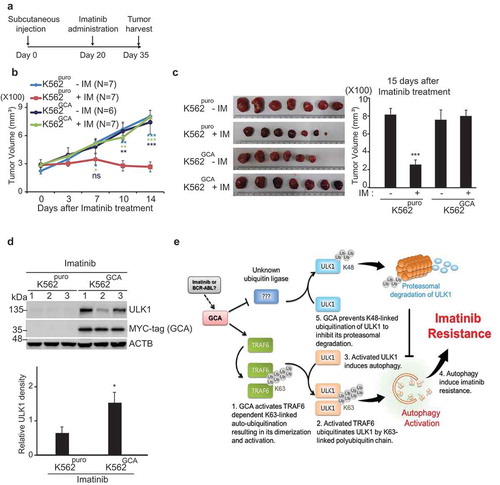
To test if GCA expression enhanced imatinib resistance in vivo, we used a mouse xenograft model. K562puro and K562GCA cells were subcutaneously injected into mice. After 20 days of injection, imatinib was orally administered for another 15 days and the tumor size was monitored (). Before imatinib administration, there was no significant difference in tumor volume between mice injected with K562puro and K562GCA cells indicating that GCA did not affect tumor growth (Figure S12a). We also found that cell growth rates were not different between K562puro and K562GCA cells (Figure S12b). During imatinib treatment for another 15 days, imatinib successfully reduced tumor size in K562puro-injected mice group (, red line). In contrast, xenograft tumors produced by K562GCA cells did not show a significant change in tumor size (, dark blue line). After 35 days of injection, all mice were sacrificed, and tumors were dissected for further analysis. As shown in , imatinib treatment greatly reduced the tumor size in K562puro-injected mice. However, the tumor size of K562GCA-injected mice was not altered by imatinib treatment, suggesting that GCA regulated imatinib resistance in vivo. Notably, the ULK1 protein level was higher in K562GCA than in K562puro xenograft tumors with imatinib administration, suggesting that GCA play a role in ULK1 protein stability (). Additionally, we demonstrated that the phosphorylation of STAT5, a BCR-ABL substrate, was reduced by imatinib treatment in both CML cells and CML cells-derived tumors indicating the proper inhibitory effect of imatinib for BCR-ABL kinase (Figure S13a-b).
Figure 9. GCA controlled the imatinib resistance without an influence on tumor growth. (a) Experimental design for the analysis of imatinib resistance using Xenograft. K562puro and K562GCA cells were subcutaneously injected. After 20 days of tumor cell injection, imatinib was administered for another 15 days. (b) Tumor growth of K562puro and K562GCA cells after imatinib treatment. After 20 days of tumor injection, K562puro and K562GCA cells were divided into control and imatinib treatment group (oral). Tumor size was measured at 0, 3, 7, 10, 14 days of imatinib administration. Tumor volume was plotted with S.E. as error bar (ns: no significant, *: p < 0.05 **: p < 0.01, ***: p < 0.001) (right panel). (c) Xenograft tumor was dissected at 35 days after injection and imaged with scale (left panel). Tumor volume was measured and plotted with S.E. as error bar (***: p < 0.001) (right panel). (d) Dissected tumors were lysed and subjected to immunoblotting for ULK1, MYC-tag (GCA) and ACTB (top panel). The relative intensity of ULK1 (ULK1:ACTB) was graphed with S.D. as error bar (*: p < 0.05) (bottom panel). (e) The proposed model of GCA-TRAF6-ULK1 regulatory axis to induce autophagy resulting in imatinib resistance.
In conclusion, we demonstrated that GCA was highly expressed in both imatinib-resistant K562 cells and primary patient cells, suggesting GCA was a potential genetic marker for imatinib resistance. We also showed that GCA stabilized ULK1 by inhibiting its proteasomal degradation and activated autophagy by controlling TRAF6-dependent K63-linked ubiquitination of ULK1, which is a critical regulatory axis in imatinib resistance ().
Discussion
For more than a decade, imatinib methylate was considered as the first ‘targeted’ anticancer drug with clinical success [Citation9,Citation42]. Despite these impressive results, a minority of CML patients in chronic phase (CML-CP) and a significant proportion of CML patients in advanced phase are either initially resistant to imatinib treatment or acquire imatinib insensitivity over time [Citation13,Citation43]. The contribution to such secondary resistance by mutations in the BCR-ABL kinase domain was much lower in patients with CP than in advanced phase [Citation44,Citation45], underscoring the significance of BCR-ABL-independent mechanism for imatinib resistance.
In microarray screening of imatinib-resistant patient samples without BCR-ABL mutations and imatinib resistant K562 cells (K562IMres), we found that GCA, ADM, LRMP, PTPRC, SYK and TAP1 are highly expressed. Among them, GCA was identified as a potential novel regulator of imatinib-resistance and GCA knockdowned CML cells was most sensitive to imatinib-induced apoptosis. This conclusion was further confirmed by a murine xenograft experiment demonstrating that GCA expression enhanced imatinib resistance. These results indicate that GCA is a critical regulator as well as a genetic marker for imatinib resistance. Interestingly, GCA overexpression failed to induce in vitro cell growth as well as in vivo tumor growth (Figure S12), rather it regulates imatinib resistance. Notably, GCA expression was greatly increased by imatinib treatment of CML-CP patients (). In contrast, GCA expression was reduced in imatinib sensitive CML patients suggesting that GCA is a key regulator underlying imatinib resistance in CML.
GCA is specifically expressed in cells of myeloid lineage, such as neutrophils and monocytes/macrophages, and is known as a cytosolic protein that is translocated to granules and plasma membrane upon neutrophil activation [Citation26,Citation46]. Based on available evidences supporting the role of GCA in cytoplasmic localization, myeloid lineage-specific expression and imatinib resistance in CML, it is plausible that GCA plays a critical role in cytoplasmic mechanisms that regulate imatinib resistance, possibly via autophagy. Autophagy is considered key to understanding BCR-ABL1-independent imatinib resistance, although the mechanism has yet to be fully characterized [Citation24,Citation47]. Here, we showed GCA overexpression itself activates autophagy, resulting in imatinib resistance in leukemia cells and vice versa (). These results point to GCA as a novel regulator of autophagy, related to imatinib resistance in CML-CP.
GCA interacts with TLR9 activating TRAF6-mediated proinflammatory cytokine/chemokine production [Citation29]. TRAF6, a specific RING finger E3 ubiquitin ligase, has been proposed to mediate the Lys63 ubiquitination of ULK1 contributing to ULK1 activation, which induces autophagy [Citation19]. Based on the foregoing studies, we demonstrated that GCA activates TRAF6-dependent K63-linked ubiquitination of TRAF6 and ULK1 () and also inhibits TRAF6-independent K48 ubiquitination of ULK1 () to induce autophagy resulting in imatinib resistance in CML (). We further showed that imatinib resistance was abolished by the inhibition of GCA, TRAF6 or ULK1 in the cells of CML patients (), indicating that GCA controls imatinib resistance in CML via TRAF6-ULK1 autophagy regulatory axis.
GCA regulates protein stability of ULK1 by inhibiting K48-linked polyubiquitination (). However, TRAF6 does not mediate GCA-induced ULK1 stabilization ( and ) or K48-linked ubiquitination of ULK1 () suggesting the role of another ubiquitin ligase. It was reported that ULK1 undergoes K48-linked polyubiquitination mediated by another ubiquitin ligase, CUL3-KLHL20, for degradation during prolonged autophagy [Citation48]. Thus, it is plausible that GCA inhibits CUL3-KLHL20 or another K48-linked ubiquitin ligase to stabilize ULK1. These phenomena explain the synergistic effect of GCA with ULK1 or TRAF6 dual knockdown on imatinib-induced apoptosis.
In this paper, we do not have a chance to address how imatinib induces GCA expression. Interestingly, it has been reported that imatinib treatment induces the expression of MIR146A in CML patients [Citation49,Citation50]. Notably, MIR146A induces GCA expression in hepatic stellate cells [Citation51]. Taken together, it is plausible that MIR146A also induces GCA expression in CML patients after imatinib treatment. In addition, we could not exclude the possibility that BCR-ABL regulates GCA expression. Therefore, it would be a valuable future study to address the role of MIR146A or BCR-ABL on GCA induction in response to imatinib.
In summary, we identified GCA as a novel regulator of imatinib resistance in CML. GCA stabilized and activated ULK1 to induce autophagy. We also highlighted the novel role of GCA in K63-linked ubiquitination of ULK1 by TRAF6 to activate autophagy resulting in imatinib resistance in CML. Notably, GCA regulated autophagy suggesting a novel therapeutic strategy in TKI-resistant CML patients.
Materials and methods
Patient samples and cell lines
Peripheral blood mononuclear cells (PBMCs) were obtained from 32 CML-CP patients after diagnosis (Dx), imatinib treatment for 6 months with major molecular response (MMR) or resistance (Resist). All patient characteristics/demographics were listed in Table S1. PBMCs were isolated by Ficoll-Paque (GE Healthcare, 17,144,003) density-gradient centrifugation. The 11 CML-CP patients (GS: good response and PR: primary resistance) provided PBMCs after 6 months of imatinib treatment for microarray analysis. Parental K562, imatinib-resistant K562 (K562IMres), MYC-GCA stably expressing K562 (K562GCA) and its control (K562puro) cell lines were used for experiments. All patient samples were provided by the Korea Leukemia Bank and approved by Institutional Review Board (KC14SEME0280). Patient consent was obtained in accordance with the Declaration of Helsinki.
Cell culture
K562, K562IMres, K562puro and K562GCA cell line were maintained in RPMI medium (GIBCO, 11,875–093) supplemented with 10% fetal bovine serum (GIBCO, 12,483–020) at 37°C in 5% CO2 (v/v). To establish GCA stable cell lines, K562 cells were transfected with MYC-GCA expression plasmid or empty vector as a control, using microporation according to the manufacturer protocol (Neon system, Invitrogen). MYC-GCA stably expressed (K562GCA) and control K562 cells (K562puro) were selected with puromycin (2 µg/ml, GIBCO, A1113802) for 14 days.
Transfection
Transient transfection was performed using the Neon Transfection System (Invitrogen, Carlsbad, CA, USA) according to the manufacturer’s protocol. Briefly, K562 cells or PBMCs (2x10⁶ ~ 1x10⁷cells) were transfected with total 20 µg of plasmid or 200 nM siRNAs using microporator (1450 V for 15 ms in 2 pulses for K562 cells; 1,750 V for 20 ms in 1 pulse for PBMCs) and incubated in pre-warmed RPMI medium (GIBCO, 11,875–093) supplemented with 10% FBS (GIBCO, 12,483–020) for 24 h or 48 h. siRNA sequences are provided in supplementary information.
Chemicals
Imatinib mesylate (Selleckchem, S1026) was dissolved in DMSO at a stock concentration of 10 mM stock and stored at −20°C. Puromycin was purchased from Invivogen (Invivogen, ant-pr-1). MG132 (AG scientific, M-1157) was dissolved in DMSO and stored at −20°C, and lysosome inhibition was achieved using 20 mM NH4Cl (Sigma-Aldrich, A9434) and 10 µg/ml E-64-d (Santa Cruz Biotechnology, sc-201280A).
Plasmids
The GCA (hMU009399) clone was obtained from the Korea Human Gene Bank, Medical Genomics Research center, KRIBB, Korea. The MYC-GCA expression vector, MYC-GCA internal deletion mutants or GCA siRNA resistance plasmid were generated by PCR. The Flag-TRAF6, ULK1 expression plasmid was kindly provided by Dr. Seok Hee Park (Sungkyunkwan University, Korea). SFB-ULK1 was cloned into a Gateway-compatible destination vector harboring an N-terminal SFB tag (S-protein, a FLAG epitope, and a streptavidin-binding peptide). The HA-TRAF6 expression plasmid was kindly provided by Dr. Sungkyu Park (GIST, Korea).
Antibodies
The rabbit anti-GCA antibody was produced by immunizing rabbits with the full sequence of the GCA protein expressed in a GST-vector. The rabbit polyclonal anti-GCA antibodies were affinity-purified using the Aminolink Coupling Gel Column Kit (ThermoFisher Scientific, 20,501). Human anti-ULK1 (Cell Signaling Technology, 8054), and anti-LC3A/B (Cell Signaling Technology, 12,741), anti-MYC (Roche, 11,814,150,001), anti-TRAF6 (Santa Cruz Biotechnology, sc-8409), anti-HA (Roche, 12,013,819,001), anti-Flag (Sigma-Aldrich, F3165), and anti-ACTB (Sigma-Aldrich, A5316) antibodies were purchased.
Apoptosis assay
Apoptosis assay was performed using the FITC ANXA5 (annexin A5) Apoptosis Detection Kit I (BD bioscience, 556,547) according to the manufacturer’s protocol. Briefly, K562 cells or PBMCs were transfected with the indicated plasmids or siRNA in the figure legend. After 48 h, the transfected K562 cells were plated in the flask or culture dish and treated with the indicated concentration of imatinib for 48 h. These cells were analyzed by fluorescence-activated cell sorting, FACS (BD Bioscience, San Jose, CA, USA).
Flow cytometry for GCA and p-CrkL expression
PBMC from imatinib resistant CML patient (#1420) were fixed with 1% PFA for 15 min. The cells were permeabilized with PBT (0.2% Tween, 2% FBS (GIBCO, 12,483–020) in PBS (GIBCO, 10,010,023)), for 15 min. The cells were stained with anti-GCA (1:50) for 1 h on ice. The cells were washed twice and co-stained with PE-conjugated-anti-p-CrkL (BD Bioscience, 560,788) and FITC-conjugated anti-rabbit antibody (Jackson ImmunoResearch, 111–095-144) for 30 min. The cells were washed twice with PBS and subjected to FACS analysis (BD Bioscience, San Jose, CA, USA).
Autophagic flux assay
Autophagic flux assay was analyzed essentially as previously described [Citation52–Citation54]. Briefly, K562 cells were treated with imatinib (0.5 µM) for 3 h with/without a combination of E-64d (10 µg/ml) plus NH4Cl (20 mM) to inhibit lysosomal proteases and neutralize lysosomal pH, respectively. The treated cells were subjected to western blot analysis using LC3 and ACTB antibodies. The LC3-II bands were quantified using Fusion Solo ChemiDoc system (Vilber, Collégien, France) and normalized to ACTB bands. Autophagy flux is calculated by subsidizing the lysosomal inhibitor-treated cells to non-treatment cells in both basal and imatinib-treated condition.
Immunoprecipitation and western blot
K562 cells were transfected with indicated expression plasmids in each figure legend. After 48 h, the cells were lysed in NETN buffer for 30 min on ice. Crude lysates were cleared by centrifugation at 11,400 x g at 4°C for 15 min and supernatants were incubated with protein A- or G-agarose-conjugated primary antibodies. The immunocomplexes were washed three times with NETN buffer and subjected to sodium dodecyl sulfate-polyacrylamide gel electrophoresis (SDS-PAGE). Western blotting was performed using the antibodies indicated in the figure legends. The antibody dilutions for western blot were 1:1000 in 1% or 5% skim milk or 4% BSA. HRP-conjugated anti-rabbit IgG (Sigma-Aldrich, A0545) or anti-mouse IgG (Sigma-Aldrich, A9917) IgG were used for detection. The immunoreactive protein signals were identified using home-made electrochemiluminescence (ECL) detection reagents. The signal intensity of detected protein was normalized to that of ACTB (Sigma-Aldrich, A5441) and analyzed using Fusion Solo ChemiDoc system (Vilber, Collégien, France) and Bio1D software (Fisher biotech, Australia). All targeted proteins and internal loading controls were detected and verified within the same linear range.
Cell viability assay
Cell proliferation was determined by the 3-[4,5-dimethylthiazol-2-yl]-2,5 diphenytetrazolium bromide (MTT; Sigma, M5655). 2 × 10⁴ cells/100 µL were seeded in a 96-well, flat-bottom plate and treated with different concentrations of imatinib for 48 h. 10 µL/well MTT (5 mg/mL) were added and the plate was incubated for 2–4 h. The plate was centrifuged at 125 x g for 10 min and the supernatant were removed. 100 µL of dimethyl sulfoxide (DMSO) were added to each well to solubilize the formazan crystals. Absorbance was measured at 570 nm using a microplate reader (VersaMax, Molecular Devices, San Jose, CA, USA).
qRT-PCR
Total RNA was extracted with 1 ml of TRI reagent (Molecular Research Center, TR 118) as the manufacture’s protocol. 1 ug of total RNA was reverse transcribed using ReverTra Ace® qPCR RT Master Mix with gDNA Remover (Toyobo, FSQ-301). A quantitative real-time PCR (qRT-PCR) was performed using a SYBR ® Green Realtime PCR Master Mix (Toyobo, QPK-201). The temperature profile for the reaction was as follows: 95°C for 30 s; 95°C for 5 s; 55°C for 10 s; 72°C for 15 s for 40 cycles and melting curve were analyzed with a ramp speed of 0.2°C increment between 95°C and 65°C. The relative quantity was determined by the comparative threshold cycle (Ct) method, and the results were normalized by GAPDH. Primers are listed in supplementary information.
Immunofluorescence staining
K562 cells were seeded on lysine-coated slides by cytocentrifuge, then fixed with 4% paraformaldehyde at room temperature for 10 min. The fixed cells were permeabilized with 0.2% Triton X-100 (Sigma-Aldrich, T8787) in PBS at room temperature for 5 min and blocked with 5% goat serum (Invitrogen, 10000C) in PBS (GIBCO, 10,010,023) at room temperature for 1 h. The cells were incubated overnight with primary antibody at 4°C and then incubated with the secondary antibodies after washing with 0.1% Triton X-100 in PBS. The cells were finally mounted using DAPI Fluoromount-G (Invitrogen, 00–4958-02) and covered by coverslips. Fluorescent images were captured by Olympus microscope BX53 using MetaVue software under the same conditions.
Murine xenograft experiment
Animals were purchased from Nara Biotech in Korea and housed in the pathogen-free mouse facility of Chungnam National University. All procedures for animal experiments were approved by the Institutional Animal Care and Use Committee (CNU-00772). Five-week-old female BALB/c nu/nu mice were subcutaneously injected with 1 × 10⁷ cells/100 μl of either K562puro or K562GCA CML cells in 1X PBS mixed with matrigel® Matrix (Corning, 356,237) per mouse. Twenty days after injection, mice were randomly divided into 4 groups (n = 6 or 7) according to tumor volume of approximately 200 mm3. We excluded mice with tumors less than 200 mm3. We administered either imatinib (100 mg/kg/day) or vehicle (0.5% methylcellulose) daily. Tumor volumes were measured every 3 or 4 days interval for 15 days. Tumor volumes were calculated using the formula (L× W2/2), where L denotes the largest tumor diameter and W represents the smallest tumor diameter. After 15 days of treatment, mice were sacrificed, and tumors were harvested and subjected to western blot.
Statistics
Statistical analysis was performed using the student’s t-test. All experiments were performed at least three times and graphs represent the average of three independent experiments. The error bars indicate the SEM or S.D. P < 0.05 was considered statistically significant.
Supplemental Material
Download Zip (27.4 MB)Acknowledgments
We thank the Korea Leukemia Bank for providing the CML samples and Sophors Phorl for critical reading.
Disclosure statement
No potential conflict of interest was reported by the authors.
Supplementary material
Supplementary data can be accessed here
Additional information
Funding
Related Research Data
References
- Fialkow PJ, Jacobson RJ, Papayannopoulou T. Chronic myelocytic leukemia: clonal origin in a stem cell common to the granulocyte, erythrocyte, platelet and monocyte/macrophage. Am J Med. 1977;63:125–130.
- Kurzrock R, Gutterman JU, Talpaz M. The molecular genetics of Philadelphia chromosome-positive leukemias. N Engl J Med. 1988;319:990–998.
- Bartram CR, de Klein A, Hagemeijer A, et al. Translocation of c-ab1 oncogene correlates with the presence of a Philadelphia chromosome in chronic myelocytic leukaemia. Nature. 1983;306:277–280.
- Lugo TG, Pendergast AM, Muller AJ, et al. Tyrosine kinase activity and transformation potency of bcr-abl oncogene products. Science. 1990;247:1079.
- Bj D, Tamura S, Buchdunger E, et al. Effects of a selective inhibitor of the Abl tyrosine kinase on the growth of Bcr-Abl positive cells. Nat Med. 1996;2:561–566.
- Druker BJ, Talpaz M, Resta DJ, et al. Efficacy and safety of a specific inhibitor of the BCR-ABL tyrosine kinase in chronic myeloid leukemia. N Engl J Med. 2001;344:1031–1037.
- Jabbour EJ, Cortes JE, Kantarjian HM. Tyrosine kinase inhibition: A therapeutic target for the management of chronic-phase chronic myeloid leukemia. Expert Rev Anticancer Ther. 2013;13:1433–1452.
- Woessner DW, Lim CS, Deininger MW. Development of an effective therapy for chronic myelogenous leukemia. Cancer J. 2011;17:477–486.
- Druker BJ, Guilhot F, O’Brien SG, et al. Five-year follow-up of patients receiving imatinib for chronic myeloid leukemia. N Engl J Med. 2006;355:2408–2417.
- Baccarani M, Cortes J, Pane F, et al. Chronic myeloid leukemia: an update of concepts and management recommendations of European LeukemiaNet. J Clin Oncol. 2009;27:6041–6051.
- Apperley JF. Part I: mechanisms of resistance to imatinib in chronic myeloid leukaemia. Lancet Oncol. 2007;8:1018–1029.
- Bixby D, Talpaz M. Seeking the causes and solutions to imatinib-resistance in chronic myeloid leukemia. Leukemia. 2011;25:7–22.
- Hochhaus A, La Rosee P. Imatinib therapy in chronic myelogenous leukemia: strategies to avoid and overcome resistance. Leukemia. 2004;18:1321–1331.
- Donato NJ, Wu JY, Stapley J, et al. Imatinib mesylate resistance through BCR-ABL independence in chronic myelogenous leukemia. Cancer Res. 2004;64:672.
- Khorashad JS, Anand M, Marin D, et al. The presence of a BCR-ABL mutant allele in CML does not always explain clinical resistance to imatinib. Leukemia. 2006;20:658–663.
- Ma L, Shan Y, Bai R, et al. A therapeutically targetable mechanism of BCR-ABL-independent imatinib resistance in chronic myeloid leukemia. Sci Transl Med. 2014;6:252ra121.
- Yorimitsu T, Klionsky DJ. Autophagy: molecular machinery for self-eating. Cell Death Differ. 2005;12:1542–1552.
- Kim J, Kundu M, Viollet B, et al. AMPK and mTOR regulate autophagy through direct phosphorylation of Ulk1. Nat Cell Biol. 2011;13:132–141.
- Nazio F, Strappazzon F, Antonioli M, et al. mTOR inhibits autophagy by controlling ULK1 ubiquitylation, self-association and function through AMBRA1 and TRAF6. Nat Cell Biol. 2013;15:406–416.
- Ertmer A, Huber V, Gilch S, et al. The anticancer drug imatinib induces cellular autophagy. Leukemia. 2007;21:936.
- Sheng Z, Ma LY, Sun JYE, et al. BCR-ABL suppresses autophagy through ATF5-mediated regulation of mTOR transcription. Blood. 2011;118:2840–2848.
- Sehgal AR, Konig H, Johnson DE, et al. You eat what you are: autophagy inhibition as a therapeutic strategy in leukemia. Leukemia. 2015;29:517–525.
- Helgason GV, Karvela M, Holyoake TL. Kill one bird with two stones: potential efficacy of BCR-ABL and autophagy inhibition in CML. Blood. 2011;118:2035.
- Bellodi C, Lidonnici MR, Hamilton A, et al. Targeting autophagy potentiates tyrosine kinase inhibitor-induced cell death in Philadelphia chromosome-positive cells, including primary CML stem cells. J Clin Invest. 2009;119:1109–1123.
- Karvela M, Baquero P, Kuntz EM, et al. ATG7 regulates energy metabolism, differentiation and survival of Philadelphia-chromosome-positive cells. Autophagy. 2016;12:936–948.
- Boyhan A, Casimir CM, French JK, et al. Molecular cloning and characterization of grancalcin, a novel EF-hand calcium-binding protein abundant in neutrophils and monocytes. J Biol Chem. 1992;267:2928–2933.
- Teahan CG, Totty NF, Segal AW. Isolation and characterization of grancalcin, a novel 28 kDa EF-hand calcium-binding protein from human neutrophils. Biochem J. 1992;286(Pt 2):549–554.
- Maki M, Narayana SV, Hitomi K. A growing family of the Ca2+-binding proteins with five EF-hand motifs. Biochem J. 1997;328(Pt 2):718–720.
- Kim TW, Hong S, Talukder AH, et al. Grancalcin (GCA) modulates Toll-like receptor 9 (TLR9) mediated signaling through its direct interaction with TLR9. Eur J Immunol. 2016;46:712–724.
- Roes J, Choi BK, Power D, et al. Granulocyte function in grancalcin-deficient mice. Mol Cell Biol. 2003;23:826–830.
- Kim TM, Ha SA, Kim HK, et al. Gene expression signatures associated with the in vitro resistance to two tyrosine kinase inhibitors, nilotinib and imatinib. Blood Cancer J. 2011;1:e32.
- Wolf A, Couttet P, Dong M, et al. Imatinib does not induce cardiotoxicity at clinically relevant concentrations in preclinical studies. Leuk Res. 2010;34:1180–1188.
- Tazzari M, Indio V, Vergani B, et al. Adaptive immunity in fibrosarcomatous dermatofibrosarcoma protuberans and response to imatinib treatment. J Invest Dermatol. 2017;137:484–493.
- Atwell S, Adams JM, Badger J, et al. A novel mode of Gleevec binding is revealed by the structure of spleen tyrosine kinase. J Biol Chem. 2004;279:55827–55832.
- Drube J, Ernst T, Pfirrmann M, et al. PTPRG and PTPRC modulate nilotinib response in chronic myeloid leukemia cells. Oncotarget. 2018;9:9442–9455.
- Manic G, Obrist F, Kroemer G, et al. Chloroquine and hydroxychloroquine for cancer therapy. Mol Cell Oncol. 2014;1:e29911.
- Klionsky DJ, Abeliovich H, Agostinis P, et al. Guidelines for the use and interpretation of assays for monitoring autophagy in higher eukaryotes. Autophagy. 2008;4:151–175.
- Joo JH, Dorsey FC, Joshi A, et al. Hsp90-Cdc37 chaperone complex regulates Ulk1- and Atg13-mediated mitophagy. Mol Cell. 2011;43:572–585.
- Jiao H, Su GQ, Dong W, et al. Chaperone-like protein p32 regulates ULK1 stability and autophagy. Cell Death Differ. 2015;22:1812–1823.
- Nazio F, Cecconi F. mTOR, AMBRA1, and autophagy: an intricate relationship. Cell Cycle. 2013;12:2524–2525.
- Deng L, Wang C, Spencer E, et al. Activation of the I kappa B kinase complex by TRAF6 requires a dimeric ubiquitin-conjugating enzyme complex and a unique polyubiquitin chain. Cell. 2000;103:351–361.
- Bjorkholm M, Ohm L, Eloranta S, et al. Success story of targeted therapy in chronic myeloid leukemia: a population-based study of patients diagnosed in Sweden from 1973 to 2008. J Clin Oncol. 2011;29:2514–2520.
- Hochhaus A, O’Brien SG, Guilhot F, et al. Six-year follow-up of patients receiving imatinib for the first-line treatment of chronic myeloid leukemia. Leukemia. 2009;23:1054–1061.
- Soverini S, Colarossi S, Gnani A, et al. Contribution of ABL kinase domain mutations to imatinib resistance in different subsets of Philadelphia-positive patients: by the GIMEMA working party on chronic myeloid leukemia. Clin Cancer Res. 2006;12:7374–7379.
- Kim SH, Kim D, Kim DW, et al. Analysis of Bcr‐Abl kinase domain mutations in Korean chronic myeloid leukaemia patients: poor clinical outcome of P‐loop and T315I mutation is disease phase dependent. Hematol Oncol. 2009;27:190–197.
- Liu F, Shinomiya H, Kirikae T, et al. Characterization of murine grancalcin specifically expressed in leukocytes and its possible role in host defense against bacterial infection. Biosci Biotechnol Biochem. 2004;68:894–902.
- Salomoni P, Calabretta B. Targeted therapies and autophagy: new insights from chronic myeloid leukemia. Autophagy. 2009;5:1050–1051.
- Liu CC, Lin YC, Chen YH, et al. Cul3-KLHL20 ubiquitin ligase governs the turnover of ULK1 and VPS34 complexes to control autophagy termination. Mol Cell. 2016;61:84–97.
- Flamant S, Ritchie W, Guilhot J, et al. Micro-RNA response to imatinib mesylate in patients with chronic myeloid leukemia. Haematologica. 2010;95:1325.
- San José-Enériz E, Román-Gómez J, Jiménez-Velasco A, et al. MicroRNA expression profiling in Imatinib-resistant chronic myeloid leukemia patients without clinically significant ABL1-mutations. Mol Cancer. 2009;8:69.
- Maubach G, Lim MCC, Chen J, et al. miRNA studies in in vitro and in vivo activated hepatic stellate cells. World J Gastroenterol. 2011;17:2748–2773.
- Andreo U, Guo L, Chirieac DV, et al. Insulin-stimulated degradation of apolipoprotein B100: roles of class II phosphatidylinositol-3-kinase and autophagy. PLOS ONE. 2013;8:e57590.
- Klionsky DJ, Abdelmohsen K, Abe A, et al. Guidelines for the use and interpretation of assays for monitoring autophagy (3rd edition). Autophagy. 2016;12:1–222.
- Lee JY, Koga H, Kawaguchi Y, et al. HDAC6 controls autophagosome maturation essential for ubiquitin-selective quality-control autophagy. Embo J. 2010;29:969–980.