
ABSTRACT
Saturated fatty acid (SFA)-induced lipotoxicity is caused by the accumulation of reactive oxygen species (ROS), which is associated with damaged mitochondria. Moreover, lipotoxicity is crucial for the progression of nonalcoholic steatohepatitis (NASH). Autophagy is required for the clearance of protein aggregates or damaged mitochondria to maintain cellular metabolic homeostasis. The NFE2L2/NRF2 (nuclear factor, erythroid 2 like 2)-KEAP1 (kelch like ECH associated protein 1) pathway is essential for the elimination of ROS. ULK1 (unc-51 like autophagy activating kinase 1; yeast Atg1) is involved in the initiation of autophagy; however, its role in lipotoxicity-induced cell death in hepatocytes and mouse liver has not been elucidated. We now show that ULK1 potentiates the interaction between KEAP1 and the autophagy adaptor protein SQSTM1/p62, thereby mediating NFE2L2 activation in a manner requiring SQSTM1-dependent autophagic KEAP1 degradation. Furthermore, ULK1 is required for the autophagic removal of damaged mitochondria and to enhance binding between SQSTM1 and PINK1 (PTEN induced kinase 1). This study demonstrates the molecular mechanisms underlying the cytoprotective role of ULK1 against lipotoxicity. Thus, ULK1 could represent a potential therapeutic target for the treatment of NASH.
Abbreviations: ACTB: actin beta; CM-H2DCFDA:5-(and-6)-chloromethyl-2ʹ,7ʹ-dichlorodihydrofluorescein diacetate; CQ: chloroquine; CUL3: cullin 3; DMSO: dimethyl sulfoxide; GSTA1: glutathione S-transferase A1; HA: hemagglutinin; Hepa1c1c7: mouse hepatoma cells; HMOX1/HO-1: heme oxygenase 1; KEAP1: kelch like ECH associated protein 1; LPS: lipopolysaccharides; MAP1LC3/LC3: microtubule-associated protein 1 light chain 3; MAPK8/JNK: mitogen-activated protein kinase 8; MEF: mouse embryonic fibroblast; MFN1: mitofusin 1; MTT: 3-(4,5-dimethylthiazol-2-yl)-2,5-diphenyltetrazolium bromide; NASH: nonalcoholic steatohepatitis; NFE2L2/NRF2: nuclear factor, erythroid 2 like 2; NQO1: NAD(P)H quinone dehydrogenase 1; PA: palmitic acid; PARP: poly (ADP-ribose) polymerase 1; PINK1: PTEN induced kinase 1; PRKAA1/2: protein kinase AMP-activated catalytic subunits alpha1/2; PRKN/PARK2: parkin RBR E3 ubiquitin protein ligase; PRKC/PKC: protein kinase C; RBX1: ring-box 1; ROS: reactive oxygen species; SFA: saturated fatty acid; siRNA: small interfering RNA; SQSTM1/p62: sequestosome 1; TOMM20: translocase of outer mitochondrial membrane 20; TUBA: tubulin alpha; TUNEL: terminal deoxynucleotidyl transferase-mediated dUTP nick-end labeling; ULK1: unc-51 like autophagy activating kinase 1
Introduction
Nonalcoholic fatty liver disease (NAFLD) is a global health problem and an important risk factor for metabolic diseases including hepatic- and cardio-metabolic [Citation1]. NAFLD comprises a spectrum of diseases ranging from simple steatosis to nonalcoholic steatohepatitis (NASH) with inflammation and fibrosis [Citation2]. The pathogenesis of NASH can be explained by the ‘two-hit’ theory [Citation2,Citation3], wherein the first hit is an increase in the deposition of triglycerides in hepatocytes (hepatic steatosis) and second hits include reactive oxygen species (ROS), endoplasmic reticulum (ER) stress, and inflammation. Saturated fatty acid (SFA)-mediated lipotoxic stress induces hepatic apoptosis, which represents a key pathogenic feature of NASH [Citation4,Citation5].
The NFE2L2/NRF2 (nuclear factor, erythroid 2 like 2)-KEAP1 (kelch like ECH associated protein 1) pathway is essential for cytoprotection against oxidative stress [Citation6–Citation8]. Under normal conditions, KEAP1 acts as a suppressor of NFE2L2 activation through direct binding to the NFE2L2-CUL3-RBX1 complex, which leads to NFE2L2 degradation [Citation6,Citation7,Citation9,Citation10]. However, oxidative stress modifies cysteine residues of KEAP1, which disrupts the interaction with NFE2L2. Consequently, an increase in nuclear NFE2L2 activates the transcription of its target genes including NQO1 (NAD[P]H quinone dehydrogenase 1), HMOX1/HO-1 (heme oxygenase 1), and GSTA1 (glutathione S-transferase alpha 1) [Citation7]. SQSTM1/p62 is known as an autophagy receptor protein that can activate the NFE2L2-KEAP1 pathway through specific binding to KEAP1, which results in the stabilization of NFE2L2 [Citation9,Citation11]. Further, a previous study has shown that the SQSTM1-NFE2L2-KEAP1 pathway can protect cells against lipotoxicity [Citation12].
Autophagy is the process wherein the cytoplasmic components within lysosomes are degraded to maintain essential metabolic activity and cell viability in response to nutrient limitation [Citation13]. It contributes to basic liver function through the quality control of organelles and cytosolic proteins in hepatocytes [Citation14]. Moreover, mitochondria are multifunctional organelles that are essential for cellular ATP production, cellular metabolic activities, reactive oxygen species (ROS) generation, and programmed cell death. Autophagic degradation of damaged mitochondria, known as mitophagy, is a specific and selective form of autophagy that requires crosstalk between mitochondria and the autophagic machinery [Citation15].
ULK1 (unc-51 like autophagy activating kinase 1) is an autophagy initiation factor that can regulate mitochondrial homeostasis [Citation16]. However, its role in lipotoxicity remains unknown. Here, we now demonstrate that ULK1 protects cells from palmitic acid (PA)-induced lipotoxicity through autophagic KEAP1 degradation and resulting NFE2L2 activation, and through the removal of damaged mitochondria. We also provide the molecular mechanism underlying the cytoprotective role of ULK1 against lipotoxicity.
Results
ULK1 protects cells from lipotoxicity
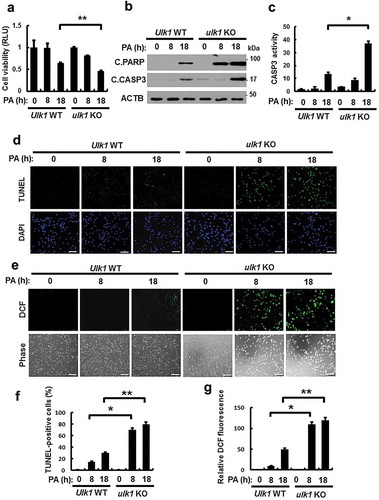
The SFA, palmitic acid (PA) is the most abundant fatty acid in human plasma [Citation17], and leads to oxidative stress-mediated cell death [Citation18,Citation19], which is known as lipotoxicity. To examine whether ULK1 protects cells against lipotoxicity, we treated Ulk1 WT or ulk1 KO mouse embryonic fibroblast (MEF) cells with PA for the indicated times. The ablation of Ulk1 resulted in a greater increase in PA-induced cell death, as measured by MTT assays ()) and TUNEL analysis (). To determine whether PA-mediated cell death occurs through the apoptotic pathway, we measured the expression levels of cleaved forms of PARP and CASP3 by immunoblot analysis. Levels of these proteins were markedly increased in ulk1 KO MEF cells ()). In addition, CASP3 activity was higher in the same cells ()). We found that ROS levels were increased by approximately 3-fold in ulk1 KO MEF cells with PA treatment compared with Ulk1 WT MEF cells (,)). We also examined whether ULK1 protects cells against cytokine-mediated cell death. Several studies have reported that cytokines such as TNF, as well as lipopolysaccharides (LPS) and TGFB1-mediated ROS generation triggers cell death [Citation20–Citation22]. To examine the regulation of ROS by ULK1, we treated Ulk1 WT or ulk1 KO cells with TNF, LPS, and TGFB1. We observed that cytokine-mediated ROS increased cell death in ulk1 KO cells. These results indicated that ULK1 had cytoprotective roles against various stimulants besides PA (Figure S1–S3). Taken together, these results demonstrate that ULK1 protects cells against lipotoxicity through the elimination of ROS.
Figure 1. ULK1 protects cells against PA-induced cell death. (a) Ulk1 WT or ulk1 KO MEF cells were incubated with PA (500 μM) for the indicated times. Cell viability was estimated using a Cell titer-Glo assay kit. Live cell numbers were expressed as absorbance at luminescence. (b) Immunoblot analysis with antibodies against cleaved PARP, cleaved CASP3, and ACTB (loading control) in cells treated as described in (a). (c) Ulk1 WT or ulk1 KO MEF cells treated with PA was detected by FACS analysis for CASP3 activity. (d) TUNEL analysis of cells treated as in (a). Scale bar: 200 μm. (e) Ulk1 WT or ulk1 KO MEF cells were treated as described in (a) and ROS levels were determined using CM-H2DCFH-DA. Representative images are shown. Scale bar: 200 μm. (f) Quantification of TUNEL analysis. (g) Quantitative analysis of cells treated as in (a). Relative dichlorofluorescein fluorescence was calculated by averaging fluorescence levels from 80 to 100 cells, after subtracting background fluorescence, from images obtained using a fluorescence microscope. Data are presented as mean ± SD from three independent experiments. *p < 0.05 and **p < 0.01.
ULK1 is required for KEAP1 degradation and NFE2L2 activation
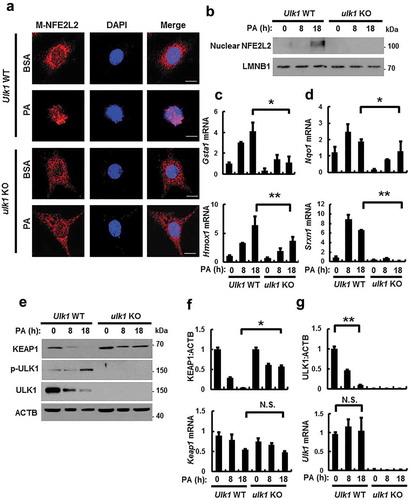
NFE2L2/NRF2 is a master transcription factor that regulates antioxidant target genes including Nqo1, Hmox1, Gsta1, and Srxn1 [Citation6,Citation9]. To examine whether ULK1 induces NFE2L2 activation, we treated Ulk1 WT or ulk1 KO MEF cells with PA. We found that ULK1 activated NFE2L2 target genes by increasing nuclear NFE2L2 levels (). KEAP1 is known to suppress NFE2L2 activity [Citation6]. To investigate whether ULK1 regulates the NFE2L2-KEAP1 pathway, and we found that ULK1 ablation blocked KEAP1 degradation, whereas the Keap1 mRNA levels remained unaffected (). Recent studies have reported that the phosphorylation of ULK1 at S317 is involved in the initiation of autophagy [Citation23,Citation24]. Consistent with these reports, we observed that PA-mediated phosphorylation of ULK1 at S317 elicited autophagic KEAP1 degradation. However, levels of ULK1 were decreased with no alterations in Ulk1 mRNA expression (). Collectively, these results suggest that ULK1 promotes KEAP1 degradation by activating autophagy, thereby leading to NFE2L2 activation in response to lipotoxicity.
Figure 2. ULK1 is required for KEAP1 degradation and NFE2L2 activation in PA-treated cells. (a) Ulk1 WT or ulk1 KO MEF cells expressing MYC-NFE2L2 were treated with BSA or PA (500 μM) for 18 h and subjected to immunofluorescence analysis using an antibody specific for MYC. Nuclei were also stained with DAPI. Scale bars: 10 μm. (b) Nuclear fractions of Ulk1 WT or ulk1 KO MEF cells were treated with PA (500 μM) for indicated times and subjected to immunoblot analysis with antibodies specific for NFE2L2 and LMNB1. Total mRNA isolated from cells were treated as described in (b) and subjected to qRT-PCR analysis for Gsta1, Hmox1 (c), Nqo1, Srxn1 (d), Keap1 (f) and Ulk1 (g) mRNA. (e) Immunoblot analysis of KEAP1, p-ULK1(S317), ULK1, and ACTB (loading control) in Ulk1 WT or ulk1 KO MEF cells after treatment with PA (500 μM) for the indicated times. Densitometric analysis of KEAP1 (f) and ULK1 (g) immunoblots. Data are mean ± SD from three independent experiments. *p < 0.05 and **p < 0.01. N.S, not significant.
PA-mediated ULK1 phosphorylation is dependent on AMPK and required for KEAP1 degradation
It is reported that AMP-activated protein kinase (AMPK)-dependent phosphorylation of ULK1 at S317 is required for ULK1 activation, resulting in autophagy activation [Citation25]. To understand the underlying mechanism of ULK1 activation by AMPK in response to PA, we treated Prkaa1/2 WT or prkaa1/2 KO MEF cells with PA for the indicated times. We showed that the PA-induced phosphorylation of ULK1 at S317 was partially inhibited in prkaa1/2 KO MEF cells () and in cells treated with compound C, a pan inhibitor of AMPK (). These results showed that the phosphorylation of ULK1, in response to PA, was dependent on AMPK. To further verify whether phosphorylation of ULK1 at S317 might regulate autophagic KEAP1 degradation, we transfected cultured cells with expression vectors encoding HA-tagged ULK1 wild type (H-ULK1) or the phosphorylation defective ULK1S317A together with both MYC-tagged SQSTM1 (M-SQSTM1) and FLAG-tagged KEAP1 (F-KEAP1). Ectopic expression of H-ULK1 induced degradation of F-KEAP1 in a concentration-dependent manner in HEK293 cells, whereas KEAP1 degradation was predominantly blocked with the cells transfected with the phosphorylation-defective ULK1S317A (). Together, these results show that AMPK-mediated phosphorylation of ULK1 is required for autophagic KEAP1 degradation.
Figure 3. PA-mediated ULK1 phosphorylation is partially mediated by AMPK and required for KEAP1 degradation in PA-treated cells. (a) Immunoblot analysis of p-AMPK, AMPK, p-ULK1(S317), ULK1, and ACTB (loading control) in Prkaa WT or prkaa KO MEF cells after treatment with PA (500 μM) for the indicated times. Densitometric analysis of p-AMPK:AMPK (b) and p-ULK1:ULK1 (c) immunoblots were also performed. (d) Immunoblot analysis of p-AMPK, AMPK, p-ULK1(S317), ULK1, and ACTB (loading control) in Hepa1c1c7 cells after treatment with PA (500 μM) and compound C (C.C; 10 μM) for 18 h. Densitometric analysis of p-AMPK:AMPK (e) and p-ULK1:ULK1 (f) immunoblots were also performed. (g) HEK293 cells co-transfected with vectors encoding HA-ULK1 and either HA-ULK1S317A and MYC-SQSTM1, FLAG-KEAP1 and were subjected to immunoblot analysis using antibodies specific for the indicated proteins. Densitometric analysis of KEAP1 (h) and SQSTM1 (i) immunoblots were also performed. Data are presented as the mean ± SD from three independent experiments. *p < 0.05 and **p < 0.01.
PA-induced ULK1 degradation is mediated by SQSTM1-dependent autophagy
Based on a previous report, ULK1 can be degraded in response to starvation [Citation26]; consistently, we observed that ULK1 was degraded in the presence of PA ()). To examine if PA-induced ULK1 downregulation is mediated by either proteasomal or autophagic degradation, Hepa1c1c7 cells were treated with the proteasome inhibitor MG132 or the autophagy inhibitor chloroquine (CQ). PA-induced ULK1 degradation was partially inhibited by CQ (Figure S4). These results suggested that ULK1 was degraded by autophagic mechanisms in response to PA. We further examined whether degradation of ULK1 is dependent on autophagy; for this, autophagy-defective cells including atg5 KO or sqstm1 KO MEF cells were treated with PA. We showed that PA-induced ULK1 degradation was inhibited with atg5 KO () and sqstm1 KO () MEF cells, whereas Ulk1 mRNA levels were not altered (). Furthermore, we showed that exogenous ULK1 was degraded by PA in time-dependent manner (Figure S5). Consistent with previous report [Citation27], we also observed that expression of SQSTM1 was increased in autophagic deficient cells ()). Taken together, these results suggest that ULK1 is degraded by SQSTM1-dependent autophagic mechanisms.
Figure 4. PA-induced ULK1 degradation is mediated by SQSTM1-dependent autophagy. (a) Immunoblot analysis of ULK1, SQSTM1, LC3B, and ACTB (loading control) in Atg5 WT or atg5 KO MEF cells after treatment with PA (500 μM) for the indicated times. (b) Densitometric analysis of ULK1 immunoblots was also performed. Total mRNA isolated from cells was treated as described in (a) and subjected to qRT-PCR analysis for Ulk1 mRNA. (c) Immunoblot analysis of ULK1, SQSTM1, and ACTB (loading control) in Sqstm1 WT or sqstm1 KO MEF cells after treatment with PA (500 μM) for the indicated times. (d) Densitometric analysis of ULK1 immunoblots was also performed. Total mRNA isolated from cells was treated as described in (c) and subjected to qRT-PCR analysis for Ulk1 mRNA. Data are provided as the mean ± SD from three independent experiments. **p < 0.01. N.S, not significant.
To verify whether ULK1 protects cells against lipotoxicity in SQSTM1- or autophagy-dependent manner, we treated Atg5 WT or atg5 KO and Sqstm1 WT or sqstm1 KO MEF cells with PA. Results showed that PA-induced cell death was markedly increased in atg5 KO and sqstm1 KO MEF cells compared to that in wild-type cells. Furthermore, we transfected Atg5 WT or atg5 KO and Sqstm1 WT or sqstm1 KO MEF cells with F-ULK1 and treated them with PA. We also observed that overexpression of ULK1 restored cell death in wild-type cells, but was not altered in atg5 and sqstm1 KO MEF cells (Figures S6 and S7). Collectively, ULK1 protected cells against lipotoxicity in SQSTM1 and autophagy dependent manner.
ULK1 interacts with SQSTM1 and KEAP1
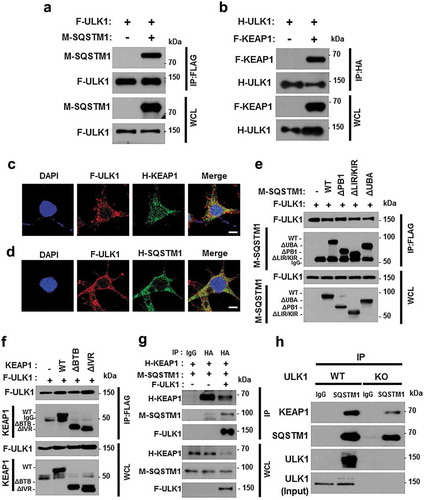
To investigate how ULK1 induces autophagic KEAP1 degradation, we transfected HEK293 cells with M-SQSTM1 and F-KEAP1 expression vectors, together with F-ULK1- or H-ULK1-encoding plasmids, and then subjected cell lysates to co-immunoprecipitation analysis. We found that M-SQSTM1 was efficiently co-immunoprecipitated with F-ULK1 ()) and that H-ULK1 was pulled down with F- KEAP1 ()), whereas ULK1 was found to bind SQSTM1 and KEAP1 without a specific domain (Figures S8, ). To elucidate cellular localization, HEK293T cells expressing F-ULK1 and either M-SQSTM1 or H-KEAP1 were subjected to immunofluorescent analysis, and results showed that F-ULK1 was colocalized with H-KEAP1 ()) and M-SQSTM1 ()). To explore whether ULK1 interacts with SQSTM1 and KEAP1, we transfected HEK293 cells with H-KEAP1 or M- SQSTM1 expression vectors together with F-ULK1 and then subjected cell lysates to co-immunoprecipitation analysis. Results showed that interactions between KEAP1 and SQSTM1 were significantly enhanced by F-ULK1 ()). To further evaluate the association between ULK1 and the SQSTM1-KEAP1 complex, we examined these interactions in Ulk1 WT or ulk1 KO MEF cells. We showed that the interactions between KEAP1 and SQSTM1 were significantly diminished in ulk1 KO cells ()). We further observed that the endogenous ULK1-KEAP1-SQSTM1 complex was strongly interacted under lipotoxic conditions (Figure S9). These results indicated that ULK1 had an essential role in enhancing KEAP1-SQSTM1 binding.
Figure 5. ULK1 interacts with SQSTM1 and KEAP1. Lysates from HEK293 cells transfected with vectors encoding FLAG-ULK1 (a) or HA-ULK1 (b) together with those expressing MYC-SQSTM1 (a) or FLAG-KEAP1 (b) were subjected to immunoprecipitation with antibodies against FLAG or HA, and the resulting precipitates (IPs) as well as whole cell lysates (WCLs) were subjected to immunoblot analysis using antibodies specific for the indicated proteins. Confocal microscopy analysis of co-localization of F-ULK1 and either H- KEAP1 (c) or H-SQSTM1 (d) Nuclei were stained with DAPI, and representative single optical sections and merge images are shown. Scale bars: 10 μm. Lysates from HEK293 cells transfected with deletion constructs of M-SQSTM1 (e) or KEAP1 (f) were subjected to immunoprecipitation with antibodies specific for FLAG, and the resulting IPs and WCLs were subjected to immunoblot analysis using antibodies specific for the indicated proteins. (g) Lysates from HEK293 cells transfected with F-ULK1, H-KEAP1, and M-SQSTM1 were subjected to immunoprecipitation with antibodies to HA, and the resulting IPs and WCLs were subjected to immunoblot analysis using antibodies specific for the indicated proteins. (h) Lysates from Ulk1 WT or ulk1 KO MEF cells were subjected to immunoprecipitation with antibodies to SQSTM1, and the resulting IPs and WCLs were subjected to immunoblot analysis using antibodies specific for the indicated proteins.
ULK1 overexpression alleviates PA-induced cell death in ulk1 KO cells
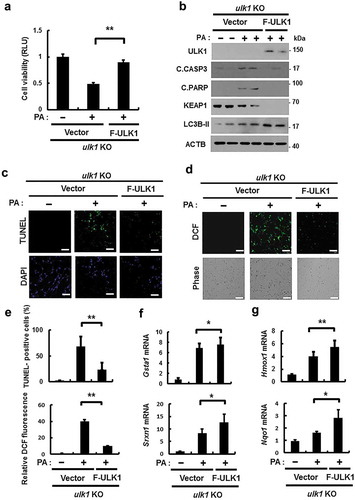
Based on our observations, we hypothesized that ULK1 prevented cells from lipotoxicity through NFE2L2 activation. To further verify its antioxidant role, ulk1 KO MEF cells were transfected with F-ULK1 and treated with PA. Overexpression of ULK1 restored cell viability following PA exposure, compared to that in ulk1 KO MEF cells ()). Consistently, we observed that levels of apoptotic cell death markers ()) and TUNEL-positive cell numbers were slightly decreased in the presence of ULK1 (). This cytoprotective effect of ULK1 was also shown to be mediated by ROS elimination (). We next examined whether ULK1-induced KEAP1 degradation and NFE2L2 activation occur in the same cellular context; we observed that ectopic expression of ULK1 induced NFE2L2 activation () with further KEAP1 degradation ()). To test whether the reinforcement of ULK1 prevents cell death against lipotoxicity through enhancing of autophagy, we examined that the expression of LC3B-II and its level was increased in ULK1 overexpressed cells compared to that in ulk1 KO MEF cells ()). Taken together, these results suggest that ULK1 defends against lipotoxicity-induced cell death through activation of autophagy-mediated NFE2L2-KEAP1 pathway.
Figure 6. Overexpression of ULK1 alleviates PA-induced cell death in ulk1 KO cells. ulk1 KO MEF cells were transfected with vectors encoding FLAG-ULK1 and treated with PA (500 μM) for 18 h. (a) Cell viability was estimated using a Cell titer-Glo assay kit. Live cell numbers were expressed as absorbance at luminescence. (b) Immunoblot analysis of ULK1, cleaved CASP3, cleaved PARP, KEAP1, LC3B, and ACTB (loading control) in ulk1 KO MEF cells transfected with vectors encoding F-ULK1 and treated with PA (500 μM) for 18 h. (c) TUNEL analysis of cells treated as in (a). (d) ROS levels were determined using CM-H2DCFH-DA. Representative images are shown. Scale bar: 200 μm. (e) Quantification of TUNEL analysis and DCF fluorescence. Total mRNA was isolated from cells treated as described in (a) and subjected to qRT-PCR analysis for Gsta1, Srxn1 (f) and Hmox1, Nqo1 (g) mRNA expression. Data are shown as mean ± SD from 3 independent experiments. *p < 0.05 and **p < 0.01.
ULK1 protects cells from PA-mediated mitochondrial damage
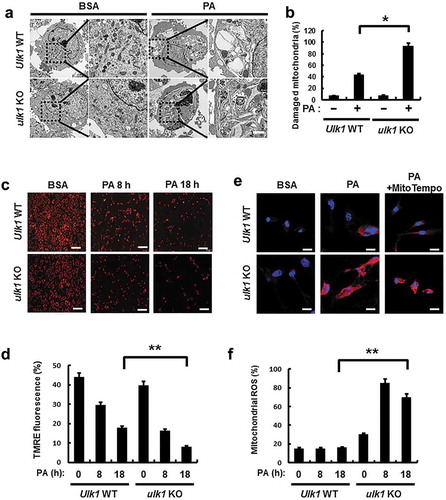
It has previously reported that mitochondrial dysfunction is closely associated with NASH progression [Citation2]. To examine whether ULK1 removes lipotoxicity-induced damaged mitochondria, we treated Ulk1 WT or ulk1 KO MEF cells with PA, and examined levels of mitochondrial damage. We observed that Ulk1 ablation resulted in greater increase in PA-induced damaged mitochondria (). Consistently, PA-induced mitochondrial dysfunction was increased in ulk1 KO cells, which was demonstrated by a decrease in membrane potential (). In addition, we investigated whether ULK1 affects PA-mediated mitochondrial ROS accumulation; results showed that levels of mitochondrial ROS were increased in ulk1 KO cells (). These results suggest that ULK1 ameliorates lipotoxicity-induced mitochondrial damage and attenuates mitochondrial ROS accumulation.
Figure 7. ULK1 protects cells form PA-induced mitochondrial damage. (a) Mitochondrial detection by electron microscopy (EM) in Ulk1 WT or ulk1 KO MEF cells after treatment with PA (500 μM). Scale bar: 2 μm. (b) Quantitative analysis of damaged mitochondria. (c) TMRE fluorescence analysis of Ulk1 WT or ulk1KO MEF cells after treatment with PA (500 μM) for the indicated times, and (d) Quantitative analysis of damaged mitochondria based on TMRE fluorescence. (e) MitoSOX Red fluorescence analysis of confocal microscopy analysis of Ulk1 WT or ulk1 KO MEF cells after treatment with PA (500 μM) or MitoTempo. (f) Quantitative analysis of MitoSOX Red fluorescence. Scale bar: 20 μm. Data are mean ± SD from three independent experiments. *p < 0.05 and **p < 0.01.
ULK1 is required for the PA-induced activation of mitophagy
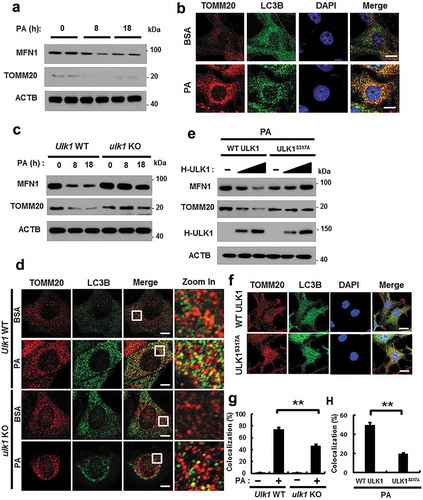
Mitophagy is an essential process for the degradation of damaged mitochondria [Citation15]. We investigated whether ULK1 regulates mitochondrial quality control by activating mitophagy under lipotoxic conditions. To examine whether PA activates mitophagy, we treated cells with PA for the indicated times, and measured mitochondrial proteins. Results showed that mitochondrial proteins including MFN1 (mitofusin 1) and TOMM20 (translocase of outer mitochondrial membrane 20) were degraded with this treatment ()). In addition, colocalization of TOMM20 and LC3B was increased in response to PA () and S10(b)). We further observed that the formation of mitophagosomes, a marker of mitophagy, was increased in PA-treated cells (Figure S10(a)). We next examined whether ULK1 is involved in PA-induced mitophagy in Ulk1 WT or ulk1 KO MEF cells after PA treatment. We showed that degradation of mitochondrial proteins was significantly blocked () and S10(c)) and that colocalization of TOMM20 and LC3B was largely reduced in ulk1 KO MEF cells (). Furthermore, we examined whether phosphorylation of ULK1 at S317 activates PA-induced mitophagy. For this, we transfected HEK293 cells with vectors encoding WT ULK1 or a phosphorylation defective mutant of ULK1S317A. Results showed that mitophagy was significantly blocked in ULK1S317A transfected cells ( and S10(d)).
Figure 8. ULK1 is required for PA-induced mitophagy. (a) Immunoblot analysis of MFN1, TOMM20, and ACTB (loading control) in Hepa1c1c7 cells after treatment with PA (500 μM) for the indicated times. (b) Confocal microscopy analysis of colocalization of TOMM20, and LC3B. (c) Immunoblot analysis of MFN1, TOMM20, and ACTB (loading control) in Ulk1 WT or ulk1 KO MEF cells after treatment with PA (500 μM) for the indicated times. (d) Confocal microscopic analysis of colocalization of TOMM20, and LC3B in Ulk1 WT or ulk1 KO MEF cells after treatment with PA (500 μM) for 18 h. Nuclei were also stained with DAPI, and representative single optical sections and merge images are shown. Scale bars: 5 μm. (e) HEK293 cells co-transfected with vectors encoding HA-WT ULK1 or the HA-ULK1S317A mutant were subjected to immunoblot analysis using antibodies specific for the indicated proteins. (f) Confocal microscopy analysis of colocalization of TOMM20 and LC3B proteins in HEK293 cells co-transfected with vectors encoding H-ULK1 or the H-ULK1S317A mutant, after treatment with PA (500 μM) for 18 h. Nuclei were also stained with DAPI, and representative single optical sections and merge images are shown. Scale bars: 10 μm. (g,h) Quantitative analysis of colocalization of TOMM20 and LC3B. Data are presented as mean ± SD from three independent experiments.
To further test whether ULK1-mediated mitophagy is dependent on NFE2L2, we transfected Nfe2l2 WT or nfe2l2 KO MEF cells with F-ULK1 under lipotoxic conditions. We observed that lipotoxicity-induced mitophagy was significantly mediated by NFE2L2. We showed that expression of Sqtsm1 was reduced in nfe2l2 KO MEF cells. The plausible explanation of this result is that SQSTM1 is known as NFE2L2 target gene [Citation28]. Therefore, this insufficient level of SQSTM1 attenuated the activation of mitophagy. We showed that PA induced SQSTM1 accumulation, thereby leading to SQSTM1-dependent mitophagy in lipotoxic conditions (Figure S11). Collectively, these results suggest that ULK1 removes damaged mitochondria by activating mitophagy under lipotoxic conditions.
PTEN-induced putative kinase 1 (PINK1) interacts with SQSTM1 and LC3B
Several studies have reported that mitophagy is dependent on the PRKN/PARK2 (parkin RBR E3 ubiquitin protein ligase)-PINK1 pathway in mammalian cells [Citation29,Citation30]. To elucidate the factors that are involved in lipotoxicity-induced mitophagy, we examined if the PINK1-PRKN pathway mediates the response to PA. Results showed that PINK1 was stabilized in mitochondria upon PA treatment ( and S12(a)), and that PINK1 interacted with LC3B, indicating the general activation of autophagy ()).
Figure 9. PINK1 interacts with SQSTM1 and LC3B. (a) Mitochondrial fractionation analysis was performed using Hepa1c1c7 cells after treatment with PA (500 μM) for the indicated times, and samples were subjected to immunoblot analysis using antibodies specific for PINK1, MFN1, and TUBA (loading control). (b) Confocal microscopy analysis of MitoRED and PINK1 staining in Hepa1c1c7 cells after treatment with PA (500 μM) for 18 h. Nuclei were also stained with DAPI, and representative single optical sections and merge images are shown. Scale bars: 10 μm. (c) Lysates of HEK293 cells transfected with vectors encoding FLAG-PINK1 and MYC-LC3B were subjected to immunoprecipitation with MYC antibodies, and the resulting precipitates (IPs), as well as whole cell lysates (WCLs), were subjected to immunoblot analysis with antibodies specific for the indicated proteins. (d) Confocal microscopy analysis of colocalization of TOMM20 and LC3B in Sqstm1 WT or sqstm1 KO MEF cells after treatment with PA (500 μM) for 18 h. (e) Quantitative analysis of colocalization of TOMM20 and LC3B. Scale bars: 5 μm. (f) Immunoblot analysis of MFN1, TOMM20, SQSTM1, and ACTB (loading control) in Sqstm1 WT or sqstm1 KO MEF cells after treatment with PA (500 μM) for the indicated times. Densitometric analysis of MFN1 (g) and TOMM20 (h) immunoblots were also performed. (i) Lysates of HEK293 cells transfected with deletion constructs of M-SQSTM1 and F-PINK1 were subjected to immunoprecipitation with FLAG antibodies, and the resulting IPs and WCLs were subjected to immunoblot analysis using antibodies specific for the indicated proteins. Data are shown as mean ± SD from 3 independent experiments. *p < 0.05 and **p < 0.01.
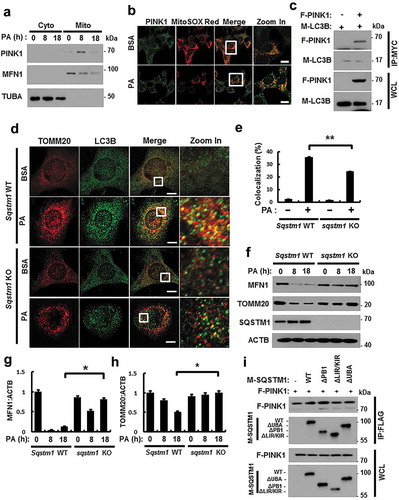
SQSTM1 is required for mitophagy activation [Citation31,Citation32]. To explore whether PA-induced mitophagy is dependent on SQSTM1, we treated Sqstm1 WT or sqstm1 KO MEF cells with PA. We found that PA-mediated mitophagy was mainly blocked in sqstm1 KO MEF cells, based on immunofluorescent and confocal microscopy analysis (), along with the degradation of mitochondrial proteins (). Consistently, PINK1 was found to bind SQSTM1, even without a specific binding domain () and S12(b)). We observed that PA-induced mitophagy was mainly dependent on SQSTM1. Taken together, SQSTM1 was required for lipotoxicity-induced mitophagy through direct binding with PINK1.
ULK1 interacts with the PINK- SQSTM1 complex
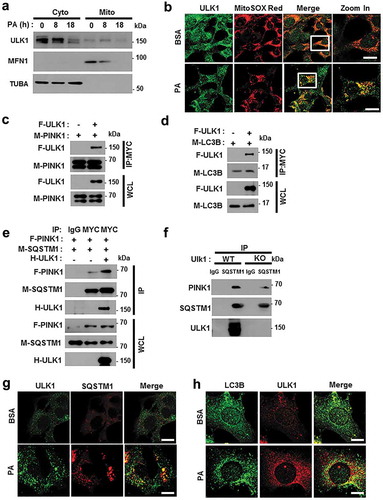
Recent studies have reported that ULK1 translocates to mitochondria for the activation of mitophagy [Citation33]. Consistently, our results showed that ULK1 translocated to mitochondria in response to PA ( and S13(a)). To verify whether ULK1 is involved in PA-induced PRKN recruitment, we transfected YFP-PRKN expressing HeLa cells with ULK1 siRNA and treated them with PA. We found that PA-induced PRKN translocation was dependent on ULK1 (Figure S14). Consistent with these results, we observed that ULK1 interacted with both PINK1 and LC3B () and enhanced the formation of a PINK1-SQSTM1 complex ()). Moreover, we found that the endogenous SQSTM1-PINK1-ULK1 interaction was slightly inhibited in ulk1 KO MEF cells ()). Supporting these results, we observed that ULK1 was colocalized with SQSTM1 () and S13(b)) and LC3B () and S13(c)) under lipotoxic conditions. Taken together, our results indicate that ULK1 acts as a positive regulator of PA-mediated mitophagy by facilitating the formation of a PINK1-SQSTM1 complex.
Figure 10. ULK1 enhances the interaction between SQSTM1 and PINK1. (a) Mitochondrial fractionation analysis of Hepa1c1c7 cells after treatment with PA (500 μM) for the indicated times; samples were subjected to immunoblot analysis using antibodies specific for ULK1, MFN1, and TUBA (loading control). (b) Confocal microscopy analysis of MitoSOX Red and ULK1 staining in Hepa1c1c7 cells after treatment with PA (500 μM) for 18 h. Nuclei were also stained with DAPI, and representative single optical sections and merge images are shown. Scale bars: 10 μm. (c) Lysates of HEK293 cells transfected with MYC-PINK1 and FLAG-ULK1 were subjected to immunoprecipitation using MYC antibodies, and the resulting immunoprecipitation (IPs), as well as the whole cell lysates (WCLs), were subjected to immunoblot analysis with antibodies specific for the indicated proteins. (d) Lysates of HEK293 cells transfected with F-ULK1 and M-LC3B was subjected to IPs with MYC antibodies, and the resulting IPs and WCLs were subjected to immunoblot analysis using antibodies specific for the indicated proteins. (e) Lysates from HEK293 cells transfected with F-PINK, M-SQSTM1, and H-ULK1 were subjected to immunoprecipitation using MYC antibodies, and the resulting IPs and WCLs were subjected to immunoblot analysis with antibodies specific for the indicated proteins. (f) Lysates from Ulk1 WT or ulk1 KO MEF cells were subjected to immunoprecipitation with antibodies for SQSTM1, and the resulting IPs and WCLs were subjected to immunoblot analysis using antibodies specific for the indicated proteins. (g) Confocal microscopy analysis of SQSTM1 and ULK1 colocalization. Scale bar: 5 μm. (h) Confocal microscopy analysis of colocalization of LC3B and ULK1 in Hepa1c1c7 cells co-transfected with vectors encoding M-LC3B and H-ULK1. Scale bar: 5 μm. Data are presented as the mean ± SD from three independent experiments.
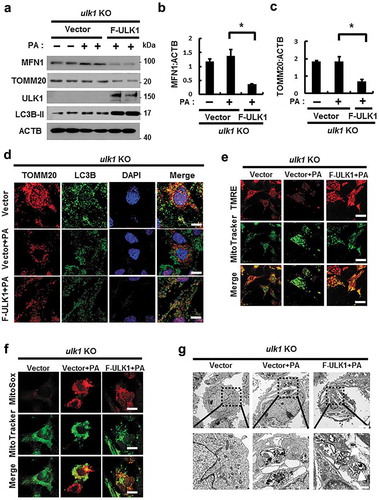
Overexpression of ULK1 alleviates PA-induced mitophagy in ulk1 KO cells
Our results showed that ULK1 positively regulated mitophagy in response to lipotoxicity. To verify this role for ULK1, we transfected ulk1 KO cells with F-ULK1 and performed PA treatment. We observed that ectopic expression of ULK1 enhanced mitophagy stimulation in PA-treated cells compared to that in control ulk1 KO MEF cells ( and S15(a)). Furthermore, to elucidate whether ULK1 inhibits lipotoxicity-induced mitochondrial ROS accumulation, ulk1 KO cells were transfected with F-ULK1 and treated with PA. We observed that ULK1 attenuated lipotoxicity-mediated mitochondrial ROS accumulation () and S15(c)) and restored mitochondrial dysfunction () and S15(b)). Furthermore, we observed that the number of PA-induced damaged mitochondria was reduced in ULK1-transfected cells () and S15(d)). Taken together, our results indicate that ULK1 contributes to mitochondrial quality control by activating mitophagy.
Figure 11. Overexpression of ULK1 increases PA-induced mitophagy and alleviates mitochondrial damage. (a) Immunoblot analysis of MFN1, TOMM20, ULK1, and ACTB (loading control) in ulk1 KO MEF cells transfected with vectors encoding FLAG-ULK1 and treated with PA (500 μM) for 18 h. Densitometric analysis of MFN1 (b) and TOMM20 (c) immunoblots was performed. (d) Confocal microscopy analysis of TOMM20 and LC3B colocalization in ulk1 KO MEF cells transfected with vectors encoding F-ULK1 after treatment with PA (500 μM) for 18 h. Nuclei were also stained with DAPI, and representative single optical sections and merge images are shown. Scale bars: 10 μm. (e) TMRE fluorescence analysis of ulk1 KO MEF cells transfected with vectors encoding F-ULK1 after treatment with PA (500 μM). Scale bars: 20 μm. (f) Fluorescence analysis of mitochondrial ROS in ulk1 KO MEF cells transfected with vectors encoding F-ULK1 after treatment with PA (500 μM), using MitoTracker Green (MitoGreen) and MitoSOX Red staining. Scale bar: 10 μm. (g) Mitochondrial detection using electron microscopy (EM) in ulk1 KO MEF cells transfected with vectors encoding F-ULK1 and treated with PA (500 μM) for 18 h. Scale bar: 2 μm. Data are shown as mean ± SD from three independent experiments. *p < 0.05.
ULK1 has a hepatoprotective role against physiological lipotoxic conditions
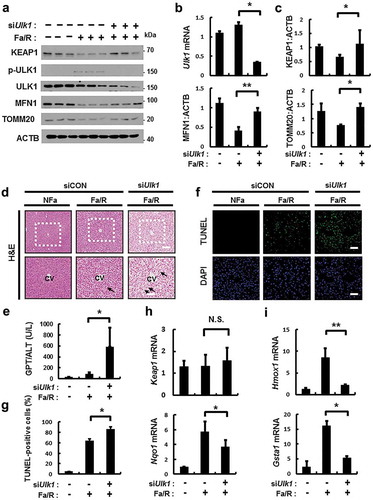
We examined whether ULK1 mediates the induction of SQSTM1-dependent autophagic KEAP1 degradation and mitophagy in physiological lipotoxic stress model including high-fat diet (HFD) model as chronic model and fasting followed by refeeding with high-carbohydrate, fat free diet (Fa/R) as acute model [Citation9,Citation34]. In only Fa/R model, we observed the induction of autophagic KEAP1 degradation and mitophagy (Figure S16). To examine whether ULK1 has a hepatoprotective role via activation of SQSTM1-KEAP1-NFE2L2 axis and mitophagy under physiological lipotoxic conditions, we used tail vein injections with Ulk1 siRNA in B6 mice and subjected mice to Fa/R model. The depletion of Ulk1 level was verified in mouse liver (). Results showed that ULK1-mediated degradation of KEAP1, MFN1, and TOMM20 were markedly blocked in Ulk1-depleted mice (). Also we observed that liver injury was exaggerated in Ulk1-depleted liver under lipotoxic conditions, as determined by H&E staining ()), serum ALT levels ()), and TUNEL assays (). This increase of liver injury might be resulted from downregulation of NFE2L2 target genes in Ulk1-depleted liver ( and S17). Taken together, these results support that ULK1 protects liver from lipotoxicity through activation of SQSTM1-KEAP1-NFE2L2 axis and mitophagy in mice.
Figure 12. ULK1 is required for hepatoprotection against lipotoxicity via activation of the SQSTM1-NFE2L2-KEAP1 pathway and mitophagy. B6 mice were maintained in a non-fasted state (NFa) or fasted overnight and then refed a high-carbohydrate, fat-free diet (Fa/R). (a) Immunoblot analysis of liver tissues with antibodies against KEAP1, p-ULK1, ULK1, MFN1, TOMM20 and ACTB (loading control). (b) qRT-PCR analysis of Ulk1 mRNA and densitometric analysis of MFN1 immunoblot were performed. (c) Densitometric analysis of KEAP1 and TOMM20 immunoblots were performed. (d) Liver sections of mice were stained using H&E. CV, central vein. Scale bar: 200 μm. (e) Serum alanine aminotransferase (ALT) levels were measured in mice. (f) Images from TUNEL analysis of liver sections from mice. Scale bar: 200 μm. (g) Quantitative analysis of TUNEL-positive cells. qRT-PCR analysis of Keap1, Nqo1, (h) Hmox1, and Gsta1 (i) mRNA. Data are means ± standard errors for eight or nine mice per group. *p < 0.05 and **p < 0.01. N.S, not significant. Data are presented relative to the corresponding values for non-fasted mice and are means ± standard errors for 8 or 9 mice per group.
Discussion
NASH is the most common global chronic liver disease that is associated with metabolic syndrome. However, there is no effective pharmacological target for NASH. To uncover novel effective therapeutic strategies, studies have focused on cellular metabolism, lipotoxicity, the inflammatory response, and modulation of autophagic activity [Citation14,Citation35]. NASH progression is known to be triggered by lipotoxicity, during which lipid overload leads to cell death caused by the accumulation of oxidative stress and damaged mitochondria [Citation4].
NFE2L2/NRF2 is a master transcription factor that mediates the induction of several cytoprotective genes in response to oxidative stress [Citation6,Citation7]. KEAP1 (kelch like ECH associated protein 1), a cysteine-rich protein, inhibits NFE2L2 activity through the ubiquitination of NFE2L2 by the CUL3-RBX1 E3 ligase complex [Citation7]. Under normal conditions, the kelch domains of the KEAP1 homodimer interact with NFE2L2 through a low-affinity DLG motif (latch) or a high-affinity ETGE motif (hinge) located in the Neh2 domain of NFE2L2, which subsequently leads to its proteasomal degradation. Upon exposure to oxidative stress, KEAP1 becomes modified at one or more cysteine residues, thereby promoting its conformational change. KEAP1 impairs the structural integrity of the interaction with the low-affinity DLG motif (latch) of NFE2L2, which can increase nuclear NFE2L2 for activation of antioxidant target genes; this represents the canonical pathway [Citation8].
However, several recent studies have reported that NFE2L2 activation can be mediated by the noncanonical pathway. Previous study have reported that the p21 cyclin-dependent kinase inhibitor competes with KEAP1 for binding to the DLG motif of NFE2L2, thereby suppressing NFE2L2 degradation [Citation36]. Other studies have shown that SQSTM1/p62, an autophagy adaptor protein, can act as an endogenous NFE2L2 activator through competitively disrupting the KEAP1-NFE2L2 interaction [Citation9,Citation11,Citation37]. Recently, SQSTM1-dependent autophagic KEAP1 degradation was found to be important for the elimination of SFA-induced ROS accumulation through NFE2L2 activation [Citation12]. SQSTM1 acts as a scaffold protein that has multiple domains such as PB1, UBA, and TRAF6 binding domains. These domains can recruit proteins to integrate kinase-activated and ubiquitin-mediated signaling pathways. Furthermore, PB1 domains organize signaling platforms through their ability to interact with other proteins [Citation38]. These facts explain how ULK1 is able to interact with SQSTM1-KEAP1 under normal conditions.
In this study, we found that ULK1, known as an autophagy initiating kinase, protected cells from lipotoxicity through NFE2L2 activation. The underlying mechanism is that ULK1 enhances the interaction between SQSTM1 and KEAP1, thereby activating NFE2L2, which leads to autophagic KEAP1 degradation.
The accumulation of damaged mitochondria might contribute to the development of NASH [Citation39,Citation40]. Mitophagy is the selective engulfment of damaged mitochondria by autophagosomes [Citation27], which leads to their degradation through mitochondrial quality control [Citation15]. The PINK1-PRKN-mediated pathway is known as an essential mechanism that regulates mitophagy. When mitochondria are damaged by cellular stress, PINK1 accumulates on the outer membrane through a loss in mitochondrial potential and recruits cytosolic PRKN [Citation32].
Several studies reported that ULK1 plays a more specific role in mitophagy. ULK1 ablation have results in defects in the autophagic removal of damaged mitochondria in vivo during erythroid maturation [Citation16]. It has been found that phosphorylation of ULK1 by AMPK is associated with cellular energy sensing mitophagy [Citation41]. More recently, ULK1 was found to directly interact with FUNDC1 (FUN14 domain containing 1), a receptor of mitophagy, which leads to the activation of mitophagy in response to hypoxia [Citation33].
Increasing evidence from recent studies indicates that SQSTM1 has a controversial role in the regulation of mitophagy. It has been reported that SQSTM1 is involved in the perinuclear clustering of mitochondria, but is not essential for mitophagy [Citation42]. In contrast, SQSTM1 was also found to be required for the activation of mitophagy. SQSTM1 induces the clearance of mitochondria by binding ubiquitinated sites in damaged mitochondria [Citation31,Citation32]. Our results showed that SQSTM1 was necessary for mitophagy through the direct binding to PINK1. Furthermore, we identified that ULK1 activated mitophagy and eliminated damaged mitochondria by facilitating the formation of a PINK1-SQSTM1 complex.
Furthermore, a recent study have reported that SESN2 (sestrin2), which is a stress-responsive protein, can activate the KEAP1-SQSTM1-NFE2L2 pathway through its binding to SQSTM1 and KEAP1 in lipotoxic conditions [Citation9]. SESN2 interacts with ULK1, thereby leading to the activation of mitophagy through the translocation of PRKN [Citation43]. Based on these notions, we suggest that ULK1 simultaneously interacts with both KEAP1-SQSTM1 and PINK1-SQSTM1 through the SESN2-mediated binding of ULK1 to SQSTM1-KEAP1 and SQSTM1-PINK1.
Several studies have reported that AMPK-ULK1 induces autophagy activation in stress condition such as nutrient starvation and hypoxia [Citation24,Citation44,Citation45]. Consistent with these reports, our results showed that PA-mediated AMPK activation induced ULK1 phosphorylation, thereby leading to autophagic KEAP1 degradation-mediated NFE2L2 activation and mitophagy (Figure S18). However, PA regulates autophagy via multiple ways including activation of MTORC1 [Citation46], activation of MAPK8/JNK (mitogen-activated protein kinase 8), and PRKC (protein kinase C) [Citation47,Citation48]. Recently, ULK1 protects hepatocytes against lipotoxicity through increased saturated fatty acid (SFA): monounsaturated fatty acids (MUFA) ratio by SCD1 (stearoyl-CoA desaturase 1), which is mediated by autophagy independent mechanism [Citation49]. Based on these notions, ULK1 is able to protect cells from lipotoxicity in autophagy-dependent or -independent manner. Taken together, these results imply that ULK1 might be represent a promising therapeutic target for NASH.
Materials and methods
Antibodies and reagents
The following antibodies were used in this study: anti-KEAP1 (Proteintech, 10503-2-AP); anti-ACTB (Santa Cruz Biotechnology, sc-47778); anti-FLAG (Merk Millipore, F1804); anti-p-ULK1 (S317) (Cell Signaling Technology, 12753S); anti-ULK1 (Sigma Aldrich, A7481); anti-SQSTM1 (Abnova, H00008878-M01); anti-LC3B (Novus, NB100-2220); anti-MYC (Merk Millipore, 05-419); anti-TOMM20 (Santa Cruz Biotechnology; sc-17764); anti-MFN1 (Santa Cruz Biotechnology, sc-50330); anti-p-AMPK (Cell Signaling Technology, 2535); anti-AMPK (Cell Signaling Technology, 2603); anti-TUBA (Bio Legend, 627901); anti-PINK1 (Novus, BC100-494); anti-cleaved CASP3 (Cell Signaling Technology, 9661S); anti-cleaved PARP (Cell Signaling Technology, 9544S); anti-NFE2L2 (Santa Cruz Biotechnology, sc-13032), anti-LMNB1 (Proteintech, 12987-1-AP); anti-HA (Bethyl Laboratory, A190-108A). PA (Sigma Aldrich, 57-10-36), DMSO (Sigma Aldrich, 67-68-5), and Compound C (Sigma Aldrich, 866405-64-3) were used. MitoSOX Red (Invitrogen, M36008), MitoTracker Green (Invitrogen, M7514), and tetramethylrhodamine, ethyl ester, perchlorate (TMRE; Invitrogen, T669) were used.
Cell culture
HEK293 cells, MEFs, and green fluorescent protein (GFP)-conjugated LC3B (GFP-LC3B)-expressing HeLa cells were maintained with 5% CO2 at 37°C in Dulbecco’s modified Eagle’s medium (DMEM; Hyclone, SH3243.01) supplemented with 10% fetal bovine serum (Hyclone, SV30087.02), 1% penicillin, and 1% streptomycin. Hepa1c1c7 (mouse hepatoma cells) cells were maintained with 5% CO2 at 37°C in minimum essential medium (MEM; Welgene, LM007-07) supplemented with 10% FBS and 1% penicillin and streptomycin.
Immunofluorescence staining and confocal microscopy
HEK293 cells, MEF cells, and GFP-conjugated LC3B (GFP-LC3B) expressing HeLa cells cells were seeded on glass coverslips and treated with BSA (MP Biomedicals, 160069) or PA (500 µM) for 18 h or transfected with expression vectors, and then fixed and permeabilized with 0.1% Triton X-100 (Sigma Aldrich, X100) in PBS (Biowest, X0515-500) for 15 min at room temperature. After PBS washes, cells were blocked with 1% BSA for 1 h at room temperature. The cells were then incubated overnight with primary antibodies at 4°C. After PBS washes, cells were incubated with secondary antibodies for 1 h at room temperature. Finally, cells were washed with PBS three times and mounted on slides with mounting medium and observed using confocal microscope (Carl Zeiss, LSM700) at 800× magnification. The following primary antibodies were used: anti-FLAG (1:500; Merk Millipore, MAB3118), anti-MYC (1:500; Merk Millipore, 05-724), anti-HA (1:500; Bethyl Laboratory, A190-108A), anti-LC3B (1:500; Novus, NB100-2220), and anti-TOMM20 (1:500; Santa Cruz Biotechnology, sc-17764). Secondary antibodies used as follows: Goat Anti-Rabbit IgG H&L (Alexa Fluor® 488) (Abcam, ab150077) and Alexa Fluor 568-conjugated donkey anti-mouse (Invitrogen, A10037) or rabbit (Invitrogen, A10042) IgG secondary antibody. The nuclei were counterstained with Fluoroshield™ with DAPI (Sigma Aldrich, F6057) and visualized using a confocal microscope (Carl Zeiss, LSM700).
Immunoprecipitation (IP) and immunoblot analysis
For immunoprecipitation, HEK293 cells were lysed in lysis buffer containing 50 mM tris-HCl (pH 7.5), 150 mM NaCl, aprotinin, leupeptin, and 1% Nonidet P-40 (NP-40). Cell lysates were centrifuged, and the resulting supernatants were subjected to immunoprecipitation with antibodies against FLAG, HA, or MYC using protein G-Sepharose beads, as previously described, with minor modifications [Citation9] For immunoblot analysis, cell lysates or immunoprecipitates were subjected to SDS-PAGE gel electrophoresis; the separated proteins were transferred to a polyvinylidene fluoride membrane (PVDF), which was incubated first with primary antibodies and then with horseradish peroxidase-conjugated secondary antibodies, and enhanced chemiluminescence reagents (Thermo Fisher Scientific, 34580).
Mitochondrial transmembrane potential (ψm) assay using TMRE
Mitochondrial transmembrane potential was assessed using TMRE. Cells were plated on cultured dishes, and after 24 h, they were treated with PA (500 µM) in phenol red-free media. TMRE (250 nM) was added to the cells in media, which were incubated at 37°C for 30 min. They were then washed three times with PBS, and fluorescence images were obtained with a fluorescence microscope (Carl Zeiss, Axiovert 200 Basic standard, Germany).
TUNEL analysis
DNA breaks in cells were measured using a TUNEL assay kit (Promega Corporation, G3250) according to the manufacturer’s instructions. Fluorescence signals were detected with a confocal microscope (Carl Zeiss, LSM700), and the frequency of apoptotic cells was quantified by determining the percentage of TUNEL-positive cells in 10 random microscopic fields per specimen.
SFA treatment
PA was dissolved in isopropyl alcohol at a stock concentration of 160 mM. This solution was added to DMEM containing 1% BSA to ensure a physiological ratio between bound and unbound FFA in the medium [Citation12,Citation50].
Quantitative RT-PCR analysis
Total RNA was prepared from cultured cells using TRIzol® reagent (MRC, TR 118) and was treated with RNase. Some of the RNA (1 μg) was then subjected to reverse transcription using random-hexamer primers and a cDNA synthesis kit (TaKaRa, RR036A-1). The resulting cDNA was subjected to quantitative PCR analysis with SYBR® Green (ABI, 467659) and mouse-specific primer pairs (forward and reverse). The sequences of the primers for mouse cDNA were as follows: Keap1, 5′-GGCAGGACCAGTTGAACAGT-3′ and 5′-GGGTCACCTCACTCCAGGTA-3′; Hmox1, 5′-GAGCAGAACCAGCCTGAACTA-3′ and 5′-GGTACAAGGAAGCCATCACCA-3; Gsta1, 5′- TGCCCAATCATTTCAGTCAG-3′ and 5′-CCAGAGCCATTCTCAACTA-3′; Ulk1, 5′- TCGAGTTCTCCCGCAAGG-3′ and 5′-CGTCTGAGACTTGGCGAGGT-3′; Srxn1, 5′-GGAAGGAAGAAAGGAGATGG-3′ and 5′-AGAGTTCAGGCTATGGGGAT-3′; Nqo1, 5′-TTCTCTGGCCGATTCAGAG-3′, and 5′-GGCTGCTTGGAGCAAAATAG-3′; Fasn: 5′-GCTGCGGAAACTTCAGGAAAT-3ʹ; 5ʹ-AGAGACGTGTCACTCCTGGACTT-3ʹ; Srebf1: 5′-GGAGCCATGGATTGCACATT-3ʹ; 5ʹ-GGCCCGGGAAGTCACTGT-3ʹ; Rn18s: 5′-CGCTCCCAAGATCCAACTAC-3′ and 5ʹ-CTGAGAAACGGCTACCACATC-3ʹ. Rn18s ribosomal RNA was used as an internal control.
Cell cytotoxicity assays
Cells were seeded at a density of 2 × 10³ cells/well in a final volume of 100 μL in 96-well plates. After 24 h, the cells were treated with BSA or PA (500 µM) for 18 h. Cell viability was estimated using a CellTiter-Glo Luminescent cell viability assay kit (Promega Corporation, G7570) according to the manufacturer’s protocol.
Measurement of ROS
Intracellular ROS generation was assessed using 5,6-chloromethyl-2′,7′-ichlorodihydrofluorescein diacetate (CM-H2DCFDA; Molecular Probes, C6827). The cells (3 × 10⁵) were plated in 35-mm dishes. After 24 h, they were treated with PA in phenol red-free media. The cells were then rinsed once with 2 mL of Hanks balanced salt solution and incubated for 5 min with CM-H2DCFDA. They were then washed again with Hanks balanced salt solution, and fluorescence images were obtained using a fluorescence microscope (Carl Zeiss, Axiovert 200). The relative dichlorofluorescein fluorescence was calculated by averaging the levels of fluorescence from 80–100 cells after subtracting background fluorescence.
CASP3 activity analysis
The PE active CASP3 apoptosis kit (BD Bioscience, 550914) was used to determine certain apoptosis pathways involved in CASP3 activation in Ulk1 WT or ulk1 KO MEF cells using a flow cytometry according to the manufacturer’s protocol. After treatment with PA (0.5 mM), cells were harvested and stained with CASP3 Fluorogenic substrate, and analyzed via fluorescence-activate cell sorting (FACS) analysis using a FACScan analyzer (BD Bioscience, FACSCalibur).
Subcellular fractionation
For cytoplasmic extraction, Ulk1 WT or ulk1 KO MEF cells were lysed in Buffer A containing 10 mM HEPES, 1.5 mM MgCl2, 10 mM KCl, 0.5 mM DTT, and 0.05% NP-40. The cell lysates were centrifuged (848 × g for 10 min), and the resulting supernatants (cytosolic fractions) were subjected to immunoblot analysis. The pellet was resuspended on ice with Buffer B containing 5 mM HEPES, 1.5 mM MgCl2, 0.2 mM EDTA, 0.5 mM DTT, and 26% glycerol, and centrifuged (24,000 × g for 20 min), and the resulting supernatants were subjected to immunoblot analysis. To isolate the mitochondrial fraction, Hepa1c1c7 cells were lysed in mitochondria fraction buffer containing 225 mM mannitol, 30 mM sucrose, and 30 mM tris-HCl (pH 7.8). Cell lysates were centrifuged (300 × g for 5 min), and the supernatants were also centrifuged (10,000 × g for 30 min). Supernatants comprised the cytosolic fraction, and the resulting pellet, containing mitochondria, were washed with mitochondrial fraction buffer, and centrifuged (10,000 × g for 5 min). Supernatants were subjected to immunoblot analysis. Protein concentration was quantitated using the Bradford protein assay.
Electron microscopy
All samples were observed by scanning electron microscope (SEM; Carl Zeiss, MERLIN) at the acceleration voltage of 80 kV.
Animals and in vivo transfection
Male C57BL/6J mice at 9–11 weeks of age were purchased from Japan SLC, Inc. (Hamamatsu, Japan). Ulk1 siRNA (AAGGACCGCAUGGACUUUGAU) was administered through the tail vein together with Invivofectamine 3.0 reagent (Thermo Fisher Scientific, IVF3001) for 3 days according to the manufacturer’s instruction. Mice were fed a normal chow diet without fasting and a high-carbohydrate diet after 24 h of fasting. All mice had free access to water and food in rooms maintained at 23 ± 2°C with a 12 h light/12 h dark cycle, and 50–70% humidity. After 12 h of refeeding, mice were sacrificed. Serum alanine aminotransferase (ALT) levels were quantified by colorimetric determination using an activity assay kit (FUJIFILM, 3250). All animal experiments were approved by the Animal Care and Use Committee of the Yonsei University College of Medicine.
Statistical analysis
Data were analyzed by performing a two-tailed Student’s t-test for comparisons between two groups, or a one-way analysis of variance (ANOVA) with the Tukey honestly significant difference post-hoc test for multiple comparisons (SPSS 21.0K for Windows, SPSS, Chicago, IL, USA) to determine statistical significance. A value of P < 0.05 was considered significant.
Supplemental Material
Download MS Word (8 MB)Acknowledgments
We thank Dr. J. Shin for providing the Sqstm1 MEF cells, and Dr. M. Komatsu, Dr. N. Mizushima, and Dr. D. S. Min for providing the Atg5 MEF cells. FLAG- and HA-tagged ULK1 cDNA, and Prkaa MEF cells were kindly provided by Dr. J Kim. MYC-tagged NFE2L2 was provided by Dr. S. M. Hannink and FLAG-tagged KEAP1 cDNA was kindly provided by Dr. M. Komatsu. The series of KEAP1 deletion constructs was kindly provided by D. Zhang. A plasmid encoding SQSTM1 was kindly provided by J. Shin. The series of SQSTM1 deletion constructs was kindly provided by T. Johansen. We thank to S.G. Rhee, S.H. Sung, S.Y. Oh, M.J. Lee, and H.W. Ji for giving encouragement and comments.
Disclosure statement
No potential conflict of interest was reported by the authors.
Supplementary material
Supplemental data for this article can be accessed here.
Additional information
Funding
Related Research Data
References
- Arab JP, Arrese M, Trauner M. Recent insights into the pathogenesis of nonalcoholic fatty liver disease. Annu Rev Pathol. 2018 Jan 24;13:321–350. PubMed PMID: 29414249.
- Browning JD, Horton JD. Molecular mediators of hepatic steatosis and liver injury. J Clin Invest. 2004 Jul;114(2):147–152. PubMed PMID: 15254578; PubMed Central PMCID: PMCPMC449757.
- Day CP. Non-alcoholic steatohepatitis (NASH): where are we now and where are we going? Gut. 2002 May;50(5):585–588. PubMed PMID: 11950797; PubMed Central PMCID: PMCPMC1773193.
- Brookheart RT, Michel CI, Schaffer JE. As a matter of fat. Cell Metab. 2009 Jul;10(1):9–12. PubMed PMID: 19583949; PubMed Central PMCID: PMCPMC2751821.
- Fuchs M, Sanyal AJ. Lipotoxicity in NASH. J Hepatol. 2012 Jan;56(1):291–293. PubMed PMID: 21741924.
- Kensler TW, Wakabayashi N, Biswal S. Cell survival responses to environmental stresses via the Keap1-Nrf2-ARE pathway. Annu Rev Pharmacol Toxicol. 2007;47: 89–116. PubMed PMID: 16968214.
- Itoh K, Mimura J, Yamamoto M. Discovery of the negative regulator of Nrf2, Keap1: a historical overview. Antioxid Redox Signal. 2010 Dec 1;13(11):1665–1678. PubMed PMID: 20446768.
- Taguchi K, Motohashi H, Yamamoto M. Molecular mechanisms of the Keap1-Nrf2 pathway in stress response and cancer evolution. Genes Cells. 2011 Feb;16(2):123–140. PubMed PMID: 21251164.
- Bae SH, Sung SH, Oh SY, et al. Sestrins activate Nrf2 by promoting p62-dependent autophagic degradation of Keap1 and prevent oxidative liver damage. Cell Metab. 2013 Jan 8;17(1):73–84. PubMed PMID: 23274085.
- Itoh K, Wakabayashi N, Katoh Y, et al. Keap1 represses nuclear activation of antioxidant responsive elements by Nrf2 through binding to the amino-terminal Neh2 domain. Genes Dev. 1999 Jan 1;13(1):76–86. PubMed PMID: 9887101; PubMed Central PMCID: PMCPMC316370.
- Komatsu M, Kurokawa H, Waguri S, et al. The selective autophagy substrate p62 activates the stress responsive transcription factor Nrf2 through inactivation of Keap1. Nat Cell Biol. 2010 Mar;12(3):213–223. PubMed PMID: 20173742.
- Park JS, Kang DH, Lee DH, et al. Concerted action of p62 and Nrf2 protects cells from palmitic acid-induced lipotoxicity. Biochem Biophys Res Commun. 2015 Oct 9;466(1):131–137. PubMed PMID: 26325428.
- Mizushima N. The role of mammalian autophagy in protein metabolism. Proc Jpn Acad Ser B Phys Biol Sci. 2007 Mar;83(2):39–46. PubMed PMID: 24019583; PubMed Central PMCID: PMCPMC3756738.
- Ueno T, Komatsu M. Autophagy in the liver: functions in health and disease. Nat Rev Gastroenterol Hepatol. 2017 Mar;14(3):170–184. PubMed PMID: 28053338.
- Jin SM, Youle RJ. PINK1- and Parkin-mediated mitophagy at a glance. J Cell Sci. 2012 Feb 15;125(Pt 4):795–799. PubMed PMID: 22448035; PubMed Central PMCID: PMCPMC3656616.
- Kundu M, Lindsten T, Yang CY, et al. Ulk1 plays a critical role in the autophagic clearance of mitochondria and ribosomes during reticulocyte maturation. Blood. 2008 Aug 15;112(4):1493–1502. PubMed PMID: 18539900; PubMed Central PMCID: PMCPMC2515143.
- Richieri GV, Kleinfeld AM. Unbound free fatty acid levels in human serum. J Lipid Res. 1995 Feb;36(2):229–240. PubMed PMID: 7751810.
- Malhi H, Bronk SF, Werneburg NW, et al. Free fatty acids induce JNK-dependent hepatocyte lipoapoptosis. J Biol Chem. 2006 Apr 28;281(17):12093–12101. PubMed PMID: 16505490.
- Lambertucci RH, Hirabara SM, Silveira Ldos R, et al. Palmitate increases superoxide production through mitochondrial electron transport chain and NADPH oxidase activity in skeletal muscle cells. J Cell Physiol. 2008 Sep;216(3):796–804. PubMed PMID: 18446788.
- Filliol A, Piquet-Pellorce C, Le Seyec J, et al. RIPK1 protects from TNF-α-mediated liver damage during hepatitis. Cell Death Dis. 2016 Nov 10;7(11):e2462. PubMed PMID: 27831558; PubMed Central PMCID: PMCPMC5260888.
- Raza H, John A, Shafarin J. Potentiation of LPS-induced apoptotic cell death in human hepatoma HepG2 cells by aspirin via ROS and mitochondrial dysfunction: protection by N-Acetyl cysteine. PLoS One. 2016;11(7): e0159750. PubMed PMID: 27441638; PubMed Central PMCID: PMCPMC4956263.
- Yang L, Roh YS, Song J, et al. Transforming growth factor beta signaling in hepatocytes participates in steatohepatitis through regulation of cell death and lipid metabolism in mice. Hepatology. 2014 Feb;59(2):483–495. PubMed PMID: 23996730; PubMed Central PMCID: PMCPMC3946696.
- Ro SH, Semple IA, Park H, et al. Sestrin2 promotes Unc-51-like kinase 1 mediated phosphorylation of p62/sequestosome-1. FEBS J. 2014 Sep;281(17):3816–3827. PubMed PMID: 25040165; PubMed Central PMCID: PMCPMC4156532.
- Kim J, Guan KL. Regulation of the autophagy initiating kinase ULK1 by nutrients: roles of mTORC1 and AMPK. Cell Cycle. 2011 May 1;10(9):1337–1338. PubMed PMID: 21403467.
- Kim J, Kundu M, Viollet B, et al. AMPK and mTOR regulate autophagy through direct phosphorylation of Ulk1. Nat Cell Biol. 2011 Feb;13(2):132–141. PubMed PMID: 21258367; PubMed Central PMCID: PMCPMC3987946.
- Allavena G, Boyd C, Oo KS, et al. Suppressed translation and ULK1 degradation as potential mechanisms of autophagy limitation under prolonged starvation. Autophagy. 2016 Nov;12(11):2085–2097. PubMed PMID: 27629431; PubMed Central PMCID: PMCPMC5103336.
- Klionsky DJ, Abdelmohsen K, Abe A, et al. Guidelines for the use and interpretation of assays for monitoring autophagy (3rd edition). Autophagy. 2016;12(1):1–222. PubMed PMID: 26799652; PubMed Central PMCID: PMCPMC4835977.
- Jain A, Lamark T, Sjottem E, et al. p62/SQSTM1 is a target gene for transcription factor NRF2 and creates a positive feedback loop by inducing antioxidant response element-driven gene transcription. J Biol Chem. 2010 Jul 16;285(29):22576–22591. PubMed PMID: 20452972; PubMed Central PMCID: PMCPMC2903417.
- Twig G, Elorza A, Molina AJ, et al. Fission and selective fusion govern mitochondrial segregation and elimination by autophagy. EMBO J. 2008 Jan 23;27(2):433–446. PubMed PMID: 18200046; PubMed Central PMCID: PMCPMC2234339.
- Twig G, Shirihai OS. The interplay between mitochondrial dynamics and mitophagy. Antioxid Redox Signal. 2011 May 15;14(10):1939–1951. PubMed PMID: 21128700; PubMed Central PMCID: PMCPMC3078508.
- Park S, Choi SG, Yoo SM, et al. Choline dehydrogenase interacts with SQSTM1/p62 to recruit LC3 and stimulate mitophagy. Autophagy. 2014;10(11):1906–1920. PubMed PMID: 25483962; PubMed Central PMCID: PMCPMC4502719.
- Geisler S, Holmstrom KM, Skujat D, et al. PINK1/Parkin-mediated mitophagy is dependent on VDAC1 and p62/SQSTM1. Nat Cell Biol. 2010 Feb;12(2):119–131. PubMed PMID: 20098416.
- Wu W, Tian W, Hu Z, et al. ULK1 translocates to mitochondria and phosphorylates FUNDC1 to regulate mitophagy. EMBO Rep. 2014 May;15(5):566–575. PubMed PMID: 24671035; PubMed Central PMCID: PMCPMC4210082.
- Schrauwen P. High-fat diet, muscular lipotoxicity and insulin resistance. Proc Nutr Soc. 2007 Feb;66(1):33–41. PubMed PMID: 17343770.
- Musso G, Cassader M, Rosina F, et al. Impact of current treatments on liver disease, glucose metabolism and cardiovascular risk in non-alcoholic fatty liver disease (NAFLD): a systematic review and meta-analysis of randomised trials. Diabetologia. 2012 Apr;55(4):885–904. PubMed PMID: 22278337.
- Chen W, Sun Z, Wang XJ, et al. Direct interaction between Nrf2 and p21(Cip1/WAF1) upregulates the Nrf2-mediated antioxidant response. Mol Cell. 2009 Jun 26;34(6):663–673. PubMed PMID: 19560419; PubMed Central PMCID: PMCPMC2714804.
- Ichimura Y, Waguri S, Sou YS, et al. Phosphorylation of p62 activates the Keap1-Nrf2 pathway during selective autophagy. Mol Cell. 2013 Sep 12;51(5):618–631. PubMed PMID: 24011591.
- Moscat J, Diaz-Meco MT, Wooten MW. Signal integration and diversification through the p62 scaffold protein. Trends Biochem Sci. 2007 Feb;32(2):95–100. PubMed PMID: 17174552.
- Schrauwen P, Schrauwen-Hinderling V, Hoeks J, et al. Mitochondrial dysfunction and lipotoxicity. Biochim Biophys Acta. 2010 Mar;1801(3):266–271. PubMed PMID: 19782153.
- Wei Y, Rector RS, Thyfault JP, et al. Nonalcoholic fatty liver disease and mitochondrial dysfunction. World J Gastroenterol. 2008 Jan 14;14(2):193–199. PubMed PMID: 18186554; PubMed Central PMCID: PMCPMC2675113.
- Egan D, Kim J, Shaw RJ, et al. The autophagy initiating kinase ULK1 is regulated via opposing phosphorylation by AMPK and mTOR. Autophagy. 2011 Jun;7(6):643–644. PubMed PMID: 21460621; PubMed Central PMCID: PMCPMC3359466.
- Lazarou M, Sliter DA, Kane LA, et al. The ubiquitin kinase PINK1 recruits autophagy receptors to induce mitophagy. Nature. 2015 Aug 20;524(7565):309–314. PubMed PMID: 26266977; PubMed Central PMCID: PMCPMC5018156.
- Kumar A, Shaha C. SESN2 facilitates mitophagy by helping Parkin translocation through ULK1 mediated Beclin1 phosphorylation. Sci Rep. 2018 Jan 12;8(1):615. PubMed PMID: 29330382; PubMed Central PMCID: PMCPMC5766514.
- Zhao M, Klionsky DJ. AMPK-dependent phosphorylation of ULK1 induces autophagy. Cell Metab. 2011 Feb 2;13(2):119–120. PubMed PMID: 21284977; PubMed Central PMCID: PMCPMC3056410.
- Tian W, Li W, Chen Y, et al. Phosphorylation of ULK1 by AMPK regulates translocation of ULK1 to mitochondria and mitophagy. FEBS Lett. 2015 Jul 8;589(15):1847–1854. PubMed PMID: 25980607.
- Mir SU, George NM, Zahoor L, et al. Inhibition of autophagic turnover in β-cells by fatty acids and glucose leads to apoptotic cell death. J Biol Chem. 2015 Mar 6;290(10):6071–6085. PubMed PMID: 25548282; PubMed Central PMCID: PMCPMC4358249.
- Tu Y, Sun W, Gu LB, et al. [Molecular mechanism of rhein on inhibiting autophagic protein expression in renal tubular epithelial cells via regulating mTOR signaling pathway activation]. Zhongguo Zhong Yao Za Zhi. 2014 Nov;39(21):4090–4095. PubMed PMID: 25775774.
- Tan SH, Shui G, Zhou J, et al. Induction of autophagy by palmitic acid via protein kinase C-mediated signaling pathway independent of mTOR (mammalian target of rapamycin). J Biol Chem. 2012 Apr 27;287(18):14364–14376. PubMed PMID: 22408252; PubMed Central PMCID: PMCPMC3340233.
- Sinha RA, Singh BK, Zhou J, et al. Loss of ULK1 increases RPS6KB1-NCOR1 repression of NR1H/LXR-mediated Scd1 transcription and augments lipotoxicity in hepatic cells. Autophagy. 2017 Jan 2;13(1):169–186. PubMed PMID: 27846372; PubMed Central PMCID: PMCPMC5240836.
- Cazanave SC, Mott JL, Bronk SF, et al. Death receptor 5 signaling promotes hepatocyte lipoapoptosis. J Biol Chem. 2011 Nov 11;286(45):39336–39348. PubMed PMID: 21941003; PubMed Central PMCID: PMCPMC3234758.