
ABSTRACT
Mitochondrial quality control is essential for maintaining a healthy population of mitochondria. Two proteins associated with Parkinson disease, the kinase PINK1 and the E3 ubiquitin ligase PRKN, play a central role in the selective degradation of heavily damaged mitochondria (mitophagy), thus avoiding their toxic accumulation. Most of the knowledge on PINK1-PRKN mitophagy comes from in vitro experiments involving the treatment of mammalian cells with high concentrations of mitochondrial uncouplers, such as CCCP. These chemicals have been shown to mediate off target effects, other than mitochondrial depolarization. A matter of controversy between mitochondrial physiologists and cell biologists is the discrepancy between concentrations of CCCP needed to activate mitophagy (usually >10 μM), when compared to the much lower concentrations used to depolarize mitochondria (<1 μM). Thus, there is an urgent need for optimizing the current methods to assess PINK1-PRKN mitophagy in vitro. In this study, we address the utilization of high CCCP concentrations commonly used to activate mitophagy. Combining live fluorescence microscopy and biochemistry, we show that the FBS/BSA in the cell culture medium reduces the ability of CCCP to induce PINK1 accumulation at depolarized mitochondria, subsequent PRKN recruitment and ubiquitin phosphorylation, and ultimately mitochondrial clearance. As a result, high concentrations of CCCP are required to induce mitophagy in FBS/BSA containing media. These data unite mitochondrial physiology and mitophagy studies and are a first step toward a consensus on optimal experimental conditions for PINK1-PRKN mitophagy and mitochondrial physiology investigations to be carried out in parallel.
Abbreviations: BSA: bovine serum albumin; CCCP: carbonyl cyanide m-chlorophenylhydrazone; DMEM: dulbecco’s Modified Eagle’s Medium; DNP: 2,4-dinitrophenol; FBS: fetal bovine serum; FCCP: carbonyl cyanide-4-(trifluoromethoxy)phenylhydrazone; GSH: glutathione; HBSS: Hanks‘ balanced salt solution; mtKeima: mitochondria-targeted monomeric keima-red; PBS: phosphate buffered saline; PD: Parkinson disease; PINK1: PTEN induced kinase 1; POE SHSY5Ys: FLAG-PRKN over-expressing SHSY5Y cells; SDS-PAGE: sodium dodecyl sulfate polyacrylamide gel electrophoresis; TMRM: tetramethylrhodamine methyl ester; WB: western blot; WT: wild-type; ΔΨm: mitochondrial membrane potential
Introduction
Mitochondria play a key role in numerous cellular processes, including regulation of redox signaling, ATP production and calcium homeostasis [Citation1]. The accumulation of damaged, non-functional mitochondria can be detrimental to cell homeostasis and ultimately lead to cell death. As a result, cells have developed a number of quality control mechanisms that avoid the toxic accumulation of highly dysfunctional mitochondria, one of which is the selective degradation of damaged mitochondria by autophagy i.e. mitophagy [Citation2].
The discovery of recessive mutations in the PINK1 (PTEN induced kinase 1) and PRKN (parkin RBR E3 ubiquitin protein ligase) genes in Parkinson disease (PD) has facilitated our mechanistic understanding of mitophagy. In mammalian cells, the mitochondrial kinase PINK1 selectively accumulates at the surface of damaged mitochondria where it phosphorylates ubiquitin and recruits, phosphorylates and activates the E3 ubiquitin ligase PRKN. Shortly after recruitment, PRKN ubiquitinates a number of outer mitochondrial membrane proteins. This leads to the recruitment of the autophagy and the ubiquitin proteasome system machineries, triggers the engulfment of damaged mitochondria in autophagosomes and further fusion with lysosomes, and ultimately leads to the degradation of the targeted mitochondria [Citation3]. Mitophagy plays an active role in maintaining cellular homeostasis and functions, such as cell differentiation and development, cell programming and immune response [Citation4,Citation5]. Moreover, deficiencies in mitophagy have been associated with a number of human diseases, such as cancer and neurodegenerative conditions, including PD but also Alzheimer diseases, amyotrophic lateral sclerosis and Huntington disease [Citation6].
The most common methods used to study PINK1-PRKN mitophagy in mammalian cell lines include Western blotting (WB) to assess PINK1 mitochondrial accumulation and clearance of mitochondrial markers, and fluorescence microscopy to measure co-localization of PRKN and autophagy markers with depolarized mitochondria, and mitochondrial ubiquitin phosphorylation in fixed cells. Finally, mitophagy can be visualized with mtKeima in live cells [Citation7,Citation8]. In healthy mammalian cells, mitophagy is an infrequent event; thus, most studies utilize PRKN over-expression and high concentrations of mitochondria stressors to initiate the process. Typically, exposure of cells to the mitochondrial uncoupler Carbonyl cyanide m-chlorophenyl hydrazine (CCCP) causes an increase in membrane proton conductance and consequently a loss of mitochondrial membrane potential (ΔΨm) [Citation9].
A long-standing controversy between mitochondrial biochemists and physiologists is that the concentrations of CCCP needed to activate mitophagy are much higher than those needed to depolarize mitochondria. While mitochondrial physiologists observe instant complete mitochondrial depolarization with low CCCP concentrations (<1 μM), cell biologists require significantly higher concentrations of CCCP (usually >10 μM for several hours) to elicit PINK1-induced mitophagy.
In this study, we compare the methods commonly used by mitochondrial physiologists and biologists, live fluorescence microscopy and biochemistry respectively, to assess the ability of CCCP to depolarize SHSY5Y cells and induce subsequent mitophagy. We show that lowering the concentrations of fetal bovine serum (FBS) or bovine serum albumin (BSA) in the cell culture media is key to facilitating PINK1 accumulation at damaged mitochondria, subsequent PRKN recruitment, ubiquitination of outer mitochondrial membrane proteins, and ultimate degradation of mitochondrial markers following treatment with low concentrations of CCCP. These important data reconcile both disciplines and open the door for parallel investigations to be carried out in similar experimental conditions.
Results
FBS inhibits CCCP-dependent depolarization of mitochondria
While it is unanimously accepted that PINK1 accumulates at the surface of depolarized mitochondria [Citation10], the low concentrations of CCCP needed to induce instant mitochondrial depolarization (usually 100 nM – 1 μM) contrast with the necessity for high concentrations (usually 10–30 μM) to induce mitophagy. Most live cell imaging, including tetramethylrhodamine methyl ester (TMRM) measurements, are carried out in FBS-free Hanks‘ balanced salt solution (HBSS) while mitophagy experiments usually use FBS-containing Dulbecco’s Modified Eagle’s Medium (DMEM), in order to maintain cell health during the long CCCP treatment needed to assess mitophagy at the various stages of the process.
We hypothesized that either different concentrations of FBS or DMEM composition may alter CCCP’s ability to depolarize mitochondria and explain the above discrepancies. In order to investigate this possibility, we assessed ΔΨm in FLAG-PRKN over-expressing SHSY5Y cells (POE SHSY5Ys) maintained in either DMEM or HBSS, supplemented with either 0%, 1%, or 10% of FBS, and treated with either DMSO, 1 μM CCCP or 10 μM CCCP for 1.5 h. ΔΨm was measured using TMRM on the Opera PhenixTM confocal High Content Screening microscope, allowing for simultaneous measurements of all experimental conditions (). While 1 μM and 10 μM CCCP treatments resulted in a complete depolarization of mitochondria in FBS-free DMEM () and FBS-free HBSS (), the mitochondrial depolarization induced by 1 μM CCCP in FBS-free media was considerably reduced in 1% FBS supplemented media (fold-change of 0.11 ± 0.09 and 0.40 ± 0.23 respectively; all these data throughout the manuscript are indicated as fold-changes compared to 10% FBS supplemented media treated with DMSO), and almost completely abolished in media supplemented with 10% FBS (0.72 ± 0.18). A higher concentration of CCCP (10 μM) was required to fully depolarize mitochondria in HBSS and DMEM supplemented with 10% FBS. These data were confirmed in wild-type (WT) SHSY5Y cells not over-expressing FLAG-PRKN (Fig. S1A and 1B). The WT SHSY5Y cells recapitulate the findings with POE SHSY5Y cells with a difference in basal TMRM signal with 1% FBS (0.78 ± 0.14) and FBS-free (0.11 ± 0.02) medium, as well as the inhibition of depolarization with 1 μM CCCP with increased FBS medium levels (FBS-free 0.03 ± 0.03 vs 1% FBS 0.26 ± 0.02 vs 10% FBS 0.80 ± 0.08). These data were further confirmed in Hela cells over-expressing HA-PRKN (Fig. S6A), where serum-starving resulted in a loss of basal TMRM signal (FBS-free 0.39 ± 0.07 vs 1% FBS 1.04 ± 0.16 vs 10% FBS 1.00 ± 0.08) and FBS inhibited the ability of 1 μM CCCP to depolarize the mitochondria (FBS-free 0.13 ± 0.05 vs 1% FBS 0.39 ± 0.17 vs 10% FBS 0.93 ± 0.08).
Figure 1. FBS inhibits CCCP-induced depolarization of mitochondria in SHSY5Y POE cells. Cells were maintained in DMEM or HBSS supplemented with either 0%, 1% or 10% FBS and loaded with 25 nM TMRM dye 30 min prior to treatment with either DMSO, 1 μM or 10 μM CCCP. Representative images of TMRM signal in SHSY5Y POE cells maintained in DMEM supplemented with 10 mM HEPES (A) or in HBSS (B) media, and imaged 1.5 h after treatment on the Opera PhenixTM. Graphs (C and D) show mean TMRM levels normalized to DMSO treatment with 10% FBS supplemented media ±S.D. (N = 3). Representative traces of real-time TMRM fluorescence of POE SHSY5Y cells in DMEM supplemented with 0%, 1% or 10% FBS with the addition of 1 μM CCCP (e). CCCP (10 μM) was added to confirm full depolarization. Data displayed as mean ±S.E.M.
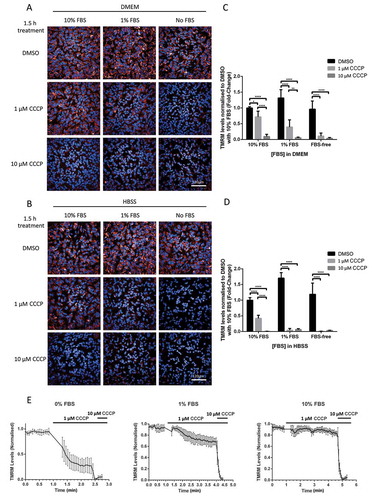
The composition of the DMEM differs with the HBSS, in particular DMEM contains higher glucose concentrations and contains some sodium pyruvate. HBSS was supplemented with either glucose or sodium pyruvate (Sigma Aldrich, P2256), however none of these components was able to influence the ability of 1 μM CCCP to depolarize mitochondria in POE SHSY5Y cells (Fig. S2). This suggests that the FBS concentrations, rather than the glucose or sodium pyruvate concentrations, were likely to be a major determining factor for affecting the ability of CCCP to depolarize mitochondria.
We further assessed ΔΨm over time using single cell live confocal microscopy in POE SHSY5Y cells maintained in DMEM supplemented with 0%, 1% or 10% FBS and treated with 1 μM CCCP prior to full depolarization with 10 μM (). These data confirmed that that while 10 μM CCCP results in full mitochondrial depolarization in all media conditions, 10% FBS prevents mitochondria from depolarizing following treatment with 1 μM CCCP. While TMRM and phenol red are excited at different wavelengths, 548 nm and 440 nm [Citation11], respectively, we checked that the above observations couldn’t be attributed to phenol red fluorescence in DMEM (Fig. S3); no statistically significant difference was observed between medium with phenol and phenol-free medium containing DMSO (1.07 ± 0.10 and 1.00 ± 0.11 respectively), 1 μM CCCP (0.77 ± 0.05 and 0.68 ± 0.23 respectively), or 10 μM CCCP (0.07 ± 0.03 and 0.09 ± 0.06 respectively; these data are normalized to DMSO treatment in phenol red containing DMEM). Further, we confirmed these observations with another uncoupling agent structurally similar to CCCP, carbonyl cyanide-p-trifluoromethoxyphenylhydrazone (FCCP), in DMEM supplemented with 10% FBS (Fig. S4).
All together, these data suggest that increasing levels of FBS in culture media decrease the ability of 1 μM CCCP/FCCP to fully depolarize mitochondria, providing a possible explanation as to why biochemistry experiments require high CCCP concentrations to induce PINK1-PRKN-dependent mitophagy in cell lines maintained in DMEM supplemented with 10% FBS.
FBS inhibits CCCP-dependent activation of mitophagy
Using SDS-PAGE and WB, we then examined whether mitophagy could be induced with 1 μM CCCP when the concentration of FBS was decreased in the DMEM medium. To this end, POE SHSY5Ys were maintained in DMEM supplemented with either 0%, 1% or 10% FBS for 30 min prior to treatment with low (1 μM) or high (10 μM) concentrations of CCCP for 3 h, cell lysis and WB (). This data shows that depleting FBS from the DMEM allowed 1 μM CCCP-induced mitophagy, as assessed by mitochondrial accumulation of PINK1 (4.14 ± 0.38), recruitment of FLAG-PRKN (4.02 ± 1.73), and degradation of mitofusin-2 (MFN2) (0.19 ± 0.15); similar to 10 μM CCCP effects on PINK1 accumulation (4.06 ± 1.54), FLAG-PRKN recruitment (3.36 ± 0.61), and MFN2 degradation (0.15 ± 0.11) in FBS-free medium. MFN2 is a substrate for PRKN, thus indicating PRKN activity [Citation12]. Conversely, the supplementation of DMEM with either 1% or 10% FBS prevented 1 μM CCCP to stimulate mitochondrial PINK1 accumulation (1% FBS 0.66 ± 0.18 vs 10% FBS 0.68 ± 0.13), recruitment of FLAG-PRKN (1% FBS 1.30 ± 0.59 vs 10% FBS 0.95 ± 0.40), and degradation of MFN2 (1% FBS 0.73 ± 0.31 vs 10% FBS 0.91 ± 0.09); but did not prevent 10 μM CCCP’s ability to promote PINK1 accumulation (1% FBS 8.99 ± 0.61 vs 10% FBS 9.25 ± 0.68), FLAG-PRKN recruitment (1% FBS 3.84 ± 1.51 vs 10% FBS 4.16 ± 2.69), and MFN2 degradation (1% FBS 0.03 ± 0.02 vs 10% FBS 0.08 ± 0.12). Interestingly, LC3 accumulation was observed in mitochondria enriched fractions following CCCP treatment in low FBS DMEM medium, but not in the corresponding cytoplasmic fractions, suggesting that the FBS concentration affected mitophagy, as opposed to macroautophagy (). While supplementing the media with 1% or 10% FBS blocked the effect of 1 μM CCCP, this didn’t affect the ability of 10 μM CCCP to activate mitophagy. This data was confirmed in WT SHSY5Y cells not over-expressing FLAG-PRKN (Fig. S5A – B) and in Hela cells over-expressing HA-PRKN (Fig. S6B), further mirroring the TMRM data described above (). Interestingly, while the removal of FBS allowed for 1 μM CCCP to activate mitophagy, the levels of PINK1 accumulation were slightly reduced in FBS-free medium compared to 10% FBS medium in SHSHY5Y POE cells following 10 μM CCCP treatment (4.06 ± 1.54 and 9.25 ± 0.68 respectively), possibly due to reduced AKT phosphorylation at serine 473 following FBS starvation (), which was shown to be important for PINK1-dependent mitophagy [Citation13].
Figure 2. FBS inhibits CCCP-induced PINK1/PRKN mitophagy in SHSY5Y POE cells. SHSY5Y POE were maintained in either 0%, 1% or 10% FBS for 30 min prior to treatment with DMSO, 1 μM or 10 μM CCCP treatments for 3 h. Mitochondria-enriched fractions were run on SDS-PAGE gels followed by WB using the indicated antibodies (A). Graphs (B–F) display quantified images showing fold changes ±S.D. of PINK1 accumulation (B), FLAG-PRKN recruitment (C) MFN2 levels (D), mitochondrial LC3 levels (E), and cytoplasmic LC3 levels (F) normalized to Complex V (N = 3). Immunocytochemistry of POE SHSY5Y cells stained with anti-phospho-ubiquitin serine 65 (pUBQ; green – 488 nm) (G), with graph (H) showing mean quantified pUBQ levels ±S.D. (N = 4). All data are normalized to DMSO treatment with media supplemented with 10% FBS.
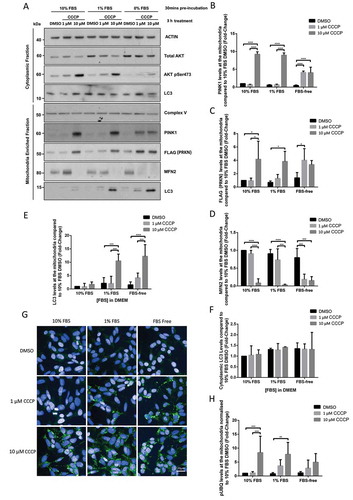
Once PINK1 is recruited to the mitochondria, it phosphorylates ubiquitin at serine 65, and the phospho-ubiquitin signal triggers the recruitment of autophagy receptors, the subsequent engulfment of mitochondria by autophagosomes and their ultimate degradation by lysosomes [Citation3]. In order to determine whether FBS depletion also affected phosphorylation of mitochondrial ubiquitin and subsequent mitophagy, POE SHSY5Y cells were maintained in DMEM supplemented with 0%, 1% or 10% FBS and treated with DMSO, 1 μM or 10 μM CCCP for 3 h prior to measurement of the phospho-serine 65 ubiquitin signal by fluorescence microscopy (). Finally, engulfment of depolarized mitochondria by lysosomes was assessed in stable POE SHSY5Y cells expressing the pH-dependent mitochondrial protein mtKeima, which fluorescence was shown to shift from green to red as mitochondria are delivered to the lysosomes [Citation8] (). These data confirmed that decreasing the concentration of FBS in the cell media allows for 1 μM CCCP to increase phospho-serine 65 ubiquitin (1% FBS 3.64 ± 2.24 vs 10% FBS 1.09 ± 0.49), a proxy for PINK1 activity, and to increase mitochondrial degradation (mtKeima mitophagy index at 3.5 h: 1% FBS 0.18 ± 0.03 vs 10% FBS 0.06 ± 0.01), a measure of mitophagy. Finally, the mtKeima data were confirmed in WT SHSY5Y cells not over-expressing FLAG-PRKN (Fig. S5B).
Figure 3. FBS inhibits CCCP-induced engulfment of depolarized mitochondria by lysosomes in SHSY5Y POE cells. For the mtKeima reporter assay, SHSY5Y POE cells stably expressing the mtKeima reporter were pretreated with DMEM containing different concentrations of FBS as indicated. CCCP and Hoechst were added, and cells were imaged at the indicated time points (A). The mitophagy index was calculated as the ratio between total area of mitochondria located in lysosomes versus total area of mitochondria located in the cytoplasm (B). The results shown are from one representative experiment (N = 2). The data are displayed as mean ± S.D. of eight replicates.

All together, these data suggest that the FBS in the cell culture medium affects CCCP’s ability to induce PINK1/PRKN-dependent mitophagy, likely through affecting mitochondrial depolarization.
BSA inhibits CCCP-dependent, but not O/A-dependent depolarization of mitochondria and subsequent mitophagy
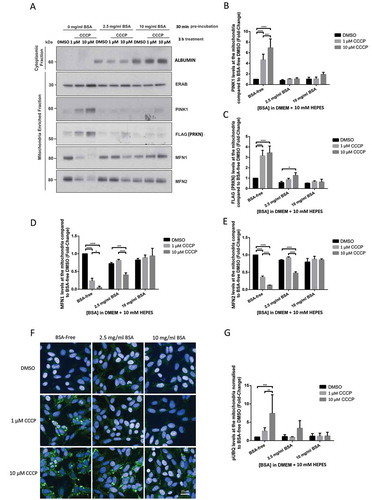
Bovine serum albumin (BSA) is a major component of FBS (approximately 2.5 mg/ml in FBS [Citation14]), which has been shown to bind free unsaturated fatty acids and to interfere with ΔΨm in potato mitochondria [Citation15] and in mammalian cells [Citation16]. We therefore hypothesized that BSA could be one of the FBS components contributing to decreasing CCCP’s ability to induce mitochondrial depolarization and subsequent mitophagy. To test this hypothesis, we repeated the experiments described above in POE SHSY5Y cells cultured in FBS-free DMEM supplemented with 0 mg/ml, 2.5 mg/ml BSA (approximately equivalent to 10% FBS media albumin concentration) or 10 mg/ml BSA. Interestingly, 2.5 mg/ml BSA was enough to abolish 1 μM CCCP’s ability to depolarize mitochondria in DMEM and considerably reduce it in HBSS (); fold-changes of 1.68 ± 0.79 and 0.56 ± 0.39 respectively compared to 0.06 ± 0.04 with 0 mg/ml BSA in DMEM; all these data throughout the manuscript are given as fold-changes compared to 0 mg/ml BSA medium treated with DMSO). Using WB or fluorescence microscopy, we further confirmed that PINK1 accumulation to damaged mitochondria (10 mg/ml 1.07 ± 0.04 vs 2.5 mg/ml BSA 1.06 ± 0.04 vs BSA-free 4.67 ± 1.05), FLAG-PRKN recruitment (10 mg/ml 0.67 ± 0.12 vs 2.5 mg/ml BSA 0.86 ± 0.12 vs BSA-free 3.15 ± 0.53), ubiquitin phosphorylation (10 mg/ml 1.22 ± 0.82 vs 2.5 mg/ml BSA 0.94 ± 0.13 vs BSA-free 2.63 ± 0.88) and MFN2 degradation (10 mg/ml 0.88 ± 0.08 vs 2.5 mg/ml BSA 0.92 ± 0.03 vs BSA-free 0.36 ± 0.04) () were also inhibited by supplementation of the medium with 2.5 mg/ml or 10 mg/ml BSA following 1 μM CCCP treatment. The addition of BSA to the medium also affected the ability of 10 μM CCCP to trigger PINK1 accumulation at the mitochondria (10 mg/ml 1.92 ± 0.39 vs 2.5 mg/ml BSA 1.07 ± 0.22 vs BSA-free 6.93 ± 1.67), FLAG-PRKN recruitment (10 mg/ml 0.64 ± 0.25 vs 2.5 mg/ml BSA 1.26 ± 0.27 vs BSA-free 3.44 ± 0.65), ubiquitin phosphorylation (10 mg/ml 1.28 ± 1.01 vs 2.5 mg/ml BSA 3.36 ± 2.08 vs BSA-free 7.42 ± 5.07), and MFN2 degradation (10 mg/ml 0.86 ± 0.03 vs 2.5 mg/ml BSA 0.48 ± 0.04 vs BSA-free 0.13 ± 0.01).
Figure 4. BSA inhibits CCCP-induced depolarization of mitochondria in SHSY5Y POE cells. Cells were maintained in DMEM or HBSS, both without FBS, supplemented with either 0 mg/ml, 2.5 mg/ml or 10 mg/ml BSA and loaded with 25 nM TMRM dye 30 min prior to treatment with either DMSO, 1 μM or 10 μM CCCP. Representative images of TMRM signal in SHSY5Y POE cells maintained in DMEM supplemented with 10 mM HEPES (A) or in HBSS (B) media, and imaged 1.5 h after treatment using the Opera PhenixTM. Graphs (C and D) show mean TMRM levels normalized to DMSO treatments with 10% FBS supplemented media ±S.D. (N = 3).
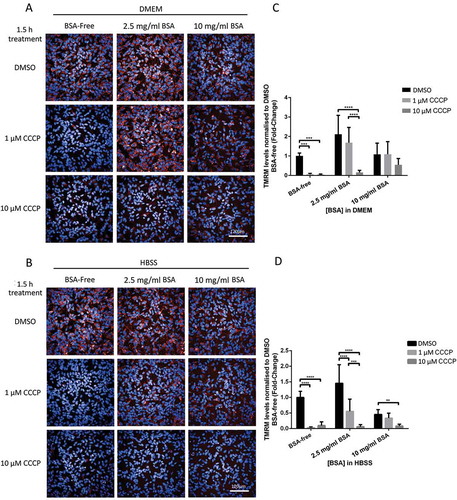
Figure 5. BSA inhibits CCCP-induced PINK1-PRKN mitophagy in SHSY5Y POE cells SHSY5Y POE were maintained in DMEM, without FBS, and supplemented with 0 mg/ml, 2.5 mg/ml or 10 mg/ml BSA for 30 min prior to treatment with DMSO, 1 μM or 10 μM CCCP treatments for 3 h. Mitochondria-enriched fractions were run on SDS-PAGE gels followed by WB using the indicated antibodies (A). Graphs (B–E) display quantified images showing fold changes ±S.D. of PINK1 accumulation (B), FLAG-PRKN recruitment (C), MFN1 (D) and MFN2 (E) levels (N = 3). Immunocytochemistry of POE SHSY5Y cells stained with anti-phospho-ubiquitin serine 65 (pUBQ; green – 488 nm) (F), with graph (G) showing mean quantified pUBQ levels ±S.D. (N = 4). All data normalized to DMSO treatment with media supplemented with 10% FBS.
To determine whether the effects of FBS and BSA on CCCP-dependent mitophagy are specific to CCCP, we also examined the ability of a combined treatment of Oligomycin, an ATP synthase inhibitor, and Antimycin A, an inhibitor of cytochrome c reductase (complex III of the respiratory chain) (O/A), to depolarize the mitochondria and induce mitophagy in FBS and BSA supplemented DMEM [Citation17]. The ability of 1 μM oligomycin/antimycin (O/A) treatments to depolarize mitochondria and to induce mitophagy was not prevented by BSA, suggesting that the effect of BSA on TMRM and mitophagy is specific to CCCP (Fig. S7A and 7B).
All together these data suggest that adding BSA in the cell culture medium prevents the ability of commonly used concentrations of CCCP, but not O/A, to induce mitochondrial depolarization and subsequent PINK1-PRKN dependent mitophagy.
Discussion
The mitochondria uncoupler DNP (2,4-dinitrophenol) was used in the 1930’s for the treatment of obesity with moderate success [Citation18]. However, this concept was abandoned and DNP withdrawn from the market in 1938 due to adverse effects [Citation19]. Additionally, a majority of uncouplers, including DNP and CCCP, were subsequently found to have very steep pharmacodynamics profiles, where small increases in concentration resulted in large changes of the phenotype [Citation20]. This has hampered the use of uncouplers as potential treatments and has also limited their application as research tools in early stage drug discovery, for other indications where mitochondrial health is implicated, such as PD. The underlying mechanism for the low dynamic range of uncouplers has not been investigated in detail and is largely unknown. Here, we identified that the narrow pharmacodynamics range of CCCP in cells is potentially due to the interaction of CCCP with FBS/BSA.
CCCP is one of the most commonly used compounds to induce PINK1-PRKN dependent mitophagy (for a review see [Citation21]). However, a long-lasting concern raised by mitochondrial researchers is the inability of low CCCP concentrations to induce mitophagy, despite instant mitochondrial depolarization. The data presented in this manuscript suggests that the concentration of FBS in the cell culture medium, and more specifically the albumin contained in the FBS, alters CCCP’s ability to induce depolarization and subsequent PINK1-PRKN mitophagy. Conversely, the absence of FBS or albumin allows for lower levels of CCCP to depolarize mitochondria and further induce mitophagy. Interestingly, we also observe an alteration in the basal TMRM signal depending on the levels of BSA in the media suggesting a more general effect on mitochondrial health as well as an effect on mitophagy.
Reactive oxygen species production is reported to be required for PINK1-PRKN mitophagy while glutathione (GSH) can scavenge reactive oxygen species [Citation22], thus reducing the levels of mitophagy. Albumin and FCCP have been shown to increase and decrease intracellular GSH levels, respectively [Citation23,Citation24], suggesting that a high concentration of CCCP/FCCP may be needed to overcome the high levels of GSH in medium supplemented with BSA, and further initiate mitophagy. It has also been reported that albumin is an important binding protein facilitating endogenous transport for several components of serum (e.g. fatty acids, proteins, growth factors, nutrients) all of which may have an effect on mitochondrial health [Citation25]. Finally, albumin is known to have a major effect on in vivo drug kinetics, thus there is a potential for albumin containing media to bind a portion of CCCP and prevent it from depolarizing the mitochondria and inducing mitophagy.
CCCP/FCCP have been shown to induce off-target effects, potentially interfering with the mitochondrial depolarization-induced mitophagy process [Citation21,Citation26]. A couple of original PINK1-PRKN dependent mitophagy studies have used 2 μM of CCCP in Hela cells over-expressing PRKN [Citation10,Citation27]. Interestingly, these studies were performed in serum-free medium. Subsequently however, a vast majority of the studies utilized higher doses of CCCP (typically ≥10 μM) in medium containing 10% FBS. Our study provides evidence that low CCCP concentrations (1 μM) can induce PINK1-PRKN mitophagy in low BSA medium in mammalian cell lines and BSA does not inhibit 1 μM O/A treatment from depolarizing mitochondria and stimulating mitophagy. These findings will facilitate the parallel investigation of mitochondrial physiology (e.g. ΔΨm, calcium homeostasis, ROS and ATP generation) and mitophagy.
Materials and methods
Chemicals and antibodies
The following antibodies were used for WB and ICC experiments: anti-Actin (Abcam Ab8224), anti-MFN1 (Cell Signalling Technology, 14,739) anti-MFN2 (Cell Signalling Technology, 9482), anti-AKT (Cell Signalling Technology, 9272)anti-AKT pSer473 (Cell Signalling Technology, 4060), anti-FLAG (Sigma-Aldrich, F7425), anti-ATPB (Abcam, Ab14730; complex V), anti-BSA (Thermo Fisher Scientific, A11133), anti-rabbit IgG (whole molecule)–peroxidase (Sigma-Aldrich, A0545), anti-mouse IgG (whole molecule)–peroxidase (Sigma-Aldrich, A4416), anti-HA (Sigma-Aldrich, 11,867,423,001), LC3B (Novus Biologicals, NB100-2220), alexa fluor 488 goat anti-rabbit (Thermo Fisher Scientific, A-11,008), alexa fluor 568 goat anti-mouse (Thermo Fisher Scientific, A-11,004), Phospho-Ubiquitin (Ser65), phospho-ubiquitin pSer65 (Cell Signalling Technology, 37,642). The generation of PINK1 rabbit monoclonal antibody has been described elsewhere [Citation13].
Additional reagents: BSA (Sigma-Aldrich, A7030), PBS (Thermo Fisher Scientific, 14,190–144)
SHSY5Y and hela cell culture
The SHSY5Y neuroblastoma cell line over-expressing FLAG-PRKN were a kind gift from H. Ardley (Institute of Molecular Medicine, Leeds, U.K.). The methods for their generation are described elsewhere [Citation28]. While Hela HA-PRKN over-expressing cells were generated using Amaxa’s protocol for electroporation (https://bioscience.lonza.com/lonza_bs/CH/en/document/download/21456). Transfected cells were selected using 1 μg/ml of Puromycin dihydrochloride (Sigma-Aldrich, P7255) followed by clonal expansion. Both SHSY5Y WT/POE and Hela POE cells were maintained in Dulbecco’s modified Eagle medium (Thermo Fisher Scientific, 11,995,073), supplemented with 10% heat-inactivated fetal bovine serum (Thermo Fisher Scientific, 10,500–064) in a 5% CO2 humidified chamber incubated at 37°C.
Measurement of mitochondrial membrane potential
TMRM (Sigma-Aldrich, T5428) is a cationic, fluorescent dye that is sequestered by intact active polarized mitochondria, thus can be used to estimate ΔΨm. Using live cell imaging, cells were maintained in either DMEM (supplemented with pH buffer HEPES) (Sigma-Aldrich, H3375) or HBSS (10 mM HEPES, 10 mM glucose (Sigma-Aldrich, G6152), 2 mM CaCl2 · 2H2O (Sigma-Aldrich, C3881), 1.25 mM KH2PO4 (Sigma-Aldrich, P5379), 2 mM MgSO4 (Sigma-Aldrich, M7506), 3 mM KCl (Sigma-Aldrich, P9333), 156 mM NaCl (Sigma-Aldrich, S7653) loaded with 25 nM TMRM for a minimum of 40 min in a 5% CO2 humidified chamber incubated at 37°C (cell media indicated in figure legends). Using either the Opera PhenixTM high content screening confocal microscope (Perkin Elmer Inc.) or a Zeiss 710 VIS CLSM equipped with a META detection system, TMRM (excitation 560 nm) emitted fluorescence was measured at 580 nm. For all TMRM experiments using Opera PhenixTM, 1 μg/ml Hoechst (Thermo Fisher Scientific, 62,249) was added along with the TMRM with emitted fluorescence measured at 460 nm.
Mitochondria isolation
Cell media was removed, and cells then washed with phosphate buffered saline (PBS) before addition of mitochondrial homogenization buffer (10 mM Tris, 1 mM EDTA (edetate disodium salt dehydrate), and 250 mM sucrose, pH 7.4 and supplemented with protease/phosphatase inhibitors) then frozen at −80°C overnight. The following morning, thawed lysates are then transferred into centrifuge tubes, triturated 20 x, then frozen again at −80°C for 1 h. Samples are then thawed on ice, centrifuged at 1,500 x g for 10 min 4°C and the supernatant removed. Subsequently, the supernatant was centrifuged at 12,000 x g for 10 min to pellet the mitochondria, followed by x 2 homogenization buffer washes to remove cytoplasm contamination. For SDS-PAGE and WB, the isolated mitochondria pellets were reconstituted in 1x NuPAGE® Sample Buffer (Thermo Fisher Scientific, NP0008), plus 10 mM 1,4-Dithiothreitol (Roche, 10 708 984 001), sonicated (Soniprep150 Plus) for 2 × 10 s at 10 mA, then heated to 70°C for 10 min.
Immunoblotting and immunofluorescence
SDS-PAGE and WB methods are detailed elsewhere [Citation29]. For immunocytochemistry (ICC) experiments, cells were plated on CellCarrier-96 Black, Optically Clear Bottom tissue culture plates (PerkinElmer, 6,055,302). Cells were fixed with 4% (w:v) formaldehyde, (10–15% methanol; Sigma-Aldrich F8775) in PBS solution for 10 min at room temperature before blocking/permeabilizing for 45 min in 10% (v:v) FBS in PBS with 0.5% (v:v) Triton-X100 (Sigma-Aldrich, 93,443). Primary antibodies (PBS plus 10% FBS) were added and incubated at room temperature for 2 h. Cells were then washed x 3 PBS, and the appropriate fluorescent secondary antibodies (PBS plus 10% FBS for either alexa fluor 488 nm or 568 nm secondary species-specific antibodies, 1:2000) were added for 1 hr, with the addition of Hoechst 33,342 (1:2000). Following a further x 3 PBS washes, cells were kept in 100 μl PBS at 4°C.
Image processing
Scanned WB images were quantified using ImageJ.
ICC measurements of UBQ pSer65 accumulation were captured using an Opera PhenixTM High Content Screening confocal microscope (PerkinElemer Inc.) and Columbus 2.8 software (PerkinElemer Inc.) was used for analysis. Mitochondria regions were defined using mitochondria marker ATPB antibody (Complex V) (568 nm), and UBQ pSer65 signal (488 nm) was measured within those areas. Integrated intensity of spots was calculated by multiplying spot intensity by the area of mitochondria covered by the UBQ pSer65 or TMRM signals. See Fig. S8 for an illustrated explanation of TMRM analysis work-flow.
Measurement of mitophagy levels using the mtKeima reporter
For the Keima mitophagy assay SHSY5Y and POE SHSY5Y cells were transfected with mitochondria-targeted monomeric Keima-Red (mtKeima) (Medical and Biological laboratories Co., Ltd. AM-V0251) and stable cell lines generated by culturing the cells in media containing 500 μg/ml G418. For the assay, mtKeima expressing cells (9000 per well) were seeded in a 384 well plate, coated with Geltrex (Thermo Fisher Scientific, A1413302). The following day, culture media was removed, cells were washed once in FBS-free DMEM and incubated for 1 h in DMEM containing 0%, 1% or 10% FBS, respectively. For the assay, the cell medium was replaced with DMEM containing the desired FBS and CCCP concentration and Hoechst. Cells were imaged on the Opera PhenixTM high content confocal microscope (PerkinElmer). Excitation wavelengths and emission filters used were as follow: Cytoplasmic Keima: 488 nm, 650–760 nm, Lysosomal Keima: 561 nm, 570–630 nm Hoechst: 375 nm, 435–480 nm. Images were analyzed using Columbus 2.8 (PerkinElmer) and the mitophagy index was determined. Briefly, cells and mtKeima were segmented and the area of cytoplasmic and lysosomal mtKeima was determined. The mitophagy index was calculated as ratio between total area of lysosomal mitochondria and total area of cytoplasmic mitochondria per well.
Statistical analysis and data presentation
Independent experiment numbers (N number) are indicated in figure legends for each dataset. Data was subjected to Two-way ANOVA with Tukey’s multiple comparison post-hoc analysis. Error bars on all graphs indicate mean ± standard deviation from replicate experiments. In each instance * = p < 0.05; ** = p < 0.01; *** = p < 0.001; **** = p < 0.0001; no * = no significance. All statistical analyses and graph production were carried out using GraphPad Prism (version 6, GraphPad Software, La Jolla California USA). All data in the text and figures, unless otherwise stated, are given as fold-change compared to DMSO treatment with 10% FBS-supplemented media or 0 mg/ml BSA-supplemented media depending on experiment.
Supplemental Material
Download Zip (12.8 MB)Acknowledgments
This work was supported in part by the UK Medical Research Council funding to the MRC Dementia Platform UK (MR/M02492X/1) and Medical Research Council core funding to the High-Content Biology Platform at the MRC-UCL LMCB university unit (MC_U12266B). M.P.M.S is funded by MRC MR/N026004/1. M.H.L. received support from the Royal Veterinary College. SW is supported by an Alzheimer Research UK Senior Research Fellowship (ARUK-SRF2016B-2). We thank Sonia Gandhi for her useful comments during the preparation of the manuscript.
Disclosure statement
No potential conflict of interest was reported by the authors.
Supplementary material
Supplementary data for this article can be accessed here.
Additional information
Funding
References
- Burchell VS, Gandhi S, Deas E, Wood NW, Abramov AY. Targeting mitochondrial dysfunction in neurodegenerative disease : Part II. Expert Opin Ther Targets. 2010:497–511.
- Ashrafi G, Schwarz TL. The pathways of mitophagy for quality control and clearance of mitochondria. Cell Death Differ. 2012;20(1):31–42.
- McWilliams TG, Muqit MM. PINK1 and Parkin: emerging themes in mitochondrial homeostasis. Curr Opin Cell Biol. 2017;45:83–91.
- Um JH, Yun J. Emerging role of mitophagy in human diseases and physiology. BMB Rep. 2017;50:299–307.
- Esteban‐Martínez L, Sierra‐Filardi E, McGreal RS, et al. Programmed mitophagy is essential for the glycolytic switch during cell differentiation. Embo J. [Internet]. 2017;36:1688–1706. Available from: http://emboj.embopress.org/lookup/doi/10.15252/embj.201695916
- Rodolfo C, Campello S, Cecconi F. Mitophagy in neurodegenerative diseases. Neurochem Int. [Internet]. 2018;117:156–166.
- Chen L, Ma K, Han J, et al. Monitoring mitophagy in mammalian cells. Methods Enzymol. 2017;588:187–208.
- Katayama H, Kogure T, Mizushima N, et al. A sensitive and quantitative technique for detecting autophagic events based on lysosomal delivery. Chem Biol. [Internet]. 2011;18:1042–1052.
- Kasianowicz J, Benz R, McLaughlin S. The kinetic mechanism by which CCCP (carbonyl cyanide m-Chlorophenylhydrazone) transports protons across membranes. J Membr Biol. 1984;82:179–190.
- Narendra DP, Jin SM, Tanaka A, et al. PINK1 is selectively stabilized on impaired mitochondria to activate Parkin. PLoS Biol. 2010;8:e1000298.
- Ettinger A, Wittmann T. Flourescence live cell imaging. Methods Cell Biol. 2015;123:77–94.
- McLelland G-L, Goiran T, Yi W, et al. Mfn2 ubiquitination by PINK1/parkin gates the p97-dependent release of ER from mitochondria to drive mitophagy. Elife. [Internet]. 2018;7:e32866. Available from: https://elifesciences.org/articles/32866
- Soutar MPM, Kempthorne L, Miyakawa S, et al. AKT signalling selectively regulates PINK1 mitophagy in SHSY5Y cells and human iPSC-derived neurons. Sci Rep. 2018:1–11. Available from: https://www.nature.com/articles/s41598-018-26949-6.pdf
- Francis GL. Albumin and mammalian cell culture: implications for biotechnology applications. Cytotechnology. 2010;62:1–16.
- Diolez P, Moreau F. Effect of bovine serum albumin on membrane potential in plant mitochondria. Physiol Plant. 1983;59:177–182.
- Tretter L, Mayer-Takacs D, Adam-Vizi V. The effect of bovine serum albumin on the membrane potential and reactive oxygen species generation in succinate-supported isolated brain mitochondria. Neurochem Int. 2007;50:139–147.
- Dairaku N, Kato K, Honda K, et al. Oligomycin and antimycin A prevent nitric. J Lab Clin Med. 2004;143(3):143–151. .
- Cutting WC, Mehrtens HG, Tainter ML. Actions and uses of dinitrophenol: promising metabolic applications. J Am Med Assoc. 1933;101:193.
- Tainter ML, Wood DA. A case of fatal dinitrophenol poisoning. J Am Med Assoc. 1934;102:1147.
- Lou P-H, Hansen BS, Olsen PH, et al. Mitochondrial uncouplers with an extraordinary dynamic range. Biochem J. [Internet]. 2007; 407:129–140. Available from: http://biochemj.org/lookup/doi/10.1042/BJ20070606
- Georgakopoulos ND, Wells G, Campanella M. The pharmacological regulation of cellular mitophagy. Nat Chem Biol. [Internet]. 2017; 13:136–146. Available from: http://www.nature.com/doifinder/10.1038/nchembio.2287
- Mailloux RJ, McBride SL, Harper ME. Unearthing the secrets of mitochondrial ROS and glutathione in bioenergetics. Trends Biochem Sci. [Internet]. 2013;38:592–602.
- Cantin AM, Paquette B, Richter M, et al. Albumin-mediated regulation of cellular glutathione and nuclear factor kappa B activation. Am J Respir Crit Care Med. 2000;162:1539–1546.
- Mlejnek P, Dolezel P. Loss of mitochondrial transmembrane potential and glutathione depletion are not sufficient to account for induction of apoptosis by carbonyl cyanide 4-(trifluoromethoxy)phenylhydrazone in human leukemia K562 cells. Chem Biol Interact. [Internet]. 2015;239:100–110.
- Yamasaki K, Chuang VTG, Maruyama T, et al. Albumin-drug interaction and its clinical implication. Biochim Biophys Acta Gen Subj. [Internet]. 2013;1830:5435–5443.
- Kane MS, Paris A, Codron P, et al. Current mechanistic insights into the CCCP-induced cell survival response. Biochem Pharmacol. [Internet]. 2018;148:100–110.
- McCoy MK, Kaganovich A, Rudenko IN, et al. Hexokinase activity is required for recruitment of parkin to depolarized mitochondria. Hum Mol Genet. [Internet]. 2014;23:145–156. [ cited 2014 May 1]. Available from: http://www.ncbi.nlm.nih.gov/pubmed/23962723
- Ardley HC, Scott GB, Rose SA, et al. Inhibition of proteasomal activity causes inclusion formation in neuronal and non-neuronal cells overexpressing Parkin. Mol Biol Cell. 2003;14:4541–4556.
- Plun-Favreau H, Klupsch K, Moisoi N, et al. The mitochondrial protease HtrA2 is regulated by Parkinson’s disease-associated kinase PINK1. Nat Cell Biol. 2007;9:1243–1252.