
ABSTRACT
The mechanisms underlying glucocorticoid (GC)-increased adiposity are poorly understood. Brown adipose tissue (BAT) acquires white adipose tissue (WAT) cell features defined as BAT whitening under certain circumstances. The aim of our current study was to investigate the possibility and mechanisms of GC-induced BAT whitening. Here, we showed that one-week dexamethasone (Dex) treatment induced BAT whitening, characterized by lipid droplet accumulation, in vitro and in vivo. Furthermore, autophagy and ATG7 (autophagy related 7) expression was induced in BAT by Dex, and treatment with the autophagy inhibitor chloroquine or adenovirus-mediated ATG7 knockdown prevented Dex-induced BAT whitening and fat mass gain. Moreover, Dex-increased ATG7 expression and autophagy was mediated by enhanced expression of BTG1 (B cell translocation gene 1, anti-proliferative) that stimulated activity of CREB1 (cAMP response element binding protein 1). The importance of BTG1 in this regulation was further demonstrated by the observed BAT whitening in adipocyte-specific BTG1-overexpressing mice and the attenuated Dex-induced BAT whitening and fat mass gain in mice with BTG1 knockdown in BAT. Taken together, we showed that Dex induces a significant whitening of BAT via BTG1- and ATG7-dependent autophagy, which might contribute to Dex-increased adiposity. These results provide new insights into the mechanisms underlying GC-increased adiposity and possible strategy for preventing GC-induced side effects via the combined use of an autophagy inhibitor.
Abbreviations
ACADL: acyl-Coenzyme A dehydrogenase, long-chain; ACADM: acyl-Coenzyme A dehydrogenase, medium-chain; ACADS: acyl-Coenzyme A dehydrogenase, short-chain; ADIPOQ: adiponectin; AGT: angiotensinogen; Atg: autophagy-related; BAT: brown adipose tissue; BTG1: B cell translocation gene 1, anti-proliferative; CEBPA: CCAAT/enhancer binding protein (C/EBP), alpha; CIDEA: cell death-inducing DNA fragmentation factor, alpha subunit-like effector A; CPT1B: carnitine palmitoyltransferase 1b, muscle; CPT2: carnitine palmitoyltransferase 2; CQ: chloroquine; Dex: dexamethasone; eWAT: epididymal white adipose tissue; FABP4: fatty acid binding protein 4, adipocyte; FFAs: free fatty acids; GCs: glucocorticoids; NRIP1: nuclear receptor interacting protein 1; OCR: oxygen consumption rate; PBS: phosphate-buffered saline; PPARA: peroxisome proliferator activated receptor alpha; PPARG: peroxisome proliferator activated receptor gamma; PPARGC1A: peroxisome proliferator activated receptor, gamma, coactivator 1 alpha; PRDM16: PR domain containing 16; PSAT1: phosphoserine aminotransferase 1; RB1: RB transcriptional corepressor 1; RBL1/p107: RB transcriptional corepressor like 1; SQSTM1: sequestosome 1; sWAT: subcutaneous white adipose tissue; TG: triglycerides; UCP1: uncoupling protein 1 (mitochondrial, proton carrier); WT: wild-type
Introduction
Glucocorticoids (GCs) are a class of steroid hormones and exert their effects by binding to the nuclear receptor glucocorticoid receptor [Citation1]. GC and their synthetic analogs, such as dexamethasone (Dex), are widely used to treat various diseases [Citation2]. Unfortunately, the development of side effects limits the long-term use of GC [Citation2]. One of such effects is the increased adiposity in white adipose tissue (WAT) caused by GC’s stimulation on adipogenesis [Citation3,Citation4]. Brown adipose tissue (BAT), another type of adipose tissue reported to be one of the target tissues for GC treatment [Citation5,Citation6], is a major site of thermogenesis by dissipating energy in the form of heat via increasing the expression of UCP1 (uncoupling protein 1 [mitochondrial, proton carrier]) [Citation7]. GC decreases BAT UCP1 expression and thermogenesis in rodents [Citation5,Citation6], whereas it is also shown that GC acutely increases but chronically suppresses BAT activity in humans [Citation8], suggesting a complex effect of GC on BAT.
BAT normally originates from its progenitor cells, however, WAT may also become browning and such cells are defined as beige fat cells [Citation7]. Extensive studies have been carried out and significant progress has been made on the understanding of WAT browning [Citation7]. Conversely, it is reported that BAT may acquire WAT cells characteristics containing the enlarged lipid droplets defined as BAT whitening in cells under certain circumstance [Citation9–Citation11]. The nature of BAT whitening and the mechanisms involved in this regulation, however, are poorly understood.
Autophagy is a cellular process that degrades intracellular organelles and proteins via autophagy-related (ATG) genes [Citation12,Citation13]. Inhibition of autophagy reduces adipogenesis [Citation14,Citation15], however, the effect of autophagy on UCP1 expression in BAT is controversial [Citation16–Citation18]. Although autophagy is shown to be induced by GC in several cell cultures [Citation19,Citation20], whether this is the case in adipose tissues remains to be investigated.
BTG1 (B cell translocation gene 1, anti-proliferative), a member of the BTG antiproliferative protein family [Citation21], was first identified as a translocation gene in a case of B-cell chronic lymphocytic leukemia [Citation22]. It is conserved among various species and ubiquitously distributed in different tissues [Citation23]. BTG1 exerts its effect through interacting with other transcription factors and affecting their activities [Citation24]. BTG1 is involved in the regulation of many different processes, including cell growth, differentiation and survival [Citation24]. Interestingly, it is shown that BTG1 is transcriptionally upregulated by GC in leukemic cells [Citation25] and erythroid progenitors [Citation26] and regulates lipid metabolism in liver [Citation27], suggesting that BTG1 may play a role in GC-induced fat mass accumulation.
The aim of our current study was to investigate the effect of GC on BAT whitening and the possible involvement of autophagy and BTG1 signaling in this regulation.
Results
Dexamethasone (dex) induces BAT whitening in vivo and in vitro
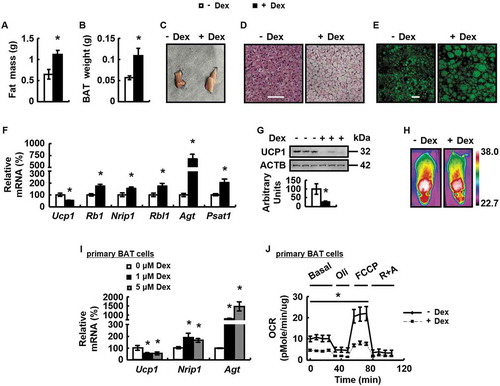
To investigate the effects of GC on BAT, we treated wild-type (WT) mice with Dex or phosphate-buffered saline (PBS) for 1 week. In consistent with other’s reports [Citation28], Dex increased fat mass content as measured by nuclear magnetic resonance () and the weight and adipocyte size of subcutaneous WAT (sWAT) and epididymal WAT (eWAT) compared with control mice (Fig. S1A-D). Meanwhile, BAT weight was also increased and appeared whitening, characterized by the accumulation of enlarged lipid droplets and increased lipid contents including triglycerides (TG) and free fatty acids (FFAs) in BAT cells of Dex-treated mice ( and Fig. S1E). To confirm the whitening character of BAT, we examined the expression of brown adipocyte and white adipocyte markers as previously reported [Citation10]. As expected, UCP1 expression was decreased, but other markers for BAT differentiation including Ppargc1a (peroxisome proliferator activated receptor, gamma, coactivator 1 alpha), Cidea (cell death-inducing DNA fragmentation factor, alpha subunit-like effector A), Prdm16 (PR domain containing 16) and Ppara (peroxisome proliferator activated receptor alpha) [Citation29] were not changed, in BAT of Dex-treated mice ( and Fig. S1F). Consistently, the expression of Rb1 (RB transcriptional corepressor 1), Nrip1 (nuclear receptor interacting protein 1) and Rbl1/p107 (RB transcriptional corepressor like 1), which inhibit BAT differentiation, were increased in BAT of Dex-treated mice (). In contrast, the expression of WAT markers, including Agt (angiotensinogen [serpin peptidase inhibitor, clade A, member 8]) and Psat1 (phosphoserine aminotransferase 1) and some of the markers for WAT differentiation including Pparg (peroxisome proliferator activated receptor gamma), Cebpa (CCAAT/enhancer binding protein [C/EBP], alpha) and Adipoq (adiponectin, C1Q and collagen domain containing) [Citation30] were increased markedly in BAT by Dex ( and Fig. S1F). Furthermore, the increased lipid accumulation was accompanied by the decreased mitochondrial function, as demonstrated by the reduced mitochondrial contents, expression of mitochondrial respiratory chain complexes (complex II, III and IV) and fatty acid oxidation genes including Cpt1b (carnitine palmitoyltransferase 1b, muscle), Cpt2 (carnitine palmitoyltransferase 2), Acadl (acyl-Coenzyme A dehydrogenase, long-chain), Acadm (acyl-Coenzyme A dehydrogenase, medium-chain) and Acads (acyl-Coenzyme A dehydrogenase, short-chain) [Citation31], as well as oxygen consumption rate (OCR), in BAT of Dex-treated mice (Fig. S1G-J). As a result, infrared images analysis showed that thermogenesis was lower in BAT of Dex-treated mice (). The mRNA levels of Ucp1, Nrip1 and Agt and oxygen consumption were also decreased by Dex in primary cultured brown adipocytes ().
Figure 1. Dex induces BAT whitening in vivo and in vitro. (A-H) Body fat mass (A), BAT weight (B), BAT gross morphology (C), H&E staining of BAT (D), BODIPY staining of BAT (E), mRNA levels of brown adipocyte markers and white adipocyte markers in BAT (F), BAT UCP1 protein levels (G) and infrared images (H) were analyzed in male WT mice i.p. injected with Dex (+ Dex) or PBS (- Dex) for 1 week. (I) mRNA levels of brown adipocyte markers and white adipocyte markers were analyzed in primary cultured brown adipocytes treated with Dex (+ Dex) or PBS (- Dex) for 24 h. (J) OCR was analyzed in primary cultured brown adipocytes treated with Dex (+ Dex) or PBS (- Dex) for 40 min. Reagents oligomycin A (Oli), carbonyl cyanide 4-(trifluoromethoxy) phenylhydrazone (FCCP), rotenone (R) and antimycin A (A) were added sequentially as indicated. Scale bars: 200 μm in D and 20 μm in E. Data are represented as mean ± SEM. Statistical significance was calculated using the two-tailed Student t-test for the effects of with compared to without Dex treatment (*: p < 0.05) in A, B, F, G, I and J.
Dex stimulates autophagy and blockade of autophagy prevents Dex-induced BAT whitening in vivo and in vitro.
Given the importance of autophagy in BAT [Citation15,Citation18] and the fact that GC can stimulate autophagy in several cell cultures [Citation19,Citation20], we hypothesized that Dex may regulate BAT whitening via autophagy.
To test this possibility, we examined protein abundance of markers for autophagy [Citation32] and observed increased LC3-II, but not SQSTM1 (sequestosome 1), in BAT of mice treated with Dex (), as shown previously [Citation20]. In addition, Dex enhanced BAT autophagic flux, evaluated by BAT injection of adenoviruses expressing LC3 (Ad-LC3) (). In the presence of lysosomal inhibitor chloroquine (CQ), a lysosomotropic weak base that blocks the fusion of autophagosomes with lysosomes [Citation33], much more increased amount of autophagosome were seen in BAT of mice treated with Dex (). Similar results were observed in primary cultured brown adipocytes (-).
Figure 2. Dex stimulates autophagy and Dex-induced BAT whitening is prevented by blockade of autophagy in vivo and in vitro. (A) LC3-II and SQSTM1 protein levels were analyzed in the BAT of male WT mice i.p. injected with Dex (+ Dex) or PBS (- Dex) for 1 week. (B) Confocal micrographs of BAT from male WT mice i.p. injected with Dex (+ Dex) or PBS (- Dex) for 1 week, with CQ (+ CQ) or PBS (- CQ) for 1 day. (C) LC3-II and SQSTM1 protein levels were analyzed in primary cultured brown adipocytes treated with 0, 1 or 5 μM Dex for 24 h. (D) Confocal micrographs of primary cultured brown adipocytes treated with Dex (+ Dex) or PBS (- Dex), with CQ (+ CQ) or PBS (- CQ) for 24 h. (E) Autophagic flux was measured in primary cultured brown adipocytes expressing GFP-LC3-RFP-LC3△G cultured with 0, 1 or 5 μM Dex for 24 h. (F-I) BAT LC3-II protein levels (F), H&E staining of BAT (G), mRNA levels of brown adipocyte markers and white adipocyte markers in BAT (H), body fat mass (I) were analyzed in male WT mice i.p. injected with CQ (+ CQ) or PBS (- CQ) for 1 week, prior to being treated with Dex (+ Dex) or PBS (- Dex) for 1 week. (J) mRNA levels of brown adipocyte markers and white adipocyte markers in primary cultured brown adipocytes treated with Dex (+ Dex) or PBS (- Dex), with CQ (+ CQ) or PBS (- CQ) for 24 h. Scale bars: 20 μm in B and D, 200 μm in G. Data are represented as mean ± SEM. Statistical significance was calculated using the two-tailed Student t-test for the effects of with compared to without Dex (*: p < 0.05) in A, C and E, or one-way ANOVA followed by the Student-Newman-Keuls (SNK) test for the effects of any group versus the control group (*: p < 0.05), with versus without Dex in CQ group (#: p < 0.05), with versus without CQ in Dex group (&: p < 0.05) in F,H-J.
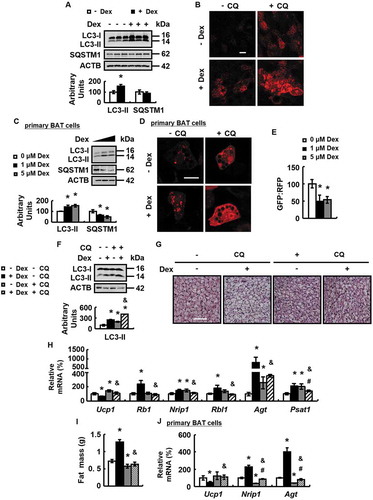
To confirm a role of autophagy in Dex-induced BAT whitening, we injected WT mice with PBS or CQ for 14 days, in the presence or absence of Dex. CQ inhibited autophagic flux in BAT of Dex-treated mice, as confirmed by the increased LC3-II protein abundance (), and blocked Dex-induced BAT whitening, as demonstrated by the decreased number of cells resembling white adipocytes with more lipid vacuoles and contents of TG and FFAs ( and Fig. S2A). Furthermore, CQ reversed the effect of Dex on the expression of markers for BAT whitening, BAT and WAT differentiation, as well as parameters reflecting mitochondrial function ( and and Fig. S2B-F). Consistently, CQ significantly decreased the fat mass content as measured by nuclear magnetic resonance in Dex-treated mice (). CQ, however, had only a slight effect on most of the parameters examined in the absence of Dex ().
Dex stimulates autophagy-related genes ATG7 expression and knockdown of ATG7 prevents Dex-induced BAT whitening in vivo and vitro.
To understand how autophagy was regulated by GC, we examined mRNA levels of autophagy regulators Atg4, Atg5, Atg6 and Atg7, all important for the production of autophagosome [Citation34], in BAT of Dex-treated mice and control mice. Dex only increased Atg7 expression, but not other regulators in BAT (). Consistently, BAT ATG7 protein levels were increased by Dex (). Similar effects were observed in primary cultured brown adipocytes (). These results prompted us to investigate the possible involvement of ATG7 in Dex-induced BAT whitening. For this purpose, mice were injected with adenovirus expressing short-hairpin (sh) RNA against Atg7 (Ad-shAtg7) or adenoviruses expressing scrambled (Ad-scrambled) in BAT, followed by treatment with Dex or PBS.
Figure 3. Dex stimulates ATG7 expression and knockdown of ATG7 prevents Dex-induced BAT whitening in vivo and vitro. (A and B) mRNA levels of Atg4, Atg5, Atg6 and Atg7 (A) and ATG7 protein levels (B) were analyzed in BAT of male WT mice i.p. injected with Dex (+ Dex) or PBS (- Dex) for 1 week. (C and D) Atg7 mRNA (C) and protein (D) levels were analyzed in primary cultured brown adipocytes treated with 0, 1 or 5 μM Dex for 24 h. (E-G) ATG7 protein levels (E), H&E staining (F), mRNA levels of brown adipocyte markers and white adipocyte markers (G) were analyzed in BAT of male WT mice infected with Ad-shAtg7 (+ Ad-shAtg7) or Ad-Scrambled (- Ad-shAtg7) for 3 days, followed by i.p. injection of Dex (+ Dex) or PBS (- Dex) for 1 week. (H) mRNA levels of brown adipocyte markers and white adipocyte markers were analyzed in primary cultured brown adipocytes transfected with (+ siAtg7) or without (- siAtg7) Atg7 siRNA for 48 h, prior to being treated with Dex (+ Dex) or PBS (- Dex) for 24 h. Scale bars: 200 μm in F. Data are represented as mean ± SEM. Statistical significance was calculated using the two-tailed Student t-test for the effects of with compared to without Dex (*: p < 0.05) in A-D, or one-way ANOVA followed by the Student-Newman-Keuls (SNK) test for the effects of any group versus the control group (*: p < 0.05), with versus without Dex in ATG7 knockdown group (#: p < 0.05), with versus without ATG7 knockdown in Dex group (&: p < 0.05) in E, G and H.
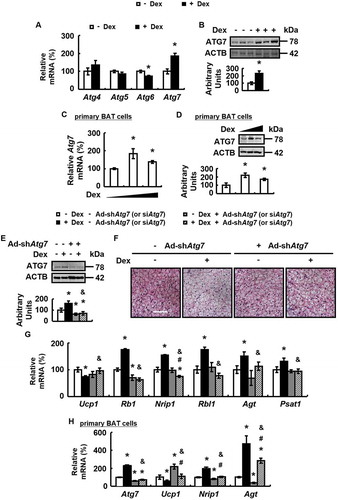
Ad-shAtg7 decreased ATG7 expression in BAT ( and Fig. S3A), but not sWAT and eWAT (Fig. S3B and C), of Dex-treated mice. As expected, Ad-shAtg7 blocked Dex-induced BAT whitening, as demonstrated by the corresponding changes in H&E staining and lipid content measurement, the expression of markers for BAT whitening, BAT and WAT differentiation, as well as parameters reflecting mitochondrial function ( and Fig. S3D-I). However, Ad-shAtg7 had no significant effect on BAT whitening in mice without Dex treatment (). As observed in vivo, ATG7 knockdown blocked Dex-induced BAT whitening in primary cultured brown adipocytes and ATG7 over-expression had the opposite effect ( and Fig. S3J).
BTG1 expression is up-regulated by dex and mediates dex-induced autophagy in BAT
It has previously been shown that BTG1 is upregulated by GC in several cell lines [Citation25,Citation26], suggesting that it might be involved in GC-mediated effects. Consistently, BTG1 expression was increased in BAT of mice or primary cultured brown adipocytes by Dex treatment (). Furthermore, BTG1 over-expression increased ATG7 expression, LC3-II protein abundance and autophagic flux in primary cultured brown adipocytes (). BTG1 knockdown had the opposite effect and prevented the effects of Dex on promoting ATG7 expression and autophagic flux in primary cultured brown adipocytes ().
Figure 4. Dex increases BTG1 expression and BTG1 regulates autophagy. (A) Btg1 mRNA (left) and protein levels (right) were analyzed in BAT of male WT mice i.p. injected with Dex (+ Dex) or PBS (- Dex) for 1 week. (B) Btg1 mRNA (left) and protein levels (right) were analyzed in primary cultured brown adipocytes treated with 0, 1 or 5 μM Dex for 24 h. (C) Btg1 and Atg7 mRNA (left) and protein levels (right) were analyzed in primary cultured brown adipocytes transfected with (+ BTG1) or without (- BTG1) plasmids overexpressing BTG1 for 48 h. (D) Btg1 and Atg7 mRNA (left) and protein levels (right) were analyzed in primary cultured brown adipocytes transfected with (+ siBtg1) or without (- siBtg1) Btg1 siRNA for 72 h. (E) Confocal micrographs of primary cultured brown adipocytes transfected with (+ BTG1) or without (- BTG1) plasmids overexpressing BTG1 for 24 h, prior to being treated with CQ (+ CQ) or PBS (- CQ) for 24 h. (F) Autophagic flux was measured in primary cultured brown adipocytes transfected with plasmids expressing GFP-LC3-RFP-LC3△G, concomitantly with (+ BTG1) or without (- BTG1) plasmids over-expressing BTG1 for 48 h. (G) Confocal micrographs of primary cultured brown adipocytes transfected with (+ siBtg1) or without (- siBtg1) Btg1 siRNA for 48 h, prior to being treated with CQ (+ CQ) or PBS (- CQ) for 24 h. (H and K) Autophagic flux was measured in primary cultured brown adipocytes transfected with (+ siBtg1) or without (- siBtg1) Btg1 siRNA for 24 h, prior to being transfected with plasmids expressing GFP-LC3-RFP-LC3△G for 48 h. (I and J) Btg1 and Atg7 mRNA (left) and protein levels (right) (I), confocal micrographs (J) of primary cultured brown adipocytes transfected with (+ siBtg1) or without (- siBtg1) Btg1 siRNA for 48 h, prior to being treated with Dex (+ Dex) or PBS (- Dex) for 24 h. (L) HEK 293T cells were co-transfected with (+ MYC-CREB1) or without (- MYC-CREB1) MYC-tagged CREB1 plasmids, with (+ FLAG-BTG1) or without (- FLAG-BTG1) FLAG-tagged BTG1 plasmids. Immunoprecipitation (IP) and immunoblotting (IB) were performed using the antibodies indicated. (M) Luciferase activity was assessed in HEK293T cells expressing the Atg7 promoter vectors, co-transfected with (+ CREB1) or without (- CREB1) plasmids overexpressing CREB1, with (+siBtg1) or without (-siBtg1) Btg1 siRNA for 72 h, or with (+BTG1) or without (-BTG1) plasmids overexpressing BTG1 for 48 h. Scale bars: 20 μm in E, G and J. Data are represented as mean ± SEM. Statistical significance was calculated using the two-tailed Student t-test for the effects of with compared to without Dex in A and B, or the effects of BTG1 overexpression or knockdown versus the control group in C, D, F and H (*: p < 0.05); or one-way ANOVA followed by the Student-Newman-Keuls (SNK) test for the effects of any group versus the control group (*: p < 0.05), with versus without Dex in Btg1 siRNA group (#: p < 0.05), with versus without Btg1 siRNA in Dex group (&: p < 0.05) in I and K, with versus without BTG1 overexpression or knockdown in CREB1 group (#: p < 0.05) in M.
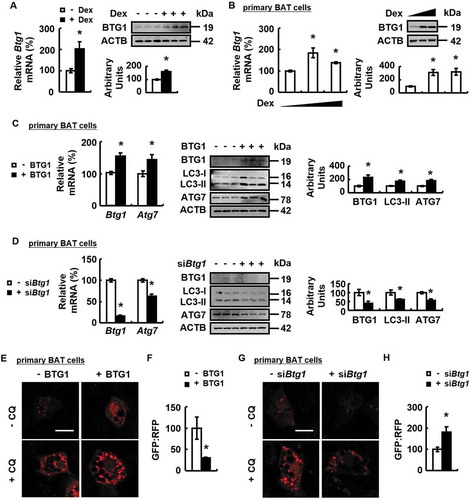
Figure 4. (Continued.)
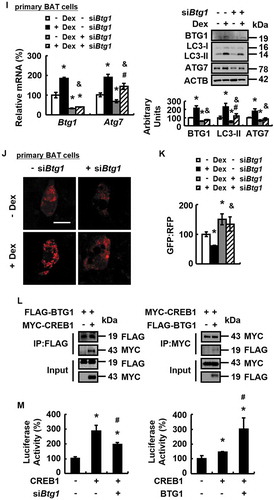
BTG1 functions as a cofactor [Citation21,Citation24] and the transcription factor CREB1 is shown to promote ATG7 expression [Citation35], suggesting that BTG1 may regulate ATG7 expression by affecting CREB1 activity. Consistent with this possibility, we found that BTG1 could interact directly with CREB1 when co-expressed in HEK293T cells (). In addition, CREB1-stimulated Atg7 promoter activity was prevented by BTG1 knockdown or enhanced by BTG1 overexpression, respectively, in HEK293T cells ().
BTG1 knockdown blocked dex-induced BAT whitening and its over-expression induces BAT whitening
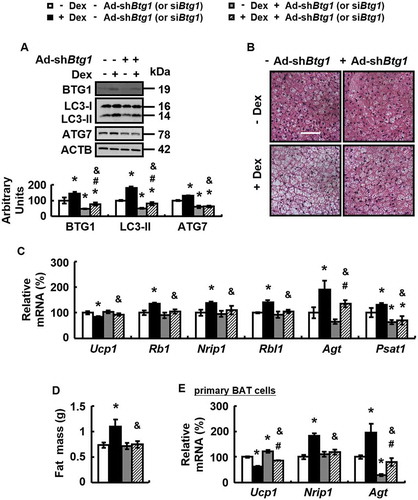
The above results suggest that BTG1 may play a role in Dex-induced BAT whitening. We assessed this possibility in WT mice with BAT injection of adenoviruses expressing short-hairpin against Btg1 (Ad-shBtg1) or Ad-scrambled in the presence or absence of Dex. Ad-shBtg1 significantly reduced BTG1 abundance in BAT ( and Fig. S4A), but not other tissues examined (Fig. S4B and C). As expected, BTG1 knockdown blocked Dex-induced BAT whitening, as demonstrated by the corresponding changes in H&E staining and lipid content measurement, the expression of markers for BAT whitening, BAT and WAT differentiation, as well as parameters reflecting mitochondrial function and the weight of fat mass ( and Fig. S4D-I). However, Ad-shBtg1 had no significant effect on BAT whitening in mice without Dex treatment (). Similar effects were observed in primary cultured brown adipocytes treated with Dex ().
Figure 5. BTG1 knockdown blocks Dex-induced BAT whitening in vivo and in vitro. (A-D) Protein levels of BTG1, ATG7 and LC3-II in BAT (A), BAT H&E staining (B), mRNA levels of brown adipocyte markers and white adipocyte markers in BAT (C), and body fat mass component (D) were analyzed in male WT mice infected with Ad-shBtg1 (+ Ad-shBtg1) or Ad-Scrambled (- Ad-shBtg1) for 3 days, followed by i.p. injection of Dex (+ Dex) or PBS (- Dex) for 1 week. (E) mRNA levels of brown adipocyte markers and white adipocyte markers were analyzed in primary cultured brown adipocytes transfected with (+ siBtg1) or without (- siBtg1) Btg1 siRNA for 48 h, prior to being treated with Dex (+ Dex) or PBS (- Dex) for 24 h. Scale bars: 200 μm in B. Data are represented as mean ± SEM. Statistical significance was calculated using one-way ANOVA followed by the Student-Newman-Keuls (SNK) test for the effects of any group versus the control group (*: p < 0.05), with versus without Dex in BTG1 knockdown group (#: p < 0.05), with versus without BTG1 knockdown in Dex group (&: p < 0.05) in A and C-E.
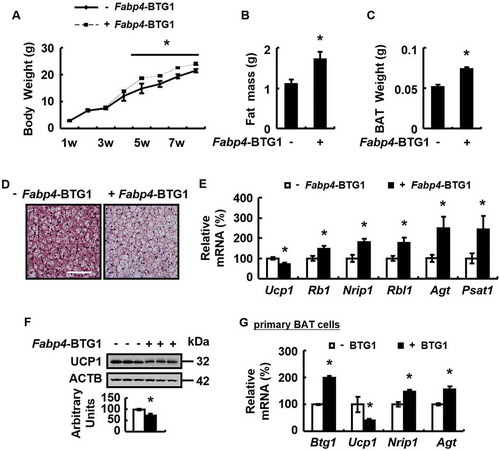
To test whether over-expression of BTG1 may mimic the effect of Dex, we generated transgenic mice with BTG1 overexpression in adipose tissue, but not other tissues examined, driven by the Fabp4/Ap2 (fatty acid binding protein 4, adipocyte) promoter (Fabp4-BTG1) (Fig. S5A and B), and found these mice had increased body weight and fat mass (). As expected, BAT whitening was observed in Fabp4-BTG1 mice, as demonstrated by the corresponding changes in H&E staining and lipid content measurement, the expression of markers for BAT whitening, BAT and WAT differentiation, as well as parameters reflecting mitochondrial function ( and Fig. S5C-H). Similar effects were observed in primary cultured brown adipocytes over-expressing BTG1 ().
Figure 6. Overexpression of BTG1 in adipose tissue mimics Dex-induced BAT whitening. (A-F) Body weight (A), body fat mass component (B), BAT weight (C), H&E staining of BAT (D), mRNA levels of brown adipocyte markers and white adipocyte markers in BAT (E), BAT UCP1 protein levels (F) were analyzed in the Fabp4-BTG1 mice (+ Fabp4-BTG1) or control mice (- Fabp4-BTG1). (G) mRNA levels of Btg1, brown adipocyte markers and white adipocyte markers were analyzed in primary cultured brown adipocytes transfected with (+ BTG1) or without (- BTG1) plasmids overexpressing BTG1 for 48 h. Scale bars: 200 μm in D. Data are represented as mean ± SEM. Statistical significance was calculated using the two-tailed Student t-test for the effects of Fabp4-BTG1 versus control mice in A-C, E and F, or the effect of with versus without BTG1 overexpression in G (*: p < 0.05).
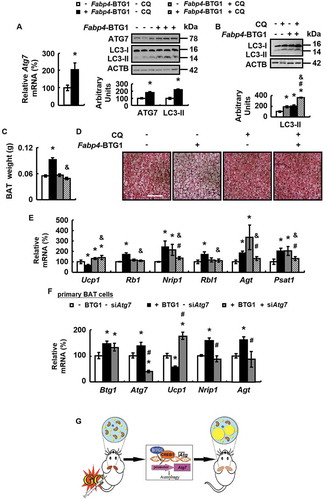
We further investigated the involvement of autophagy in BTG1-regulated BAT whitening. Consistent with this possibility, ATG7 and LC3-II expression was decreased by Ad-shBtg1 (), but increased in BAT of Fabp4-BTG1 mice (). Furthermore, treatment with CQ for 14 days inhibited BAT autophagic flux, reduced BAT weight and inhibited BAT whitening, as demonstrated by the corresponding changes in H&E staining and lipid content measurement, the expression of markers for BAT whitening, BAT and WAT differentiation, as well as parameters reflecting mitochondrial function in Fabp4-BTG1 mice ( and Fig. S6). Similarly, the effects of BTG1 over-expression on BAT and WAT markers were also blocked by ATG7 knockdown in primary cultured brown adipocytes ().
Figure 7. BTG1 regulates BAT whitening via an ATG7-dependent autophagy pathway in vivo and in vitro. (A) Atg7 mRNA (left), ATG7 and LC3-II protein levels (right) were analyzed in BAT of Fabp4-BTG1 mice (+ Fabp4-BTG1) or control mice (- Fabp4-BTG1). (B-E) LC3-II protein levels (B), weight (C), H&E staining (D), mRNA levels of brown adipocyte markers and white adipocyte markers (E) were analyzed in BAT of Fabp4-BTG1 mice (+ Fabp4-BTG1) or control mice (- Fabp4-BTG1) i.p. injected with CQ (+ CQ) or PBS (- CQ) for 2 weeks. (F) mRNA levels of Btg1, Atg7, brown adipocyte markers and white adipocyte markers were analyzed in primary cultured brown adipocytes transfected with (+ BTG1) or without (- BTG1) plasmids over-expressing BTG1 for 48 h, after with (+ siAtg7) or without (- siAtg7) Atg7 siRNA for 24 h. (G) Working model. Scale bars: 200 μm in D. Data are represented as mean ± SEM. Statistical significance was calculated using the two-tailed Student t-test for the effects of Fabp4-BTG1 versus control mice in A (*: p < 0.05), or one-way ANOVA followed by the Student-Newman-Keuls (SNK) test for the effects of any group versus the control group (*: p < 0.05), with versus without Fabp4-BTG1 in CQ group (#: p < 0.05), with versus without CQ in Fabp4-BTG1 group (&: p < 0.05) in B, C and E, with versus without Atg7 siRNA in BTG1 group (#: p < 0.05) in F.
BTG1 regulates adipogenesis and knockdown of BTG1 prevents dex-increased WAT lipid accumulation
CQ treatment not only blocked GC-induced BAT whitening, we also found that Dex-increased WAT weight was reduced by CQ (Fig. S7A), suggesting the possibility for autophagy in mediating Dex-regulated other metabolic effects, such as adipogenesis.
Consistent with this hypothesis, over-expression of BTG1 promotes adipogenesis in 3T3-L1 cells and knockdown of BTG1 had the opposite effect (Fig. S7B and C). As observed in cells over-expressing BTG1, similar changes were observed in sWAT and eWAT of Fabp4-BTG1 mice (Fig. S7D and E). Furthermore, we observed that autophagy was increased in sWAT and eWAT of Fabp4-BTG1 mice, as demonstrated by the changed protein abundance of LC3-II and ATG7 (Fig. S8A). The involvement of autophagy and ATG7 in BTG1-regulated adipogenesis was confirmed by the reversal effects of CQ treatment or ATG7 knockdown as demonstrated by the corresponding changes in LC3-II protein abundance, Oil Red O staining and measurement of cellular triglycerides in 3T3-L1 cells (Fig. S8B and C). Similarly, CQ treatment or ATG7 knockdown reduced the cell size of WAT in Fabp4-BTG1 mice (Fig. S8D-G). We further explored a role for BTG1 in Dex-increased WAT cell size and found that BTG1 expression was increased in WAT of Dex-treated mice (Fig. S9A and B). Then Ad-shBtg1 or Ad-scrambled was injected to sWAT of WT mice, in the presence or absence of Dex treatment. Correlating well with the results above, Ad-shBtg1 significantly reduced BTG1 levels and attenuated Dex-increased adipocyte size of sWAT (Fig. S9C and D).
Discussion
BAT is reported to be one of the target tissues for GC treatment [Citation5,Citation6]. Though BAT whitening has been reported previously [Citation9–Citation11], we provided the first evidence showing that Dex significantly induced BAT whitening, as demonstrated by the accumulation of enlarged lipid droplets in BAT cells and the concomitant changes in the expression of BAT and WAT markers and other parameters examined. The whitening of BAT may result from a decrease in the number and function of mitochondria [Citation9] or a phenotypic switch from brown to white adipocyte [Citation10,Citation11]. For example, study shows that deletion of VEGF inhibits mitochondria function of BAT, resulting in the lipid accumulation in BAT [Citation9], whereas BAT-selective ablation of TSC1 (tuberous sclerosis 1) or KDM1A/Lsd1 (lysine [K]-specific demethylase 1A) induces a brown-to-white adipocyte switch [Citation10,Citation11]. Consistent with the first possibility, we found that oxygen consumption was decreased in primary cultured brown adipocytes following Dex treatment. The possible contribution of the decreased oxygen consumption or switch of BAT to WAT to Dex-induced BAT whitening requires to be studied in the future. Regardless of the above issues, our results provide novel insights for the mechanisms underlying Dex-increased adiposity and suggest that blocking BAT whitening could be a potential strategy to prevent Dex-increased adiposity.
Autophagy is a catabolic process to form the autophagosome in which the cell packages organelles and proteins and delivers the cargo to the lysosomes for degradation and recycling [Citation12]. Autophagy is shown to affect adipose tissue function [Citation15,Citation18], for example, autophagy (mitophagy) regulates the switch of brite or beige cells to white fat cells [Citation36,Citation37]. Despite of these results, little is known regarding the role of BAT autophagy in GC-induced fat mass gain. Here we demonstrated that Dex induces BAT autophagy in vitro and in vivo. The importance of autophagy in Dex-induced BAT whitening was demonstrated by the reversal effects of CQ treatment and knockdown of BAT ATG7. Consistent with our results, repressed autophagy is shown to be associated with cold-induced UCP1 expression in BAT of mice [Citation16]. More importantly, in this study we demonstrated a possible novel strategy to prevent GC-increased adiposity by combined use of autophagy inhibitor CQ, a drug currently used in many clinical trials to prevent and treat malaria [Citation38]. Clinical use of CQ in patients treated with GC, however, is still premature and the optimal concentration and duration of therapeutic use of CQ need to be studied in the future.
We then explored the possible signals mediating GC promotion of ATG7 expression and autophagy. BTG1 is a member of the BTG antiproliferative protein family that is important in the regulation of many different processes, including cell growth, differentiation and survival [Citation24]. Though it has previously been shown that BTG1 is upregulated by GC in leukemic cells [Citation25] and erythroid progenitors [Citation26], a role of BTG1 in GC-mediated effects has not been investigated. In this study, we identified that BTG1 is an important downstream signal mediating the effects of GC in increasing fat mass.
BTG1 normally regulates gene expression by acting as a cofactor for various transcription factors [Citation39–Citation42]. CREB1 is a transcription factor that binds to cAMP response elements site on the promoter of its target gene [Citation43] and can directly stimulate ATG7 expression in Hepa1c1c7 cells [Citation35]. We found that BTG1 may regulate ATG7 expression via affecting CREB1 transcriptional activity, however, the possible role of CREB1 in mediating BTG1 regulation of ATG7 expression requires to be demonstrated. A role of BTG1 in Dex-induced BAT whitening was then confirmed by the observation: BTG1 knockdown in BAT blocked Dex-induced BAT whitening and targeted BTG1 overexpression in adipose tissue of mice resulted in BAT whitening. As expected, the effects of BTG1 on BAT whitening was mediated by stimulation of autophagy based on the reversal effects of CQ treatment in Fabp4-BTG1 mice and ATG7 knockdown in primary cultured brown adipocytes over-expressing BTG1. These results suggest that BTG1 is critical in mediating Dex-induced BAT whitening via affecting autophagy, which provides important information for understanding molecular mechanisms underlying Dex-regulated metabolic effects. Furthermore, taken consideration of our in vitro results, we believe that BTG1 is likely to have a direct regulatory effect on BAT whitening. However, we cannot exclude the possible contribution from BTG1 expressed in other cells, due to the widely expression of Fabp4 gene promoter [Citation44], to Dex-induced whitening, and the relative contribution of these factors will be studied in the future. In addition to BTG1, it will be interesting to investigate whether other pathways, such as MITF (melanogenesis associated transcription factor) and PRKN (parkin RBR E3 ubiquitin protein ligase) that have been shown to play an important role in beige cells whitening [Citation36,Citation37], involved in this regulation in the future. Another question remains to be answered is the transcriptional control of UCP1 expression. We speculated that PPARGC1A [Citation45], is likely to be involved in Dex-regulated BAT UCP1 expression, as its protein levels were reduced in BAT of Dex-treated mice, and the effect of which were blocked by BTG1 or ATG7 knockdown (Fig. S10). This possibility requires to be studied in the future.
Most progress in the search of BTG1 function comes from various cell types analysis [Citation24] and a role of BTG1 in adipogenesis has not previously been reported. Our results demonstrate that BTG1 regulates adipogenesis and also plays an important role in Dex-increased adiposity in WAT, which help understanding molecular mechanisms underlying GC-induced fat mass gain. In addition, we would also like to note that our results demonstrate two novel functions for BTG1: one is for its critical role in the regulation of fat mass via affecting BAT whitening and adipogenesis, another is for the regulation of autophagy via affecting ATG7 expression. These observations not only expand our understanding of BTG function, but also important for studying the mechanisms underlying obesity and autophagy.
In summary, our study demonstrates that GC triggers a profound whitening of BAT via BTG1-dependent autophagy, and inhibition of autophagy or BTG1 in BAT alleviates GC-increased fat mass (see our working model in ). Together, this study demonstrates a novel mechanistic link between GC and BAT, which represents proof of principle that anti-obesity effects can be obtained with therapies involving autophagy inhibitors and strategies to suppress BAT whitening phenotype.
Materials and methods
Cell culture and treatments
The precursor cells of brown adipocytes were isolated from scapular fat of newborn WT mice and differentiation was induced as previously reported [Citation10]. For Dex (Sigma, D4902) treatment, 3T3-L1 and differentiated brown adipocytes were treated with Dex at a concentration as indicated or 1 μM for 24 h [Citation28]. For autophagy inhibition, cells were treated with 30 μM CQ (Sigma, C6628) for 24 h [Citation46].
Plasmids and RNA interference
The DNA fragments encoding BTG1 and CREB1 were amplified from mouse liver or human cell line genomic cDNA and inserted into the expressing vector pcDNA3.1/myc-His A or p3XFLAG-CMV-10. Plasmids encoding GFP-LC3-RFP-LC3△G was from Addgene (84572; deposited by Noboru Mizushima). The double-stranded siRNA targeting mouse Btg1 and Atg7 was from GenePharma (Shanghai, China). The sequence is 5ʹ-GCTGTAAGGAGGAACTTC-3ʹ for Btg1 and 5ʹ-GTCAGCCTGGCATTTGAT-3ʹ for Atg7. Cells were transfected with plasmids using Effectene Transfection Reagent (Qiagen, 301427) or Lipofectamine 2000 (Invitrogen, 11668019), or siRNA using X-tremeGENE siRNA Transfection Reagent (Roche Diagnostics, 4476115001).
Generation of recombinant adenoviruses
Recombinant adenoviruses expressing MYC-tagged mouse BTG1 (Ad-BTG1), LC3 (Ad-LC3) and ATG7 (Ad-ATG7) were generated using the AdMaxTM Adenoviral Vector Creation System (Hanbio Co. Ltd, pHBAd-MCMV) according to the manufacturer’s instruction. Adenoviruses expressing scrambled (Ad-scrambled) or short-hairpin (sh) RNA against mouse Btg1 (Ad-shBtg1) and Atg7 (Ad-shAtg7) were generated using the BLOCK-iTTM Adenoviral RNAi Expression System (Invitrogen, K494100) according to the manufacturer’s instructions. The shRNA sequence for Btg1 is 5ʹ-GGATCAGGTTACCGTTGTATT-3ʹ, for Atg7 is 5ʹ-ATGAGATCTGGGAAGCCAT-3ʹ, which targets mouse Btg1 or Atg7, respectively. High-titer stocks of amplified recombinant adenoviruses were purified as previously described [Citation33].
Animals and treatments
Male C57BL/6J wild-type (WT) and adipocyte-specific-overexpressing BTG1 transgenic (Fabp4-BTG1) mice (8- to 10-weeks old) were obtained from Model Animal Research Center of Nanjing University (Nanjing, China) or generated in Shanghai Model Organisms Center, Inc (Shanghai, China), respectively. For dexamethasone (Dex) treatment, mice were intraperitoneally (i.p.) injected with 5 mg/kg Dex (Sigma, D4902) or phosphate-buffered saline (PBS; 3.63 g/l Na2HPO4•12H2O, 0.24 g/l KH2PO4, 8 g/l NaCl, 0.2 g/l KCl, pH 7.4) every other day for 1 week [Citation28], or 3 days after adenoviruses injection as indicated. For autophagy inhibitor treatment, chloroquine (CQ; Sigma, C6628) was dissolved in PBS and daily i.p. injected at the dose of 60 mg/kg for 14 days [Citation33]. All the mice were maintained on a 12 h light/dark cycle at 25°C and provided free access to commercial rodent chow (SLACOM, P1103F) and tap water. All animals were sacrificed by CO2 inhalation. Tissues were isolated and snap-frozen for future analysis or put into 4% paraformaldehyde buffer immediately for histological study. These experiments were conducted in accordance with guidelines of the Institutional Animal Care and Use Committee of the Shanghai Institute of Nutrition and Health, Shanghai Institutes for Biological Sciences, Chinese Academy of Sciences.
Tissues morphological analysis
WAT and BAT were stained with hematoxylin and eosin (HE) for histology. Frozen sections of BAT were stained with BODIPYTM493/503 as previously described [Citation27] and fluorescence images were obtained using a Zeiss LSM 510 confocal microscope (Carl Zeiss, Oberkochen, Germany).
Metabolic parameters measurements
The body fat composition of mice was determined by a mini-spec nuclear magnetic resonance spectrometer (Bruker, Rheinstetten, GER). Infrared images were measured by infrared camera (Magnity Electronics Co., Ltd, Shanghai, China).
RNA isolation and relative quantitative RT-PCR
RNA isolation and relative quantification RT-PCR were performed as described previously [Citation27]. Relative mitochondrial content was determined as previously described [Citation10]. The sequences of primers used for RT-PCR are listed in Table S1.
Adenoviruses injection to interscapular brown adipose tissue (BAT) or inguinal white adipose tissue (WAT)
Interscapular BAT administrations was performed as previously described [Citation47] with modification. Each interscapular BAT received one injection of 3 × 10⁸ pfu/mice adenoviruses using a syringe. For inguinal WAT administrations, adenoviruses diluted in PBS were twice weekly injected subcutaneously adjacent to inguinal fat pad in mice from 4-weeks old for 4 weeks using 109 pfu/mice, as previously described [Citation48].
Autophagy measurements
For the procedure of LC3 confocal image, male C57BL/6J WT mice were infected with Ad-LC3 in BAT prior to Dex or PBS treatment, followed by CQ or PBS treatment; primary cultured brown adipocytes were infected with Ad-LC3 prior to treatment with Dex or PBS. Fluorescence images were obtained using a Zeiss LSM 510 confocal microscope (Carl Zeiss, Oberkochen, Germany). For measurement of autophagic flux, cells were transfected with plasmid encoding GFP-LC3-RFP-LC3△G (Addgene, 84572; deposited by Noboru Mizushima). Measurement of GFP and RFP fluorescence was performed using a microplate reader (BioTek Instruments, VT, USA) as previously described [Citation49].
Luciferase assay
Atg7 promoter (chr6:114772715–114773373) was generated in pGL3-Basic vector [Citation35]. HEK293T cells were co-transfected with internal control vector pRL-Renilla and plasmids indicated using Lipofectamine 2000. The firefly and Renilla luciferase activities were assayed using Dual-Glo Luciferase assay system (Promega, E1910).
Seahorse measurements
Real-time measurements of oxygen consumption rate (OCR) were performed using the Seahorse XF24 Analyzer (Agilent Technologies, CA, USA) according to the manufacturer instructions. Cells were treated with 4 μM oligomycin (Selleck, S1478), 2 μM carbonyl cyanide 4-(trifluoromethoxy) phenylhydrazone (FCCP, Sigma, C2920), 1 μM antimycin A (BioVision, 2247–10) and 1 μM rotenone (Sigma, R8875) as described previously [Citation50]. Tissues (~3 mg) were treated with 30 μM oligomycin, 10 μM FCCP, 15 μM antimycin A and 5 μM rotenone [Citation51].
Immunoblotting and co-immunoprecipitation
Immunoblotting and co-immunoprecipitation assays were performed as previously described [Citation27] with the following primary antibodies: anti-FLAG (Cell Signaling Technology, 2368), anti-MYC (Cell Signaling Technology, 2272), anti-LC3B (Cell Signaling Technology, 2775), anti-ATG7 (Cell Signaling Technology, 8558), anti-BTG1 (Santa Cruz Biotechnology, sc-18540; Abcam, ab151740), anti-UCP1 (Santa Cruz Biotechnology, sc-6529; Abcam, ab10983), anti-ACTB (Sigma, A5316), anti-SQSTM1 (Abcam, ab56416), anti-MT-CO1 for complex Ⅳ (Abcam, ab14705), anti-ATP5A1 for complex V (Abcam, ab14748), anti-NDUFA9 for complex I (Invitrogen, 459100), anti-SDHA/Fp subunit for complex Ⅱ (Invitrogen, 459200), anti-UQCRC1/subunit core 1 for complex Ⅲ (Invitrogen, 459140) and anti-PPARGC1A (Calbiochem, ST1202-1SET).
Statistics
All data are expressed as mean ± SEM. Significant differences were assessed either by two-tailed student t-test or one-way ANOVA followed by the Student-Newman-Keuls test for most of the results. P < 0.05 was considered statistically significant.
Supplemental Material
Download MS Word (8.7 MB)Acknowledgments
The authors wish to thank Dawei Wang for drawing the working model.
Disclosure statement
No potential conflict of interest was reported by the authors.
Supplemental material
Supplemental data for this article can be accessed here.
Additional information
Funding
Related Research Data
References
- Rhen T, Cidlowski JA. Antiinflammatory action of glucocorticoids–new mechanisms for old drugs [Review]. New Engl J Med. 2005 Oct 20;353(16):1711–1723. PubMed PMID: 16236742; eng.
- Straub RH, Cutolo M. Glucocorticoids and chronic inflammation [Review]. Rheumatology. 2016 Dec;55(suppl 2):ii6–ii14. PubMed PMID: 27856655; eng.
- Tomlinson JJ, Boudreau A, Wu D, et al. Modulation of early human preadipocyte differentiation by glucocorticoids [Research support, Non-U.S. Gov’t]. Endocrinology. 2006 Nov;147(11):5284–5293. PubMed PMID: 16873539; eng.
- Cha JY, Kim HJ, Yu JH, et al. Dexras1 mediates glucocorticoid-associated adipogenesis and diet-induced obesity [Research support, N.I.H., Extramural research support, Non-U.S. Gov’t]. Proc Natl Acad Sci U S A. 2013 Dec 17;110(51):20575–20580. PubMed PMID: 24297897; PubMed Central PMCID: PMC3870686. eng.
- Moriscot A, Rabelo R, Bianco AC. Corticosterone inhibits uncoupling protein gene expression in brown adipose tissue [Research support, Non-U.S. Gov’t]. A J Physiol. 1993 Jul;265(1 Pt 1):E81–E87. PubMed PMID: 8338156; eng.
- Strack AM, Bradbury MJ, Dallman MF. Corticosterone decreases nonshivering thermogenesis and increases lipid storage in brown adipose tissue [Research support, Non-U.S. Gov’t research support, U.S. Gov’t, P.H.S.]. A J Physiol. 1995 Jan;268(1 Pt 2):R183–R191. PubMed PMID: 7840319; eng.
- Harms M, Seale P. Brown and beige fat: development, function and therapeutic potential [Research support, N.I.H., Extramural research support, Non-U.S. Gov’t review]. Nat Med. 2013 Oct;19(10):1252–1263. PubMed PMID: 24100998; eng.
- Ramage LE, Akyol M, Fletcher AM, et al. Glucocorticoids acutely increase brown adipose tissue activity in humans, revealing species-specific differences in UCP-1 regulation. Cell Metab. 2016 Jul 12;24(1):130–141. PubMed PMID: 27411014; PubMed Central PMCID: PMC4949380. eng.
- Shimizu I, Aprahamian T, Kikuchi R, et al. Vascular rarefaction mediates whitening of brown fat in obesity [Research support, N.I.H., Extramural research support, Non-U.S. Gov’t]. J Clin Invest. 2014 May;124(5):2099–2112. PubMed PMID: 24713652; PubMed Central PMCID: PMC4001539. eng.
- Xiang X, Lan H, Tang H, et al. Tuberous sclerosis complex 1-mechanistic target of rapamycin complex 1 signaling determines brown-to-white adipocyte phenotypic switch [Research support, Non-U.S. Gov’t]. Diabetes. 2015 Feb;64(2):519–528. PubMed PMID: 25213336; eng.
- Duteil D, Tosic M, Lausecker F, et al. Lsd1 ablation triggers metabolic reprogramming of brown adipose tissue. Cell Rep. 2016 Oct 18;17(4):1008–1021. PubMed PMID: 27760309; PubMed Central PMCID: PMC5081406. eng.
- Kaur J, Debnath J. Autophagy at the crossroads of catabolism and anabolism [Research support, N.I.H., Extramural research support, Non-U.S. Gov’t research support, U.S. Gov’t, Non-P.H.S. review]. Nat Rev Mol Cell Biol. 2015 Aug;16(8):461–472. PubMed PMID: 26177004; eng.
- Dong H, Czaja MJ. Regulation of lipid droplets by autophagy [Research support, N.I.H., Extramural review]. Trends Endocrinol Metab. 2011 Jun;22(6):234–240. PubMed PMID: 21419642; PubMed Central PMCID: PMC3118855. eng.
- Baerga R, Zhang Y, Chen PH, et al. Targeted deletion of autophagy-related 5 (atg5) impairs adipogenesis in a cellular model and in mice [Research support, N.I.H., Extramural]. Autophagy. 2009 Nov;5(8):1118–1130. PubMed PMID: 19844159; PubMed Central PMCID: PMC2873687. eng.
- Zhang Y, Goldman S, Baerga R, et al. Adipose-specific deletion of autophagy-related gene 7 (atg7) in mice reveals a role in adipogenesis [Research support, N.I.H., Extramural]. Proc Natl Acad Sci U S A. 2009 Nov 24;106(47):19860–19865. PubMed PMID: 19910529; PubMed Central PMCID: PMC2785257. eng.
- Cairo M, Villarroya J, Cereijo R, et al. Thermogenic activation represses autophagy in brown adipose tissue. Int J Obesity. 2016 Oct;40(10):1591–1599. PubMed PMID: 27339605; eng.
- Martinez-Lopez N, Athonvarangkul D, Sahu S, et al. Autophagy in Myf5+ progenitors regulates energy and glucose homeostasis through control of brown fat and skeletal muscle development [Research support, N.I.H., Extramural research support, Non-U.S. Gov’t]. EMBO Rep. 2013 Sep;14(9):795–803. PubMed PMID: 23907538; PubMed Central PMCID: PMC3790054. eng.
- Singh R, Xiang Y, Wang Y, et al. Autophagy regulates adipose mass and differentiation in mice [Research Support, N.I.H., Extramural]. J Clin Invest. 2009 Nov;119(11):3329–3339. PubMed PMID: 19855132; PubMed Central PMCID: PMC2769174. eng.
- Xia X, Kar R, Gluhak-Heinrich J, et al. Glucocorticoid-induced autophagy in osteocytes [Research support, N.I.H., Extramural research support, Non-U.S. Gov’t]. J Bone Miner Res. 2010 Nov;25(11):2479–2488. PubMed PMID: 20564240; PubMed Central PMCID: PMC3179284. eng.
- Troncoso R, Paredes F, Parra V, et al. Dexamethasone-induced autophagy mediates muscle atrophy through mitochondrial clearance [Research support, Non-U.S. Gov’t]. Cell Cycle. 2014;13(14):2281–2295. PubMed PMID: 24897381; PubMed Central PMCID: PMC4111682. eng.
- Winkler GS. The mammalian anti-proliferative BTG/Tob protein family [Research support, Non-U.S. Gov’t review]. J Cell Physiol. 2010 Jan;222(1):66–72. PubMed PMID: 19746446; eng.
- Rouault JP, Rimokh R, Tessa C, et al. BTG1, a member of a new family of antiproliferative genes [Comparative study research support, Non-U.S. Gov’t]. Embo J. 1992 Apr;11(4):1663–1670. PubMed PMID: 1373383; PubMed Central PMCID: PMC556617. eng.
- Duriez C, Moyret-Lalle C, Falette N, et al. BTG2, its family and its tutor [Review]. Bull Cancer. 2004;91(7–8):E242–E253. Jul–Aug; (): . PubMed PMID: 15381462; eng.
- Matsuda S, Rouault J, Magaud J, et al. In search of a function for the TIS21/PC3/BTG1/TOB family [Research support, Non-U.S. Gov’t review]. FEBS Lett. 2001 May 25;497(2–3):67–72. PubMed PMID: 11377414; eng.
- Yoshida NL, Miyashita T, U M, et al. Analysis of gene expression patterns during glucocorticoid-induced apoptosis using oligonucleotide arrays [Research Support, Non-U.S. Gov’t]. Biochem Biophys Res Commun. 2002 May 17;293(4):1254–1261. PubMed PMID: 12054511; eng.
- Kolbus A, Blazquez-Domingo M, Carotta S, et al. Cooperative signaling between cytokine receptors and the glucocorticoid receptor in the expansion of erythroid progenitors: molecular analysis by expression profiling [Comparative Study Research Support, Non-U.S. Gov’t]. Blood. 2003 Nov 01;102(9):3136–3146. 10.1182/blood-2003-03-0923. PubMed PMID: 12869505; eng.
- Xiao F, Deng J, Guo Y, et al. BTG1 ameliorates liver steatosis by decreasing stearoyl-CoA desaturase 1 (SCD1) abundance and altering hepatic lipid metabolism. Sci Signal. 2016 May 17;9(428):ra50. PubMed PMID: 27188441; eng.
- Ma X, Xu L, Mueller E. Forkhead box A3 mediates glucocorticoid receptor function in adipose tissue [Research support, N.I.H., Intramural]. Proc Natl Acad Sci U S A. 2016 Mar 22;113(12):3377–3382. PubMed PMID: 26957608; PubMed Central PMCID: PMC4812768. eng.
- Sun L, Xie H, Mori MA, et al. Mir193b-365 is essential for brown fat differentiation [Research support, N.I.H., Extramural research support, Non-U.S. Gov’t]. Nat Cell Biol. 2011 Jul 10;13(8):958–965. PubMed PMID: 21743466; PubMed Central PMCID: PMC3149720. eng.
- Brenner S, Bercovich Z, Feiler Y, et al. Dual regulatory role of polyamines in adipogenesis [Research support, Non-U.S. Gov’t]. J Biol Chem. 2015 Nov 6;290(45):27384–27392. PubMed PMID: 26396188; PubMed Central PMCID: PMC4646398. eng.
- Lee J, Ellis JM, Wolfgang MJ. Adipose fatty acid oxidation is required for thermogenesis and potentiates oxidative stress-induced inflammation [Research support, N.I.H., Extramural]. Cell Rep. 2015 Jan 13;10(2):266–279. PubMed PMID: 25578732; PubMed Central PMCID: PMC4359063. eng.
- Yang L, Li P, Fu S, et al. Defective hepatic autophagy in obesity promotes ER stress and causes insulin resistance [Research support, N.I.H., Extramural research support, Non-U.S. Gov’t]. Cell Metab. 2010 Jun 09;11(6):467–478. PubMed PMID: 20519119; PubMed Central PMCID: PMC2881480. eng.
- Xiao Y, Liu H, Yu J, et al. Activation of ERK1/2 ameliorates liver steatosis in leptin receptor-deficient (db/db) Mice via stimulating ATG7-dependent autophagy [Research support, Non-U.S. Gov’t]. Diabetes. 2016 Feb;65(2):393–405. PubMed PMID: 26581593; eng.
- Mizushima N, Yoshimori T, Ohsumi Y. The role of Atg proteins in autophagosome formation [Research support, Non-U.S. Gov’t review]. Annu Rev Cell Dev Biol. 2011;27:107–132. PubMed PMID: 21801009; eng.
- Seok S, Fu T, Choi SE, et al. Transcriptional regulation of autophagy by an FXR-CREB axis [Research support, N.I.H., Extramural research support, Non-U.S. Gov’t]. Nature. 2014 Dec 04;516(7529):108–111. PubMed PMID: 25383523; PubMed Central PMCID: PMC4257899. eng.
- Altshuler-Keylin S, Shinoda K, Hasegawa Y, et al. Beige adipocyte maintenance is regulated by autophagy-induced mitochondrial clearance [Research support, N.I.H., Extramural research support, Non-U.S. Gov’t]. Cell Metab. 2016 Sep 13;24(3):402–419. PubMed PMID: 27568548; PubMed Central PMCID: PMC5023491. eng.
- Lu X, Altshuler-Keylin S, Wang Q, et al. Mitophagy controls beige adipocyte maintenance through a Parkin-dependent and UCP1-independent mechanism. Sci Signal. 2018 Apr 24;11(527). PubMed PMID: 29692364; eng.
- Martin RE, Marchetti RV, Cowan AI, et al. Chloroquine transport via the malaria parasite’s chloroquine resistance transporter [Research support, Non-U.S. Gov’t]. Science. 2009 Sep 25;325(5948):1680–1682. PubMed PMID: 19779197; eng.
- Busson M, Carazo A, Seyer P, et al. Coactivation of nuclear receptors and myogenic factors induces the major BTG1 influence on muscle differentiation [Research support, Non-U.S. Gov’t]. Oncogene. 2005 Mar 03;24(10):1698–1710. PubMed PMID: 15674337; eng.
- Cho IJ, Lee AK, Lee SJ, et al. Repression by oxidative stress of iNOS and cytokine gene induction in macrophages results from AP-1 and NF-kappaB inhibition mediated by B cell translocation gene-1 activation [Research support, Non-U.S. Gov’t]. Free Radic Biol Med. 2005 Dec 01;39(11):1523–1536. PubMed PMID: 16274887; eng.
- Lin WJ, Gary JD, Yang MC, et al. The mammalian immediate-early TIS21 protein and the leukemia-associated BTG1 protein interact with a protein-arginine N-methyltransferase [Comparative study research support, U.S. Gov’t, P.H.S.]. J Biol Chem. 1996 Jun 21;271(25):15034–15044. PubMed PMID: 8663146; eng.
- Prevot D, Voeltzel T, Birot AM, et al. The leukemia-associated protein Btg1 and the p53-regulated protein Btg2 interact with the homeoprotein Hoxb9 and enhance its transcriptional activation [Research Support, Non-U.S. Gov’t]. J Biol Chem. 2000 Jan 07;275(1):147–153. PubMed PMID: 10617598; eng.
- Bourtchuladze R, Frenguelli B, Blendy J, et al. Deficient long-term memory in mice with a targeted mutation of the cAMP-responsive element-binding protein [Research support, Non-U.S. Gov’t]. Cell. 1994 Oct 07;79(1):59–68. PubMed PMID: 7923378; eng.
- Jeffery E, Berry R, Church CD, et al. Characterization of Cre recombinase models for the study of adipose tissue. Adipocyte. 2014 Jul 1;3(3):206–211. PubMed PMID: 25068087; PubMed Central PMCID: PMC4110097. eng.
- Collins S, Yehuda-Shnaidman E, Wang H. Positive and negative control of Ucp1 gene transcription and the role of beta-adrenergic signaling networks [Review]. Int J Obesity. 2010 Oct;34(Suppl 1):S28–33. PubMed PMID: 20935662; eng.
- Zhang C, He Y, Okutsu M, et al. Autophagy is involved in adipogenic differentiation by repressesing proteasome-dependent PPARgamma2 degradation [Research support, Non-U.S. Gov’t]. Am J Physiol Endocrinol Metab. 2013 Aug 15;305(4):E530–9. PubMed PMID: 23800883; PubMed Central PMCID: PMC5504416. eng.
- Jimenez V, Munoz S, Casana E, et al. In vivo adeno-associated viral vector-mediated genetic engineering of white and brown adipose tissue in adult mice [Research support, Non-U.S. Gov’t]. Diabetes. 2013 Dec;62(12):4012–4022. PubMed PMID: 24043756; PubMed Central PMCID: PMC3837045. eng.
- Guo L, Huang JX, Liu Y, et al. Transactivation of Atg4b by C/EBPbeta promotes autophagy to facilitate adipogenesis [Research support, Non-U.S. Gov’t]. Mol Cell Biol. 2013 Aug;33(16):3180–3190. PubMed PMID: 23754749; PubMed Central PMCID: PMC3753907. eng.
- Kaizuka T, Morishita H, Hama Y, et al. An autophagic flux probe that releases an internal control [Research support, Non-U.S. Gov’t]. Mol Cell. 2016 Nov 17;64(4):835–849. PubMed PMID: 27818143; eng.
- Mills EL, Pierce KA, Jedrychowski MP, et al. Accumulation of succinate controls activation of adipose tissue thermogenesis. Nature. 2018 Aug;560(7716):102–106. 10.1038/s41586-018-0353-2. PubMed PMID: 30022159; eng.
- Shao M, Ishibashi J, Kusminski CM, et al. Zfp423 maintains white adipocyte identity through suppression of the beige cell thermogenic gene program. Cell Metab. 2016 Jun 14;23(6):1167–1184. PubMed PMID: 27238639; PubMed Central PMCID: PMC5091077. eng.