
 ?Mathematical formulae have been encoded as MathML and are displayed in this HTML version using MathJax in order to improve their display. Uncheck the box to turn MathJax off. This feature requires Javascript. Click on a formula to zoom.
ABSTRACT
Seeing is believing. The direct observation of GFP-Atg8 vacuolar delivery under confocal microscopy is one of the most useful end-point measurements for monitoring yeast macroautophagy/autophagy. However, manually labelling individual cells from large-scale sets of images is time-consuming and labor-intensive, which has greatly hampered its extensive use in functional screens. Herein, we conducted a time-course analysis of nitrogen starvation-induced autophagy in wild-type and knockout mutants of 35 AuTophaGy-related (ATG) genes in Saccharomyces cerevisiae and obtained 1,944 confocal images containing > 200,000 cells. We manually labelled 8,078 autophagic and 18,493 non-autophagic cells as a benchmark dataset and developed a new deep learning tool for autophagy (DeepPhagy), which exhibited superior accuracy in recognizing autophagic cells compared to other existing methods, with an area under the curve (AUC) value of 0.9710 from 10-fold cross-validations. We further used DeepPhagy to automatically analyze all the images and quantitatively classified the autophagic phenotypes of the 35 atg knockout mutants into 3 classes. The high consistency in our computational and biochemical results indicated the reliability of DeepPhagy for measuring autophagic activity. Moreover, we used DeepPhagy to analyze 3 additional types of autophagic phenotypes, including the targeting of Atg1-GFP to the vacuole, the vacuolar delivery of GFP-Atg19, and the disintegration of autophagic bodies indicated by GFP-Atg8, all with satisfying accuracies. Taken together, our study not only enables the GFP-Atg8 fluorescence assay to become a quantitative measurement for analyzing autophagic phenotypes in S. cerevisiae but also demonstrates that deep learning-based methods could potentially be applied to different types of autophagy.
Abbreviations: Ac: accuracy; ALP: alkaline phosphatase; ALR: autophagic lysosomal reformation; ATG: AuTophaGy-related; AUC: area under the curve; CNN: convolutional neural network; Cvt: cytoplasm-to-vacuole targeting; DeepPhagy: deep learning for autophagy; fc_2: second fully connected; GFP: green fluorescent protein; MAP1LC3/LC3: microtubule-associated protein 1 light chain 3 beta; HAT: histone acetyltransferase; HemI: Heat map Illustrator; JRE: Java Runtime Environment; KO: knockout; LRN: local response normalization; MCC: Mathew Correlation Coefficient; OS: operating system; PAS: phagophore assembly site; PC: principal component; PCA: principal component analysis; PPI: protein-protein interaction; Pr: precision; QPSO: Quantum-behaved Particle Swarm Optimization; ReLU: rectified linear unit; RF: random forest; ROC: receiver operating characteristic; ROI: region of interest; SD: systematic derivation; SGD: stochastic gradient descent; Sn: sensitivity; Sp: specificity; SRG: seeded region growing; t-SNE: t-distributed stochastic neighbor embedding; 2D: 2-dimensional; WT: wild-type.
Introduction
In eukaryotic cells, macroautophagy (hereafter referred to as autophagy) is an evolutionarily conserved pathway for degrading and recycling cytoplasmic components, such as superfluous, obsolete or toxic structures, soluble proteins, protein aggregates or pathogens, to maintain cellular homeostasis and functions in both bulk non-selective and selective manners [Citation1]. The autophagic process is dynamically orchestrated by protein products of AuTophaGy-related (ATG) genes and autophagy regulators, whereas the dysfunction of autophagy has been implicated in a wide range of human diseases including cancer, diabetes and neurodegenerative disorders [Citation2–Citation5]. Accurately monitoring and measuring autophagic activity is fundamental for understanding the functional importance and regulatory roles of autophagy under physiological and pathological conditions.
In the yeast Saccharomyces cerevisiae, one of the most convenient end-point measurements for monitoring autophagy is the direct observation of the vacuolar delivery of N-terminally green fluorescent protein (GFP)-tagged Atg8 (GFP-Atg8) [Citation6]. Since a considerable proportion of GFP-Atg8 proteins incorporated into the inner membrane of completed autophagosomes will be degraded by vacuolar hydrolases, free GFP molecules are released into the vacuole and can be detected by fluorescence microscopy. Thus, counting the percentage of yeast cells with GFP-Atg8 signals within the vacuole can be a relatively accurate and quantitative readout to monitor autophagy activity [Citation7–Citation9]. In 2012, Dr. Li Yu’s lab used such an assay to conduct a functional screen of 8 histone acetyltransferases (HATs), discovering that the temperature-sensitive mutant esa1-1 greatly diminishes GFP-Atg8 vacuolar translocation. They further demonstrated that Esa1 regulates autophagy through specifically acetylating Atg3 at K19 and K48 sites [Citation7]. Later, they performed a mutagenesis screen of 44 individual phosphorylation sites, or phosphorylation site combinations, and identified that the S174A substitution of Atg31 significantly abolished the vacuolar delivery of GFP-Atg8 and disrupted Atg9 recycling [Citation8]. More recently, they used the same assay and found a protein kinase, Mec1, to be a critical regulator of glucose deprivation-induced autophagy [Citation9].
It should be noted that the GFP-Atg8 fluorescence assay has yet to be widely adopted for functional screens because manually distinguishing and individually labelling yeast cells with or without vacuole-localized GFP-Atg8 is labor-intensive, time-consuming and error-prone. In all 3 studies in which it has been used, 100 cells were randomly selected and counted for each sample, with this procedure repeated 3 times to calculate the mean and standard deviation values [Citation7–Citation9]. Thus, if the tedious procedure of cell counting can be automatically accomplished, e.g., by a computer, it will immediately enable the assay to become a much faster and more efficient approach for large-scale screens. Recently, various computational methods have been developed for automatically recognizing and quantifying cell phenotypes from high-throughput and high-content microscopy data [Citation10,Citation11]. A number of highly useful tools, such as CellProfiler, ImageJ and EBImage, can efficiently process fluorescence-based phenotypic images [Citation12–Citation14]. For example, CellProfiler was recommended to count N-terminally GFP-tagged MAP1LC3/LC3 (microtubule-associated protein 1 light chain 3 beta) or GFP-Atg8 puncta in individual mammalian or yeast cells, as an alternative assay to monitor autophagy [Citation15]. However, the conventional machine learning strategies often meet difficulties in efficiently extracting informative features upon large datasets, whereas advances in deep learning algorithms have provided much more powerful approaches in feature representations [Citation16–Citation19]. Thus, it can be naturally anticipated that deep learning algorithms might be helpful for monitoring the vacuolar delivery of GFP-Atg8 in yeast.
In this study, we transformed a GFP-ATG8 plasmid into wild-type (WT) and each knockout (KO) mutant of the 35 ATG genes in S. cerevisiae, separately, and then obtained 1,944 confocal microscopy images containing > 200,000 yeast cells during nitrogen starvation-induced autophagy. Then, we manually labelled 8,078 autophagic and 18,493 non-autophagic cells as the benchmark dataset and developed a novel deep learning for autophagy software package named DeepPhagy, which taught a computer to locate single yeast cells and discriminate whether GFP signals could be identified within the vacuole of each cell from fluorescence-based images. The performance of DeepPhagy was critically evaluated and compared with other existing tools and it exhibited superior accuracy for autophagic cell recognition. We further used DeepPhagy to automatically analyze all 1,944 images and quantitatively classify the autophagic phenotypes of the 35 atg KO mutants into 3 categories, class I, II and III. We observed that autophagy activity is almost fully blocked in class I mutants in which the deleted ATG genes are critical components of the core machinery of autophagy. The vacuolar delivery of GFP-Atg8 is significantly prolonged in class II mutants, but only considerably delayed in class III mutants. Immunoblotting assays were conducted and the computational identifications were highly consistent with biochemical assays, indicating the reliability of DeepPhagy in measuring autophagy activity. To test the usefulness of DeepPhagy in the analysis of other types of autophagy, 2 additional markers including Atg1-GFP and GFP-Atg19 were adopted and fluorescent images were taken under confocal microscopy. Our results demonstrated that DeepPhagy can be directly used to recognize the Atg1-GFP vacuolar delivery, with an AUC value of 0.9567. For the vacuolar targeting of GFP-Atg19, the original model in DeepPhagy achieved an AUC value of 0.9044, whereas an updated model could reach a 10-fold cross-validation AUC score of 0.9388. In addition, we re-analyzed the GFP-Atg8 images and re-trained a model for the discrimination of disintegrating autophagic bodies inside the vacuole, with a 10-fold cross-validation AUC value of 0.9214. Taken together, our studies not only provide a powerful computational tool for processing large-scale microscopy data in S. cerevisiae but also suggest that the deep learning algorithms could be broadly applied to analyze different types of autophagy. The stand-alone local packages of DeepPhagy 1.0 were written in Java 1.8 (J2SE8) and support 3 major operating systems, including Windows, Unix/Linux, and Mac. DeepPhagy is freely available for academic research at http://deepphagy.biocuckoo.org/.
Results
A deep learning framework for monitoring autophagy from fluorescent images
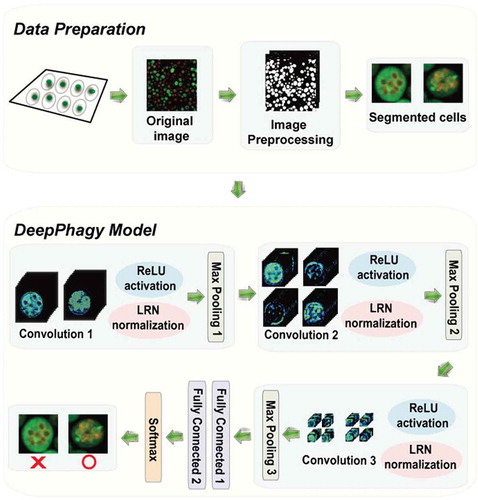
At present, 42 ATG genes have been reported to be involved mainly or exclusively in yeast autophagy, whereas 5 ATG genes, including ATG25, ATG28, ATG30, ATG35 and ATG37, are only encoded by Pichia Pastoris [Citation20,Citation21]. We transformed a GFP-ATG8 plasmid into WT S. cerevisiae and 35 atg KO strains (atg1Δ, atg2Δ, atg3Δ, atg4Δ, atg5Δ, vps30/atg6Δ, atg7Δ, atg9Δ, atg10Δ, atg11Δ, atg12Δ, atg13Δ, atg14Δ, atg15Δ, atg16Δ, atg17Δ, atg18Δ, atg19Δ, atg20Δ, atg21Δ, atg22Δ, atg23Δ, snx4/atg24Δ, atg26Δ, atg27Δ, atg29Δ, atg31Δ, atg32Δ, atg33Δ, atg34Δ, atg36Δ, atg38Δ, atg39Δ, atg40Δ, and atg41Δ; the S. cerevisiae atg8Δ and atg42∆ mutant was not included; Table S1) and counterstained the vacuoles with the dye FM4–64. Upon nitrogen starvation, 3 images at different regions were taken at 1 h intervals from 0 to 5 h by confocal microscopy, which recorded the GFP-Atg8 signal in the green channel and the vacuole signal in the red channel. Three biological replicates were obtained for all 36 yeast strains and in total we collected 1,944 (6 × 3 × 3 × 36) yeast cell images. From these images, we randomly selected one picture for each time interval for each yeast strain. Then, we manually labelled 26,571 yeast cells including 8,078 autophagic and 18,493 non-autophagic cells from the 216 (36 × 6) images. We established a pipeline for image pre-processing, which downsampled the original picture to a lower resolution for faster analysis, enhanced the image contrast, sharpened, detected and repaired the cell edges, located weighted centroids of individual cells, segmented cells and defined regions of interest (ROIs) for further training [Citation22–Citation27]. The parameters for imaging pre-processing were fine-tuned using the 26,571 labelled cells as a benchmark dataset.
For recognizing autophagic phenotypes, we developed a new computational method named DeepPhagy, which implemented a 5-layer convolutional neural network (CNN). DeepPhagy contained 3 connected convolutional blocks, each containing a convolution layer and a pooling layer (). For each convolution layer, a rectified linear unit (ReLU) was applied to avoid gradient diffusion during the training process and a local response normalization (LRN) was introduced to improve the generalization capacity. The first convolution block convolved individual cell images into feature maps, whereas the latter 2 blocks reinforced feature representations. Following the 3 convolutional blocks, 2 fully connected layers were implemented for classifying the inputted fluorescent images. For the classification, the output was implemented with a SoftMax function to calculate the probability [Citation18,Citation28,Citation29].
Figure 1. The DeepPhagy procedure for computationally identifying autophagic and non-autophagic yeast cells from fluorescent images. In the imaging pre-processing step, the original 1024 × 1024 confocal images were first downsampled to a lower resolution of 650 × 650 pixels for quicker processing. Individual cells were located and then cropped to a size of 61 × 61 pixels, centred on their weighted centroids. In the autophagy monitoring step, a 5-layer CNN model was constructed containing 3 consecutive convolutional blocks for feature representations and 2 fully connected layers for image classifications. The functions of ReLU, LRN and Max pooling were used to avoid gradient diffusion, improve the generalization capacity and reduce feature dimensionality, respectively.
The performance of recognizing autophagic phenotypes from single cell images
For training and testing DeepPhagy, the 26,571 labelled yeast cells were arbitrarily separated into a training dataset and a testing dataset, with a ratio of nearly 10:1. The training set contained 24,156 cells, including 7,322 autophagic and 16,834 non-autophagic cells, whereas the testing set contained 2,415 cells, with 756 autophagic and 1,659 non-autophagic cells. Using the training dataset, we performed n-fold cross-validations to evaluate the performance of DeepPhagy. The receiver operating characteristic (ROC) curves were drawn, while the area under the curve (AUC) values were calculated as 0.9749, 0.9708, 0.9726 and 0.9710 for the 4-, 6-, 8- and 10-fold cross-validations, respectively ().
Figure 2. The computational performance of DeepPhagy 1.0. (A) The ROC curves and AUC values of 4-, 6-, 8- and 10-fold cross-validations of DeepPhagy and 10-fold cross-validations of CellProfiler, DeepYeast and DeepLoc on the same training dataset [Citation12,Citation28,Citation29]. (B) The comparison of DeepPhagy, CellProfiler, DeepYeast and DeepLoc on the testing dataset. (C) Six types of mistakes occurred in DeepPhagy, including the identification of regions with no cells, regions with low signals, dead and immature cells, false-negative hits and false-positive predictions. Scale bar: 2 µm. (D) t-SNE visualization of extracted features demonstrating the ability to distinguish autophagic cells from non-autophagic cells for DeepPhagy and other methods [Citation31].
![Figure 2. The computational performance of DeepPhagy 1.0. (A) The ROC curves and AUC values of 4-, 6-, 8- and 10-fold cross-validations of DeepPhagy and 10-fold cross-validations of CellProfiler, DeepYeast and DeepLoc on the same training dataset [Citation12,Citation28,Citation29]. (B) The comparison of DeepPhagy, CellProfiler, DeepYeast and DeepLoc on the testing dataset. (C) Six types of mistakes occurred in DeepPhagy, including the identification of regions with no cells, regions with low signals, dead and immature cells, false-negative hits and false-positive predictions. Scale bar: 2 µm. (D) t-SNE visualization of extracted features demonstrating the ability to distinguish autophagic cells from non-autophagic cells for DeepPhagy and other methods [Citation31].](/cms/asset/18d6cf93-feca-44cf-b741-320b1158028d/kaup_a_1632622_f0002_oc.jpg)
We compared DeepPhagy with other existing tools, including CellProfiler, DeepYeast and DeepLoc [Citation12,Citation28–Citation30]. As previously described, a random forest (RF) classifier was trained on 102 features, which were extracted using a CellProfiler pipeline [Citation29,Citation30]. Recently, DeepYeast and DeepLoc both established 11-layer CNN frameworks, which contained 8 convolutional blocks and 3 fully connected layers for the accurate classification of protein subcellular localizations from high-throughput microscopy data [Citation28,Citation29]. We re-trained the 3 algorithms using the same DeepPhagy training set and the AUC values of the 10-fold cross-validations were 0.8489, 0.9483 and 0.9574 for CellProfiler, DeepYeast and DeepLoc, respectively (). Additionally, we fixed the specificity (Sp) scores of the 4 programs to approximately 95%, 90% and 85%, and compared their accuracy (Ac), sensitivity (Sn), precision (Pr) and Mathew Correlation Coefficient (MCC) values (Table S2). In general, the performance of DeepPhagy was higher than the other 3 tools. We also compared the 3 tools to DeepPhagy using the testing dataset, in which AUC values were computed as 0.9813, 0.8697, 0.9761 and 0.9675 for DeepPhagy, CellProfiler, DeepYeast and DeepLoc, respectively (). On the single cell level, we found that all deep learning algorithms are much better than the conventional machine learning classifiers, whereas the accuracy of DeepPhagy is considerably higher than DeepYeast and DeepLoc (,B).
Using the 216 yeast images, we carefully analyzed the mistakes made by DeepPhagy. We found the mistakes to be due primarily to technical issues and yeast population heterogeneity, including regions with contamination (‘No cell’) or ambiguous signals (‘Low signal’), and dead and immature cells that were not manually labelled but could be mistakenly recognized as cells during the imaging pre-processing step (). During the single cell-based classification, both false-negative and false-positive predictions could not be fully avoided (). To investigate whether the features extracted by DeepPhagy can distinguish autophagic cells against non-autophagic cells, we visualized the activations of the last fully connected layer of DeepPhagy in 2-dimensional (2D) diagrams using t-distributed stochastic neighbor embedding (t-SNE) for 2,000 randomly selected single cells from the benchmark dataset () [Citation31]. We also visualized features extracted from CellProfiler, DeepYeast and DeepLoc using the same dataset (). For other tools, different types of labelled cells were classified with a substantial overlap, whereas DeepPhagy clearly distinguished the 2 types of yeast cells (). Taken together, our results indicated that DeepPhagy is a stable and robust predictor for the recognition of autophagic phenotypes from cell images, exhibiting a superior performance against other existing methods.
The construction and usage of deepphagy software packages
DeepPhagy 1.0 was written in Java 1.8 and packaged with Install4j 6.0. Both the image pre-processing pipeline and the 5-layer CNNs were integrated in DeepPhagy. Thus, users can directly input one or multiple fluorescent images to have autophagic phenotypes automatically recognized in a quantitative manner. Three stand-alone packages were developed to support 3 major x64 operating systems (OSs), including Windows, Unix/Linux, and Mac. The applicability of DeepPhagy was rigorously tested under Windows 7/10, Ubuntu, and Apple Mac OS 10.12 (Sierra).
For convenience, we developed DeepPhagy 1.0 into an easy-to-use program and took one image of atg17Δ as an example to describe its usage. In the ‘Count’ module, the image data in one of 5 formats, including BMP, JPG, PNG, GIF or TIF, can be loaded by clicking on the ‘Load’ button in the main interface (Figure S1A). It should be noted that the size of the original image should be larger than 650 × 650 pixels because inputted pictures will be downsampled to 650 × 650 pixels for rapid analysis. By clicking on the ‘Recognize’ button, the image pre-processing will be conducted for cell segmentation and centroid location, and individual cells will be cropped from the whole image into small 61 × 61 pixel snapshots. The segmented cells will then be inputted into pre-trained CNNs for phenotypic classification (). As default parameters, autophagic (‘Positive’) and non-autophagic (‘Negative’) cells are marked with red and yellow rings, respectively (Figure S1B). Additionally, DeepPhagy allows users to manually label the images either before or after computational recognition, by clicking on the ‘Manual’ option (Figure S1B). The labelled image can be exported in multiple formats by clicking on the ‘Save’ button (Figure S2A). In a typical functional screen, hundreds or thousands of images will be generated and inputting images individually for the analysis is time-consuming. Thus, DeepPhagy allows the input of a batch of images for automatic processing in the ‘Batch’ module (Figure S2B). For more details on the usage of DeepPhagy 1.0, please refer to the manual, which can be downloaded from http://deepphagy.biocuckoo.org/down.php.
A quantitative analysis of autophagy activities of yeast atg KO mutants
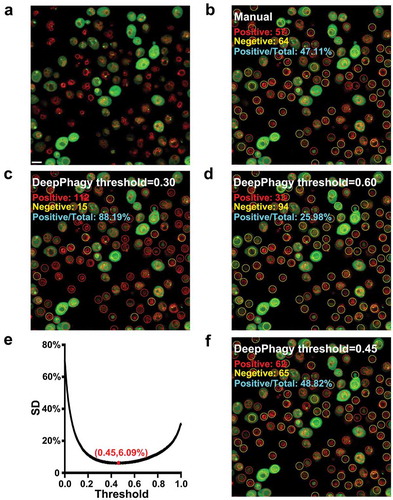
For the large-scale analysis of microscopy images, DeepPhagy cropped individual cells from whole images and then predicted the autophagic phenotype for each cell image by outputting a probability score calculated by the SoftMax function. Using different probabilities as thresholds can generate varied predictions, which might be far from reality. For example, from an image of atg17Δ (), we manually labelled 57 autophagic and 64 non-autophagic cells (). Using DeepPhagy with either a lower or a higher threshold generated predictions far from the manual labelling (,D). To adjust for this, we used the benchmark dataset with 216 images, to calculate the systematic derivation (SD) values of the differences between the manually labelled and computationally predicted results under different thresholds. From these calculations, the global threshold was determined to be 0.45, with a minimum SD value of 6.09% (). Using this score as the default threshold, DeepPhagy automatically labelled 62 autophagic and 65 non-autophagic cells ().
Figure 3. The importance of a global threshold for large-scale analyses. (A) An original image of atg17Δ at 5 h after nitrogen starvation. Scale bar: 5 µm. (B) From the image, 57 autophagic and 64 non-autophagic cells were manually labelled. (C) DeepPhagy labelled 112 autophagic and 15 non-autophagic cells under a lower threshold of 0.30. (D) Under a higher threshold of 0.60, 33 autophagic and 94 non-autophagic cells were computationally labelled. (E) The global threshold was calculated with a minimum SD of the manually and computationally labelled results. (F) Under the global threshold of 0.45, DeepPhagy labelled 62 autophagic and 65 non-autophagic cells.
Next, we directly inputted all 1,944 WT and atg KO mutant images into DeepPhagy using the ‘Batch’ module. Autophagic and non-autophagic cells were computationally identified and the autophagy activities, denoted as the proportion of autophagic cells among all the detected cells, were measured for each image (Table S3). Using the hierarchical clustering algorithm in the R package (https://www.r-project.org/), we analyzed the autophagy activity profiles and visualized the results with Heatmap Illustrator (HemI), a software package for illustrating heatmaps [Citation32]. Unexpectedly, the phenotypes of the 36 yeast strains were unambiguously clustered into 3 groups, namely, class I, class II and class III (). To test whether such a clustering was reliable, we further used the principal component analysis (PCA) algorithm in R and examined the first 3 principal components (PCs). Again, the 3 classes of autophagic phenotypes were able to be clearly discriminated ().
Figure 4. A systematic and time-course analysis of the autophagy process in atg KO mutants. Yeast cells were cultured in nitrogen starvation medium (SD [–N]) and imaged by fluorescence microscopy at 1 h intervals from 0 to 5 h. All images were analyzed by DeepPhagy and the autophagy activity was assessed by calculating the proportion of autophagic cells against all detected cells for each image. (A) The hierarchical clustering algorithm classified the autophagic phenotypes of 36 yeast strains into 3 categories, class I, class II and class III. (B) The PCA-based classification of autophagic phenotypes. (C) The autophagy activity values at different time points for each yeast strain.
![Figure 4. A systematic and time-course analysis of the autophagy process in atg KO mutants. Yeast cells were cultured in nitrogen starvation medium (SD [–N]) and imaged by fluorescence microscopy at 1 h intervals from 0 to 5 h. All images were analyzed by DeepPhagy and the autophagy activity was assessed by calculating the proportion of autophagic cells against all detected cells for each image. (A) The hierarchical clustering algorithm classified the autophagic phenotypes of 36 yeast strains into 3 categories, class I, class II and class III. (B) The PCA-based classification of autophagic phenotypes. (C) The autophagy activity values at different time points for each yeast strain.](/cms/asset/7488a976-119c-41e9-919b-3fbca8f3fa66/kaup_a_1632622_f0004_oc.jpg)
The average autophagy activities of each strain at different time points from 0 to 5 h were measured and shown for the 3 classes separately (). We found that the vacuolar delivery of GFP-Atg8 was largely or almost fully abolished in class I mutants, which included the atg1Δ, atg2Δ, atg3Δ, atg4Δ, atg5Δ, vps30/atg6Δ, atg7Δ, atg9Δ, atg10Δ, atg12Δ, atg13Δ, atg14Δ, atg16Δ, atg18Δ and atg21Δ mutants (). None of the mutants reached an average autophagy activity ≥ 25%, even at 5 h after nitrogen starvation. The class II strains included the atg11Δ, atg17Δ, atg23Δ, atg27Δ, atg29Δ, atg31Δ, atg38Δ and atg41Δ mutants. In these strains, the GFP-Atg8 translocation was significantly prolonged, but far from being fully blocked (). After 1 h of nitrogen starvation, the average autophagy activities of most of the class II strains were less than 25%, with the exception of atg38Δ, and no strains exhibited an average autophagy activity ≥ 50% even at 2 h after starvation (). For the class III strains, which included the WT and the atg15Δ, atg19Δ, atg20Δ, atg22Δ, snx4/atg24Δ, atg26Δ, atg32Δ, atg33Δ, atg34Δ, atg36Δ, atg39Δ and atg40Δ mutants, GFP-Atg8 delivery was only considerably or slightly delayed at 1 h after starvation. All class III mutants reached an average autophagy activity >50% after 2 h of starvation (). In particular, the atg22Δ, atg32Δ, atg34Δ, and atg36Δ mutants and the WT were classified together in a single sub-class ().
To further distinguish the phenotypes within and across the 3 classes, the autophagy activities of 9 replicates at each time interval were assessed for each strain and pairwise comparisons were carried out through a two-tailed t-test (Benjamini-Hochberg adjusted p-value < 0.01). Obviously, the significant differences between yeast strains of the same class were much lower than between strains from different classes (Table S4). Additionally, we found that most of yeast strains in the same class did not exhibit significant differences with one another at 0 h, while their percent differences increased considerably during autophagy (Table S4). For example, in class II, the autophagy activity of atg11Δ was not significantly different from atg38Δ at 0 h (p-value = 1.53E-02 > 0.01), whereas the p-values were calculated to be 4.45E-08, 7.03E-16, 4.23E-12, 5.85E-15 and 7.46E-14 at 1, 2, 3, 4 and 5 h after starvation, respectively (Table S4). Thus, our analysis demonstrated that autophagy activities of KO mutants in the same class could still be significantly different from each other at different intervals of time after starvation.
Further validations and analyses of the 3 autophagic phenotype classes
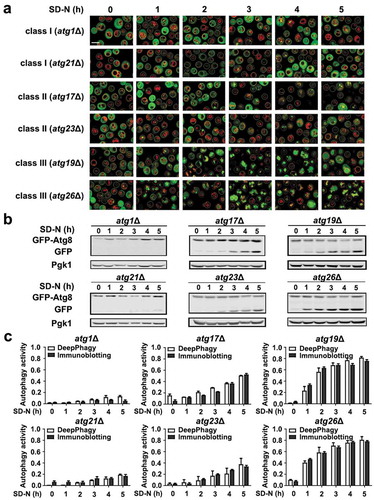
We manually checked the computationally labelled images and found that most of the cells were correctly identified by DeepPhagy. For example, we found that most of the atg1Δ and atg21Δ mutant cells (class I) were non-autophagic from 0 to 5 h during nitrogen starvation, whereas mutants in class II, such as the atg17Δ and atg23Δ strains, contained few autophagic cells at early stages after starvation, with the proportion of autophagic cells considerably increasing in later stages (). In the class III strains, such as the atg19Δ and atg26Δ mutants, a large proportion of the cells became autophagic after 2 h of starvation (). To evaluate the reliability of high-throughput image analyses and phenotype classifications, immunoblotting assays were performed for the atg1Δ, atg17Δ, atg19Δ, atg21Δ, atg23Δ and atg26Δ mutants after nitrogen starvation (). The ratios of free GFP to total GFP (sum of full-length GFP-Atg8 and free GFP) were quantified and compared to the DeepPhagy-based quantifications (). From the results, we found that the biochemical validations were highly consistent with the computational identifications.
Figure 5. Biochemical validations of the DeepPhagy results. (A) Partial images computationally labelled by DeepPhagy are shown for atg1Δ and atg21Δ (class I), atg17Δ and atg23Δ (class II), and atg19Δ and atg26Δ (class III). It can be observed that most of cells were correctly labelled. Scale bar: 5 µm. (B) Immunoblotting assays for the 6 atg KO mutants at different time points during nitrogen starvation. The protein expression level of Pgk1 was used as a control and the free GFP:total GFP ratios were quantified to measure autophagy activity. (C) The comparison of autophagy activities quantified by DeepPhagy (white columns) and immunoblotting assays (black columns).
The protein-protein interactions (PPIs) of the Atg proteins (except Atg8) were analyzed and visualized by Circos [Citation33]. From 2 high-quality PPI databases, including mentha and BioGRID, we retrieved 63 non-redundant pairs of experimentally identified PPIs among the 31 Atg proteins; no known interacting partners were obtained for Atg15, Atg22, Atg26 or Atg33 () [Citation34,Citation35]. Six types of PPIs were identified based on the autophagy classifications, including 23 class I-class I, 7 class II-class II, 1 class III-class III, 18 class I-class II, 6 class I-class III and 8 class II-class III interactions. Because most of the class I members form distinct protein complexes and participate in autophagosome formation during autophagy, it was not unusual that the largest number of PPIs were of the class I-class I type. Furthermore, the number of intergroup and intragroup PPIs were almost identical, indicating a complicated association among the different classes of Atg proteins (). In a previous study, we showed computationally that 21 of 35 Atg proteins in S. cerevisiae are conserved in Homo sapiens with potential orthologs, including Atg1, Atg2, Atg3, Atg4, Atg5, Vps30/Atg6, Atg7, Atg8, Atg9, Atg10, Atg11, Atg12, Atg13, Atg14, Atg16, Atg17, Atg18, Atg20, Atg21, Snx4/Atg24 and Atg38 [Citation20]. Here, we found that all the class I members are conserved, whereas only Atg11, Atg17 and Atg38 of class II and Atg20 and Snx4/Atg24 of class III are conserved in H. sapiens (). In this regard, our studies support the importance of Atg proteins that are involved in autophagosome formation.
Figure 6. The PPI network of yeast Atg proteins was visualized by Circos [Citation33]. From mentha and BioGRID, we retrieved 63 unique pairs of experimentally identified PPIs among 31 Atg proteins [Citation34,Citation35]. For the arc of the outer ring, different colors denote the Atg protein categories and the lengths are proportional to the number of interacting partners for each Atg. The average autophagy activities of each atg KO mutant during nitrogen starvation are diagrammed in the inner ring. Different interaction types are marked with different colors. Atg proteins conserved or not in H. sapiens are shown in red or blue, respectively.
![Figure 6. The PPI network of yeast Atg proteins was visualized by Circos [Citation33]. From mentha and BioGRID, we retrieved 63 unique pairs of experimentally identified PPIs among 31 Atg proteins [Citation34,Citation35]. For the arc of the outer ring, different colors denote the Atg protein categories and the lengths are proportional to the number of interacting partners for each Atg. The average autophagy activities of each atg KO mutant during nitrogen starvation are diagrammed in the inner ring. Different interaction types are marked with different colors. Atg proteins conserved or not in H. sapiens are shown in red or blue, respectively.](/cms/asset/ad72d8de-a60d-4f0c-bcfc-53f3f791fe01/kaup_a_1632622_f0006_oc.jpg)
An extension of deepphagy to other types of autophagic phenotypes
To exploit the applicability of DeepPhagy in the recognition of other types of autophagic phenotypes, we chose 2 additional autophagy markers, Atg1-GFP and GFP-Atg19. As a conserved serine/threonine protein kinase, Atg1 forms a multiprotein complex with Atg13, Atg17, Atg29 and Atg31 and plays a critical role in both the bulk and selective autophagy pathways [Citation36,Citation37]. It was reported that the vacuolar delivery and lysosomal digestion of Atg1-GFP are similar to that of GFP-Atg8 [Citation37]. Thus, Atg1-GFP can serve as an alternative readout for monitoring autophagy activity. Here, we individually transformed an ATG1-GFP plasmid into the WT and 7 atg KO strains, including atg13Δ and atg21Δ in class I, atg17Δ and atg23Δ in class II, and atg19Δ, snx4/atg24Δ and atg26Δ in class III. The procedure was identical to the GFP-Atg8 assay and we obtained 432 (6 × 3 × 3 × 8) yeast cell images. For each timepoint we randomly selected an image and manually labelled 2,519 positive and 6,649 negative cells from the 48 (8 × 6) images by judging whether GFP signals could be identified within the vacuole. Based on this labelled dataset, we directly inputted the 48 images into DeepPhagy and calculated an AUC value as 0.9567 (), which is slightly lower than the accuracy for GFP-Atg8 (AUC = 0.9710) (). Thus, DeepPhagy can be directly used for monitoring the targeting of Atg1-GFP to the vacuole. Furthermore, we used DeepPhagy to analyze the 432 images with a pre-defined global threshold of 0.45 (). Since Atg13 and Atg17 are required for forming the Atg1 complex to initiate autophagy [Citation36], it was not surprising that the vacuolar delivery of Atg1-GFP is dramatically abolished in the atg13Δ and atg17Δ strains (). Previously, it was demonstrated that the recycling of the peripheral membrane protein Atg23 from the phagophore assembly site (PAS) is dependent on the kinase activity of Atg1 [Citation38]. We found that the deletion of ATG23 also considerably diminished Atg1-GFP targeting, which was not impacted in other KO mutants ().
Figure 7. The applicability of DeepPhagy for analyzing other types of autophagic phenotypes. For large-scale analyses, a pre-defined global threshold of 0.45 was adopted (). (A) The accuracy of DeepPhagy for directly discriminating cells with or without Atg1-GFP vacuolar delivery. (B) The DeepPhagy-based analysis of Atg1-GFP targeting in the WT and 7 atg KO strains. (C) The accuracies of the original DeepPhagy model and the newly re-trained model for recognizing GFP-Atg19 vacuolar delivery. The original model mistakenly recognized a proportion of cells containing large GFP puncta associated with the vacuolar membrane as positive hits, while this type of error was alleviated in the new model. Scale bar: 2 µm. (D) The automatic analysis of GFP-Atg19 targeting in the WT and 7 atg KO strains. (E) Cells with accumulated or dispersed GFP signals inside their vacuoles were manually labelled as positive or negative cells, respectively. Scale bar: 5 µm. (F) The accuracy of the recognition of disintegrating autophagic bodies based on manually labelled atg15Δ and atg22Δ mutant cells. (G) The automatic analysis of the autophagic-body breakdown in the WT and 8 atg KO strains.
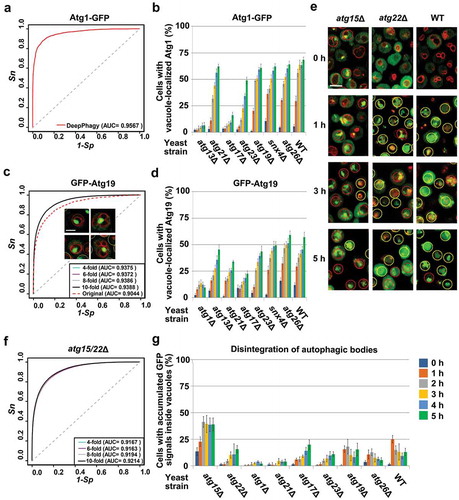
As a selective autophagy receptor, Atg19 is essential for the recruitment and assembly of vacuolar enzymes in the cytoplasm-to-vacuole targeting (Cvt) pathway [Citation39,Citation40]. Thus, GFP-Atg19 can be helpful for specifically measuring selective autophagy activity. In this study, we transformed a GFP-ATG19 plasmid into the WT and 7 atg KO strains, including atg1Δ, atg13Δ and atg21Δ in class I, atg17Δ and atg23Δ in class II, and snx4/atg24Δ and atg26Δ in class III. Using the same procedure as above, we obtained 432 (6 × 3 × 3 × 8) GFP-Atg19 fluorescent images. Again, we randomly selected one image from each time interval and manually labelled 3,068 positive and 5,886 negative cells from the 48 (8 × 6) images by judging whether GFP signals could be identified within the vacuole. Using this dataset, we directly inputted the 48 images into DeepPhagy and calculated an AUC value as 0.9044 (). We carefully checked the computational results and found that a considerable proportion of the cells containing large GFP puncta associated with the vacuolar membrane were mistakenly recognized as positive cells (). Thus, we re-trained a new model using the labelled cells and achieved a 10-fold cross-validation AUC score of 0.9388 (). This new model was incorporated into DeepPhagy as an additional program called ‘GFP-Atg19’. Using this program, we analyzed the 432 images and found that the deletion of ATG1 or ATG17, but not ATG13, significantly blocked the vacuolar targeting of GFP-Atg19 (). We also observed that the loss of Atg21, a phosphoinositide binding protein required for lipidation and localization of Atg8 at the PAS [Citation41], considerably decreased GFP-Atg19 delivery ().
It was previously reported that Atg15, but not Atg22, is crucial for the disintegration of autophagic bodies within the vacuole, with autophagic bodies accumulating in atg15Δ strains to reduce the degradation and recycling of cytoplasmic components [Citation42,Citation43]. Because the autophagic-body breakdown phenotype was not considered in the original model of DeepPhagy, we manually labelled 4,150 positive and 5,897 negative cells from 108 (6 × 3 × 3 × 2) GFP-Atg8 images of atg15Δ and atg22Δ mutants by judging whether the GFP signals were accumulated or dispersed inside the vacuole (). We re-trained a computational model with a 10-fold cross-validation AUC value of 0.9214 () and developed an additional program called ‘atg15/22Δ’ in the DeepPhagy software package. Using the program, we re-analyzed 486 (6 × 3 × 3 × 9) GFP-Atg8 images of the WT and 8 atg KO strains and observed that only the deletion of ATG15 significantly increased the accumulation of GFP-Atg8 within the vacuole (). It should be noted that GFP-Atg8 molecules might not always be equally distributed inside the vacuole and occasionally accumulated in a considerable proportion of yeast cells. Thus, the results in KO mutants should be carefully interpreted by comparing to WT cells. Additional experimental approaches, such as electron microscopy, should also be adopted for validation [Citation42,Citation43].
Discussion
Unlike cyclic biological processes, such as the cell cycle and circadian rhythm, autophagy is a typical acyclic progressive process with multiple steps, including autophagy initiation, phagophore biogenesis and expansion, autophagosome formation, autophagosome-lysosome fusion, and autophagic lysosomal reformation (ALR) [Citation15,Citation44,Citation45]. Quantitatively monitoring and measuring autophagic activity in an accurate manner is crucial for the identification of new regulators involved in autophagy and provides a fundamental means for elucidating the molecular mechanisms of autophagy.
To date, a variety of end-point measurements, such as the Pho8∆60 assay and the GFP-Atg8 cleavage assay, have been well established for measuring autophagy in S. cerevisiae [Citation15,Citation46]. After the elimination of first 60 amino acids at the N-terminus, the Pho8∆60 mutant, stays in the cytosol in its inactive form, which is randomly engulfed by autophagosomes and transported to the vacuole for activation upon the induction of autophagy. Therefore, the resulting alkaline phosphatase (ALP) activity of Pho8∆60 can be used as a sensitive and quantitative readout for bulk autophagy function [Citation47]. However, the inevitable background signal and the time consuming cell lysis procedures have limited its application in detecting very low levels of autophagy and in quick functional screening experiments. In the Pho8∆60 assay, only non-selective autophagy is measured, whereas GFP-Atg8 quantification is a sum of all of the different autophagy pathways [Citation15,Citation46]. With an N-terminally tagged GFP, the ratio between free GFP and total GFP can be quantified by immunoblotting to measure the autophagic flux, or the GFP signal can be directly visualized by fluorescence microscopy to monitor the vacuolar delivery of Atg8 [Citation6,Citation48–Citation51]. The former is actually a semi-quantitative approach due to the intrinsic nature of immunoblotting, whereas with the latter assay GFP quenching can occur in acidic environments. Since the yeast vacuole is not as acidic in contrast to the mammalian lysosome (generally ~ pH 6.2 vs. 4.8), the GFP-Atg8 fluorescence assay is still a sensitive and efficient assay to minor yeast autophagy activity [Citation51].
Previously, the labelling of autophagic or non-autophagic cells in GFP-Atg8 fluorescent images was conducted by eye to arbitrarily judge whether GFP signals could be observed within the vacuole. Indeed, such a procedure is tedious and labor-intensive. Additionally, since different scientists might have different experience with the discrimination of autophagic phenotypes, the manual labelling results might be difficult to reproduce exactly by other researchers. In this regard, the automatic identification of autophagic phenotypes from fluorescent images by computational algorithms can provide a highly efficient approach for functional screenings. In addition, the results can be easily reproduced if the parameters in the computational models are pre-configured. In contrast with the CellProfiler tool implemented in conventional machine learning algorithms, DeepYeast, DeepLoc and our DeepPhagy trained models under deep learning frameworks and achieved much better performance [Citation12,Citation28,Citation29]. In deep learning algorithms, stacking more layers does not always equate to better performance. Decreases in training accuracy might occur in deeper networks due to vanishing/exploding gradients that hamper convergence [Citation52,Citation53]. Thus, choosing an appropriate network framework is crucial to obtain superior performance and this mainly depends on the scientific question. Because DeepYeast and DeepLoc were constructed for classifying multiple subcellular localizations of GFP-tagged proteins in S. cerevisiae, the network architecture was more complicated with 11-layer CNNs [Citation28,Citation29]. In contrast, DeepPhagy is a binary classifier to label autophagic and non-autophagic cells and 5-layer CNNs were enough to achieve better accuracy compared to DeepYeast and DeepLoc (,).
Our DeepPhagy 1.0 is a starting point for the application of deep learning-based computer vision approaches in the analysis of autophagic phenotypes from fluorescent images. For future plans, there are still a number of important studies that need to be performed. First, although we tried our best to manually label 8,078 autophagic and 18,493 non-autophagic yeast cells from GFP-Atg8 fluorescence images, the benchmark dataset was far from being ‘big data’. Undoubtedly, a larger training dataset will lead to a higher prediction accuracy and we will be continuously conducting manual labelling to increase the training set. Second, the autophagic process is highly dynamic and complicated and the vacuolar delivery of GFP-Atg8 is only reflective of one type of the varied autophagic phenotypes. In addition to GFP-Atg8, we also analyzed 3 additional types of autophagic phenotypes, including Atg1-GFP vacuolar delivery, GFP-Atg19 vacuolar targeting, and the disintegration of autophagic bodies. Although DeepPhagy could be used directly for monitoring Atg1-GFP targeting, specific models were re-trained using newly labelled datasets for an accurate recognition of GFP-Atg19 vacuolar delivery and the autophagic-body breakdown. Thus, for the analysis of autophagic phenotypes different from the vacuolar targeting of GFP-Atg8, we suggest that high-quality datasets need to be provided through manual labelling for training more accurate models. Third, CNN is only the one type of the various deep learning algorithms and we plan to test other algorithms to improve the accuracy in the near future. In the current release of DeepPhagy only individual images can be analyzed, however, it will be more convenient if videos can be directly processed. In addition, the computational methods in DeepPhagy can be extended to count GFP-LC3B puncta in mammalian cells, which enables a much broader usage.
Materials and methods
Yeast strains and plasmids
The wild-type haploid S. cerevisiae yeast strain used in this study was BY 4741 (MATa his3∆ leu2∆ met15∆ ura3∆). KO mutants in the BY4741 background were bought from Thermo Fisher Scientific (Table S1) [Citation54]. Plasmids expressing GFP-Atg8, Atg1-GFP and GFP-Atg19 were gifts from Prof. Li Yu (Tsinghua University).
Culturing of yeast cells
Standard protocols were used for yeast manipulation [Citation7–Citation9]. Cells were inoculated into either YPD (Sangon Biotech, A507022) or SD medium (0.67% yeast nitrogen base w/o amino acids [Becton, Dickinson and Company, 291920], 0.5% ammonium sulphate and 2% glucose [VWR Life Science AMRESCO® biochemicals, 0188]) with appropriate supplements and incubated overnight. For nitrogen-starvation conditions, the cultures were then shifted to SD-N medium (2% glucose, 0.17% yeast nitrogen base w/o amino acids and ammonium sulphate [Becton, Dickinson and Company, 233520]).
Fluorescence microscopy
Yeast cells were grown to OD600 = 0.8–1.0 in appropriate selective medium. To visualize vacuoles with FM 4–64, cells were incubated in rich medium containing 25 µg/ml FM 4-64 (Life Technologies, T3166) for 25 min, then chased for 40 min at 30°C and shifted to SD-N medium for various lengths of time [Citation55]. The cells were observed at room temperature using an Olympus FV-1000 confocal microscope. For each of the WT and 35 atg KO yeast strains, the autophagic phenotype was monitored and imaged 3 times at different microscopy regions, at 1 h intervals from 0 to 5 h. The experiments were independently repeated 3 times.
Image pre-processing
The original confocal microscopy images had a resolution of 1024 × 1024 pixels and it was difficult for Java 1.8 to rapidly process and analyze such large images due to the maximum memory supported by Java Runtime Environment (JRE). Using a Java smooth function, getScaledInstance, we first scaled all fluorescent images to 650 × 650 pixels, which efficiently reduced the computational time without influencing the fidelity. As previously described, color inversion was conducted to enhance the image contrast [Citation24]. The RGB images were then converted to grayscale, and the Sobel operator, a commonly used algorithm for calculating the image gradient, was applied to sharpen the cell edges [Citation22,Citation24]. For the segmentation of candidate cell regions, a multi-level Otsu thresholding algorithm was used to convert gray images to binary images [Citation23,Citation24]. Then, we performed a series of morphological operations on the binary images including erosion, dilation and filling holes, to remove isolated pixel noise, smooth irregular borders and fill holes, respectively [Citation24]. To further separate the clustered cells, we applied a distance transformation to calculate the distance of each pixel from the nearest candidate region and removed peripheral contours that might be adhesion targets among the candidate cells [Citation25]. Finally, a seeded region growing (SRG) algorithm was used to label the maximum gradient regions and the weighted centroid of each region was calculated as the cell centre [Citation26]. Then, individual candidate cells were cropped to a size of 61 × 61 pixels centred on their weighted centroids. Because parts of other cells might also be cropped, we defined the ROI of a cell using a circle around the weighted centroid with a fixed radius of 20 pixels. For each cell image, pixels out of the ROI were normalized to RGB (0, 0, 0) as the black background.
To determine the parameters (p1, p2, …, pn) in the full image pre-processing procedure, we used the following equation:
Here, N is equal to 26,571, which is the number of manually labelled yeast cells from 216 fluorescent images; N’ is the number of computationally labelled cells and M is the number of labelled non-cell regions. In this study, the Quantum-behaved Particle Swarm Optimization (QPSO) algorithm was adopted to minimize the ε value to 5.49% to obtain the optimal parameters [Citation27].
Training deepphagy
Caffe is an open source deep learning framework originally written in C++ (http://caffe.berkeleyvision.org/). Here, we re-implemented the core libraries of Caffe in Java and then developed a 5-layer CNN to recognize the autophagic phenotypes from fluorescent images of yeast cells. First, a batch of cell images were inputted in 3 connected convolutional blocks, each containing a convolution layer and a pooling layer. Specifically, for each convolution layer, a ReLU activation function was applied to avoid gradient diffusion and an LRN function with a local size of 3, an alpha value of 0.00001 and a beta value of 0.95 was introduced to improve the generalization capacity. There were 25, 50 and 100 Gaussian filters applied in convolution layer 1, 2 and 3, respectively, with a standard deviation of 0.01. For each layer, the kernel size was 3 × 3 pixels, with a stride of 1 pixel. A max pooling strategy was used to downsample feature representations and reduce dimensionality in the 3 pooling layers, using the kernel size of 3 × 3 pixels, with a stride of 2 pixels. After the convolutional blocks, 2 fully connected layers were implemented for classifying the inputted fluorescent images. To prevent neural networks from overfitting, a dropout method with a threshold value of 0.5 was applied before the 2 fully connected layers. For the classification, the output was implemented with a SoftMax loss function to calculate the probability. As previously described, a per-pixel training set mean was calculated and subtracted for each image before use [Citation29]. The standard learning method of stochastic gradient descent (SGD) was adopted with a momentum of 0.9, whereas the learning rate followed a sigmoid decay policy with an initial value (base_lr) of 0.01, a weight decay of 0.0005, a gamma value of 0.05, a power of 0.75, and a mini-batch size of 10. The models were trained for 50,000 iterations.
Performance evaluation and comparison
To evaluate the prediction accuracy and robustness of DeepPhagy, 5 standard measurements of Ac, Sn, Sp, Pr and MCC were adopted and calculated as follows:
For the comparison of DeepPhagy with other existing tools, the same training dataset was used. First, we trained an RF classifier implemented in the Python scikit-learn package on features that were extracted using a CellProfiler pipeline [Citation30]. In total, there were 102 different features consisting of intensity, geometric, and texture measurements of images on different scales. The maximum depth of the tree was determined as 15, while the minimum number of samples required to split an internal node was selected as 10. The minimum number of samples required to be at a leaf node was also chosen as 10. The 11-layer CNNs of DeepYeast and DeepLoc were directly used for training [Citation28,Citation29]. To evaluate feature representations learned by other tools, we visualized 102 features extracted from CellProfiler and 512 features retrieved from the second fully connected (fc_2) layers of both DeepYeast and DeepLoc [Citation31].
The global threshold for high-throughput analysis
Given a series of microscopy images (i1, i2, …, in), single cells will be cropped, and a probability score will be computed by DeepPhagy for each cell image. Thus, under a certain probability as the threshold, the SD value can be calculated as follows:
For each microscopy image, MP and MN represent manually labelled autophagic and non-autophagic cells, whereas DP and DN refer to autophagic and non-autophagic cells computationally recognized by DeepPhagy, respectively. We calculated SD values under different probabilities ranging from 0 to 1, with a 0.01 increase per step. The probability with the minimal SD value was selected as the global threshold for the large-scale analysis.
Immunoblotting analysis
The samples for immunoblotting analysis were prepared by an alkaline extraction method as described previously [Citation56]. Urea-containing SDS-PAGE was performed to separate full length GFP-Atg8 from its free GFP form. In this study, we used IRDye_800CW donkey anti-mouse IgG (H + L) (LI-COR Biosciences, 926–32212) as secondary antibody and an Odyssey_CLx imaging system to capture the immunoblotting results. The mouse antibody against GFP (11814460001) was purchased from Roche and the mouse antibody against Pgk1 (ab113687) was purchased from Abcam. Image Studio software was applied to analyze the immunoblotting results. Each experiment was repeated 3 independent times.
Data availability
All original and DeepPhagy-labelled images of WT and atg KO S. cerevisiae mutants are freely available for download at http://deepphagy.biocuckoo.org/dataset.php/. The benchmark datasets, including the original and manually labelled images for training and testing, are also available for download.
Statistical analysis
Experimental data were shown as mean ± SD (, and ,D,G). The statistical comparison of the autophagy activities at each time interval was pairwisely conducted for the WT and 35 atg KO mutant strains, by using two-tailed t-tests (Benjamini-Hochberg adjusted p-value < 0.01).
Supplemental Material
Download Zip (4.5 MB)Acknowledgments
The authors would like to thank Prof. Li Yu (Tsinghua University) for his great helps on plasmid sharing, and helpful suggestions on yeast experiments. We also thank Dr. Lili Ma and Ms. Yaping Wei, for their useful discussions. This work was supported by grants from the Special Project on Precision Medicine under the National Key R&D Program (2017YFC0906600 and 2018YFC0910500), the Natural Science Foundation of China (31671360, 31801095, 81701567, 91753137, 31471252, 31771462, 31801105, 91754107 and 31771528), the National Program for Support of Top-Notch Young Professionals, Young Changjiang Scholars Program of China, the program for HUST Academic Frontier Youth Team, the Guangdong Natural Science Foundation (2018A030313323) and China Postdoctoral Science Foundation (2017M622864, 2018M632870, 2018M642816 and 2018T110907). The manuscript has been edited by American Journal Experts (AJE) prior to submission.
Disclosure statement
No potential conflict of interest was reported by the authors.
Supplementary material
Supplemental data for this article can be accesed here
Additional information
Funding
Related Research Data
References
- Reggiori F, Klionsky DJ. Autophagy in the eukaryotic cell. Eukaryot Cell. 2002;1:11–21. PMID:12455967.
- Mainz L, Rosenfeldt MT. Autophagy and cancer - insights from mouse models. Febs J;2017. DOI:10.1111/febs.14274. PMID:28921866.
- Levine B, Mizushima N, Virgin HW. Autophagy in immunity and inflammation. Nature. 2011;469:323–335. PMID:21248839.
- Deretic V, Levine B. Autophagy, immunity, and microbial adaptations. Cell Host Microbe. 2009;5:527–549. PMID:19527881.
- Lynch-Day MA, Mao K, Wang K, et al. The role of autophagy in Parkinson’s disease. Cold Spring Harb Perspect Med. 2012;2:a009357. PMID:22474616.
- Klionsky DJ. For the last time, it is GFP-Atg8, not Atg8-GFP (and the same goes for LC3). Autophagy. 2011;7:1093–1094. PMID:21993240.
- Yi C, Ma M, Ran L, et al. Function and molecular mechanism of acetylation in autophagy regulation. Science. 2012;336:474–477. PMID:22539722.
- Feng W, Wu T, Dan X, et al. Phosphorylation of Atg31 is required for autophagy. Protein Cell. 2015;6:288–296. PMID: 25773276.
- Yi C, Tong J, Lu P, et al. Formation of a Snf1-Mec1-Atg1 module on mitochondria governs energy deprivation-induced autophagy by regulating mitochondrial respiration. Dev Cell. 2017;41:59–71e4. PMID:28399401.
- Eliceiri KW, Berthold MR, Goldberg IG, et al. Biological imaging software tools. Nat Methods. 2012;9:697–710. PMID:22743775.
- Mattiazzi Usaj M, Styles EB, Verster AJ, et al. High-content screening for quantitative cell biology. Trends Cell Biol. 2016;26:598–611. PMID:27118708.
- Carpenter AE, Jones TR, Lamprecht MR, et al. CellProfiler: image analysis software for identifying and quantifying cell phenotypes. Genome Biol. 2006;7:R100. PMID:17076895.
- Collins TJ. ImageJ for microscopy. BioTechniques. 2007;43:25–30. PMID:17936939.
- Pau G, Fuchs F, Sklyar O, et al. EBImage–an R package for image processing with applications to cellular phenotypes. Bioinformatics. 2010;26:979–981. PMID:20338898.
- Klionsky DJ, Abdelmohsen K, Abe A, et al. Guidelines for the use and interpretation of assays for monitoring autophagy (3rd edition). Autophagy. 2016;12:1–222. PMID:26799652.
- Grys BT, Lo DS, Sahin N, et al. Machine learning and computer vision approaches for phenotypic profiling. J Cell Biol. 2017;216:65–71. PMID:27940887.
- Sbalzarini IF. Seeing is believing: quantifying is convincing: computational image analysis in biology. Adv Anat Embryol Cell Biol. 2016;219:1–39. PMID:27207361.
- LeCun Y, Bengio Y, Hinton G. Deep learning. Nature. 2015;521:436–444. PMID:26017442.
- Pegoraro G, Misteli T. High-throughput imaging for the discovery of cellular mechanisms of disease. Trends Genet. 2017;33:604–615. PMID: 28732598.
- Deng W, Ma L, Zhang Y, et al. THANATOS: an integrative data resource of proteins and post-translational modifications in the regulation of autophagy. Autophagy. 2017:1–36. DOI:10.1080/15548627.2017.1402990. PMID:29157087.
- Parzych KR, Ariosa A, Mari M, et al. A newly characterized vacuolar serine carboxypeptidase, Atg42/Ybr139w, is required for normal vacuole function and the terminal steps of autophagy in the yeast Saccharomyces cerevisiae. Mol Biol Cell. 2018;29:1089–1099. PMID:29514932.
- Chalfoun J, Majurski M, Peskin A, et al. Empirical gradient threshold technique for automated segmentation across image modalities and cell lines. J Microsc. 2015;260:86–99. PMID: 26046924.
- Liao PS, Chen TS, Chung PC. A fast algorithm for multilevel thresholding. J Inf Sci Eng. 2001;17:713–727.
- Choudhry P. High-throughput method for automated colony and cell counting by digital image analysis based on edge detection. PLoS One. 2016;11:e0148469. PMID: 26848849.
- Borgefors G. Distance transformations in digital images. Comput Vision Graphics Image Process. 1986;34:344–371.
- Fan J, Zeng G, Body M, et al. Seeded region growing: an extensive and comparative study. Pattern Recognit Lett. 2005;26:1139–1156.
- Cai Y, Sun J, Wang J, et al. Optimizing the codon usage of synthetic gene with QPSO algorithm. J Theor Biol. 2008;254:123–127. PMID:18579159.
- Kraus OZ, Grys BT, Ba J, et al. Automated analysis of high-content microscopy data with deep learning. Mol Syst Biol. 2017;13:924. PMID:28420678.
- Parnamaa T, Parts L. Accurate classification of protein subcellular localization from high-throughput microscopy images using deep learning. G3 (Bethesda). 2017;7:1385–1392. PMID:28391243.
- Bray MA, Vokes MS, Carpenter AE. Using cellprofiler for automatic identification and measurement of biological objects in images. Curr Protoc Mol Biol. 2015;109:14 7 1–3. PMID:18425761.
- Faust K, Xie Q, Han D, et al. Visualizing histopathologic deep learning classification and anomaly detection using nonlinear feature space dimensionality reduction. BMC Bioinformatics. 2018;19:173. PMID:29769044.
- Deng W, Wang Y, Liu Z, et al. HemI: a toolkit for illustrating heatmaps. PLoS One. 2014;9:e111988. PMID:25372567.
- Krzywinski M, Schein J, Birol I, et al. Circos: an information aesthetic for comparative genomics. Genome Res. 2009;19:1639–1645. PMID:19541911.
- Calderone A, Castagnoli L, Cesareni G. mentha: a resource for browsing integrated protein-interaction networks. Nat Methods. 2013;10:690–691. PMID:23900247.
- Chatr-Aryamontri A, Oughtred R, Boucher L, et al. The BioGRID interaction database: 2017 update. Nucleic Acids Res. 2017;45:D369–D79. PMID:27980099.
- Stanley RE, Ragusa MJ, Hurley JH. The beginning of the end: how scaffolds nucleate autophagosome biogenesis. Trends Cell Biol. 2014;24:73–81. PMID:23999079.
- Cheong H, Nair U, Geng J, et al. The Atg1 kinase complex is involved in the regulation of protein recruitment to initiate sequestering vesicle formation for nonspecific autophagy in Saccharomyces cerevisiae. Mol Biol Cell. 2008;19:668–681. PMID:18077553.
- Reggiori F, Tucker KA, Stromhaug PE, et al. The Atg1-Atg13 complex regulates Atg9 and Atg23 retrieval transport from the pre-autophagosomal structure. Dev Cell. 2004;6:79–90. PMID:14723849.
- Tanaka C, Tan LJ, Mochida K, et al. Hrr25 triggers selective autophagy-related pathways by phosphorylating receptor proteins. J Cell Biol. 2014;207:91–105. PMID:25287303.
- Shintani T, Klionsky DJ. Cargo proteins facilitate the formation of transport vesicles in the cytoplasm to vacuole targeting pathway. J Biol Chem. 2004;279:29889–29894. PMID:15138258.
- Stromhaug PE, Reggiori F, Guan J, et al. Atg21 is a phosphoinositide binding protein required for efficient lipidation and localization of Atg8 during uptake of aminopeptidase I by selective autophagy. Mol Biol Cell. 2004;15:3553–3566. PMID:15155809.
- Epple UD, Suriapranata I, Eskelinen EL, et al. Aut5/Cvt17p, a putative lipase essential for disintegration of autophagic bodies inside the vacuole. J Bacteriol. 2001;183:5942–5955. PMID:11566994.
- Yang Z, Huang J, Geng J, et al. Atg22 recycles amino acids to link the degradative and recycling functions of autophagy. Mol Biol Cell. 2006;17:5094–5104. PMID:17021250.
- Xie Y, Kang R, Sun X, et al. Posttranslational modification of autophagy-related proteins in macroautophagy. Autophagy. 2015;11:28–45. PMID:25484070.
- Zhi X, Feng W, Rong Y, et al. Anatomy of autophagy: from the beginning to the end. Cell Mol Life Sci;2017. DOI:10.1007/s00018-017-2657-z. PMID:28939950.
- Torggler R, Papinski D, Kraft C. Assays to monitor autophagy in Saccharomyces cerevisiae. Cells. 2017;6. DOI:10.3390/cells6030023. PMID:28703742.
- Noda T, Matsuura A, Wada Y, et al. Novel system for monitoring autophagy in the yeast Saccharomyces cerevisiae. Biochem Biophys Res Commun. 1995;210:126–132. PMID:7741731.
- Kirisako T, Baba M, Ishihara N, et al. Formation process of autophagosome is traced with Apg8/Aut7p in yeast. J Cell Biol. 1999;147:435–446. PMID:10525546.
- Nakatogawa H, Ichimura Y, Ohsumi Y. Atg8, a ubiquitin-like protein required for autophagosome formation, mediates membrane tethering and hemifusion. Cell. 2007;130:165–178. PMID:17632063.
- Xie Z, Nair U, Klionsky DJ. Atg8 controls phagophore expansion during autophagosome formation. Mol Biol Cell. 2008;19:3290–3298. PMID:18508918.
- Kimura S, Noda T, Yoshimori T. Dissection of the autophagosome maturation process by a novel reporter protein, tandem fluorescent-tagged LC3. Autophagy. 2007;3:452–460. PMID:17534139.
- He K, Zhang X, Ren S, et al. Deep residual learning for image recognition. 2016 IEEE Conference on Computer Vision and Pattern Recognition (CVPR). 2016;770–778. DOI:10.1109/CVPR.2016.90
- Nketia TA, Sailem H, Rohde G, et al. Analysis of live cell images: methods, tools and opportunities. Methods. 2017;115:65–79. PMID:28242295.
- Shoemaker DD, Lashkari DA, Morris D, et al. Quantitative phenotypic analysis of yeast deletion mutants using a highly parallel molecular bar-coding strategy. Nat Genet. 1996;14:450–456. PMID:8944025.
- Journo D, Winter G, Abeliovich H. Monitoring autophagy in yeast using FM 4-64 fluorescence. Methods Enzymol. 2008;451:79–88. PMID:19185715.
- Horvath A, Riezman H. Rapid protein extraction from Saccharomyces cerevisiae. Yeast. 1994;10:1305–1310. PMID: 7900419.