
ABSTRACT
Multiple myeloma (MM) is an incurable plasma cell malignancy with poor survival. Autophagy, a stress-responsive catabolic process mediated by lysosomal activity, plays a crucial role in the pathophysiology of MM. Growing evidence has indicated that dysregulated microRNAs (miRNAs) are associated with the aberrant autophagy in various human cancers. However, to date, few miRNAs have been reported to directly modulate autophagy in the pathobiology of MM. In this study, we investigated the role of MIR145-3p (microRNA 145-3p) in MM, with focus on cellular processes autophagy and cell death. Our results provided evidence that downregulation of MIR145-3p expression was associated with disease progression in human MM. MIR145-3p triggered autophagic flux through direct targeting of HDAC4 (histone deacetylase 4) in MM cells, leading to enhanced apoptosis. Silencing HDAC4 recapitulated the effects of MIR145-3p, whereas enforced expression of HDAC4 abrogated the effects of MIR145-3p. Furthermore, we showed that suppression of HDAC4 by MIR145-3p resulted in upregulation of the pro-apoptotic protein BCL2L11 and caused MTORC1 inactivation, which in turn led to enhanced autophagy and cell death. Importantly, we demonstrated that MIR145-3p mimic could potentiate the anti-MM activity of bortezomib in both in vitro and in vivo experiments. Overall, our findings indicate that MIR145-3p exerted a tumor suppression function in MM by inducing autophagic cell death and suggest that MIR145-3p-based targeted therapy would represent a novel strategy for MM treatment.
Abbreviations: 3-MA: 3-methyladenine; 3ʹ-UTR: 3ʹ-untranslated region; 7-AAD: 7-aminoactinomycin D; ACTB: actin beta; ANXA5: annexin A5; ATG5: autophagy related 5; ATG7: autophagy related 7; B2M: beta-2-microglobulin; BAF: bafilomycin A1; BCL2L11: BCL2 like 11; Bort: bortezomib; CASP3: caspase 3; CCK-8: Cell Counting Kit-8; CQ: chloroquine; Ct: threshold cycle; ctrl: control; DAPI: 4ʹ,6-diamidino-2-phenylindole; GAPDH: glyceraldehyde-3-phosphate dehydrogenase; GFP: green fluorescent protein; HDAC4: histone deacetylase 4; ISS: International Staging System; MAP1LC3B: microtubule associated protein 1 light chain 3 beta; miRNAs: microRNAs; MIR145-3p: microRNA 145-3p; MM: multiple myeloma; mRNA: messenger RNA; MTOR: mechanistic target of rapamycin kinase; MTORC1: mechanistic target of rapamycin kinase complex 1; PCs: plasma cells; PFS: progression-free survival; qRT-PCR: quantitative reverse transcription PCR; RPS6KB1: ribosomal protein S6 kinase B1; SD: standard deviation; siRNA: small interfering RNA; SQSTM1: sequestosome 1; STV: starvation; TUBB: tubulin beta class I.
Introduction
Multiple myeloma (MM), which accounts for nearly 1% of all cancers and for approximately 13% of all hematologic malignancies, is a plasma cell malignancy characterized by clonal proliferation of plasma cells in the bone marrow and typically accompanied by the secretion of monoclonal immunoglobulins that are detectable in the serum or urine [Citation1]. Despite recent and extensive progress in the understanding of the molecular mechanisms of MM pathogenesis and the advent of promising new therapies, MM is still an incurable disease [Citation2]. Therefore, new and better therapeutic strategies for MM treatment are urgently required.
MicroRNAs (miRNAs) are small (18–25 nt), noncoding RNAs that can regulate multiple genes by inhibiting the expression of target genes [Citation3]. Importantly, miRNAs play an essential role in a broad range of biological processes including cell proliferation, differentiation, and death, linking them to numerous diseases including cancer [Citation4]. Recently, increasing evidence has progressively unveiled the miRNAs network in MM pathogenesis, providing potential new tools in clinical interventions in this important disease [Citation5–Citation7]. Although the guide strand of MIR145, MIR145-5p, has been reported to be a tumor suppressor in MM, the function of the passenger strand of MIR145, MIR145-3p, in MM remains unknown [Citation8].
Autophagy is a dynamic process by which unnecessary or dysfunctional cytosolic proteins and organelles are degraded to maintain cell homeostasis. It can be triggered by nutrient starvation, hypoxic stress, and various other stress conditions [Citation9]. Dysfunction of the autophagy pathway has been linked to various human cancers, either enhancing or preventing tumorigenesis [Citation10,Citation11]. Some studies show that autophagy plays an important role in plasma cell ontogeny and in the pathophysiology of multiple myeloma [Citation12,Citation13]. Thus, understanding the molecular mechanisms of autophagy in MM development may contribute to the development of new effective treatment for this disease.
Recently, it has been demonstrated that miRNAs can regulate autophagy by modulating expression of key autophagy-related proteins [Citation14,Citation15]. Importantly, several autophagy-related miRNAs, e.g., MIR30A, MIR101, MIR181A and MIR375, have been reported to increase the sensitivity of tumor cells to chemotherapeutic or molecular-targeted agents by altering autophagic activity [Citation16–Citation19]. To date, few miRNAs have been reported to directly regulate autophagy in the pathobiology of MM.
HDAC4 (histone deacetylase 4) is a key number of class IIa histone deacetylases. Histone deacetylases are important regulators of gene expression, controlling a broad array of physiologic processes, such as differentiation, apoptosis, survival, proliferation, and autophagy, and are involved in the pathogenesis of various cancers [Citation20–Citation22]. Moreover, overexpression of HDAC4 has been observed in several hematologic malignancies, including acute promyelocytic leukemia [Citation23], B cell lymphoma [Citation24], and multiple myeloma [Citation25]. Recently, several miRNAs have been reported to modulate HDAC4 in different cell types [Citation26–Citation28]. The link between MIR145 and HDAC4 in MM pathogenesis has previously not been investigated.
In the present study, we discovered a reverse correlation of MIR145-3p expression levels with MM disease progression. We also found that via direct targeting HDAC4, enforced MIR145-3p expression stimulated MM cell apoptosis, and induced autophagy flux and cell death in MM cells. Further, we demonstrated that MIR145-3p overexpression could potentiate the anti-MM activity of bortezomib in both in vitro cellular models and a murine xenograft model for human MM, thus providing insights into the development of new strategies for MM treatment.
Results
Downregulation of MIR145-3p is associated with disease prognosis in human MM
To evaluate the expression status of MIR145-3p in MM, we first assessed MIR145-3p expression in 5 MM cell lines (U266, NCI-H929, RPMI-8226, LP-1 and KM3) and normal plasma cells (PCs). As shown in , MIR145-3p was significantly downregulated in 4 (U266, NCI-H929, RPMI-8226 and LP-1) out of 5 cell lines as compared to normal PCs. LP-1 cells exhibited the lowest expression among these 4 MM cell lines. We further examined MIR145-3p expression levels in bone marrow samples of 30 newly diagnosed MM patients and 18 healthy donors. The clinical characteristics of 30 newly diagnosed MM patients were showed in and . Consistently, we found that the expression levels of MIR145-3p were markedly lower in MM primary samples than those in healthy donors ().
Table 1. Clinical features of 30 newly diagnosed MM patients.
Table 2. Clinical and pathological characteristics of 30 newly diagnosed MM patients.
Figure 1. MIR145-3p downregulation is associated with disease prognosis in human MM. (A) MIR145-3p expression in five MM cell lines (U266, NCI-H929, RPMI-8226, LP-1 and KM3) and normal plasma cells (PCs). MIR145-3p expression levels were calculated by the MIR145-3p:RNU6 expression ratio (i.e., 2−ΔCt). (B) Comparison of MIR145-3p expression in SDC1/CD138+ plasma cells from 30 newly diagnosis MM patients and 18 normal healthy donors via qRT-PCR. (C-F) Expression patterns of MIR145-3p with albumin (C), B2M (beta-2-microglobulin) (B), creatinine (E), and calcium (F) (all *P < 0.05; **P < 0.01). (G) Survival analysis of MM patients with low MIR145-3p expression using Kaplan-Meier curves. Low expression level of MIR145-3p was associated with shorter progression-free survival (PFS) (P < 0.05). The mean value was used as the cut-off point for definition of low and high MIR145-3p expression groups.
Next, to explore the clinical and pathological role of MIR145-3p in MM, we analyzed the correlation of MIR145-3p expression levels with clinical parameters. As shown in , low MIR145-3p expression levels positively correlated with levels of albumin (), whereas negatively correlated with levels of B2M (beta-2- microglobulin) (), creatinine () and calcium (), respectively, which are all hallmarks of tumor mass and disease activity in myeloma. Furthermore, Kaplan-Meier survival analysis also showed that patients with low MIR145-3p expression had obviously shorter progression-free survival (PFS) (21.0 months vs. 16.0 months, P < 0.05, ). Collectively, these findings indicate that MIR145-3p was indeed downregulated in MM and mainly associated with disease progression.
Enforced expression of MIR145-3p inhibits cell proliferation and promotes apoptosis in MM cells
To define the effect of MIR145-3p on proliferation of MM cells, we transfected LP-1 cells with a synthetic hsa-MIR145-3p mimic or a negative miRNA control (MIR control/MIRctrl), and then measured cell proliferation using Cell Counting Kit-8 (CCK-8) at 24, 48, 72 and 96 h after transfection. The transfection efficiency was confirmed by qRT-PCR (quantitative reverse transcription PCR) 48 h after transfection (), detecting MIR145-3p expression. As shown in , cell growth was significantly decreased in a time-dependent manner in MIR145-3p-transfected LP-1 cells, compared with MIR control transfection, indicating that overexpression of MIR145-3p suppressed the proliferation of MM cells.
Figure 2. MIR145-3p inhibits cell proliferation and promotes apoptosis in MM cells. (A) Relative expression of MIR145-3p detected by qRT-PCR in LP-1 cells 48 h after transfection with MIR145-3p mimic or MIR control (MIRctrl). (B) LP-1 cells were transfected with MIRctrl or MIR145-3p mimic for 24–96 h. Cell growth was measured by CCK-8 assay. (C) After transfection with MIRctrl or MIR145-3p for 72 h, MM cell apoptosis was determined by ANXA5 and 7-AAD staining. (D) After transfection with MIR ctrl or MIR145-3p for 72 h, LP-1 cells were lysed and extracted. Western blotting was performed to detect the expression levels of the active cleaved CASP3. TUBB was used as the loading control. All the data were presented as mean ± SD from 3 independent experiments (*P < 0.05; **P < 0.01) .
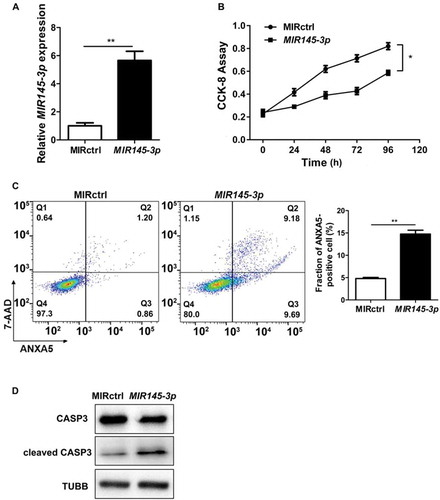
Moreover, we examined whether apoptotic events occurred in cells transfected with synthetic MIR145-3p by ANXA5 (annexin A5)-7-AAD (7-aminoactinomycin D) assay. As shown in , ectopic expression of MIR145-3p led to increased apoptosis in LP-1 cells. Simultaneously, the MIR145-3p-induced apoptotic events were associated with activation cleavage of CASP3 (caspase 3) (). These data reveal that enforced expression of MIR145-3p inhibited cell growth and promoted apoptosis in MM cells.
MIR145-3p induces autophagic flux in MM cells
Subsequently, we examined whether MIR145-3p could induce autophagy in myeloma cells. For this purpose, we performed immunofluorescence analysis to check GFP (green fluorescent protein)-MAP1LC3B (microtubule associated protein 1 light chain 3 beta) puncta formation, which reflects conversion of MAP1LC3B-I to phosphatidyl-ethanolamine conjugated MAP1LC3B-II and the assembly of autophagy-specific intracellular vesicles, autophagosomes. As shown in , under basal conditions, overexpression of MIR145-3p in LP-1 cells induced a significant increase formation of GFP-MAP1LC3B puncta, suggesting enhanced autophagy in these cells.
Figure 3. MIR145-3p induces autophagic flux in MM cells. (A) LP-1 cells expressing GFP-MAP1LC3B were transfected with MIR control (MIRctrl) or MIR145-3p and were treated with or without lysosomal inhibitor bafilomycin A1 (BAF) (20 nM) for 4 h. Then cells were visualized with a fluorescence microscope. Representative images are shown. (B) Quantitative analysis of the experiments in (A) (mean ± SD of independent experiments, n = 3, **P < 0.01.). (C) LP-1 cells were transfected with MIRctrl or MIR145-3p mimic, and then incubated with normal or starvation (STV) medium Earle’s balanced salt solution (EBSS) as indicated for 2 h, in the absence or presence of 20 nM BAF. Whole-cell extracts were subjected to immunoblotting with anti-MAP1LC3B and SQSTM1 antibodies. GAPDH was used as loading control. The experiments were performed in triplicate. (D) KM3 cells expressing GFP-MAP1LC3B were transfected with MIRctrl or MIR145-3p inhibitor and were treated with or without BAF (20 nM) for 4 h. Then cells were visualized with a fluorescence microscope. Representative images are shown. (E) Quantitative analysis of the experiments in (D) (mean ± SD of independent experiments, n = 3, **P < 0.01.). (F) KM3 cells were transfected with MIRctrl or MIR145-3p inhibitor, and then incubated with normal or STV as indicated for 2 h, in the absence or presence of 20 nM BAF. Whole-cell extracts were subjected to immunoblotting with anti-MAP1LC3B and SQSTM1 antibodies. GAPDH was used as loading control. The experiments were performed in triplicate. (G and H) LP-1 cells were transfected with MIRctrl or MIR145-3p, and then treated with the autophagy inhibitors 3-MA (50 mmol/L) or CQ (50 nmol/L). Cells were lysed and extracted. Western blotting was performed to detect the expression levels of MAP1LC3B and SQSTM1. GAPDH was used as loading control. The experiments were performed in triplicate. (I and J) Western blot showing the effect of silencing ATG5 and ATG7, whole-cell extracts were subjected to immunoblotting with anti-ATG5 and ATG7 antibodies. ACTB (actin beta) was used as loading control. The experiments were performed in triplicate. (K and L) LP-1 cells were transfected with MIRctrl or MIR145-3p first, and then transfected with siRNA-ATG5 or siRNA-ATG7. Cells were lysed and extracted. Western blotting was performed to detect the expression levels of ATG5, ATG7, MAP1LC3B and SQSTM1, respectively. GAPDH was used as loading control. The experiments were performed in triplicate. (M) LP-1 cells were transfected with MIRctrl or MIR145-3p first, and then treated with 3-MA (50 mmol/L) and CQ (50 nmol/L) or transfected with siRNA-ATG5 and siRNA-ATG7. Cells were analyzed by flow cytometry after ANXA5-7-AAD staining. The percentage of ANXA5-positive cells was presented as mean ± SD from 3 independent experiments (*P < 0.05; **P < 0.01) .
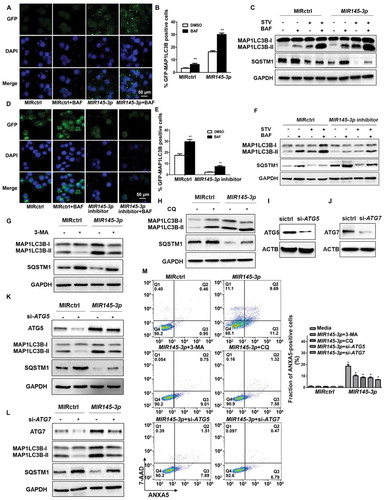
We then performed western blot to analyze MAP1LC3B conversion and the degradation of SQSTM1 (sequestosome 1), an autophagy cargo receptor protein [Citation29]. As shown in , MIR145-3p overexpression caused a dramatic increase in the conversion of MAP1LC3B-I to MAP1LC3B-II and the clearance of SQSTM1 under both basal and starvation conditions.
Next, to verify whether the observed high levels of autophagic markers were due to increased autophagic flux, we treated MIR145-3p-transfected cells with the lysosomal V0-ATPase inhibitor bafilomycin A1 (BAF), a late-phase autophagy inhibitor that prevents autophagosome-lysosome fusion and MAP1LC3B-II degradation [Citation30]. We found that in the presence of BAF, MIR145-3p induced MAP1LC3B-II accumulation was enhanced, whereas MIR145-3p induced SQSTM1 reduction was repressed ().
To further confirm the pro-autophagic role of MIR145-3p, we inhibited the expression of endogenous MIR145-3p and repeated the above validation assays in KM-3 cells, which expressed a high level of endogenous MIR145-3p (), to examine knockdown or suppression of MIR145-3p would see the opposite effect. The GFP-MAP1LC3B puncta-formation assay showed that inhibition of MIR145-3p using synthetic MIR145-3p inhibitor significantly suppressed MAP1LC3B puncta formation under basal conditions (). Also, the results of western blot analysis clearly indicated that MIR145-3p knockdown reduced MAP1LC3B conversation and SQSTM1 degradation in both basal and starvation conditions, with respect to the control (). Moreover, after BAF treatment, the autophagy inhibitor-induced increase of MAP1LC3B-II accumulation was relatively less upon MIR145-3p inhibition (). Altogether, our data indicate that MIR145-3p induced autophagic flux in MM cells.
Last, to assess the role of autophagy in MIR145-3p-induced cell death, we examined the effect of the autophagy inhibitors 3-methyladenine (3-MA) and chloroquine (CQ) in MM cells. Genetic inhibition of autophagy by silencing the essential autophagy genes ATG5 (autophagy related 5) and ATG7 (autophagy related 7) was also used to demonstrate the requirement of autophagy in the MIR145-3p-induced cell death. As shown in , either treatment with autophagic inhibitors 3-MA and CQ, or knockdown of ATG5 and ATG7 by small interfering RNAs (siRNAs) significantly blocked autophagy in MIR145-3p-treated cells. Moreover, as shown in , the cell death induced by MIR145-3p overexpression could be inhibited by autophagy inhibitors, such as 3-MA and CQ, or by silencing ATG5 and ATG7, supported by the dramatic decrease in the ANXA5-positive cell fraction in MM cells. Thus, these results suggest that autophagy was the major mechanism of MIR145-3p induced cell death in MM cells.
MIR145-3p directly targets HDAC4 in MM cells
To identify the potential downstream targets of MIR145-3p, we performed a bioinformatics analysis using five miRNA databases (miRanda, TargetScan, Picta, RNAhybrid, and miRBase). HDAC4, which affects diverse cellular fates including autophagy and is shown to be involved in multiple myeloma autophagic process recently [Citation31], was predicted as a target of MIR145-3p by all five databases. The predicated interaction between MIR145-3p and the HDAC4 3ʹ-untranslated region (3ʹ-UTR) was shown in . To verify this putative target, we performed a dual-luciferase reporter assay in 293T cells. As shown in , MIR145-3p obviously inhibited the luciferase reporter activity of the wild type but not the mutant HDAC4 3ʹ-UTR, indicating that HDAC4 was a direct target of MIR145-3p.
Figure 4. MIR145-3p directly targets HDAC4 in MM cells. (A) Schematic representation of the binding between MIR145-3p and HDAC4 with mutant sites labeled with red shading. (B) Relative luciferase activities were analyzed in 293T cells co-transfected with HDAC4 3ʹ-UTR (wild type or mutant) reporter plasmid, and MIR145-3p mimic or MIR control (MIRctrl). Data were calculated by Student t test. (C) Expression patterns of HDAC4 with MIR145-3p in MM primary samples. (D) qRT-PCR analysis of HDAC4 mRNA expression in LP-1 cells transfected with MIR145-3p mimic or MIRctrl. The relative expression of MIR145-3p was calculated by the MIR145-3p:RNU6 ration. All data were presented as mean ± SD (*P < 0.05; **P < 0.01). (E) Western blot analysis of HDAC4 protein expression in LP-1 cells transfected with MIR145-3p mimic at increasing concentrations or MIRctrl. GAPDH was used as loading control. The experiments were in performed in triplicate.
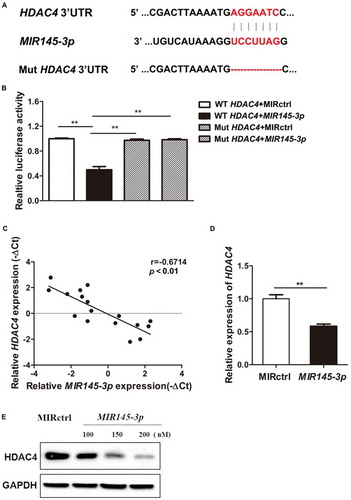
To further validate whether the expression of HDAC4 is downregulated by MIR145-3p, HDAC4 expression levels in SDC1/CD138+ plasma cells from MM patients were determined by quantitative PCR. Combined with the data presented in , the results indicated that HDAC4 expression levels were inversely associated with MIR145-3p expression in MM primary samples (). Subsequently, qRT-PCR and immunoblotting analysis showed that overexpression of MIR145-3p significantly reduced the expression of HDAC4 at both messenger RNA (mRNA) and protein levels in myeloma cells (). These results demonstrate that HDAC4 was indeed a direct functional target of MIR145-3p in MM cells.
MIR145-3p induces autophagy and cell death through the inhibition of HDAC4 in MM cells
What is the functional consequence of HDAC4 downregulation by MIR145-3p? To address this question, we first examined whether silencing of HDAC4 by siRNA could mimic the phenotypic changes caused by MIR145-3p overexpression in MM cells, including inhibition of cell survival, induction of apoptosis, and activation of autophagy. LP-1 cells transfected with siRNA-HDAC4, siRNA control, or MIR145-3p mimic were subjected to flow cytometry analysis to measure apoptosis. As shown in , HDAC4 siRNA significantly increased the fraction of ANXA5-positive cells, similar to MIR145-3p mimic treatment. Consistently, silencing of HDAC4 in MM cells induced CASP3 activation, as indicated by the accumulation of the cleaved form of CASP3, same as those observed in response to MIR145-3p overexpression ().
Figure 5. MIR145-3p induces autophagy and cell death through the inhibition of HDAC4 in MM cell. (A) LP-1 cells were transfected with MIR145-3p mimic, MIR control (MIRctrl), siRNA-HDAC4 or control siRNA (sictrl) for 72 h, and then cell apoptosis was analyzed by ANXA5 and 7-AAD staining. The percentage of ANXA5-positive cells was presented as mean ± SD from 3 independent experiments (*P < 0.05; **P < 0.01, NS, not significant). (B) After transfection with MIR145-3p mimic, MIRctrl, siRNA-HDAC4 or sictrl for 72 h, LP-1 cells were lysed and extracted. Western blotting was performed to detect the expression levels of the active cleaved CASP3 and BCL2L11. GAPDH was used as loading control. The experiments were performed in triplicate. (C) LP-1 cells expressing GFP-MAP1LC3B were transfected with siRNA-HDAC4 or sictrl and were treated with or without lysosomal inhibitor BAF (20 nM) for 4 h. Then cells were visualized with a fluorescence microscope. Representative images are shown. (D) Quantitative analysis of the experiments in (C) (mean ± SD of independent experiments, n = 3, **P < 0.01.). (E) LP-1 cells were transfected with MIR145-3p mimic, MIRctrl, siRNA-HDAC4 or sictrl for 72 h, in the absence or presence of 20 nM BAF, and then the protein levels of HDAC4, MAP1LC3B-I, MAP1LC3B-II, SQSTM1, RPS6KB1 and p-RPS6KB1 (Thr389) were determined by western blot analysis. GAPDH was used as loading control. The experiments were performed in triplicate. (F) LP-1 cells expressing GFP-MAP1LC3B were co-transfected with pcDNA-control (pcDNActrl) or pcDNA-HDAC4 vector and MIR145-3p mimic or MIRctrl and were treated with or without BAF (20 nM) for 4 h. Then cells were visualized with a fluorescence microscope. Representative images are shown. (G) Quantitative analysis of the experiments in (F) (mean ± SD of independent experiments, n = 3, **P < 0.01.). (H) LP-1 cells were co-transfected with either pcDNA-control (pcDNActrl) or pcDNA-HDAC4 vector and MIR145-3p mimic or MIRctrl for 72 h, in the absence or presence of 20 nM BAF, and then the protein levels of HDAC4, MAP1LC3B-I, MAP1LC3B-II, SQSTM1, RPS6KB1 and p-RPS6KB1 (Thr389) were determined by western blot analysis. GAPDH was used as loading control. The experiments were performed triplicate. (I) LP-1 cells were co-transfected with pcDNActrl or pcDNA-HDAC4 vector and MIR145-3p mimic or MIRctrl for 72 h, and then cell apoptosis was analyzed by ANXA5-7-AAD staining. The percentage of ANXA5-positive cells was presented as mean ± SD from 3 independent experiments (*P < 0.05; **P < 0.01) .
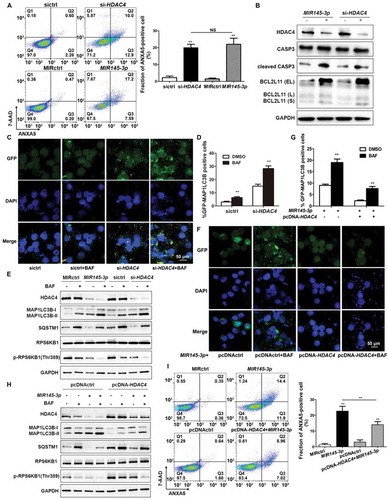
Previous work has demonstrated that HDAC4 regulation of BCL2L11 (BCL2 like 11), a key pro-apoptotic gene, is essential for MM cell survival. High expression levels of BCL2L11 are associated with the inhibition of HDAC proteins [Citation32]. For this reason, we analyzed BCL2L11 expression upon transfection of LP-1 cells with siRNA-HDAC4 or MIR145-3p mimic. As expected, either HDAC4 silencing or MIR145-3p overexpression significantly reduced HDAC4 protein levels, and consequently increased the levels BCL2L11 protein, indicating that the MIR145-3p-induced apoptotic events were associated with upregulation of BCL2L11 ().
Next, we monitored the autophagic flux and autophagosome formation after HDAC4 silencing by measuring MAP1LC3B-positive puncta in immunofluorescence analysis. As shown in , similar to MIR145-3p, knockdown of HDAC4 strongly increased MAP1LC3B puncta structure formation in LP-1 cells, after BAF treatment. Consistent with the confocal analysis findings, silencing of HDAC4 led to marked increase in the MAP1LC3B-II:MAP1LC3B-I ratio and SQSTM1 degradation compared with control cells on BAF treatment ().
The serine/threonine kinase MTOR (mechanistic target of rapamycin kinase) is one of the key molecules in the autophagic pathway. It has been reported that MTOR activity can be suppressed by HDAC inhibitors [Citation33–Citation35]. Thus, the second step was to analyze the MTOR kinase activity after HDAC4 silencing or MIR145-3p overexpression by measuring the phosphorylation status of a well-known MTOR target protein, RPS6KB1 (ribosomal protein S6 kinase B1) in western blot analysis. As shown in , in the presence of BAF, either knockdown of HDAC4 or MIR145-3p mimic transfection significantly inhibited the MTOR kinase activity in MM cells, supported by decreased levels of phospho-RPS6KB1 Thr389 (p-RPS6KB1), suggesting that MIR145-3p-induced activation of autophagy was dependent on MTORC1 inactivation.
To further confirm that MIR145-3p was acting on autophagy by repression of HDAC4 in MM cells, we investigated whether ectopic expression of HDAC4 could rescue the autophagy-stimulating effect of MIR145-3p. Of the greatest importance, the forced expression of HDAC4 significantly counteracted the autophagic flux induced by MIR145-3p, as monitored by GFP-MAP1LC3B puncta, MAP1LC3B conversion and SQSTM1 degradation in autophagic flux assays (). Simultaneously, overexpression of HDAC4 rescued the downregulation of phospho-RPS6KB1 in the given conditions (), indicating that HDAC4 overexpression rescued MIR145-3p-induced autophagy activation and MTORC1 inhibition. Moreover, upregulating HDAC4 also significantly counteracted cell death triggered by MIR145-3p mimic (). Taken together, these results suggest that MIR145-3p induced autophagy and cell death in MM cells by the HDAC4 signaling pathway.
MIR145-3p mimic enhances the anti-mm activity of bortezomib through autophagy activation
Bortezomib, a proteasome inhibitor, is commonly used in the systematic treatment of MM. To evaluate whether MIR145-3p could affect the anti-multiple myeloma activity of bortezomib, we transfected LP-1 cells with a MIR145-3p or a negative control miRNA followed by bortezomib treatment, and then measured bortezomib-induced cell death by ANXA5-positive staining. As shown in , a substantial increase of cell death was observed in LP-1 cells treated with MIR145-3p mimic plus bortezomib, as compared with each single agent alone. Moreover, similar effects were also observed in combined HDAC4 silencing-bortezomib treatments (), indicating that MIR145-3p could potentiate the efficacy of bortezomib in MM cells via HDAC4 inhibition.
Figure 6. MIR145-3p mimic enhances the anti-MM activity of bortezomib through autophagy activation. (A) LP-1 cells were transfected with MIR145-3p or MIR control (MIRctrl) for 72 h, and then treated with 20 nM bortezomib (Bort) or vehicle for 24 h. Cell death was measured by ANXA5-7-AAD staining. The percentage of ANXA5-positive cells was presented as mean ± SD from 3 independent experiments. (B) LP-1 cells were transfected with siRNA-HDAC4 or negative siRNA control (sictrl) for 72 h, and then treated with 20 nM Bort or vehicle for 24 h. Cell death was measured by ANXA5-7-AAD staining. The percentage of ANXA5-positive cells was presented as mean ± SD from 3 independent experiments (all *P < 0.05; **P < 0.01). (C) LP-1 cells were transfected with MIR145-3p mimic, MIRctrl, siRNA-HDAC4 or sictrl for 72 h, and then treated with 20 nM Bort or vehicle for 24 h. MAP1LC3B and SQSTM1 protein levels were determined by western blotting. GAPDH was used as loading control. The experiments were performed in triplicate. (D) LP-1 cells were transfected with MIR145-3p mimic or MIRctrl for 72 h, in the presence or absence of 20 nM Bort, followed with or without BAF (20 nM) treatment for 4 h. MAP1LC3B and SQSTM1 protein levels were determined by western blotting. GAPDH was used as loading control. The experiments were performed in triplicate.
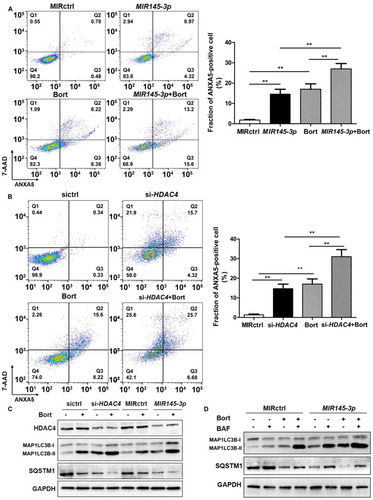
As MIR145-3p could induce autophagic flux in MM cells, we further investigated the effects of MIR145-3p plus bortezomib on the modulation of autophagy. By western blotting analysis, we observed that the combination of MIR145-3p mimic with bortezomib could synergistically lead to a greater increase in MAP1LC3B-II as well as SQSTM1 degradation, as compared to each single agent alone (). Next, to verify that MIR145-3p enhances bortezomib sensitivity by inducing autophagy, we treated MIR145-3p-transfected LP-1 cells with BAF, a late-stage autophagy inhibitor, in the absence or presence of bortezomib. As expected, after lysosome inhibition, the formation of autophagosome induced by combined MIR145-3p-bortezomib treatments was further increased as compared with single-agent treatments (), confirming the excessive activation of autophagy triggered by MIR145-3p mimic-bortezomib combination. Collectively, the above data indicate that MIR145-3p mimics could potentiate the anti-MM activity of bortezomib by excessive autophagy activation.
In vivo delivery of formulated agoMIR145-3p potentiates the inhibitory effect of bortezomib on MM progression
Finally, we examined the anti-tumor efficacy of formulated agoMIR145-3p in combination with bortezomib using the mouse subcutaneous xenograft model of MM. Xenografted mice were randomized to receive 4 different treatments when palpable tumors became detectable. As shown in , intra-tumoral treatment with agoMIR145-3p significantly inhibited tumor growth from day 21 to day 35. During the treatment period, combining intra-tumor injection of agoMIR145-3p with intraperitoneally administered bortezomib obviously caused greater reduction in tumor growth than each single-agent treatment. At day 35, tumor size and tumor weigh were markedly decreased after treatment with agoMIR145-3p or bortezomib, compared with control (). Notably, the volumes of tumors were much lower in the group treated with bortezomib in combination with formulated agoMIR145-3p.
Figure 7. In vivo delivery of formulated agoMIR145-3ppotentiates the inhibitory effect of bortezomib on MM progression. For in vivo study, palpable subcutaneous tumors xenografts were randomized in 4 groups of treatment. Intratumoral treatment with agoMIR145-3p or agoMIR control (agoMIRctrl) was administered every three days, for a total of seven injections. Intraperitoneal treatment with bortezomib (Bort) was administered twice weekly, for a total of six injections. Combination treatment of agoMIR145-3p and Bort was given with the above described schedules. (A) Tumors were measured with an electronic caliper once a week (five mice for each group). Averaged tumor volume of each group mean ± SD shown (**P < 0.01). (B) The excised tumor from all the mice in each group. The mice were euthanized 35 days after inoculation. Tumors were removed and photographed. (C) Measurement of tumor weight was also made 35 days after inoculation. Data were presented as the mean ± SD from five mice of each group (*P < 0.05; **P < 0.01). (D) Immunohistochemical analysis of cleaved CASP3 and MAP1LC3B on tumor tissue sections from agoMIRctrl-, agoMIR145-3p-, Bort-, or combination-treated mice. Photographs were representative of 3 mice receiving each treatment. The magnifications are 40 × .
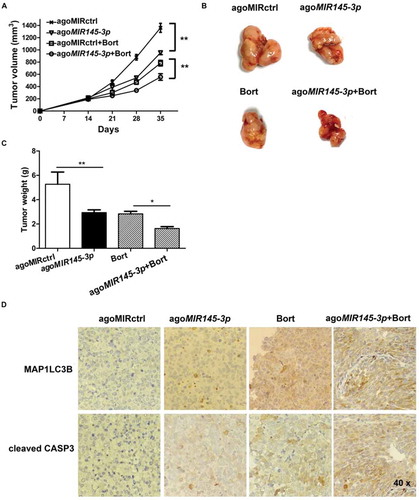
We also evaluated the effect of this combination treatment in vivo by the cleaved form of CASP3 and MAP1LC3B staining of human MM xenografts harvested from treated mice. As shown in , combination therapy significantly increased the number of cleaved CASP3 positive MM cells as compared with single-agent treatments. A significant increase in MAP1LC3B expression was also noted in tumor sections from combination-treated mice as compared with mice receiving treatment with either bortezomib or agoMIR145-3p alone. Overall, these results recapitulate the in vitro observations and suggest that formulated agoMIR145-3p could enhance in vivo anti-multiple myeloma activity of bortezomib by apoptosis induction and autophagy activation.
Discussion
In this study, we investigated the role of MIR145-3p in multiple myeloma cells and its underlying molecular mechanisms, with focus on cellular processes autophagy and cell death. We found that decreased expression of MIR145-3p was associated with disease progression in human MM (). Furthermore, we demonstrated that the enforced expression of MIR145-3p in MM cell lines inhibited proliferation and triggered apoptosis (). Importantly, we showed for the first time that MIR145-3p induced autophagic flux and cell death in MM cells and that these effects were mediated by the HDAC4 signaling pathway ( and ). Suppression of HDAC4 expression by MIR145-3p impacted MM cell death via at least two mechanisms. First, HDAC4 downregulation resulted in upregulation of BCL2L11, a pro-apoptotic BCL2 family member. Second, HDAC4 downregulation caused MTORC1 inactivation, which in turn led to autophagy activation (). We provided evidence to show that under this specific context, autophagy could promote MM cell death, a reminiscent of the term ‘autophagic cell death’.
Myeloma cells sustain life through a specific level of autophagy [Citation36]. In some cases, uncontrolled autophagy can reduce cell viability. When autophagy exceeds a certain level, too many organelles can be cleared, leading to autophagic death [Citation37]. Iron chelators show marked antiproliferative activity toward myeloma cell lines [Citation38]. Clioquinol is also found to trigger pro-death autophagy in leukemia and myeloma cells by disrupting the MTOR signaling pathway [Citation39]. Moreover, the HDAC inhibitor, suberoylanilide hydroxamic acid (SAHA), is found to induce autophagic cell death [Citation40]. Hence, it is tempting to speculate that enforced MIR145-3p expression might push protective autophagy towards exerted cytotoxic autophagy, which dependent on the inhibition of HDAC4. Furthermore, consistently with previous findings showing that autophagic cell death is mainly a morphologic definition (i.e., cell death associated with autophagosomes/autolysosomes) [Citation41], we found that the nonapoptotic form of cell death induced by MIR145-3p overexpression could be inhibited by suppressing autophagosome formation with autophagy inhibitors, such as 3-MA and CQ, or by silencing ATG5 and ATG7 ().
Our finding has significant clinical relevance. Proteasomal inhibitor bortezomib is commonly used for the treatment of MM patients. However, with an increase in clinical use of bortezomib overtime, some patients develop resistance and experience relapse, ultimately reducing the efficacy of bortezomib [Citation42]. Therefore, the search for approaches to increase drug sensitivity or prevent the development of resistance has become an important research topic [Citation43]. In this study, we established a role of MIR145-3p in the response of MM cells to bortezomib. In vitro, MIR145-3p mimic was able to increase bortezomib-induced cytotoxicity on MM cells (). In vivo, MIR145-3p-bortezomib combined treatment gave rise to a more superior anti-tumor effect in a mouse subcutaneous xenograft model of MM compared to either treatment alone (). Mechanistically, combined MIR145-3p-bortezomib treatment caused an autophagy enhancement in MM cells at a greater extent as compared with single-agent treatment in both the in vitro and in vivo experiments, indicating that the higher cellular stress produced by MIR145-3p-bortezomib combination might lead to excessive activation of autophagy and subsequently, more potent cell death.
In conclusion, our investigation elucidates that MIR145-3p possessed tumor suppressive activity, this microRNA functions by targeting HDAC4 mRNA, thus enhancing MM cell autophagy and death. Our finding that enforced expression of synthetic MIR145-3p could potentiate in vitro and in vivo anti-MM activity of bortezomib, by targeting HDAC4, provided biological rationale for the use of synthetic MIR145-3p mimic, in combination with bortezomib, as a novel therapeutic strategy for the treatment of multiple myeloma.
Materials and methods
Patients and samples
Following informed consent and the approval of Institutional Research Ethics Committee at Changzheng Hospital (Shanghai, China), bone marrow samples were obtained from 30 newly diagnosed MM patients, including 12 IgG type, 11 IgA type, 4 IgD type and 3 light chain type, enrolled in Changzheng Hospital from January 2013 to December 2014. According to International Staging System (ISS) [Citation44], 3 patients were stage І, 13 patients stage II, and the remaining 14 patients stage Ⅲ. The patients’ demographic and clinical characteristics are summarized in and . All the patients were followed up for 3 years. The normal bone marrow samples from 18 healthy donors were collected as controls. Plasma cells from MM patients and normal controls were purified from bone marrow aspirates by antibody-mediated positive selection using anti-SDC1/CD138 magnetic-activated cell separation microbeads (Miltenyi Biotec, 130–051-301). Plasma cell purity was tested to be 98% (> 90%). Peripheral blood serum samples from MM patients were collected by centrifugation at 1917 x g for 15 min at 20°C. Samples were frozen as 0.5-ml aliquots, stored at −80°C and thawed only once.
Cell lines and cell culture
Human MM cell lines U266, NCI-H929, and RPMI-8226 were obtained from the American Type Culture Collection (TIB196TM, CRL-9068TM, CRM-CCL-155TM). LP-1 and KM3 cells were kindly provided by Dr. Jian Hou (Second Military Medical University, Shanghai, China). All MM cell lines and normal plasma cells from healthy donors were cultured in RPMI 1640 medium (Gibco, 11,875–093) supplemented with 10% heat-inactivated fetal bovine serum (FBS) (Gibco, 10,100,154), 100 U/mL of penicillin (Thermo Fisher Scientific, 15,140,122), and 100 μg/mL of streptomycin (Thermo Fisher Scientific, 15,140,122) at 37°C in humidified air containing 5% carbon dioxide.
RNA isolation and qRT-PCR analysis
The total RNA, including miRNA, was extracted from MM cells by Trizol (Invitrogen Corporation, 15,596–018) according to the manufacturer’s instructions. PrimeScript™ RT Reagent Kit (Perfect Real Time, TAKARA, RR037A) and SYBR Premix EX TaqTM (TAKARA, RR420A) were used to detect and quantify MIR145-3p, and RNU6/U6 was used as an internal control. For mRNA dosage studies, first strand cDNA was obtained using PrimeScript™ RT Master Mix (Perfect Real Time, TAKARA, RR037A) and quantitative PCR was performed to detect HDAC4 levels by using SYBR Premix EX TaqTM (TAKARA, RR420A). GAPDH (glyceraldehyde-3-phosphate dehydrogenase) served as an internal control. Relative expression was calculated using the comparative threshold cycle (Ct) method [Citation45]. Experiments were carried out in triplicate. A complete list of primers used was shown in .
Table 3. PCR primers used in this work.
Reagents and antibodies
The antibodies to CASP3 (9665), cleaved CASP3 (9664), MAP1LC3B (4108), SQSTM1 (5114), ATG5 (12,994), ATG7 (8558), HDAC4 (15,164), BCL2L11 (2933), RPS6KB1 (2708) and p-RPS6KB1 (Thr389; 9234) were obtained from Cell Signaling Technology. The antibodies to TUBB (sc-10,731), ACTB (sc-47,778) and GAPDH (sc-47,724) were purchased from Santa Cruz Biotechnology. Other reagents used included bafilomycin A1 (Sigma-Aldrich, B1793), 3-methyladenine (Sigma-Aldrich, M9281), chloroquine (Invivogen, P36239), and bortezomib (Selleck, S1013).
Transfection
The has-MIR145-3p miRNA mimics (miR10004601-1–5), inhibitor (miR20004601-1–5), and negative controls (miR01201-1–5 for mimic and miR02201-1–5 for inhibitor) were purchased from Ribobio. Silencer siRNAs for ATG5 (stQ0003079-1), ATG7 (stQ0005319-1), HDAC4 (stQ0001595-1), and control siRNA (siN05815122147-1–5) were synthesized by Ribobio. The nucleotide sequences of siRNAs were as follows, ATG5: 5ʹ-GCUCUUCCUUGGAACAUCA-3ʹ, ATG7: 5ʹ-GUGUCUAUGAUCCCUGUAA-3ʹ, HDAC4: 5ʹ-GGTTTATTCTGATTGAGAATT-3ʹ.
The full-length human HDAC4 (NM_006037.3) cDNA was cloned into the pcDNA3.1 plasmid (Invitrogen, V79020) and verified by sequencing. MM cells were cultured in 6-well plates at a concentration of 2 x 10⁵/well. These miRNAs, siRNAs, and pcDNA were transfected into cells by Lipofectamine RNAiMAX or Lipofectamine™ 3000 reagent (Invitrogen, 13,778–150) according to the manufacturer’s instructions. Total RNA and protein were prepared from the cells 48 h or 72 h after transfection and stored at −80°C for subsequent analysis.
Analysis of cell viability and apoptosis
The cell viability was assayed using a Cell Counting Kit-8 (CCK-8) (Dojindo, CK04). Briefly, MIR control or MIR145-3p-transfected MM cells were seeded in triplicate in 96-well plates and incubated for 24, 48, 72 and 96 h at 37°C. After the desired treatment, cell viability was evaluated by CCK-8 assay according to the manufacturer’s instructions.
Cell apoptosis was assessed by ANXA5-7-AAD flow cytometry assay. MM cells were transfected with the miRNA mimics, miRNA inhibitor, specific siRNAs, or pcDNA followed by bortezomib treatment as indicated. ANXA5 and 7-AAD double-staining were performed using the Annexin V Apoptosis Detection Kit FITC and 7-AAD Viability Staining Solution (eBioscience™, Thermo Fisher Scientific, 88–8005-72, and 00–6993-50) according to the manufacturer’s instructions. The cells were measured using an FC 500 ML flow cytometer (Beckman Coulter, Brea, CA, USA) and analyzed with FlowJo software.
Luciferase reporter assay
The 3ʹUTR-HDAC4 luciferase reporter constructs containing the wild-type and mutant binding sites of MIR145-3p were amplified using PCR method. The PCR products were cloned into the pMiR-Report luciferase vector (Ambion, AM5795), immediately downstream of the luciferase gene. All the constructs containing 3ʹUTR inserts were sequenced and verified. Cells cotransfected with reporter constructs, the miRNA mimic and the β-gal plasmid were harvested 48 h after the transfection and lysed with reporter lysis buffer (Promega, E397A). The luciferase activities in the cellular extracts were determined using the Dual-Luciferase reporter assay system (Promega, E1910) according to the manufacturer’s instructions. Data were represented as the fold induction after normalizing the luciferase activity of the tested sample to that of the corresponding control sample.
Western blotting
Cells were harvested and subjected to lysis in radioimmunoprecipitation assay buffer (Beyotime, P0013) containing phosphatase inhibitor cocktail (Beyotime, P1081). Protein concentration was determined by a bicinchoninic acid kit (Pierce, 23,225). Protein extracts were then separated by electrophoresis in 10–12% polyacrylamide gels and were transferred to polyvinylidene difluoride membranes (Millipore Sigma, IPVH00010). After blocking in 5% bovine serum albumin (Sangon Biotech, C508113), the membranes were incubated with the indicated primary antibodies at 4°C overnight, following by the corresponding horseradish peroxidase-conjugated secondary antibodies (Cell Signaling Technology, 7074 and 7076). Signals were detected using chemiluminescent ECL reagent (Thermo Scientific, 34,096).
Analysis of autophagy
Autophagy was explored by western blot analysis of MAP1LC3B-I, MAP1LC3B-II, SQSTM1, and by GFP-MAP1LC3B analysis, in the presence or absence of autophagy inhibitors such as 3-MA, BAF, CQ, or RNAi-mediated silencing of key ATGs (si-ATG5 and si-ATG7) as previously described [Citation46]. For GFP-LC3 analysis, a LP-1 or KM3 GFP-MAP1LC3B stable cell line was established by transient transfection of the Stub-RFP-Sens-GFP-MAP1LC3B lentiviral vector (GENECHEM, GVAP01689345). Then LP-1 or KM3 GFP-MAP1LC3B stable cells were transfected with individual miRNAs, siRNAs, or pcDNA, in the presence or absence of lysosomal inhibitor BAF (20 nM), and fixed in 4% paraformaldehyde (Sangon Biotech, E672002), perforated with 0.5% Triton X-100 (Thermo Fisher Scientific, 85,111), and stained with 4ʹ,6-diamidino-2-phenylindole (DAPI) (Sangon Biotech, E607303) for 5 min at room temperature away from light. GFP-MAP1LC3B puncta formation was determined by capturing images using inverted confocal fluorescence microscope (Carl Zeiss, Germany) as previously described [Citation47].
In vivo model of human MM
Male BALB/c nude mice (5- to 6 weeks old; Shanghai Experimental Animal Center of the Chinese Academy of Sciences, Shanghai, China) were housed and monitored in Animal Research Facility at Second Military Medical University. All experimental procedures and protocols were approved by the Animal Care and Use Committee of Second Military Medical University. To obtain xenograft model of human MM, 5 × 10⁶ LP-1 cells in 200 μL of Matrigel (Corning, 354,248) were subcutaneously inoculated into the left flank of BALB/c nude mice as previously described [Citation48]. Treatments started when palpable tumors became detectable, approximately 2 weeks after MM cells were injected. Xenografted mice were randomized to 4 different treatments (5–6 mice for each group). Intra-tumoral treatment with agoMIR145-3p (0.5 mM/kg, miR40004601-1–10, Ribobio) or agoMIR control was administered every 3 days, for a total of 7 injections. Intraperitoneal treatment with bortezomib (0.5 mg/kg) was administered twice weekly, for a total of 6 injections. Intra-tumoral injections of agoMIR145-3p plus intraperitoneal injections of bortezomib were given with the above described schedules. Then, tumor sizes were measured with an electric clipper once a week. Tumor volumes were calculated (length × width2)/2 and presented as mean ± standard deviation (SD) mm3. Thirty-five days later, in accordance with institutional guidelines, tumors were retrieved from animals and placed in 10% formalin (Sangon Biotech, E672001) for histology.
Immunohistochemistry
Retrieved tumors from animals were fixed in 4% buffered formaldehyde and 24 h later washed, dehydrated, and embedded in paraffin (Leica, 39,601,095). Then 2-μm thick tumor slices were deparaffinized and pretreated with the Epitope Retrieval Solution 2 (EDTA-buffer pH 8.8, Leica Biosystems, AR9640-CN) at 98°C for 20 min. After washing steps, peroxidase blocking was carried out for 10 min using the Bond Polymer (Leica, DS9800-CN). All procedures were performed using the Bond Max Automated Immunohistochemistry (Leica, 49.0051). Tissues were washed and incubated with the primary antibody directed against cleaved CASP3 (Cell Signaling Technology, 9664; 1:1000) or MAP1LC3B (Cell Signaling Technology, 3868; 1:3200). Subsequently, tissues were incubated with polymer for 10 min and developed with 2, 2ʹ-diaminobenzidine-Chromogen (ZSGB-BIO, ZLI9017) for 10 min. Slides were counterstained with hematoxylin (Baso, BA-4097) and mounted under glass coverslips. All stained slides were analyzed using a standard bright field light microscope (Eclipse Ci-L, Nikon, Japan).
Statistical analysis
Data are expressed as the mean ± SD of at least 3 separate experiments performed in triplicate. Student’s t test and Pearson test were used to evaluate statistical significance of differences by GraphPad Prism software (www.graphpad.com). P values < 0.05 were considered statistically significant. SPSS 13.0 software was used for all statistical analysis.
Disclosure statement
No potential conflict of interest was reported by the authors.
Additional information
Funding
Related Research Data
References
- Röllig C, Knop S, Bornhäuser M. Multiple myeloma. Lancet. 2015;385:2197–2208.
- Naymagon L, Abdul-Hay M. Novel agents in the treatment of multiple myeloma: a review about the future. J Hematol Oncol. 2016;9:52–58.
- Ventura A, Jacks T. MicroRNAs and cancer: short RNAs go a long way. Cell. 2009;136:586–591.
- Bracken CP, Scott HS, Goodall GJ. A network-biology perspective of microRNA function and dysfunction in cancer. Nat Rev Genet. 2016;17:719–732.
- Ahmad N, Haider S, Jagannathan S, et al. MicroRNA theragnostics for the clinical management of multiple myeloma. Leukemia. 2014;28:732–738.
- Stamato MA, Juli G, Romeo E, et al. Inhibition of EZH2 triggers the tumor suppressive miR-29b network in multiple myeloma. Oncotarget. 2017;8:106527–106537.
- Abdi J, Rastgoo N, Li L, et al. Role of tumor suppressor p53 and micro-RNA interplay in multiple myeloma pathogenesis. J Hematol Oncol. 2017;10:169–180.
- Zhang Q, Yan W, Bai Y, et al. Synthetic miR-145 mimic inhibits multiple myeloma cell growth in vitro and in vivo. Oncol Rep. 2015;33:448–456.
- Hale AN, Ledbetter DJ, Gawriluk TR, et al. Autophagy: regulation and role in development. Autophagy. 2013;9:951–972.
- Thorburn A. Autophagy and its effects: making sense of double-edged swords. PLoS Biol. 2014;12:e1001967.
- Singh SS, Vats S, Chia AY, et al. Dual role of autophagy in hallmarks of cancer. Oncogene. 2018;37:1142–1158.
- Pengo N, Scolari M, Oliva L, et al. Plasma cells require autophagy for sustainable immunoglobulin production. Nat Immunol. 2013;14:298–305.
- Pengo N, Cenci S. The role of autophagy in plasma cell ontogenesis. Autophagy. 2013;9:942–944.
- Lu Y, Gao J, Zhang S, et al. miR-142-3p regulates autophagy by targeting ATG16L1 in thymic-derived regulatory T cell (tTreg). Cell Death Dis. 2018;9:290–299.
- Lu C, Chen J, Xu HG, et al. MIR106B and MIR93 prevent removal of bacteria from epithelial cells by disrupting ATG16L1-mediated autophagy. Gastroenterology. 2014;146:188–199.
- Fu XT, Shi YH, Zhou J, et al. MicroRNA-30a suppresses autophagy-mediated anoikis resistance and metastasis in hepatocellular carcinoma. Cancer Lett. 2018;412:108–117.
- Xu L, Beckebaum S, Iacob S, et al. MicroRNA-101 inhibits human hepatocellular carcinoma progression through EZH2 downregulation and increased cytostatic drug sensitivity. J Hepatol. 2014;60:590–598.
- Zhao J, Nie Y, Wang H, et al. MiR-181a suppresses autophagy and sensitizes gastric cancer cells to cisplatin. Gene. 2016;576:828–833.
- Liu L, Shen W, Zhu Z, et al. Combined inhibition of EGFR and c-ABL suppresses the growth of fulvestrant-resistant breast cancer cells through miR-375-autophagy axis. Biochem Biophys Res Commun. 2018;498:559–565.
- Wilson AJ, Byun DS, Nasser S, et al. HDAC4 promotes growth of coloncancer cells via repression of p21. Mol Biol Cell. 2008;19:4062–4075.
- Glozak MA, Seto E. Histone deacetylases and cancer. Oncogene. 2007;26:5420–5432.
- Kang ZH, Wang CY, Zhang WL, et al. Histone deacetylase HDAC4 promotes gastric cancer SGC-7901 cells progression via p21 repression. PLoS One. 2014;9:e98894.
- Chauchereau A, Mathieu M, de Saintignon J, et al. HDAC4 mediates transcriptional repression by the acute promyelocytic leukaemia-associated protein PLZF. Oncogene. 2004;23:8777–8784.
- Sandhu SK, Volinia S, Costinean S, et al. miR-155 targets histone deacetylase 4 (HDAC4) and impairs transcriptional activity of B-cell lymphoma 6 (BCL6) in the Eμ-miR-155 transgenic mouse model. Proc Natl Acad Sci USA. 2012;109:20047–20052.
- Kikuchi S, Suzuki R, Ohguchi H, et al. Class IIa HDAC inhibition enhances ER stress-mediated cell death in multiple myeloma. Leukemia. 2015;29:1918–1927.
- Xiao Q, Huang L, Zhang Z, et al. Overexpression of miR-140 inhibits proliferation of osteosarcoma cells via suppression of histone deacetylase 4. Oncol Res. 2017;25:267–275.
- Ahmad A, Ginnebaugh KR, Yin S, et al. Functional role of miR-10b in tamoxifen resistance of ER-positive breast cancer cells through down-regulation of HDAC4. BMC Cancer. 2015;15:540.
- Wang H, Li C, Jian Z, et al. TGF-β1 reduces miR-29a expression to promote tumorigenicity and metastasis of cholangiocarcinoma by targeting HDAC4. PLoS One. 2015;10:e0136703.
- Tanida I, Waguri S. Measurement of autophagy in cells and tissues. Methods Mol Biol. 2010;648:193–214.
- Yamamoto A, Tagawa Y, Yoshimori T, et al. Bafilomycin A1 prevents maturation of autophagic vacuoles by inhibiting fusion between autophagosomes and lysosomes in rat hepatoma cell line, H-4-II-E cells. Cell Struct Funct. 1998;23:33–42.
- Amodio N, Stamato MA, Gullà AM, et al. Therapeutic targeting of miR-29b/HDAC4 epigenetic loop in multiple myeloma. Mol Cancer Ther. 2016;15:1364–1375.
- Ding H, KL P, Correia C, et al. Histone deacetylase inhibitors interrupt HSP90•RASGRP1 and HSP90•CRAF interactions to upregulate BIM and circumvent drug resistance in lymphoma cells. Leukemia. 2017;31:1593–1602.
- Liu YL, Yang PM, Shun CT, et al. Autophagy potentiates the anti-cancer effects of the histone deacetylase inhibitors in hepatocellular carcinoma. Autophagy. 2010;6:1057–1065.
- Gammoh N, Lam D, Puente C, et al. Role of autophagy in histone deacetylase inhibitor-induced apoptotic and nonapoptotic cell death. Proc Natl Acad Sci USA. 2012;109:6561–6565.
- Chiao MT, Cheng WY, Yang YC, et al. Suberoylanilide hydroxamic acid (SAHA) causes tumor growth slowdown and triggers autophagy in glioblastoma stem cells. Autophagy. 2013;9:1509–1526.
- Milan E, Fabbri M, Cenci S. Autophagy in plasma cell ontogeny and malignancy. J Clin Immunol. 2016;36:18–24.
- Lamy L, Ngo VN, Emre NC, et al. Control of autophagic cell death by caspase-10 in multiple myeloma. Cancer Cell. 2013;23:435–449.
- Pullarkat V, Meng Z, Donohue C, et al. Iron chelators induce autophagic cell death in multiple myeloma cells. Leuk Res. 2014;38:988–996.
- Cao B, Li J, Zhou X, et al. Clioquinolinduces pro-death autophagy in leukemia and myeloma cells by disrupting the mTOR signaling pathway. Sci Rep. 2014;4:5749–5760.
- Shao Y, Gao Z, Marks PA, et al. Apoptotic and autophagic cell death induced by histone deacetylase inhibitors. Proc Natl Acad Sci USA. 2004;101(52):18030–18035.
- Tsujimoto Y, Shimizu S. Another way to die: autophagic programmed cell death. Cell Death Differ. 2005;12(Suppl 2):1528–1534.
- Wallington-Beddoe CT, Sobieraj-Teague M, Kuss BJ, et al. Resistance toproteasome inhibitors and other targeted therapies in myeloma. Br J Haematol. 2018;182:11–28.
- Chhabra S. Novel proteasome inhibitors and histone deacetylase inhibitors: progress in myeloma therapeutics. Pharmaceuticals (Basel). 2017;10:E40.
- Greipp PR, San Miguel J, Durie BG, et al. International staging system for multiple myeloma. J Clin Oncol. 2005;23:3412–3420.
- Livak KJ, Schmittgen TD. Analysis of relative gene expression data usingreal-time quantitative PCR and the 2(-Delta Delta C(T)) Method. Methods. 2001;25:402–408.
- H.J., Ait-mohamed O, Brown EJ, et al. Guidelines for the use and interpretation of assays for monitoRING AUTophagy. Autophagy. 2016;8:445–544.
- Yang Q, Wu J, Luo Y, et al. (−)-Guaiol regulates RAD51 stability via autophagy to induce cell apoptosis in non-small cell lung cancer. Oncotarget. 2016;7:62585–62597.
- LeBlanc R, Catley LP, Hideshima T, et al. Proteasome inhibitor PS-341 inhibits human myeloma cell growth invivo and prolongs survival in a murine model. Cancer Res. 2002;62:4996–5000.