
ABSTRACT
Kidney stone disease is a lifestyle-related disease prevalent in developed countries; however, effective medical treatment for the disease is not yet well established. As cellular damage in renal tubular cells (RTCs) is responsible for the disease, here, we focused on the role of macroautophagy/autophagy in RTCs. We found that autophagic activity was significantly decreased in mouse RTCs exposed to calcium oxalate (CaOx) monohydrate crystals and in the kidneys of GFP-conjugated MAP1LC3B (microtubule- associated protein 1 light chain 3 beta) transgenic mice with CaOx nephrocalcinosis induced by glyoxylate. This caused accumulation of damaged intracellular organelles, such as mitochondria and lysosomes, the normal functioning of which is mediated by functional autophagy. An impairment of autophagy was also observed in the mucosa with plaques of CaOx kidney stone formers. We determined that the decrease in autophagy was caused by an upregulation of MTOR (mechanistic target of rapamycin kinase), which consequently resulted in the suppression of the upstream autophagy regulator TFEB (transcription factor EB). Furthermore, we showed that an MTOR inhibitor could recover a decrease in autophagy and alleviate crystal-cell interactions and the formation of crystals associated with increased inflammatory responses. Taken together, we conclude that autophagy compromised by MTOR deregulation is a fundamental feature in the pathology of kidney stone formation, and propose that chemical inhibition of MTOR could be a prospective strategy for disease suppression.
Abbreviations: ACTB: actin, beta; CaOx: calcium oxalate; CKD: chronic kidney disease; COM: calcium oxalate monohydrate; LGALS3/galectin-3: lectin, galactose binding, soluble 3; GFP: green fluorescent protein; GOX: glyoxylate; HE: hematoxylin and eosin; MAPLC3B: microtubule- associated protein 1 light chain 3 beta; MTOR: mechanistic target of rapamycin kinase; NAC: N-acetyl-L-cysteine; ROS: reactive oxygen species; RTC: renal tubular cell; SQSTM1/p62: sequestosome 1; TFEB: transcription factor EB; TEM: transmission electron microscopy; tfLC3: tandem fluorescent-tagged LC3; 3-MA: 3-methyladenine.
Introduction
Kidney stone disease, which occurs in nearly 9% of adults and continues to increase in prevalence worldwide [Citation1,Citation2], is a risk factor for chronic kidney disease (CKD) [Citation3,Citation4] and may still cause death in the 21st century [Citation5]. Although many studies have focused on the prevention of kidney stone formation, no effective medical treatment has yet been found, and therapy depends largely on surgical treatment. Because characterizing the pathogenesis of kidney stone formation has been challenging, establishing an effective therapy is a subject of ongoing research.
It is currently known that inflammation and oxidative stress facilitate crystal adhesion to renal tubular cells (RTCs) and crystal formation, promoting kidney stone development [Citation6,Citation7], as we previously reported in vitro, in vivo, and in a human study [Citation8–Citation10]. We therefore used anti-inflammatory and anti-oxidative substances to prevent kidney stone formation; however, these substances only partially suppressed stone formation [Citation11–Citation13]. Based on these results, we expect that to suppress stone-formation-promoting factors, it is necessary to suppress cellular damage, which causes an inflammatory response.
Among protective mechanisms against cellular damage, macroautophagy/autophagy, along with the ubiquitin–proteasome system, is a major cellular degradation pathway [Citation14–Citation16]. Autophagy is upregulated when cells are preparing to undergo structural remodeling, such as during developmental transitions or when cells rid themselves of damaging cytoplasmic components [Citation14,Citation17]. Thus, autophagy plays not only a principal role in the supply of nutrients for cell survival but also a constitutive role in cellular homeostasis. Several reports have demonstrated that enhanced autophagic activity in the kidney plays a protective role against hyperuricemia and urate nephropathy [Citation18,Citation19], acute kidney injury caused by ischemia and cisplatin [Citation20,Citation21], and mitochondrial metabolic stress [Citation22,Citation23], although the mechanism of autophagy in renal stone formation remains unclear.
In this study, we determined the role of autophagy in suppressing kidney stone development. In two model systems, the kidneys of mice with calcium oxalate (CaOx) nephrocalcinosis and mouse RTCs treated with CaOx crystals, we found that the MTOR-TFEB pathway was responsible for decreased autophagic activity in the renal system. As chemical inhibition of MTOR ameliorates kidney stone development, we propose that deregulated MTOR and resultant impairment in autophagy is a key target for prevention or treatment of the disease.
Results
Decreased autophagy in the kidneys of mice with CaOx nephrocalcinosis
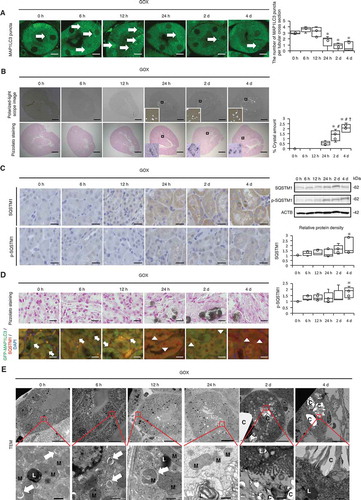
To monitor autophagic activity in the kidneys of mice with CaOx nephrocalcinosis, we injected the oxalate precursor glyoxylate (GOX) into transgenic mice expressing GFP-MAP1LC3, which is commonly used to measure autophagic activity in vivo. The number of MAP1LC3 puncta in RTCs was decreased at 24 h, 2 d, and 4 d after injection, while CaOx crystal formation eventually increased ( and B). These results did not indicate an increase in autophagy in the kidney but rather showed an accumulation of autolysosomes, as expression of the autophagic substrate SQSTM1/p62 (SQSTM1) and its phosphorylation (Ser351; p-SQSTM1) were increased 4 d after GOX injection (; Fig. S1). Changes in the level of autophagy were mainly observed in the proximal RTCs in the cortico-medullary area, where CaOx crystal formation was mainly observed, rather than in the distal tubules or collecting duct (Fig. S2 and S3). Moreover, colocalization studies of MAP1LC3 and SQSTM1 indicated that the number of MAP1LC3 puncta decreased after crystal formation, while the number of SQSTM1 puncta increased (; Fig. S4). In agreement with these results, GFP-MAP1LC3 transgenic mice subjected to chloroquine administration at 6 h before sacrifice showed decreased MAP1LC3 accumulation at 4 d after GOX injection (Fig. S5). Consistent with these findings, using transmission electron microscopy (TEM), we observed autolysosomes containing damaged organelles in RTCs during the period of non-nephrocalcinosis, whereas there was substantial cytosolic vacuolar formation and crystals during the period of nephrocalcinosis (). These changes were correlated with kidney damage as indicated by body weight, 24-h urine samples, and blood data (Table S1A and Fig. S6). These results indicate that autophagic activity is decreased in RTCs during kidney-damaging CaOx nephrocalcinosis.
Figure 1. Autophagy declines in the kidneys of mice with calcium oxalate (CaOx)-induced nephrocalcinosis. (A) Numbers of GFP-positive puncta per tubular cross-section (at least 30–50 tubules were counted) in RTCs of GFP-MAP1LC3 transgenic mice (LC3-mice) with glyoxylate (GOX) injection (n = 5/group). Arrows indicate MAP1LC3 puncta. (B) Amount of crystals formed, determined by polarized-light scope images and Pizzolato staining of kidneys extracted from LC3-mice injected with GOX (n = 5/group). (C) Immunostaining and western blotting (SQSTM1/p62; SQSTM1 and phosphorylated SQSTM1; p-SQSTM1) of kidneys from LC3-mice with GOX treatment; relative protein density is indicated (n = 5/group). (D) Pizzolato staining and fluorescence immunostaining of SQSTM1 (red) and counterstaining with DAPI (blue) in MAP1LC3-mice. Arrows and arrowheads indicate MAP1LC3 puncta and SQSTM1 puncta, respectively. (E) Transmission electron microscopy (TEM) images. Asterisks indicate the nucleus, and arrows indicate autolysosomes. M, mitochondria; L, lysosome; C, crystal. Scale bars: 1 mm (B), 20 μm (C, D), 10 μm (A, E; upper), and 0.5 μm (E; lower). Values at 0 h were adjusted to ‘1’ as a reference (C). *P < 0.05 versus 0 h, 6 h, and 12 h; #P < 0.05 versus 24 h; and †P < 0.05 versus 2 d (A, B). *P < 0.05 versus 0 h (C).
CaOx monohydrate (COM) administration impairs autophagy and causes mitochondrial and lysosomal dysfunction in mouse RTCs
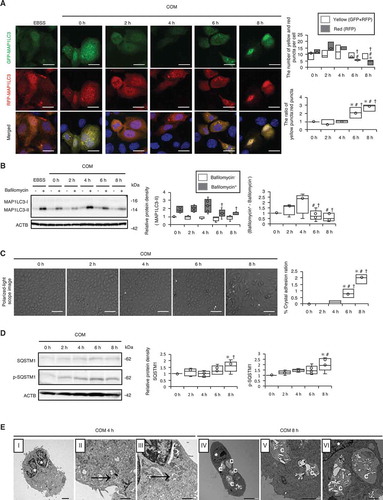
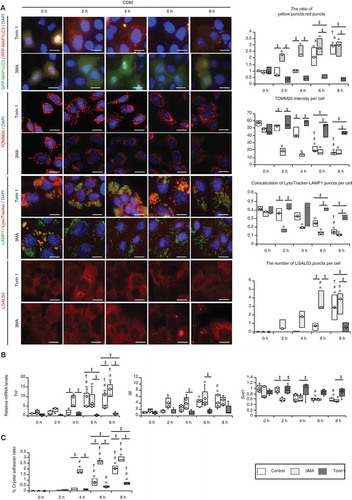
To characterize the molecular basis of the role of autophagy in RTCs during CaOx kidney crystal formation, we monitored autophagy in mouse RTCs upon COM crystal administration. Autophagic flux assay, performed by measuring MAP1LC3 protein turnover, showed that autophagy was significantly decreased 6–8 h after CaOx exposure ( and B; Fig. S7 and S8) while crystal aggregation and adhesion to cells were significantly increased (; Fig. S9). This decrease in MAP1LC3 flux was correlated with an increase in the protein level of SQSTM1 and its phosphorylation upon COM exposure (). Additionally, we observed phagophores and autolysosomes containing cytoplasmic components or undigested proteins at 4 h after COM exposure, though these were hardly observed at 8 h (), again supporting the in vivo data showing inhibition of autophagy in RTCs during crystal formation.
Figure 2. Autophagy is impaired upon exposure of renal tubular cells (RTCs) to CaOx monohydrate (COM) crystals. (A) Number of yellow (GFP + RFP) and red (RFP) puncta per cell and ratio of yellow:red puncta in RTCs with COM exposure transfected with tandem fluorescent-tagged LC3 (tfLC3). At least 30–50 cells were counted (n = 3). For starvation treatment, we cultured cells with Earle’s balanced salt solution (EBSS) for 2 h without COM. (B) Relative protein density and difference of MAP1LC3-II (bafilomycin+) and MAP1LC3-II (bafilomycin−), determined by western blotting (MAP1LC3) of RTCs with COM exposure and bafilomycin A1 (n = 5). (C) Adhesion ratio in polarized-light scope images of RTCs after COM exposure. Images were obtained from 10 random fields. At this resolution there were 200–300 cells per field (n = 3). (D) Relative protein density, determined by western blotting (SQSTM1 and p-SQSTM1) of RTCs with COM exposure (n = 5). (E) TEM images (at 4 h and 8 h after COM exposure). Asterisks indicate the nucleus, and arrows indicate phagophore and autolysosomes. C, crystal. Scale bars: 50 μm (C), 20 μm (A), 5 μm (E; I and IV), 2 μm (E; II and V), 1 μm (E; III and VI). Values at 0 h and bafilomycin− 0 h were adjusted to ‘1’ as a reference (A, B, D). *P < 0.05 versus 0 h, #P < 0.05 versus 2 h, †P < 0.05 versus 4 h.
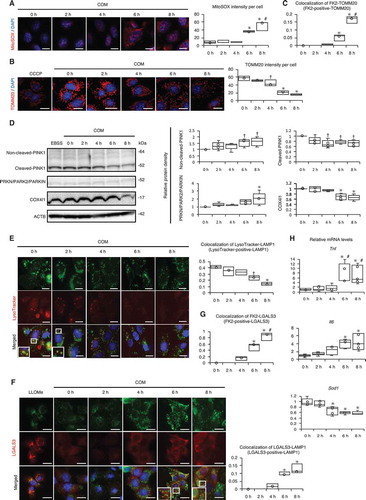
It is likely that autophagy functions in a cytoprotective manner in RTCs during CaOx nephrocalcinosis because we observed compromised maintenance of organelles maintained by autophagy, i.e., mitophagy and lysophagy. We observed an increase in the MitoSOX signal, a decrease in TOMM20 ( and B; Fig. S10), and an increase in ubiquitination of mitochondria at 6–8 h after COM exposure (; Fig. S11). Expression levels of non-cleaved PINK1 and PRKN/PARK2/PARKIN were increased, while that of cleaved PINK1 was decreased at 6–8 h (). Moreover, staining of lysosomes with LysoTracker showed that lysosomal pH maintenance was compromised by COM exposure (; Fig. S11). This is consistent with the observation of lysosomal LGALS3/galectin-3 (lectin, galactose binding, soluble 3) signals, which were indicative of lysosomal membrane damage (; Fig. S12), and ubiquitination of the lysosome at 6–8 h after COM exposure (; Fig. S13). We also found increased mRNA expression levels of Tnf and Il6 and decreased expression of Sod1, suggesting that inflammation and oxidative stress were promoted by COM exposure (). On the basis of these results, we established that the damaged organelles were ubiquitinated; however, due to the decrease in autophagy, these organelles were not removed and caused an inflammatory response and oxidative stress.
Figure 3. Impaired autophagic activity causes mitochondrial and lysosomal dysfunction. (A) MitoSOX fluorescence intensity showing mitochondrial ROS of RTCs treated with COM and counterstained with DAPI (blue); (B) Intensity of TOMM20 staining (red) in RTCs counterstained with DAPI (blue) after COM exposure. To uncouple mitochondrial oxidative phosphorylation, we treated cells with 10 μM carbonyl cyanide m-chlorophenyl hydrazine (CCCP) for 8 h. (C) Colocalization of FK2-TOMM20 puncta per cell in RTCs after COM exposure. (D) Relative protein density, determined by western blotting of non-cleaved and cleaved PINK1, PRKN/PARK2/PARKIN, and COX4I1 (n = 5). For starvation treatment, we cultured cells with Earle’s balanced salt solution (EBSS) for 2 h without COM treatment. (E) Colocalization of LysoTracker-LAMP1 puncta per cell in RTCs stained with LysoTracker Red, immunostained for LAMP1 (green), and counterstained with DAPI (blue) after treatment with COM (right). (F) Colocalization of LGALS3-LAMP1 puncta per cell in RTCs after COM exposure, immunostaining for LAMP1 (green) and LGALS3 (red), and counterstaining with DAPI (blue). To disrupt the lysosomal membrane, 500 mM LLOMe, a lysosomotropic compound, was used. (G) Colocalization of FK2-LGALS3 puncta per cell in RTCs after treatment with COM. (H) Quantification of gene expression (Tnf, Il6, and Sod1) in RTCs upon COM exposure (n = 5). Mean intensities of MitoSOX and TOMM20 per cell, measured using ImageJ. At least 30–50 cells were counted (n = 3). Colocalization of FK2-TOMM20 (FK2-positive-TOMM20), LysoTracker-LAMP1 (LysoTracker-positive-LAMP1), LGALS3-LAMP1 (LGALS3-positive-LAMP1), and FK-LGALS3 (FK2-positive-LGALS3) puncta per cell, measured using ImageJ (Manders coefficients were calculated). At least 30–50 cells were counted (n = 3). Scale bars: 20 μm (A–B, E–F). Each value at 0 h was adjusted to ‘1’ as a reference (D). *P < 0.05 versus 0 h, 2 h, and 4 h; #P < 0.05 versus 6 h; †P < 0.05 versus 0 h (A–G). *P < 0.05 versus 0 h and 2 h, #P < 0.05 versus 4 h (H).
Similar results were observed in vivo. In the RTCs of kidneys with nephrocalcinosis, hematoxylin and eosin (HE) staining showed cytosolic vacuolar formation, and some of the vacuoles were positive for LAMP1 and LGALS3 immunostaining, indicating dysfunctional and/or ruptured lysosomes after autophagy was decreased (24 h, 2 d, and 4 d after GOX injection) (Fig. S14 and S15). Additionally, TEM indicated many swollen mitochondria and cytosolic vacuoles containing multilamellar, onion skin-like structures indicative of phospholipids. These vacuoles were damaged lysosomes in RTCs; moreover, they tended to concentrate at the lumen, thus possibly becoming the cores of stones (; 24 h, 2 d).
This line of evidence strongly suggests a role for autophagy in cellular homeostasis against COM exposure and simultaneously shows that COM-mediated deregulation of this safeguard system in RTCs could be involved in the pathology of CaOx stone formation.
MTOR inhibition suppresses inflammation, crystal adhesion, and kidney crystal formation
These findings prompted us to determine the molecular basis by which autophagy is suppressed during crystal formation, and thus, we tested the involvement of the MTOR-TFEB axis, which is a well-known pathway regulating autophagy. We found that phosphorylation (p-) of RPS6KB1/p70S6K was induced by COM exposure, suggesting that stress increased MTOR activity. Nuclear localization of TFEB was decreased, and the ratio between nuclear and cytoplasmic TFEB fractions was also decreased at 6 and 8 h. Expression of phosphorylation of ULK1 (p-ULK1) was decreased, reflecting MTOR upregulation ( and B; Fig. S16). Similar to the in vitro results, p-RPS6KB1/p70S6K was activated, and the ratio of nuclear:cytoplasmic TFEB and the expression of p-ULK1 were decreased after kidney crystal formation (). Furthermore, the expression of Lamp1 and Uvrag-DT, which are transcriptional targets of TFEB, was suppressed after COM and GOX treatment ().
Figure 4. MTOR-TFEB axis was deregulated during kidney crystal formation. (A) Relative protein density, determined by western blotting of RPS6KB1/p70S6K, phosphorylated RPS6KB1/p70S6K (p-RPS6KB1/p70S6K), ULK1, phosphorylated ULK1 (p-ULK1), and nuclear and cytoplasmic TFEB in RTCs with COM exposure (n = 5). For starvation treatment, we cultured cells with EBSS for 2 h without COM. (B) Mean intensity of GFP-TFEB in nuclei of RTCs with COM exposure and/or Torin1. At least 30–50 cells were counted (n = 3). (C) Relative protein density, determined by western blotting (RPS6KB1/p70S6K, p-RPS6KB1/p70S6K, ULK1, p-ULK1, and nuclear and cytoplasmic TFEB) of kidneys extracted from LC3-mice with GOX injection (n = 5/group). (D) Quantification of gene expression (Lamp1 and Uvrag-DT) in RTCs with COM exposure and kidneys extracted from LC3-mice with GOX injection (n = 5). (E) Relative protein density, determined by western blotting of RPS6KB1/p70S6K and p-RPS6KB1/p70S6K in RTCs with COM exposure and/or NAC and of kidneys extracted from LC3-mice with GOX and/or NAC (n = 5). Each value at 0 h (A,C), COM 0 h and GOX 0 h (E) were adjusted to ‘1’ as a reference. *P < 0.05 versus 0 h, #P < 0.05 versus 2 h, and †P < 0.05 versus 4 h (A, B, D: in vitro); *P < 0.05 versus 0 h, #P < 0.05 versus 6 h, and †P < 0.05 versus 12 h (C, D: in vivo); *P < 0.05 versus COM and GOX 0 h and #P < 0.05 (E).
We speculated that COM and GOX most likely upregulate MTOR activity through oxidative stress; therefore, we investigated whether MTOR activity declined upon administration of the reactive oxygen species (ROS) scavengers N-acetyl-L-cysteine (NAC), L-ascorbic acid (AA), tiron in vitro, and NAC in vivo. We observed that ROS scavengers suppressed MTOR upregulation both in vitro and in vivo (; Fig. S17). These data indicate that upregulation of MTOR with decreased TFEB activity might be a major pathological target during CaOx stone formation. Therefore, we sought to determine whether MTOR inhibition could alleviate the pathological events associated with kidney stones.
Using the tfLC3 system, we confirmed that treatment with the MTOR inhibitor Torin1 could reverse the decreased autophagic activity caused by COM exposure and that the autophagy inhibitor 3-methyladenine (3-MA) suppressed autophagy in RTCs (). We found that Torin1 treatment alleviated mitochondrial damage, deregulation of lysosomal pH maintenance, and accumulation of LGALS3-positive puncta (). Notably, these effects were associated with mitigation of the pathological features of COM exposure, such as enhanced inflammatory response and crystal aggregation and adhesion ( and C; Fig. S18).
Figure 5. MTOR inhibition suppresses inflammation and crystal adhesion. (A) Ratio of yellow:red puncta, mean intensity of TOMM20 per cell, colocalization of LysoTracker-LAMP1 puncta per cell, and number of LGALS3 per cell in RTCs transfected with tfLC3; immunostained for TOMM20, LAMP1, and LysoTracker; counterstained with DAPI; and stained for LGALS3 after COM exposure and 3-MA or Torin1 treatment. The control group was treated with COM only. At least 30–50 cells were counted (n = 3). (B) Gene expression (Tnf, Il6, and Sod1) in RTCs with COM exposure and 3-MA or Torin1 treatment (n = 5). (C) Adhesion ratio to RTCs after COM exposure and 3-MA or Torin1 treatment. Images were obtained from 10 random fields. At this resolution, there were 200–300 cells per field (n = 3). Scale bars: 20 μm (A). Each value for yellow:red puncta at 0 h was adjusted to ‘1’ as a reference (A). *P < 0.05 versus 0 h with the same treatment, #P < 0.05 versus 2 h with the same treatment, †P < 0.05 versus 4 h with the same treatment, and ‡P < 0.05.
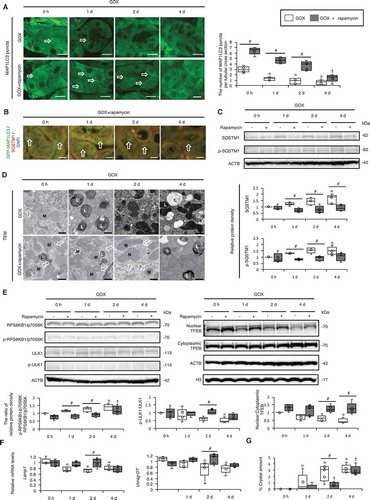
Next, we examined whether MTOR inhibition could alleviate the pathological features caused by GOX administration in vivo. GFP-MAP1LC3 transgenic mice were injected with GOX and rapamycin intraperitoneally every day (body weight, blood data, and 24-h urine samples are shown in Fig. S19). We found that MAP1LC3 puncta formation was still intact at 1–2 d after GOX injection with rapamycin, whereas the number of MAP1LC3 puncta decreased at 1–2 d after GOX injection without rapamycin (). Moreover, colocalization studies of MAP1LC3 and SQSTM1 indicated that MAP1LC3 puncta were still intact, whereas few SQSTM1 puncta were observed 1–2 d after GOX injection with rapamycin (; Fig. S20). Consistently, we observed that the GOX-induced increase in SQSTM1 and p-SQSTM1 was suppressed by rapamycin treatment (). TEM indicated abundant autolysosomes at 1–2 d after GOX + rapamycin treatment (). Additionally, rapamycin suppressed the expression of p-RPS6KB1/p70S6K and elevated the ratio between nuclear and cytoplasmic TFEB fractions, as well as p-ULK1 (; Fig. S21). Furthermore, Lamp1 and Uvrag-DT expression was still intact 2 d after GOX + rapamycin injection (). The formation of kidney crystals was significantly suppressed by rapamycin treatment at 2 d after injection, whereas at 4 d, it reached a comparable level to that in untreated mice (; Fig. S22). Although serum creatinine (Cre) and blood urea nitrogen (BUN) levels were increased, and body weight was decreased after GOX + rapamycin injection, there was no significant difference in 24-h urine samples, while overall inflammatory responses also tended to be suppressed (Fig. S19 and S23, Table S1B). These findings thus suggest that increased MTOR activity is a major cause of compromised autophagy caused by GOX administration, and furthermore, that MTOR inhibition delays kidney crystal formation and alleviates associated pathology.
Figure 6. MTOR inhibition suppresses kidney crystal formation. (A) Numbers of GFP-MAP1LC3 puncta (arrows) per tubular cross-section in RTCs with or without rapamycin of LC3-mice treated with GOX. At least 30–50 tubules were counted (n = 5/group). The 0 h (GOX) group was injected with the same amount of PBS 1 day before sacrifice. The 0 h (GOX + rapamycin) group was injected with the same amount of PBS and the same amount of rapamycin 1 day before sacrifice. (B) Fluorescence immunostaining of SQSTM1 (red) and counterstaining with DAPI (blue) in MAP1LC3-mice. Arrows indicate MAP1LC3 puncta. (C) Relative protein density, determined by western blotting of SQSTM1 and p-SQSTM1, in the kidneys from LC3-mice with GOX and/or rapamycin (n = 5/group). (D) TEM images. Arrows indicate autolysosomes. M, mitochondria; L, lysosome. (E) Relative protein density, determined by western blotting of RPS6KB1/p70S6K, p-RPS6KB1/p70S6K, ULK1, p-ULK1, and nuclear and cytoplasmic TFEB in kidneys from LC3-mice with GOX and/or rapamycin (n = 5/group). (F) Gene expression of Lamp1 and Uvrag-DT in kidneys extracted from LC3-mice with GOX and rapamycin injection (n = 5). (G) Amount of crystals formed in kidneys extracted from LC3-mice after GOX and/or rapamycin injection (n = 5/group). Scale bars: 20 μm (B), 10 μm (A), and 0.5 μm (D). Each value at 0 d (GOX without rapamycin) was adjusted to ‘1’ as a reference (C, E). *P < 0.05 versus GOX 0 h, #P < 0.05, and †P < 0.05 versus GOX + rapamycin 0 h.
Autophagy flux declined in the mucosa with plaques of CaOx kidney stone formers
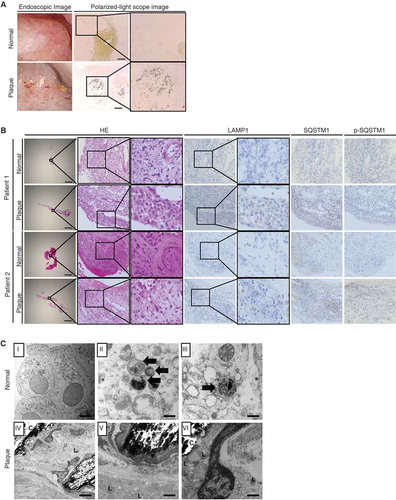
To determine the pathological significance of our findings, we investigated autophagic activity in normal and plaque-covered mucosal samples of CaOx kidney stone formers (–C; Fig. S24). In the mucosa with plaques, crystals were observed. HE-staining indicated cytosolic vacuolar formation; furthermore, some cells were positive for LAMP1, indicating lysosomes. TEM images also indicated damaged lysosomes, mitochondria, and crystals; however, fewer autolysosomes were observed. Furthermore, tissues were positive for SQSTM1 and its phosphorylated form, reflecting impaired autophagic flux. In contrast, these findings were rarely observed in the normal mucosa; TEM images showed several autolysosomes containing cytoplasmic components and damaged organelles in normal mucosa. Therefore, our findings are highly relevant to human kidney stone disease.
Figure 7. Impaired autophagic flux in mucosa with plaques compared with that in normal mucosa in kidney stone formers. (A) Kidney mucosa biopsy samples obtained from normal and plaque-covered areas of CaOx stone formers were analyzed. Endoscopic- and polarized-light scope images of the mucosa of plaque-covered and normal areas are shown. (B) These mucosa samples were stained with hematoxylin and eosin (HE) and immunostained for LAMP1, SQSTM1, and p-SQSTM1. (C) TEM images of the mucosa in plaque-covered and normal areas are shown. Scale bars: 1 mm (B), 100 μm (A), 5 μm (C; I and IV) and 0.5 μm (C; II, III, V, VI). Arrows indicate autolysosomes. L, lysosome; C, crystal.
Discussion
In this report, we showed that COM exposure results in an impairment of autophagy, which is associated with damage to intracellular organelles, an increase in the inflammatory response, and crystal aggregation and adhesion to RTCs. Although autophagic activity was temporarily increased after CaOx crystal treatment, it gradually decreased because of MTOR upregulation induced by ROS. Since restoration of impaired autophagy by MTOR inhibition drastically alleviated these crystal-cell interactions, this autophagy defect is responsible for the observed phenotype. It has been suggested that activation of crystal-cell interactions leads to further crystallization and the development of stone nidi called Randall plugs [Citation24,Citation25]. This also facilitates movement of crystals from intratubular loci to interstitial space, resulting in the formation of Randall plaques [Citation26]. Due to its considerable contribution to kidney stone formation at the early stage [Citation27,Citation28], involvement of an autophagy defect in the crystal-cell interaction increases its relevance to clinical applications. It is further supported by the data showing a mitigation of GOX-induced crystal formation by restoration of autophagy with MTOR inhibition in proximal RTCs in the cortico-medullar area and decreased autophagic activity in the mucosa with plaques of CaOx kidney stone formers.
We determined the molecular details underlying the way in which COM exposure results in an impairment of autophagy. Although lysosomal damage is increased in COM-exposed RTCs, we speculate that this is not a direct cause of the decrease in autophagy, as we found no massive accumulation of autolysosomes, which are a characteristic feature of lysosomal disorders. Indeed, LGALS3 staining of COM-exposed RTCs showed that a large fraction of lysosomes in RTCs were still intact. Rather, we propose that the decrease in autophagy is caused by downregulation of the upstream autophagy regulator TFEB, which is regulated by MTOR.
TFEB is a master regulator of the synthesis of autophagy-related proteins and of the biogenesis of lysosomes, the nuclear localization of which is controlled by functional MTOR activity via phosphorylation [Citation29,Citation30]. Recent studies showed that deregulation of the MTOR-TFEB axis plays crucial roles in renal disorder via ablation of autophagy. In acute kidney injury, MTOR activity is markedly upregulated in RTCs, while it is kept low under normal conditions [Citation31]. This upregulation leads to decreased autophagic activity [Citation32] and increases the expression of proinflammatory and profibrotic cytokines, which is associated with forms of progressive CKD [Citation33,Citation34]. In CKD, inhibition of MTOR activity rescues compromised TFEB nuclear translocation in tubule injury [Citation35,Citation36] and ameliorates the progression of intrarenal disorders [Citation37]. These reports are in line with our findings showing the lysosomal biogenesis and autophagic cytoprotective role of TFEB during crystal formation. Furthermore, we previously showed that the Akt-phosphatidylinositol 3-kinase (PtdIns3K) pathway was upregulated in the mucosa with plaques of CaOx kidney stone formers [Citation9]. These data support the idea that an autophagy defect caused by a deregulated MTOR-TFEB axis could be an effective target for kidney stone formation. Therefore, not only MTOR inhibition but also restoration of TFEB or direct activation of autophagy should be considered for future development of medication to treat the disease (). Recent reports show that exposure of blood cells to several types of calcium phosphate and urate crystals causes ROS production, which activates the AKT-PtdIns3K-MTOR pathway [Citation38,Citation39]. Similarly, we found that CaOx treatment results in an increase in ROS production in RTCs and that ROS scavengers suppress MTOR upregulation. Thus, we speculate that ROS induced by CaOx are one of the major causes of MTOR upregulation among potential factors, including changes in amino acids levels and growth factors, although this should be carefully interpreted in light of the potential side effects of ROS scavengers. While pharmacological inhibition of MTOR prevented crystal formation via the processes shown above, long-term administration of high-dose MTOR inhibitor may cause renal dysfunction or inhibit cell repair mechanisms [Citation40], as the MTOR pathway is also an important regulator of cell growth, proliferation, and cellular homeostasis [Citation41,Citation42]. Thus, it is necessary to investigate whether the use of suboptimal doses of rapamycin exert protective effects without completely inhibiting MTOR signals [Citation32].
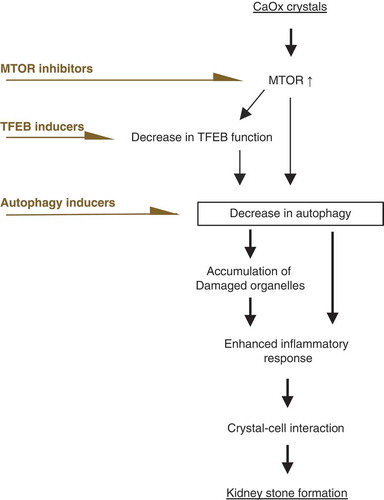
Figure 8. Deregulated MTOR-TFEB axis could be an effective target for kidney stone formation. During kidney stone development, MTOR is activated and nuclear TFEB expression is suppressed, impairing autophagy. Ablation of autophagy causes accumulation of damaged organelles. This enhances the inflammatory response, which facilitates crystal-cell interactions and promotes kidney stone formation. Therefore, autophagy defect caused by deregulation of the MTOR-TFEB axis could be an effective target for kidney stone formation. An MTOR inhibitor, TFEB inducer, or autophagy inducer could suppress the development of kidney stones.
In summary, we propose that autophagy suppression by increased MTOR activity is a key step in kidney stone formation, and thus chemical inhibition of MTOR is a prospective candidate for suppression of kidney stone disease. As MTOR inhibition by chemicals or dietary intervention is greatly anticipated and undergoing clinical trials for the prevention of a wide range of diseases [Citation32,Citation43], the suggested approach for kidney stone prevention could be easily implemented and become widely beneficial for human health in the near future.
Materials and methods
Animal procedures
All experimental procedures were performed in accordance with the National Institutes of Health Guide for the Care and Use of Laboratory Animals, conformed to the Regulations for Animal Experimentation at Nagoya City University and were reviewed by the Institutional Laboratory Animal Care and Use Committee of Nagoya City University. Eight-week-old male, GFP-MAP1LC3 transgenic mice and C57BL/6J mice were fed standard chow and water [Citation44] and given daily intra-abdominal injections of 80 mg/kg glyoxylate; kidneys were then extracted at predetermined intervals (0, 6, 12, 24 h, 2, 4 d), and 24-h urine samples were collected on day 0 and the day before kidney extraction (n = 5 per group) as described previously [Citation45]. The 0 h group was injected with an equal amount of PBS 1 d before sacrifice. Urinary oxalate and citrate concentrations were analyzed using a FOM-110A (Hokuto Denko Co., Tokyo, Japan) [Citation46].
Cell culture and COM crystals
Murine renal tubular epithelial cells, M-1 (American Type Culture Collection, CRL-2038), were cultured as described previously [Citation10,Citation44]. Cells were harvested at predetermined intervals (0, 2, 4, 6, 8, 12, 18, 24 h) after 20 μg/cm2 COM treatment and used for experiments (COM treatment was not carried out at 0 h). COM crystals were made up of 200 mM sodium oxalate (Sigma-Aldrich, 28–3550) and 200 mM calcium chloride (Wako, 031–00435), as described previously [Citation47].
Detection of kidney CaOx crystals and COM crystal adhesion
In vivo crystal formation in extracted mouse kidneys was examined using Pizzolato staining, as described previously [Citation48]. To confirm that the positively stained materials had crystals, non-stained sections were observed using polarized-light optical microphotography (AX80; Olympus, Tokyo, Japan). Crystal formation, calculated as the percent area of CaOx crystal deposition per kidney section, was assessed using Image Pro Plus (Media Cybernetics, Inc., Bethesda, MD; n = 5 in each group).
In vitro adhesion of COM crystals to cells was detected using AX80. Images were obtained from 10 random fields. At this resolution, there were 200–300 cells per field (n = 3). Images were analyzed using Image Pro Plus. The area covered by the crystalline material was determined and expressed as a percent of the whole imaging area.
Antibodies
Antibodies are listed in .
Table 1. Antibodies used in this study.
Transfection of mRFP-GFP tandem fluorescent-tagged LC3 (tfLC3) and TFEB (transcription factor EB)
We transfected cells with a plasmid encoding tfLC3 (Addgene, 21,074; deposited by Tamotsu Yoshimori Lab) or pEGFP-N1-TFEB (Addgene, 38,119; deposited by Shawn Ferguson Lab) for 48 h using Lipofectamine 3000 (Invitrogen, L3000015) as described previously [Citation49] per the manufacturer’s protocol. For starvation treatment, we cultured the cells with Earle’s balanced salt solution (EBSS; Sigma-Aldrich, E7510) for 2 h without COM treatment. GFP-RFP MAP1LC3 puncta and TFEB in the nucleus were observed using fluorescence (BZ-9000; Keyence, Osaka, Japan) and confocal laser scanning (A1-Rsi, Nikon, Tokyo, Japan) microscopy. The number of RFP and GFP puncta and the mean fluorescence intensity of TFEB in the nucleus were measured using ImageJ (available at https://imagej.nih.gov/ij/. html; National Institutes of Health). At least 30–50 cells were counted (n = 3).
Histological analysis
In vivo, GFP-MAP1LC3 puncta per RTC were counted using BZ-9000, and the number of GFP-MAP1LC3 puncta per tubular cross-section at each condition was quantified using ImageJ. At least 30–50 tubules were counted (n = 5 in each group). Immunohistochemical staining for 4% PFA-fixed 4-μm-thick renal cross-sections was carried out. Tubular vacuole accumulation was characterized by hematoxylin and eosin (HE) staining of the 4% PFA-fixed paraffin-embedded sections, and images were observed using BZ-9000. For electron microscopy, kidney specimens were fixed with 2.5% glutaraldehyde (Wako, 072–02262) and observed using TEM (JEM-1011, JEOL, Tokyo, Japan).
In vitro, after the removal of COM, cells were fixed in 4% PFA and examined using fluorescent immunohistochemical staining, according to the manufacturer’s instructions.
To determine mitochondrial ROS production, cells were incubated with 0.3 mM MitoSOX Red (Invitrogen, M36008) for 10 min. To examine lysosomal acidification after COM treatment, RTCs were stained with 50 nM LysoTracker Red DND-99 (Invitrogen, L7528) for 30 min at 37°C and washed, and COM was removed. Primary (LAMP1) and secondary antibodies were applied as described above. To uncouple mitochondrial oxidative phosphorylation, we treated cells with 10 μM carbonyl cyanide m-chlorophenyl hydrazine (CCCP; Wako, 034–16,993) for 8 h. To disrupt the lysosomal membrane, we treated cells with 500 nM lysosomotropic compound l-leucyl-l-leucine methyl ester (LLOMe; Sigma-Aldrich, L7393) for 3 h [Citation50,Citation51]. Fluorescence images were observed using BZ-9000 and A1-Rsi. For TEM, cells were fixed with 2.5% glutaraldehyde and observed using a JEM-1011.
The mean fluorescence intensities of MitoSOX and TOMM20 per cell and number of LGALS3 puncta per cell under each condition were measured using ImageJ. At least 30–50 cells were counted (n = 3). Colocalization of FK2-TOMM20, FK2-LGALS3, LysoTracker-LAMP1, and LGALS3-LAMP1 puncta per cell was measured using ImageJ, and Manders coefficients were calculated. At least 30–50 cells were counted (n = 3).
Western blotting
Whole-protein extracts from kidney sections and M1 cells were used in western blotting assays according to the manufacturer’s instructions. To examine protein expression in the cytoplasm and nucleus, we used the LysoPure Nuclear and Cytoplasmic Extractor Kit (Wako, 295–73,901). Samples were separated into cytoplasmic and nuclear fractions using nuclear fraction buffer and were then used in western blotting assays. Additionally, to assess autophagic activity, M1 cells were treated with 125 nM bafilomycin A1 (AdipoGen, BVT-052) for 1 h before harvesting, as described previously [Citation52]. Chemiluminescent signals were visualized using enhanced chemiluminescence western blotting detection reagents and scanned using a LAS 4000 analyzer (GE Healthcare). Quantification of bands was performed using Image J (n = 5). Band detection was within the linear range.
Quantitative PCR
Total RNA was extracted from cultured M-1 cells and kidney sections using the RNeasy Mini Kit (Qiagen, 74,106). All RNA samples were reverse-transcribed into cDNA using a high-capacity cDNA Reverse Transcription Kit (Applied Biosystems, 4,368,814). Quantitative PCR was performed using a TaqMan FAST Universal PCR Master Mix (Applied Biosystems, 4,352,042) with a 7500 FAST Real-Time PCR System (Applied Biosystems). The primers used are listed in . The expression of each gene was normalized to that of ACTB/β-actin, used as the internal control, and the corrected expression of each gene was normalized to the average value at 0 h (control group) (n = 3–5).
Table 2. TaqMan primers used for quantitative reverse transcription polymerase chain reaction.
Promotion or suppression of autophagy
Given that autophagy is suppressed by MTORC1, we used rapamycin (LKT Laboratories, R0161) [Citation53,Citation54] and Torin1 (Cayman, 10,997) [Citation55] as autophagy facilitators. In contrast, we used 3-methyladenine (3-MA; Santa Cruz Biotechnology, sc-205,596) as an autophagy inhibitor, which is widely used because of its inhibitory effect on class III phosphatidylinositol 3-kinase (PtdIns3K) [Citation56]. Based on the daily doses of rapamycin used in studies of inhibition of MTOR activity (ranging from 0.5 to 2 mg/kg) [Citation53,Citation54], mice were treated with 1 mg/kg/day rapamycin by intraperitoneal injection in a total volume of 0.1 ml PBS at the same time glyoxylate was administered. The 0 h (GOX + rapamycin) group was injected with PBS as the vehicle and the same amount of rapamycin 1 day before sacrifice. Cultured cells were treated with 1 μM Torin1 and 5 mM 3-MA during COM exposure. In the experiment assessing autophagic flux in vivo, chloroquine (Wako, 036–17,972; 50 mg/g body) was injected intraperitoneally, and mice were sacrificed 6 h after injection.
ROS scavengers
Mice were intraperitoneally injected with NAC (Sigma-Aldrich, A9165) solution, which was dissolved in physiological saline, at a dose of 200 mg/kg/day daily. Cells were pretreated with 5 mmol/L NAC, 0.2 mmol/L tiron (Tokyo Chemical Industry, 149–45-1), or vehicle for 2 h. Cells were similarly pretreated with either 0.2 mmol/L L-ascorbic acid (AA; Sigma-Aldrich, A92902) or vehicle for 24 h.
Kidney biopsy specimens
Human kidney biopsy specimen collection was approved by the Nagoya City University ethics board (No. 929). All patients provided written informed consent. We obtained biopsies of renal papillary tissues from 23 patients (aged 20–80 years) with idiopathic CaOx stones, who had undergone percutaneous and retrograde intrarenal surgery during November 2013 to April 2015. Patients with active urinary tract infection, metabolic and autoimmune disease, carcinoma, and severe hydronephrosis (grade 3 or 4 according to the Society for Fetal Urology guidelines) were excluded. Samples were individually collected from two different regions in each patient: renal papillary mucosa with plaques and normal papillary mucosa without plaques as described previously [Citation9].
Kidney sections were observed using an AX80 to check for crystals. For TEM, 4% PFA kidney sections were fixed with 2.5% glutaraldehyde and observed using a JEM-1011. Sections were stained immunohistochemically and with HE, as described previously [Citation9].
Statistical analyses
Multiple group comparisons were performed using analysis of variance with the Tukey–Kramer post-hoc test using SAS version 9.1 (SAS Institute, Inc., Cary, NC). P < 0.05 was considered statistically significant.
Supplemental Material
Download PDF (6.5 MB)Acknowledgments
We thank N. Mizushima, University of Tokyo, for providing us with GFP-MAP1LC3 mice. This work was supported by Grants-in-Aid for Scientific Research from the Ministry of Education, Culture, Sports, Science and Technology, Japan (Nos. 15H05601, 16K14595, 16K20153, and 18K09173), the Takeda Science Foundation, the Aichi Kidney Foundation and Toukai Foundation for Technology.
Disclosure statement
No potential conflict of interest was reported by the authors.
Supplementary Material
Supplemental data for this article can be accessed here.
Additional information
Funding
Related Research Data
References
- Neisius A, Preminger GM. Stones in 2012: epidemiology, prevention and redefining therapeutic standards. Nat Rev Urol. 2013;10:75–77.
- Heers H, Turney BW. Trends in urological stone disease: a 5-year update of hospital episode statistics. BJU Int. 2016;118:785–789.
- Rule AD, Bergstralh EJ, Melton LJ, et al. Kidney stones and the risk for chronic kidney disease. Clin J Am Soc Nephrol. 2009;4:804–811.
- Alexander RT, Hemmelgarn BR, Wiebe N, et al. Kidney stones and kidney function loss: a cohort study. BMJ. 2009;345:e5287.
- Kum F, Mahmalji W, Hale J, et al. Do stones still kill? An analysis of death from stone disease 1999–2013 in England and Wales. BJU Int. 2016;118:140–144.
- Mulay SR, Desai J, Kumar SV, et al. Cytotoxicity of crystals involves RIPK3-MLKL-mediated necroptosis. Nat Commun. 2016;28:10274.
- Mulay SR, Eberhard JN, Desai J, et al. Hyperoxaluria requires TNF receptors to initiate crystal adhesion and kidney stone disease. J Am Soc Nephrol. 2017;28:761–768.
- Okada A, Yasui T, Fujii Y, et al. Renal macrophage migration and crystal phagocytosis via inflammatory-related gene expression during kidney stone formation and elimination in mice: detection by association analysis of stone-related gene expression and microstructural observation. J Bone Miner Res. 2010;25:2701–2711.
- Taguchi K, Hamamoto S, Okada A, et al. Genome-wide gene expression profiling of Randall’s plaques in calcium oxalate stone formers. J Am Soc Nephrol. 2017;28:333–347. 2010.
- Taguchi K, Okada A, Kitamura H, et al. Colony-stimulating factor-1 signaling suppresses renal crystal formation. J Am Soc Nephrol. 2014;25:1680–1697.
- Itoh Y, Yasui T, Okada A, et al. Preventive effects of green tea on renal stone formation and the role of oxidative stress in nephrolithiasis. J Urol. 2005;173:271–275.
- Taguchi K, Okada A, Yasui T, et al. Pioglitazone, a peroxisome proliferator activated receptor γ agonist, decreases renal crystal deposition, oxidative stress and inflammation in hyperoxaluric rats. J Urol. 2012;188:1002–1011.
- Niimi K, Yasui T, Okada A. Novel effect of the inhibitor of mitochondrial cyclophilin D activation, N-methyl-4-isoleucine cyclosporin, on renal calcium crystallization. Int J Urol. 2014;21:707–713.
- Levine B, Kroemer G. Autophagy in the pathogenesis of disease. Cell. 2008;132:27–42.
- Choi AMK, Ryter SW, Levine B. Autophagy in human health and disease. N Engl J Med. 2013;368:651–662.
- Mizushima N, Komatsu M. Autophagy: renovation of cells and tissues. Cell. 2011;147:728–741.
- Mizushima N, Levine B, Cuervo AM, et al. Autophagy fights disease through cellular self-digestion. Nature. 2008;451:1069–1075.
- Maejima I, Takahashi A, Omori H, et al. Autophagy sequesters damaged lysosomes to control lysosomal biogenesis and kidney injury. Embo J. 2013;32:2336–2347.
- Isaka Y, Takabatake Y, Takahashi A, et al. Hyperuricemia-induced inflammasome and kidney diseases. Nephrol Dial Transplant. 2016;31:890–896.
- Kimura T, Takabatake Y, Takahashi A, et al. Autophagy protects the proximal tubule from degeneration and acute ischemic injury. J Am Soc Nephrol. 2011;22:902–913.
- Takahashi A, Kimura T, Takabatake Y, et al. Autophagy guards against cisplatin-induced acute kidney injury. Am J Pathol. 2012;180:517–525.
- Kimura T, Takahashi A, Takabatake Y, et al. Autophagy protects kidney proximal tubule epithelial cells from mitochondrial metabolic stress. Autophagy. 2013;9:1876–1886.
- Namba T, Takabatake Y, Kimura T, et al. Autophagic clearance of mitochondria in the kidney copes with metabolic acidosis. J Am Soc Nephrol. 2014;25:2254–2266.
- Kohri K, Yasui T, Okada A, et al. Biomolecular mechanism of urinary stone formation involving osteopontin. Urol Res. 2012;40:623–637.
- Khan SR. Experimental calcium oxalate nephrolithiasis and the formation of human urinary stones. Scanning Microsc. 1995;9:89–100. (discussion 100–1).
- Randall A. The origin and growth of renal calculi. Ann Surg. 1937;105:1009–1027.
- Khan SR. Role of renal epithelial cells in the initiation of calcium oxalate stones. Nephron Exp Nephrol. 2004;98:e55–e60.
- Khan SR, Byer KJ, Thamilselvan S, et al. Crystal-cell interaction and apoptosis in oxalate-associated injury of renal epithelial cells. J Am Soc Nephrol. 1999;14:S457–S463.
- Settembre C, Di Malta C, Polito VA, et al. TFEB links autophagy to lysosomal biogenesis. Science. 2011;332:1429–1433.
- Settembre C, Zoncu R, Medina DL, et al. A lysosome-to-nucleus signaling mechanism senses and regulates the lysosome via MTOR and TFEB. Embo J. 2012;31:1095–1108.
- Li L, Wang ZV, Hill JA, et al. New autophagy reporter mice reveal dynamics of proximal tubular autophagy. J Am Soc Nephrol. 2014;25:305–315.
- Laplante M, Sabatini DM. MTOR signaling in growth control and disease. Cell. 2012;149:274–293.
- Gödel M, Hartleben B, Herbach N, et al. Role of MTOR in podocyte function and diabetic nephropathy in humans and mice. J Clin Invest. 2011;121:2197–2209.
- Lieberthal W, Levine JS. The role of the mammalian target of rapamycin (MTOR) in renal disease. J Am Soc Nephrol. 2009;20:2493–2502.
- Brijmohan AS, Batchu SN, Majumder S, et al. HDAC6 inhibition promotes transcription factor EB activation and is protective in experimental kidney disease. Front Pharmacol. 2018;9:34.
- Zhao X, Chen Y, Tan X, et al. Advanced glycation end-products suppress autophagic flux in podocytes by activating mammalian target of rapamycin and inhibiting nuclear translocation of transcription factor EB. J Pathol. 2018;245:235–248.
- Loverre A, Ditonno P, Crovace A, et al. Ischemia-reperfusion induces glomerular and tubular activation of proinflammatory and antiapoptotic pathways: differential modulation by rapamycin. J Am Soc Nephrol. 2004;15:2675–2686.
- Ives A, Nomura J, Martinon F, et al. Xanthine oxidoreductase regulates macrophage IL1β secretion upon NLRP3 inflammasome activation. Nat Commun. 2015;6:6555.
- Leslie NR, Bennett D, Lindsay YE, et al. Redox regulation of PI 3-kinase signalling via inactivation of PTEN. Embo J. 2003;22:5501–5510.
- Kaushal GP, Shah SV. Autophagy in acute kidney injury. Kidney Int. 2016;89:779–791.
- Sengupta S, Peterson TR, Sabatini DM. Regulation of the mTOR complex 1 pathway by nutrients, growth factors, and stress. Mol Cell. 2010;40:310–322.
- Wanner N, Hartleben B, Herbach N, et al. Unraveling the role of podocyte turnover in glomerular aging and injury. J Am Soc Nephrol. 2014;25:707–716.
- Kajiwara M, Masuda S. Role of mTOR inhibitors in kidney disease. Int J Mol Sci. 2016;17:E975.
- Mizushima N, Yamamoto A, Matsui M, et al. In vivo analysis of autophagy in response to nutrient starvation using transgenic mice expressing a fluorescent autophagosome marker. Mol Biol Cell. 2004;15:1101–1111.
- Okada A, Nomura S, Higashibata Y, et al. Successful formation of calcium oxalate crystal deposition in mouse kidney by intraabdominal glyoxylate injection. Urol Res. 2007;35:89–99.
- Honda K, Yoshimura M, Rao TN, et al. Electrogenerated chemiluminescence of the ruthenium tris (2, 2 ‘) bipyridyl/amines system on a boron-doped diamond electrode. J Phys Chem. 2003;107:1653–1663.
- Zuo L, Tozawa K, Okada A, et al. A paracrine mechanism involving renal tubular cells, adipocytes and macrophages promotes kidney stone formation in a simulated metabolic syndrome environment. J Urol. 2014;191:1906–1912.
- Pizzolato P. Histochemical recognition of calcium oxalate. J Histochem Cytochem. 1964;12:333–336.
- Kimura S, Noda T, Yoshimori T. Dissection of the autophagosome maturation process by a novel reporter protein, tandem fluorescent-tagged LC3. Autophagy. 2007;3:452–460.
- Uchimoto T, Nohara H, Kamehara R, et al. Mechanism of apoptosis induced by a lysosomotropic agent, l-leucyl-l-leucine methyl ester. Apoptosis. 1999;4:357–362.
- Thiele DL, Lipsky PE. Mechanism of l-leucyl-l-leucine methyl ester-mediated killing of cytotoxic lymphocytes: dependence on a lysosomal thiol protease, dipeptidyl peptidase I, that is enriched in these cells. Proc Natl Acad Sci USA. 1990;87:83–87.
- Mizushima N, Yoshimori T. How to interpret LC3 immunoblotting. Autophagy. 2007;3:542–545.
- Flaquer M, Lloberas N, Franquesa M, et al. The combination of sirolimus and rosiglitazone produces a renoprotective effect on diabetic kidney disease in rats. Life Sci. 2010;87:147–153.
- Bonegio RG, Fuhro R, Wang Z, et al. Rapamycin ameliorates proteinuria-associated tubulointerstitial inflammation and fibrosis in experimental membranous nephropathy. J Am Soc Nephrol. 2005;16:2063–2072.
- Thoreen CC, Kang SA, Chang JW, et al. An ATP-competitive mammalian target of rapamycin inhibitor reveals rapamycin-resistant functions of mTORC1. J Biol Chem. 2009;284:8023–8032.
- Miller S, Tavshanjian B, Oleksy A, et al. Shaping development of autophagy inhibitors with the structure of the lipid kinase Vps34. Science. 2010;327:1638–1642.