
ABSTRACT
Inactivation of the endosomal sorting complex required for transport (ESCRT) machinery has been reported to cause autophagic defects, but the exact functions of ESCRT proteins in macroautophagy/autophagy remain incompletely understood. Using live-cell fluorescence microscopy we found that the filament-forming ESCRT-III subunit CHMP4B was recruited transiently to nascent autophagosomes during starvation-induced autophagy and mitophagy, with residence times of about 1 and 2 min, respectively. Correlative light microscopy and electron tomography revealed CHMP4B recruitment at a late step in mitophagosome formation. The autophagosomal dwell time of CHMP4B was strongly increased by depletion of the regulatory ESCRT-III subunit CHMP2A. Using a novel optogenetic closure assay we observed that depletion of CHMP2A inhibited phagophore sealing during mitophagy. Consistent with this, depletion of CHMP2A and other ESCRT-III subunits inhibited both PRKN/PARKIN-dependent and -independent mitophagy. We conclude that the ESCRT machinery mediates phagophore closure, and that this is essential for mitophagic flux.
Abbreviations: BSA: bovine serum albumin; CHMP: chromatin-modifying protein; CLEM: correlative light and electron microscopy; EGFP: enhanced green fluorescent protein; ESCRT: endosomal sorting complex required for transport; HEPES: 2-[4-(2-hydroxyethyl)piperazin-1-yl]ethanesulfonic acid; HRP: horseradish peroxidase; ILV: intralumenal vesicle; MAP1LC3/LC3: microtubule-associated protein 1 light chain 3; LOV2: light oxygen voltage 2; MLS: mitochondrial localization sequence; MT-CO2: mitochondrially encoded cytochrome c oxidase II; O+A: oligomycin and antimycin A; PBS: phosphate-buffered saline; PIPES: piperazine-N,N-bis(2-ethanesulfonic acid); PRKN/PARKIN: parkin RBR E3 ubiquitin protein ligase; RAB: RAS-related in brain; SD: standard deviation; SEM: standard error of the mean; TOMM20: TOMM20: translocase of outer mitochondrial membrane 20; VCL: vinculin; VPS4: vacuolar protein sorting protein 4; Zdk1: Zdark 1; TUBG: Tubulin gamma chain
Introduction
The endosomal sorting complex required for transport (ESCRT) machinery mediates various membrane scission events within cells and seems to be dedicated to scission of small cytosol-containing double-membrane openings [Citation1–Citation3]. Examples include formation of intraluminal vesicles (ILVs) in endosomes [Citation4], daughter cell abscission during cytokinesis [Citation5], sealing of the newly formed nuclear envelope [Citation6,Citation7], and repair of damaged plasma membrane [Citation8], nuclear envelope [Citation9,Citation10], and lysosomes [Citation11,Citation12]. One of the less understood functions of this machinery is its involvement in macroautophagy/autophagy, although several studies in various cell lines and model organisms have shown that interference with ESCRT functions causes accumulation of autophagic structures [Citation13–Citation18] (see also Figure S1).
The ESCRT machinery consists of 4 subcomplexes termed ESCRT-0, ESCRT-I, ESCRT-II, and ESCRT-III, the latter regulated by the ATPase VPS4 [Citation1–Citation3]. Whereas interference with ESCRT-0 has a rather minor effect on autophagy, depletion of either ESCRT-I, ESCRT-II or ESCRT-III components causes a profound accumulation of autophagic structures [Citation14,Citation15,Citation17]. The same is the case upon depletion of VPS4 or expression of a dominant-negative VPS4 mutant [Citation13,Citation18]. The most prominent phenotypes have been reported upon ESCRT-III and VPS4 interference, suggesting that these are the most important ESCRTs in autophagy.
Four alternative, not mutually exclusive, functions for ESCRTs in autophagy have been proposed [Citation19]: 1) Regulation of pro-autophagic signalling, 2) fusion of autophagosomes with endosomes or lysosomes, 3) lysosome biogenesis, and 4) closure of the autophagosome. Although there are compelling arguments for implicating the ESCRT machinery in regulation of signalling and autophagosome fusion [Citation14–Citation16], closure of the autophagosome bears closest topological resemblance to the canonical functions of the ESCRT machinery [Citation20], and a recent paper indicates that ESCRTs may close the nascent autophagosome during starvation-induced autophagy [Citation21].
We have therefore monitored the dynamic recruitment of an ESCRT-III subunit to the nascent autophagosome during starvation-induced autophagy and mitophagy. We find that ESCRT-III is indeed recruited during a late stage of autophagosome or mitophagosome formation, with kinetics similar to those of ILV formation, and that interference with ESCRT-III functions inhibits mitophagosome closure and mitophagic flux.
Results
The ESCRT-III subunit CHMP4B is recruited to autophagosomes during starvation
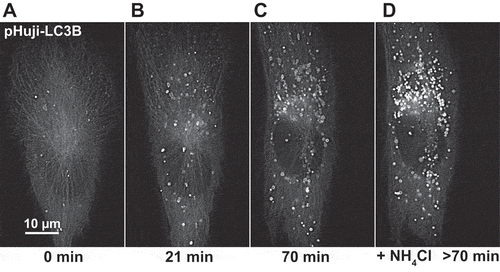
To visualize nascent autophagosomes, we used LC3B as an autophagic marker [Citation22,Citation23], tagged with the pH-sensitive red-fluorescent protein pHuji [Citation24]. We chose pHuji as fluorescent tag because its fluorescence will be quenched in the acidic lumen of the autolysosome, thus minimizing signal from autolysosomes. We generated stable retinal pigment epithelial cell (RPE-1) transfectants with low-level expression of pHuji-LC3B. Live cell imaging of these cells showed that numerous pHuji-LC3B positive structures were formed upon amino acid and serum starvation (), and there was an increase in lipidated pHuji-LC3B upon starvation (Figure S2). As expected, inhibition of autolysosomal acidification with ammonium chloride led to a profound increase in pHuji-LC3B positive structures (), consistent with the idea that pHuji-LC3B localizes to both autophagosomes and autolysosomes and that fluorescence is quenched in the latter when acidification is allowed to proceed.
Figure 1. pHuji-LC3B as autophagic marker. RPE-1 pHuji-LC3B stable transfectants were incubated with pre-warmed Live Cell Imaging Solution without amino acids for starvation and subjected to live cell fluorescence imaging using an OMX widefield microscope with red filter settings (excitation 568 nm, emission 609/37 nm). Images were recorded during starvation (A) and every 7 min, with images at 21 min (B) and 70 min (C) shown. After 70 min, NH4Cl was added to a final concentration of 10 mM (D). Note the large number of structures that become fluorescent after NH4Cl addition. The imaging series is representative of 37 independent recordings.
To monitor ESCRT recruitment to nascent pHuji-LC3B-containing autophagosomes, pHuji-LC3B-expressing RPE-1 cells were stably co-transfected at close to endogenous level with an EGFP-tagged version of CHMP4B (Figure S2), the main constituent of ESCRT-III oligomers, a construct that has previously been used for monitoring ESCRT recruitment to various other cellular membranes [Citation6,Citation8,Citation12,Citation25]. Because CHMP4B is recruited to endosomes during formation of intraluminal vesicles [Citation26], and because endosomes fuse with autophagosomes to form amphisomes [Citation27], we found it important to distinguish between CHMP4B recruitment to phagophores and amphisomes. Initial experiments using Alexa Fluor 647-tagged EGF (epidermal growth factor) or dextran failed to yield sufficiently strong labelling of the entire endocytic pathway (data not shown), and we therefore engineered RPE-1 cells with tagged early- and late-endosomal markers. For this purpose we co-expressed SNAP-tagged [Citation28] versions of the early endosomal GTPase RAB5 and the late-endosomal GTPase RAB7 [Citation29], expressed from the same weak promoter (Figure S2). RAB5 and RAB7 could thus be visualized by adding the fluorescent SNAP substrate SNAP-Cell 647-SiR to the cells. Thus, by studying triple-transfected RPE-1 cells we would be able to monitor CHMP4B recruitment specifically to nascent autophagosomes and not to early or late amphisomes, or autolysosomes.
To monitor a possible CHMP4B recruitment to newly formed autophagosomes, RPE-1 cells expressing CHMP4B-EGFP, pHuji-LC3B and SNAP-RAB5, or -RAB7 were shifted to starvation medium and immediately studied by live fluorescence microscopy using a widefield system with 3 cameras for simultaneous detection of the 3 fluorophores (). As expected, a large number of RAB5- or RAB7-positive endosomes could be detected, some of which were positive for CHMP4B (, i), and a few LC3B-positive autophagic profiles were also visible, among those some were positive for RAB5 and RAB7, indicating that they represented amphisomes (as indicated in , iii). Interestingly, we could observe transient localization of CHMP4B to LC3B-positive vesicles, including several of which were negative for RAB5 and RAB7, thus very likely representing phagophores or nascent autophagosomes (, ii), although most LC3B-positive membranes were negative for CHMP4B at any given time point (,C, iii), This suggests that ESCRT-III is indeed recruited transiently to early autophagic structures.
Figure 2. Transient autophagosomal recruitment of CHMP4B during starvation-induced autophagy. RPE-1 cells stably expressing pHuji-LC3B, CHMP4B-EGFP and SNAP-RAB5/7 were seeded 1 d before the experiment, washed 3 times with EBSS buffer, and imaged in live-cell imaging solution using an OMX Blaze widefield microscope. Images were recorded every 8 s. (A), single cell at time 0, (B), inset at time 0 with an endosome positive for CHMP4B (i) indicated. (C), inset at time 07:12 with a newly formed CHMP4B-positive autophagic structure (ii) and an amphisome (iii) indicated. (D) shows a detailed tracking of vesicle ii. Normalized fluorescence intensities over time of one representative track out of 19 tracks from 4 independent experiments. Tdwell indicates the calculated dwell time of CHMP4B. (E), dot plot of dwell times from all experiments. Mean value ± SD is indicated with black lines, and median value with a red line.
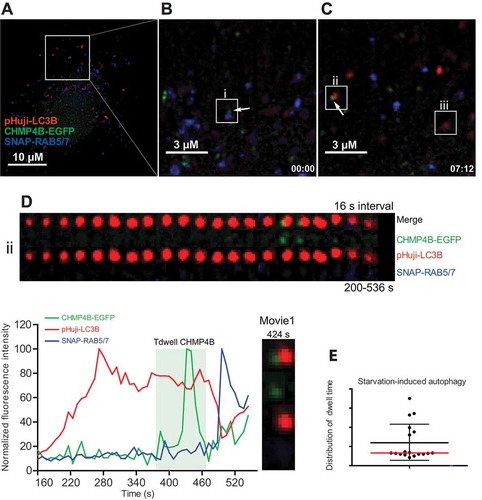
Studies of human endosomes have shown that ESCRT-III recruitment occurs very transiently (about 80 s) and correlates with formation of single ILVs [Citation26]. We thus asked whether ESCRT-III recruitment to nascent autophagosomes (phagophores) might follow similar kinetics. Tracking of individual LC3B-positive and RAB5/RAB7-negative vesicles upon starvation of RPE-1 cells showed a transient recruitment of CHMP4B with dwell times of 60 ± 47 (SD) s ( D,E and Movie 1). These dynamics of CHMP4B recruitment are consistent with a function for ESCRT-III in a membrane sealing event at the nascent autophagosome.
ESCRT-III is recruited to nascent mitophagosomes
The relatively small size of starvation-induced autophagosomes in RPE-1 cells made it challenging to track ESCRT-III recruitment, especially because of movements in and out of the focal plane. We therefore also considered ESCRT recruitment to larger autophagic membranes during selective autophagy. For this purpose we chose to monitor autophagy of mitochondria, mitophagy [Citation30], because mitochondria are relatively large organelles that are easy to image by fluorescence microscopy. In order to label mitochondria, we transfected RPE-1 cells stably expressing CHMP4B-EGFP and pHuji-LC3B with a SNAP-tag construct targeted to the mitochondrial outer membrane with the mitochondrial localization sequence (MLS) of Saccharomyces cerevisiae Tom70. By fluorescence microscopy, the Tom70-positive mitochondria labeled with SNAP-substrate could be detected throughout the cell as elongated structures ().
Figure 3. Transient mitophagosomal recruitment of CHMP4B during starvation. RPE-1 cells stably expressing CHMP4B-EGFP and pHuji-LC3B were transiently transfected for 24 h with SNAP-Tom70. At the day of experiment, cells were incubated with SNAP-Cell 647-SiR for 30 min, then washed with EBSS 3 times and incubated in EBSS for 30 min, before transfer to live imaging solution for live microscopy. Images were recorded every 3 s for 15 min. (A), single cell at time 0, (B), inset at time 0 with an LC3B-surrounded mitochondrion is indicated. (C), inset at time 03:00 showing CHMP4B recruitment to mitophagosome i. (D), tracking of mitophagic profile i at 10 s intervals for 290 s. Normalized fluorescence intensities over time of one representative track out of 19 tracks from 2 independent experiments. Tdwell indicates the calculated dwell time of CHMP4B. (E), dot plot of dwell times from all experiments. Mean value ± SD is indicated with black lines, and median value with a red line.
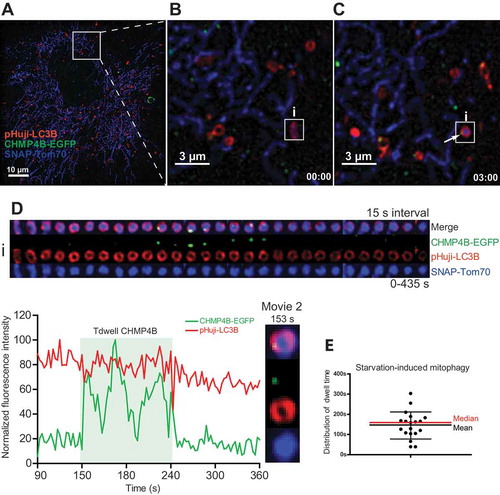
One way to induce mitophagy is by long-term amino acid starvation [Citation31]. We therefore starved the transfected RPE-1 cells for up to 24 h and then monitored them by live microscopy. Even though mitophagy was observed infrequently during these conditions, we could observe Tom70-positive mitochondria that were engulfed by LC3B-containing membranes (, Movie 2). Like with starvation-induced formation of canonical autophagosomes, recruitment of CHMP4B to mitochondria-containing autophagic structures was transient. Tracking of individual CHMP4B recruitment events showed a duration of 147 ± 67 (SD) s ( and Figure S3). We noted that CHMP4B recruitment consistently occurred when the mitochondria-containing LC3B vesicles had acquired a round shape (see Movie 2). This would be consistent with a function for ESCRT-III in sealing of the forming mitophagosomes.
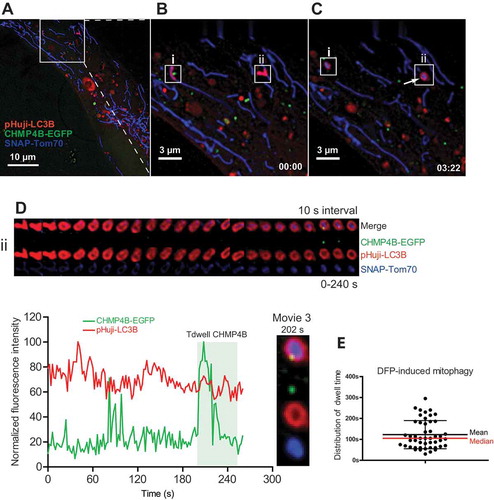
Because starvation-induced mitophagic events were relatively rare, we also studied ESCRT recruitment under conditions of more severe cellular stress, at which mitophagy is more prominent. For this purpose we incubated transfected RPE-1 cells with the iron chelator deferiprone (DFP), which is a known inducer of metabolic stress and PRKN/PARKIN-independent mitophagy [Citation31]. After more than 7 h of DFP incubation, we started to observe multiple events of Tom70-positive mitochondria being engulfed by LC3B-containing autophagic membranes (). Tracking of individual events of CHMP4B recruitment ( and Movie 3) showed dwell times of 122 ± 67 (SD) s (). Also in these cases we detected CHMP4B recruitment only around mitochondria-containing autophagosomes, consistent with a role for ESCRT-III in autophagosome sealing (Movie 3). We were able to observe formation of a mitophagosome from the very early moment when LC3B occured until the engulfed Tom70 structure gained a round shape before CHMP4B recruitment. The dwell time of CHMP4B was considerably shorter than the time of formation of a mitophagosome, which was estimated to be 465 ± 111 (SD) s, measured as the time between LC3B appearance and the beginning of CHMP4B association (Figure S4).
Figure 4. Transient mitophagosomal recruitment of CHMP4B upon DFP treatment. RPE-1 cells stably expressing CHMP4B-EGFP and pHuji-LC3B were transiently transfected with SNAP-Tom70 the day before the experiment, then incubated with 1 mM DFP for 12 h. The DFP-treated cells were incubated with SNAP-Cell 647-SiR for 30 min, then washed with EBSS 3 times and incubated for 30 min in EBSS and transferred to live imaging buffer containing 20 mM glucose for live microscopy. Images were recorded every 2 s for 15 min. (A), single cell at time 0, (B), inset at time 0 with 2 LC3B-surrounded mitochondria (i,ii) indicated. (C), inset at time 03:22 showing CHMP4B recruitment to mitophagosome ii. Note that the CHMP4B-positive structure close to i is a separate vesicle, probably an endosome passing by. (D), tracking of mitophagic profile ii at 3 s intervals for 240 s. Normalized fluorescence intensities over time of one representative track out of 48 tracks from 5 independent experiments. Tdwell indicates the calculated dwell time of CHMP4B. (E), dot plot of dwell times from all experiments. Mean value ± SD is indicated with black lines, and median value with a red line.
ESCRT-III is recruited at a late stage of mitophagosome formation
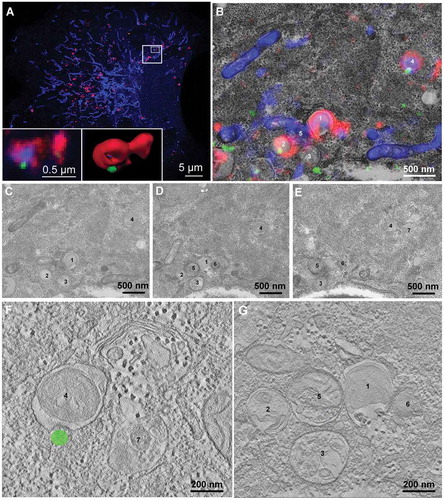
In order to study recruitment of CHMP4B to nascent mitophagosomes at the ultrastructural level, we performed correlative light and electron microscopy (CLEM) in combination with electron tomography of cells expressing CHMP4B-EGFP, pHuji-LC3B and SNAP-Tom70. Mitophagosomes positive for all 3 markers were identified by confocal microscopy (, Imaris rendering in insets) and then overlaid with the appropriate image from serial EM sections () for the CLEM montage (from ). Typical examples of LC3B-surrounded mitochondria are annoted (number 1 and 4 in ). Further examination of these compartments by electron tomography clearly revealed their mitochondrial content. The membrane composition, however, remained somewhat unclear although several membrane layers are clearly visible in (structure 4) and (structure 1), as well as in Figure S5. The Imaris reconstruction in combination with the CLEM allowed us to pinpoint the presumable CHMP4B-EGFP localization on structure 4 ( and Figure S5), without indication of membrane discontinuity. These results indicate that ESCRT-III is recruited at a late stage in mitophagosome biogenesis, consistent with a function in phagophore closure.
Figure 5. Ultrastructural analysis of CHMP4B recruitment during mitophagy. RPE-1 cells stably expressing CHMP4B-EGFP and pHuji-LC3B were transiently transfected with SNAP-Tom70 the day before the experiment, then incubated with 1 mM DFP for 12 h. Cells were fixed and Airyscan confocal images were obtained using a Zeiss LSM880 Airyscan microscope. Structures positive for CHMP4B-EGFP, pHuji-LC3B and SNAP-Tom70 were identified and studied by correlative light/electron microscopy and electron tomography in a 200 kV Talos electron microscope (Thermo Fisher). Single optical sections of Airyscan micrographs are shown in (A) (optical section no. 4) and (B) (optical section no. 3). The boxed area in (A) is shown magnified and overlaid on the electron micrograph (B). Three consecutive serial sections (200 nm each) of this area are shown in panels (C), (D) and (E), with 7 structures annotated. The lower panels, (F) and (G), show tomogram slices of the indicated structures (1 and 4) at high magnification with the correlative localization of the CHMP4B-EGFP signal (F). Structure no. 4 is a mitochondrion (blue) surrounded by LC3B-positive membranes (red), and recruited CHMP4B-EGFP (green) is visible in the Airyscan micrograph (A), left inset, and the Imaris 3D-rendering (A), right inset, and also indicated in the CLEM montage (B). Different tomogram sections of structure no. 4 at higher magnification are shown in Suppl.Fig. S5. Scale bars as indicated. Tomogram pixel size 1.5 nm.
CHMP4B is hyper-recruited to mitophagosomes upon depletion of CHMP2A
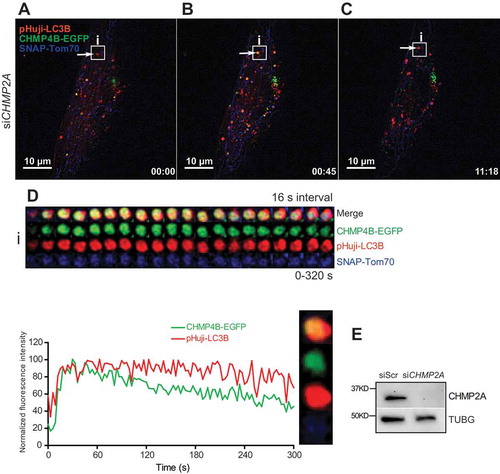
CHMP4 or its yeast ortholog Snf7/Vps32 is the main constituent of ESCRT-III filaments, whereas other ESCRT-III subunits are thought to have accessory functions [Citation32,Citation33]. Specifically, Vps20/CHMP6 mediates ESCRT-III recruitment to ESCRT-II, Vps24/CHMP3 terminates or modifies Snf7/CHMP4 oligomerization, and Vps2/CHMP2 recruits VPS4 to the ESCRT-III filaments [Citation32]. Consistent with this notion, we have previously found that depletion of CHMP2A causes hyper-accumulation of CHMP4B during nuclear envelope sealing and lysosome repair, accompanied by ESCRT dysfunctions [Citation6,Citation12]. We therefore asked whether depletion of CHMP2A would influence the dwell time of CHMP4B on autophagosomes. Microscopy of control siRNA-transfected RPE-1 cells treated with DFP showed that CHMP4B transiently associated with nascent mitophagosomes after they had developed and acquired a round shape (Figure S4A-D, i,ii, Movie 4), similar to what was observed in untransfected cells (). In contrast, CHMP2A-depleted cells displayed a strong increase in CHMP4B residence on mitophagosomes (, i). Tracking of individual vesicles showed that the dwell time of CHMP4B on these autophagic structures exceeded 500 s and lasted beyond the end of tracking, a more than 2-fold increase from control cells (, Movie 5). We conclude that CHMP4B dynamics on nascent autophagosomes are regulated by CHMP2A. As expected, we also observed increased recruitment of CHMP4B-EGFP to LC3B-negative endosomes in CHMP2A-depleted cells (Movie 5).
Figure 6. Sustained mitophagosomal recruitment of CHMP4B upon CHMP2A depletion. RPE-1 cells stably expressing CHMP4B-EGFP and pHuji-LC3B were transfected with siRNA against CHMP2A for 48 h and then transiently transfected with SNAP-Tom70 before incubation with 1 mM DFP for 12 h. The DFP-treated cells were incubated with SNAP-Cell 647-SiR for 30 min, then washed with EBSS 3 times and incubated for 30 min in EBSS and transferred to live-cell imaging buffer containing 20 mM glucose. Images were recorded every 3 s for 15 min. (A), single cell at time 0, with example of CHMP4B-containing mitophagosome (i) indicated. The increase in CHMP4B-EGFP and pHuji-LC3B signal during the first frames is due to focal movement. (B), the same cell at time 0:45. (C), the same cell at time 11:18. (D), tracking of mitophagosome i over 320 s. Normalized fluorescence intensities over time of one representative track out of 15 tracks from 2 independent experiments. Relative amplitude differences between different trackings are related to the different total fluorescence intensities. (E), western blot showing the efficiency of CHMP2A knockdown.
A novel optogenetic closure assay indicates that CHMP2A mediates mitophagosome sealing
The transient recruitment of ESCRT-III to nascent mitophagosomes would be consistent with a role for ESCRTs in mitophagosome sealing, and we wanted to test this experimentally. To this end, we developed a novel optogenetic assay for detection of sealed vs open mitophagosomes, based on the LOVTRAP system for photoinduced protein dissociation [Citation34]. LOVTRAP utilizes the light sensitive association between the light-oxygen-voltage 2 (LOV2) domain from Avena sativa phototropin 1 and the protein A-derived ligand Zdk1. For our assay we used LOV2 fused with the N terminus of the mitochondrial outer membrane protein TOMM20 (NTOMM20), and Zdk1 fused with mCherry [Citation34] (). The association between NTOMM20-LOV2 and cytosolic mCherry-Zdk1 causes mitochondria to be positive for mCherry. Upon exposure of the cells to 488 nm wavelength light, the LOV2 domain dissociates from Zdk1 and mCherry-Zdk1 reversibly translocates from mitochondria to cytosol until the 488 nm light is turned off. We reasoned that if mitochondria are enclosed by sealed autophagic membranes, the release of mCherry-Zdk1 into the cytosol should be inhibited. Conversely, if sealing is inhibited, mCherry-Zdk1 release should occur even if the mitochondrion is surrounded by SNAP-LC3B.
Figure 7. Optogenetic assay of mitophagosome closure. (A), Schematic representation of the optogenetic mitophagosome closure assay. Labelling of mitochondria as cargo was achieved by expression of NTOMM20-LOV2 and Cherry-Zdk1. Upon exposure of cells to 488 nm wavelength light, the mCherry-Zdk1 probe reversibly dissociates from the NTOMM20-LOV2 into the cytoplasm. With time mCherry-Zdk1 associates again with the LOV2-domain. Upon closure of autophagosomes during mitophagy around mitochondria, the release of mCherry-Zdk1 is inhibited and the mitochondria remain fluorescent. If closure is inhibited, mCherry fluorescence is transiently lost. Using this system unclosed autophagosomes should be observed by fluctuations in mCherry fluorescence intensity upon repeated pulses of light exposure. (B), RPE-1 cells stably expressing SNAP-LC3B and transiently expressing NTOMM20-LOV2 and mCherry-Zdk1 were treated with DFP. Live cell imaging was performed to follow autophagosome formation around damaged mitochondria. Cells were imaged every 2 s and exposed to 488 nm light every 12 time points. Fluorescence intensity was measured for each track and the corresponding gallery added. Time points of light exposure are indicated by the orange triangle.
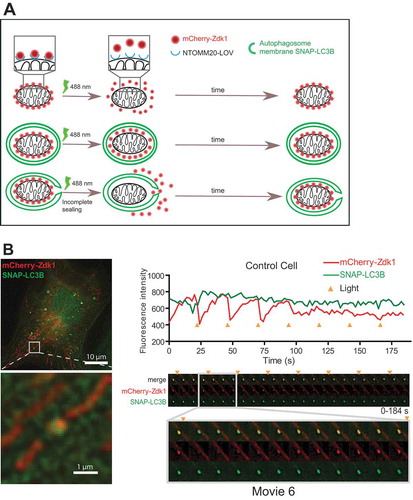
Control experiments with DFP-treated RPE-1 cells expressing NTOMM20-LOV2, mCherry-Zdk1 and SNAP-LC3B showed that mitochondria were indeed positive for mCherry-Zdk1, which instantly dissociated from the mitochondria when exposed to 488 nm light. This dissociation was rapidly reversible upon shutting off the 488 nm illumination (), Some of the mCherry-Zdk1 positive mitochondria were also positive for SNAP-LC3B, indicating that they were subject to mitophagy. Importantly, mCherry-Zdk1 in these mitophagosomes was, in general, insensitive to 488 nm light, indicating that the mitophagosomes were sealed. However, in a rare case we could observe an LC3B-positive structure with light sensitive mCherry-Zdk1 which became light resistant over time (, Movie 6). We interpret this as a mitophagosome that was sealed during the course of imaging.
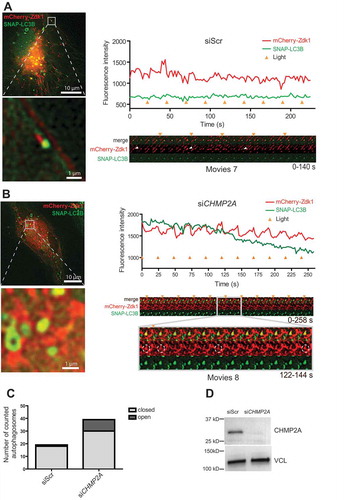
In cells treated with control siRNA, only 5% of the LC3B- and mCherry-Zdk1-positive structures were sensitive to 488 nm light (, Movie 7), indicating that almost all mitophagosomes are closed at any time. To test the possible function of ESCRT-III in mitophagosome sealing, we chose to deplete cells of CHMP2A because depletion of this subunit strongly inhibits nuclear envelope sealing [Citation6] and because CHMP2A depletion caused a strongly increased mitophagosomal dwell time of CHMP4B (). Interestingly, in CHMP2A-depleted cells, 23% of LC3B and mCherry-Zdk1-positive structures were sensitive to 488 nm light (, Movie 8, knockdown efficiency confirmed in ). By comparing the light sensitivity of mCherry-Zdk1 containing mitophagosomes in control and CHMP2A-depleted cells () we conclude that a large proportion of the latter contained unsealed mitophagosomes. This is consistent with a role for CHMP2A in phagophore closure.
Figure 8. CHMP2A depletion inhibits mitophagosome closure. (A, B), Example galleries and vesicle tracks for mitophagy closure assay. Cells stably expressing SNAP-LC3B and transiently expressing NTOMM20-LOV2 and Cherry-Zdk1 were treated with DFP. Live cell imaging was performed to follow autophagosome formation around damaged mitochondria. Cells were imaged every 2 s and exposed to 488 nm light every 12 time points. Fluorescence intensity was measured for each track and the corresponding gallery added for a scrambled siRNA transfected cell (A) and a CHMP2A knockdown cell (B). Time points of light exposure are indicated by the orange triangle. (C), Graph comparing the amount of closed autophagosomes to open autophagosomes in cells treated with control scrambled siRNA or CHMP2A siRNA. Data represent tracking of 19 profiles for control siRNA- and 40 profiles for CHMP2A siRNA-treated cells from 2 independent experiments. (D), Knockdown efficency of CHMP2A as detected by western blotting for 2 live cell imaging experiments.
To further evaluate the effect of ESCRT inactivation mitophagosome integrity, we studied mitochondria-containing pHuji-LC3B- and CHMP4B-EGFP-positive structures of VPS4A/B-depleted RPE-1 cells by CLEM. This analysis showed mitochondria surrounded by aberrant membranes (Figure S6), similar to what has previously been observed with faulty nuclear envelope sealing upon ESCRT inactivation [Citation6]. This supports the notion that a functional ESCRT-III machinery is required for proper mitophagosome sealing.
ESCRT-III is required for PRKN-independent and -dependent mitophagy
If ESCRT-III is indeed involved in closure of mitophagosomes, one would predict that its dysfunction would impair mitophagic flux. To address this issue we took advantage of a newly developed mitophagic flux reporter, based on fusion of an MLS to green-fluorescent EGFP and red-fluorescent mCherry [Citation31,Citation35,Citation36]. When this construct is targeted to mitochondria, yellow fluorescence will be detected because of the overlapping EGFP and mCherry signals, while mitochondria-containing autolysosomes only will emit red fluorescence due to quenching of EGFP at the low pH found in the autolysosome lumen. U2-OS cells with stable inducible expression of the MLS-EGFP-mCherry construct were used to monitor mitophagy in control versus ESCRT-depleted cells treated with DFP for 24 h ( and Figure S7). Interestingly, both CHMP2A and CHMP4B depletion caused a marked reduction in DFP-induced mitophagy as analyzed by quantification of red only structures, as did co-depletion of the 2 VPS4 isoforms, VPS4A and VPS4B (). Thus, we conclude that ESCRT-III is required for DFP-induced, PRKN-independent mitophagy.
Figure 9. ESCRT depletion inhibits mitophagy. ((A), U2-OS cells expressing the MLS-EGFP-mCherry probe were treated with the indicated siRNAs for 24 h, then incubated with DFP for 24 h, and mitophagy was measured as described in Materials and Methods. Representative microscopy images are shown to the left, and the quantifications based on 3 independent experiments are shown to the right. Knockdown efficiency, as determined by real-time PCR, is shown in Suppl. Fig. S7. An illustration of the principle of the assay is included. (B), U2-OS cells expressing the MLS-EGFP-mCherry probe and PRKN were treated with the indicated siRNAs for 24 h, then incubated with oligomycin and antimycin A (O + A) for 6 h, and mitophagy was measured as described in Materials and Methods. Examples of microscopy images are shown to the left, and the quantifications based on 3 independent experiments are shown to the right.
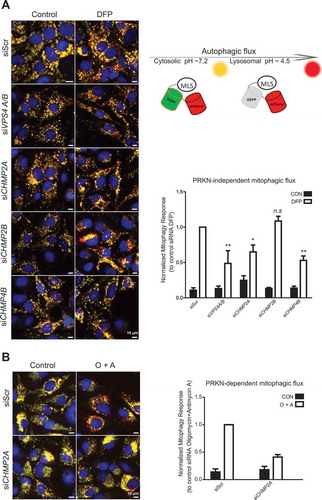
PRKN-dependent mitophagy is a well-characterized mechanism for degradation of depolarized mitochondria [Citation30]. U2-OS MLS-EGFP-mCherry cells stably expressing PRKN were incubated with oligomycin and antimycin A for 6 h to induce mitophagy [Citation36]. Like with PRKN-independent mitophagy, we detected a profound inhibition of mitophagy after CHMP2A depletion ().
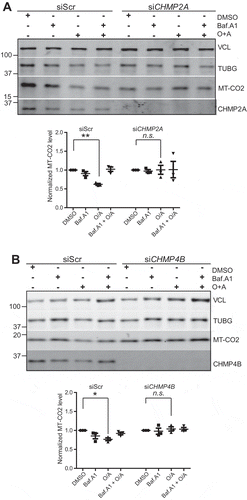
In order to verify that mitophagic degradation is ESCRT-dependent, we also monitoried degradation of the mitochondrial inner membrane protein, MT-CO2/COX-II (mitochondrially encoded cytochrome c oxidase II) by western blotting. This protein was found to be partially degraded in a pH-dependent manner (as measured with bafilomycin A1 sensitivity) upon induction of PRKN-dependent mitophagy, whereas siRNA-mediated depletion of CHMP2A or CHMP4B abolished this degradation (). Taken together, our data show that ESCRT-III is required for both PRKN-dependent and -independent mitophagy flux, consistent with a role for ESCRT-III in autophagosome sealing.
Figure 10. CHMP2A or CHMP4B depletion inhibits PRKN-dependent mitophagic protein degradation. U2-OS cells expressing PRKN were treated with scrambled siRNA or siRNA against CHMP2A (A) or CHMP4B (B) and incubated with or without oligomycin (10 μM), antimycin A (1 μM) and bafilomycin A1 (100 nm) at 37°C for 12 h, and cell lysates were analyzed by SDS-polyacrylamide gel electrophoresis followed by western blotting (middle panel) against MT-CO2. Antibodies against VCL and TUBG were used as loading controls. The V-ATPase inhibitor bafilomycin A1 was used to evaluate the importance of acidification and thus membrane closure for MT-CO2 degradation. Quantifications from 3 independent experiments are shown in the lower panel, with mean values ± SEM indicated. *, p < 0.05; **, p < 0.005.
Discussion
It has remained an open question how the phagophore is sealed to form an autophagosome [Citation19,Citation37]. Here we have used live microscopy, electron microscopy and a novel optogenetic assay to show that phagophore closure during mitophagy is mediated by ESCRT-III. This is consistent with a recent study of starvation-induced autophagy which used selective ligand accessibility of Halo-tagged LC3 to show that CHMP2A is required for autophagosome sealing in permeabilized cells [Citation21], and also with recent results showing a requirement for ESCRT-III in autophagosome sealing in budding yeast as measured with a protease protection assay [Citation38]. In addition, our studies have revealed the dynamics of ESCRT-III recruitment during starvation-induced autophagy and mitophagy, and the dynamics of mitophagosome formation. Our findings are in agreement with the canonical functions of ESCRT-III, namely in scission of cytosol-containing double-membrane openings, a topology shared with phagophore closure [Citation39].
We measured the dwell time of CHMP4B-EGFP on the starvation-induced autophagosome to less than 1 min, which is slightly shorter than the published dwell time of 80 s for CHMP4B-EGFP on endosomes during formation of intraluminal vesicles [Citation26]. It is interesting that we consistently measured the somewhat longer dwell times over 2 min for CHMP4B-EGFP on mitophagosomes during their biogenesis, which are to be compared with about 8 min for the entire biogenesis of a mitophagosome. It is not clear why closure of a phagophore surrounding a mitochondrion would take longer time than closure of a smaller cytosol-filled phagophore, but we speculate that the differences might be related to the size/volume differences of the 2 types of phagophores.
Can defective autophagosome closure explain the pronounced accumulation of autophagosome-like structures observed in ESCRT-depleted cells [Citation13–Citation18]? It is interesting to note that STX17 (syntaxin17), which mediates fusion of autophagosomes with lysosomes, is only recruited to the autophagosome after it has been sealed [Citation40]. Thus, one would expect unsealed autophagosomes to accumulate if sealing is inhibited. Given that the annulus closed by ESCRT-III is likely to be very small, based on knowledge from other ESCRT-mediated scission events [Citation5,Citation7,Citation8], detection of unsealed phagophores by electron microscopy would be very difficult, and unsealed phagophores might therefore easily be interpreted as autophagosomes. This could, at least in part, explain the increased autophagosome numbers reported in ESCRT-depleted cells.
The involvement of ESCRT-III in phagophore closure raises the question of how this multimeric complex is recruited to the phagophore. Given that both ESCRT-I and ESCRT-II depletion results in autophagosome accumulation, albeit with lower penetrance than ESCRT-III depletion [Citation14–Citation16], it is possible that ESCRT-III is recruited via these upstream ESCRTs, similar to what is the case during ILV formation, cytokinetic abscission and lysosome repair [Citation5,Citation11,Citation12,Citation41,Citation42]. On the other hand, there are also multiple examples of ESCRT-III recruitment in the absence of ESCRT-I and -II [Citation1], so further studies will be required to clarify the issue of ESCRT recruitment to phagophores.
Even though CHMP2A depletion led to a marked increase in the fraction of unclosed mitophagosomes, the majority of mitophagosomes appeared sealed even in CHMP2A-depleted cells. Because the knockdown efficiency was high, it is unlikely that this can be attributed to remaining CHMP2A protein sufficient to seal phagophores. More likely, the number of open mitophagosomes might be underestimated because of restricted diffusion of mCherry-Zdk1 out of phagophores with very small openings. We also cannot rule out the possibility that alternative mechanisms for mitophagosome sealing exist, which are independent of CHMP2A and other ESCRTs.
The notion that ESCRT-III mediates phagophore closure does not exclude the possibility that ESCRT proteins have additional functions in autophagy. Studies of ESCRT knockdown phenotypes in the nematode C.elegans have suggested that autophagosome accumulation is secondary to formation of enlarged endosomes and increased pro-autophagic signalling [Citation16]. It also remains a possibility that ESCRT proteins mediate fusion of autophagosomes with endosomes or lysosomes, although direct evidence for this is still lacking. Because at least some lysosomal enzymes follow the ILV pathway [Citation43,Citation44], it is also plausible that lysosome biogenesis, which is essential for autophagic flux [Citation45], could be affected by ESCRT depletion. Indeed, the complex phenotypes observed in ESCRT-depleted cells would be consistent with the functions of ESCRT proteins at several steps in the autophagic pathway.
Materials and methods
Cell culture and generation of stable cell lines
hTERT-RPE-1 cells (human retinal pigment epithelial cells immortalized with telomerase) and stable cell lines derived from these cells were maintained in F12/Dulbecco’s Modified Eagle’s Medium high glucose (DMEM, Sigma-Aldrich, D0819), supplemented with 10% fetal bovine serum (Sigma Aldrich, F7524), 100 U/ml penicillin and 100 μg/ml streptomycin. All cells were cultured at 37°C supplemented with 5% CO2. For amino acid and growth factor starvation experiments, the growth medium was removed, cells washed 3 times and the medium replaced with EBSS (GIBCO BRL, 24,010–043) or Live Cell Imaging Solution (Molecular Probes, A14291DJ), supplemented with 20 mM glucose (Merck, 108,342) in experiments with DFP treatment. U2-OS FlpIN TRex cells and stable cell lines derived from these were grown and maintained in a complete DMEM (Lonza, 12-741F) supplemented with 10% fetal bovine serum, 100 U/ml penicillin and 100 µg/ml streptomycin (ThermoFisher Scientific, 15,140,122) in a humidified incubator at 37°C with 5% CO2.
All other stable cell lines used in this study were lentivirus-generated pools, using plasmids (described below) pCDH-PGK-Tom70-3xSNAPf-IRES-Blast, pCDH-PGK-pHuji-LC3B-IRES-Neo, pCDH-PGK-SNAP-RAB5-IRE S-SNAP-RAB7-IRES-Neo and pCDH-PGK-CHMP4B-EGFP-IRES-Puro for stable expression of SNAP-Tom70, pHuji-LC3B, SNAP-LC3B, SNAP-RAB5/7 and CHMP4B-EGFP, respectively. The weak PGK promoter was used for transgene expression at rather low expression levels. Third generation lentivirus was generated as previously published in [Citation46]. Briefly, pHuji, SNAP-, mCherry or EGFP fusions were generated as Gateway ENTRY plasmids using standard molecular biology techniques. From these vectors, lentiviral transfer vectors were generated by recombination into customized pCDH (System Biosciences CD532-A) Destination vectors using a Gateway LR reaction. VSV-G pseudotyped lentiviral particles were packaged using a third-generation packaging system that was a gift from Didier Tromo (deposited by Tromo at Addgene, 12,251, 12,253 and 12,259). Cells were then transduced with low virus titers and stable expressing populations were generated by antibiotic selection. RPE-1 CHMP4B-EGFP cells were sorted by flow cytometry for lower expression, and additional tagged proteins were introduced by viral transduction when needed.
Materials
Complete protease inhibitor cocktail was from Roche Diagnostics (05056489001). Rabbit anti-CHMP4B was described previously [Citation47]. Rabbit anti-CHMP2A (10,477–1-AP) was purchased from Proteintech. Rabbit anti-LC3B (2775s), from Cell Signalling Technology. Mouse anti-VCL (vinculin, v9131), mouse anti-TUBG/γ-Tubulin (T6557) from Sigma-Aldrich. Mouse anti-MT-CO2 was from Abcam (ab110258). Mouse anti-RAB5 (sc-46,692), rabbit anti-RAB7 (sc-10,767) were from Santa Cruz Biotechnology. Deferiprone (DFP) (379,409), oligomycin A (O4876), antimycin A (A8674), bafilomycin A1 (B1793), BSA (A7030) were from Sigma-Aldrich.
Plasmids
The mitochondrially targeted SNAP-tag plasmid encodes the first 38 amino acids of the Saccharomyces cerevisiae Tom70 as an MLS, followed by the blue fluorophore TagBFP2 and 3 codon-shuffled SNAP-tag moieties. The construct was made as 3 synthesized fragments (IDT, IA, USA), cloned by Gibson Assembly (New England Biolabs, MA, USA) into a customized Gateway compatible (Life Technologies, CA, USA) vector between NheI and NotI restriction sites and verified by Sanger sequencing. Expression plasmids were obtained by Gateway reactions into a pcDNA3.1 (ThermoFisher Scientific, V79020) based plasmid modified to be Gateway compatible and expressed under a CMV promoter. The LOVTRAP plasmids [Citation34] pTriEX-NTOMM20-LOV (Addgene, 81,009) and pTriEX-mCherry-Zdk1 (Addgene, 81,057) were a gift from the depositing lab, Klaus Hahn. For the SNAP-RAB5/RAB7 vector, RAB5 was inserted by ligation (AgeI/SalI) while SNAP-RAB7 was inserted by Gibson Assembly (vector opened BspEI/XmaI). SNAP-LC3B was assembled using Gibson Assembly (XhoI/BamHI) into the pSNAP-C1 vector backbone (based off the pEGFP vector series, Takara Bio Europe). To generate pSNAP-C1, EGFP in pEGFP-C1 was replaced with a synthetic gene fragment encoding the SNAP tag. To construct lentiviral vectors expressing pHuji-LC3B, the open reading frame of pHuji was synthesized as Genestring (Thermo Fisher). The GFP open reading frame in pEGFP-C3-LC3B (Addgene, 11,546, deposited by Karla Kirkegaard) was replaced with a synthetic gene fragment encoding the pHuji ORF (Thermo Fisher Geneart), using Gibson assembly. The resulting pHuji-LC3B fusion was subcloned,using NheI/BamHI, into a custom-synthesized Gateway-enabled vector (pENTR20,). pENTR20 was generated by cutting pEGFP-C1 (Clontech, 6084–1) using AseI and MfeI. Into the cut vector, a synthesized gateway cassette, containing AttL and AttR sites, a multiple cloning site, and a mNeonGreen stuffer fragment, was inserted by Gibson assembly. The resulting vector, pENTR20-pHuji-LC3B, was used to generate lentiviral vectors (pCDH-PGK-pHuji-LC3B-IRES-Neo, pCDH-EF1a-pHuji-LC3B-IRES-Neo) by Gateway cloning.
siRNA transfection
Silencer Select siRNAs against human CHMP2A, CHMP2B, VPS4A, VSP4B, or CHMP4B, and nontargeting control “scrambled” siRNA (predesigned, 4,390,844) were purchased from Ambion® (Thermo Fisher Scientific). Cells at 50% confluency were transfected with 10–20 nM final siRNA concentration using Lipofectamine RNAiMax transfection reagent (Life Technologies, 13,778–150) according to the manufacturer’s instructions and used for experiments after 20 h (VPS4A/B), 48 h (CHMP2A) or 96 h (CHMP4B).
siRNA oligonucleotides
All siRNA oligonucleotides () have been validated previously for target specificity [Citation6,Citation26]. Knockdown levels were routinely confirmed by western blotting.
Table 1. siRNA oligonucleotides used.
Immunoblotting
Cells were washed with cold PBS and lysed in 2X Laemmli Sample Buffer (Bio-Rad Laboratories, 1,610,737). Whole-cell lysates were subjected to SDS-PAGE on 4–20% gradient gels (mini-PROTEAN TGX; Bio-Rad). Proteins were transferred to polyvinylidene difluoride (PVDF) membranes (TransBlot® TurboTM LF PVDF, Bio-Rad) followed by blocking in 3% BSA and antibody incubation in Tris-buffered saline with 0.1% Tween-20 (Sigma-Aldrich, P1379). Membranes incubated with fluorescent secondary antibodies (IRDye 680 rabbit, 926–68,073; IRDye 680 mouse, 926–68,072; IRDye 800 rabbit, 926–32,213; IRDye 800 mouse, 926–32,212)) were developed with an Odyssey infrared scanner (LI-COR Biosciences), whereas those incubated with HRP (horseradish peroxidase)–conjugated antibodies (HRP rabbit, 111 035 144; HRP mouse, 115 035 146) were developed using Clarity western ECL substrate solutions (Bio-Rad) with a ChemiDoc XRS+ imaging system (Bio-Rad).
Live-cell imaging and quantitative image analysis
RPE-1 cells stably expressing fluorescently tagged endocytic markers (RAB5, RAB7), LC3B, Tom70 or CHMP4B were seeded in MatTek 35 mm glass-bottom dishes (MatTek Corporation, P35G-1.5–20-C) the day before the experiement. For imaging, the medium was removed and replaced by pre-warmed Live Cell Imaging Solution (in the case of DFP-induced mitophagy, containing 20 mM glucose). Live-cell imaging was performed on an OMX V4 system (DeltaVision OMX Microscope Applied Precision, GE Healthcare) equipped with an Olympus 60x Plan Apochromat 1.42 numerical aperture objective, 3 cooled sCMOS cameras, a solid-state light source and a laser-base autofocus. Environmental control was provided by a heated stage, and an objective heater. 5% CO2 and humidity was provided via a CO2 mixer (Okolab). Time-lapse images were acquired every 2–8 s (depending on expression level) over a total time period of 15–20 min. Images were deconvolved and aligned using Softworx software (Applied Precision, GE Healthcare) and further processed in ImageJ/FIJI (https://imagej.net/Fiji). A custom-made Python script was used to manually track the recruitment of ESCRT-III (CHMP4B) in the individual LC3B-positive structures and to measure their fluorescence intensity over time [Citation26].
Correlative light and electron microscopy (CLEM)
For CLEM, RPE-1 cells stably expressing fluorescently tagged LC3B, Tom70 and CHMP4B were plated on gridded 35 mm Matek dishes (MatTek Corporation P35G-1.5–14-CGRD) and initially fixed with 4% formaldehyde and 0.1% glutaraldehyde in 0.1 M PHEM buffer (240 mM PIPES, 100 mM HEPES, 8 mM MgCl2, 40 mM EGTA, pH 6.9) for 15 min at 37°C. For immunofluorescence microscopy, the cells were overlayed with ProLong Diamond Antifade Mountant (Thermo Fisher Scientific), and imaged on a Zeiss LSM 880 Airyscan microscope (Carl Zeiss MicroImaging GmbH, Jena, Germany), using a Zeiss plan-Apochromat 63xNA/1.4 oil DICII objective, and the Airyscan detector in superresolution mode. Twelve z-sections were acquired to cover the majority of the cell volume giving images with voxel size 0,0426 x 0,0426 x 0,1850 µm. Airyscan raw images were processed using the Array Detector Optical option within Huygens Essential version 18.10 (Scientific Volume Imaging B.V., Hilversum, The Netherlands). Images were corrected for chromatic aberrations in Huygens Essential and further processed in Fiji/ImageJ software or 3D-rendered in Imaris 7.7.2 (Bitplane AG, Zürich, Switzerland).
After light microscopy cells were further fixed in 2% glutaraldehyde in 0.1 M PHEM buffer for 1 h. Postfixation was done in 1% OsO4 and 1.5% KFeCN in the same buffer. Samples were further stained en bloc with 4% aquaeus uranyl acetate for 1 h, dehydrated in graded ethanol series and embedded with Epon-filled BEEM capsules (EMS; Polysciences, Inc., 00224) placed on top of the Mattek dish. After polymerization blocks were trimmed down to the regions previously identified on the confocal microscope and now imprinted on the Epon block. Serial sections (200 nm) were cut on an Ultracut UCT ultramicrotome (Leica, Germany) and collected on formvar-coated slot grids. Samples were observed in a Thermo ScientificTM TalosTM F200C microscope at 200 kV and single images taken with a Ceta 16M camera. For electron tomography image series were taken at −60° to 60° tilt angles with 2° increment. Tomograms were computed using weighted back projection using the IMOD package. Display of tomogram slices was also performed using IMOD software version 4.9.3. Image overlay of immunofluorescence images and electron micrographs was performed manually using Adobe Photoshop in overlay mode with mitochondria as useful landmarks.
Optogenetic assay of mitophagosome closure
RPE-1 cells stably expressing SNAP-LC3B were grown on 35-mm MatTek glass bottom dishes and transfected with NTOMM20-LOV2 and Cherry-Zdk1 in a 2:1 ratio using FuGENE6 (Promega, E2692). Cells were treated with DFP at a final concentration of 0.8 mM overnight. The next morning cells were washed and incubated for 30 min with SNAP-ligand before imaging. Live cell imaging was performed on an OMX V4 system using a 60X objective with a heated stage. Selected cells were imaged for up to 12 min every 2 s. Release of the mCherry-Zdk1 from the NTOMM20-LOV2 was induced by exposure to 488 nm wavelength light 0.04–0.1 s (depending on expression levels) for every 12 time points. Movies were deconvolved and aligned using Softworx software and subsequently analyzed in Fiji. LC3B and Zdk1-mCherry positive structures were tracked manually and a custom-made Python script was used to measure the fluorescence intensity changes over time. To account for different length in DFP incubation due to imaging time, in one experiment first scrambled control RNA- and subsequently siRNA-treated cells were imaged, whereas in the second experiment the order was reversed.
Mitophagy assay
U2OS FlpIN TRex cells expressing a doxycycline inducible MLS- and tandem tagged EGFP-mCherry fusion protein (MLS-EGFP-mCherry) in the presence or absence of lentivirally transduced stable expression of PRKN were used for mitophagy analysis [Citation36]. Cells were reverse transfected in OptiMEM media (ThermoFisher Scientific, 31,985,070) overnight (16 h) with 20 nM Silencer Select siRNAs as indicated in table above (ThermoFisher Scientific) with 0.1 µl RNAiMAX (Thermofisher Scientific, 13,778,150) per pmol of siRNA and plated into a 96-well µ-Plate (Ibidi, 89,626). Cell media was then changed to complete media for 24 h in the presence of 100 ng/ml doxycycline (Fisher Scientific, NC0424034). Mitophagy was induced in PRKN overexpressing cells by the combined addition of 10 µM oligomycin (SelleckChem. S1478) and 1 µM antimycin A (Sigma, A8674) for 6 h. In cells without PRKN overexpression, mitophagy was induced by addition of 1 mM Deferiprone (DFP, Sigma Aldrich, 379,409) to complete media containing doxycycline for 24 h. Following treatment, cells were washed once with PBS and fixed in 3.7% (w/v) paraformaldehyde (Sigma Aldrich, P6148), 200 mM HEPES (Sigma Aldrich, H3375) pH 7 for 10 min at 37°C. Samples were washed twice and then incubated for 15 min at room temperature in DMEM + 10 mM HEPES pH 7. Cells were washed twice with PBS prior to addition of PBS + 2 µg/ml Hoechst 33,342 (ThermoFisher Scientific, H3570) and incubated for a minimum of 1 h prior to imaging. Images were obtained on a Zeiss AxioObserver widefield microscope with a 20x objective acquiring a minimum of 35 fields of view per treatment. Analysis of red only punctate structures was carried out utilizing CellProfiler [Citation48] from a minimum of 1000 cells per condition per replicate.
RNA isolation and quantitative PCR
RNA was isolated and cDNA generated from siRNA transfected U2OS cells using Power SYBR Green Cells-to-CT kit (ThermoFisher Scientific #4,402,955) as per manufacturer’s instructions. Analysis of siRNA efficiency was determined by qPCR using primers designed to amplify target genes as indicated in following normalization of transcript levels to TATA-box-binding protein using the 2−ΔΔCt method.
Table 2. Primers used for qPCR.
Statistical analysis and considerations
Values are expressed as mean ± SEM for quantification of western blots. CHMP4B dwell times are calculated as mean ± SD. The number of individual experiments and the number of cells analyzed are indicated in each figure legend. For the calculation of statistical significance, the unpaired t test was used to test 2 samples with equal variance, and the one-sample t test was used in cases in which the value of the control sample was set to 1.
Supplemental Material
Download Zip (69.9 MB)Acknowledgments
We thank Eva Rønning, Anne Engen, Ulrikke Dahl Brinch and Ingrid Kjos for expert technical assistance, and Tor Erik Rusten for providing Drosophila specimens. The Core Facilities for Advanced Light Microscopy and Advanced Electron Microscopy at Oslo University Hospital are acknowledged for access to relevant microscopes. Y.Z. and H.Sp. were supported by postdoctoral and doctoral fellowships, respectively, from the Research Council of Norway (grant number 249794). H.St. and A.S. were supported by project grants from the Norwegian Cancer Society (grant numbers 182698 and 171318, respectively). H.St. was also supported by a grant from the South-Eastern Norway Regional Health Authority (grant number 2016087). This work was partly supported by the Research Council of Norway through its Centres of Excellence funding scheme, project number 262652.
Disclosure statement
No potential conflict of interest was reported by the authors.
Additional information
Funding
References
- Christ L, Raiborg C, Wenzel EM, et al. Cellular functions and molecular mechanisms of the ESCRT membrane-scission machinery. Trends Biochem Sci. 2017;42:42–56.
- Schoneberg J, Lee IH, Iwasa JH, et al. Reverse-topology membrane scission by the ESCRT proteins. Nat Rev Mol Cell Biol. 2017;18:5–17.
- Henne WM, Stenmark H, Emr SD. Molecular mechanisms of the membrane sculpting ESCRT pathway. Cold Spring Harb Perspect Biol. 2013;5.
- Katzmann DJ, Babst M, Emr SD. Ubiquitin-dependent sorting into the multivesicular body pathway requires the function of a conserved endosomal protein sorting complex, ESCRT-I. Cell. 2001;106:145–155.
- Carlton JG, Martin-Serrano J. Parallels between cytokinesis and retroviral budding: a role for the ESCRT machinery. Science. 2007;316:1908–1912.
- Vietri M, Schink KO, Campsteijn C, et al. Spastin and ESCRT-III coordinate mitotic spindle disassembly and nuclear envelope sealing. Nature. 2015;522:231–235.
- Olmos Y, Hodgson L, Mantell J, et al. ESCRT-III controls nuclear envelope reformation. Nature. 2015;522:236–239.
- Jimenez AJ, Maiuri P, Lafaurie-Janvore J, et al. ESCRT machinery is required for plasma membrane repair. Science. 2014;343:1247136.
- Raab M, Gentili M, de Belly H, et al. ESCRT III repairs nuclear envelope ruptures during cell migration to limit DNA damage and cell death. Science. 2016;352:359–362.
- Denais CM, Gilbert RM, Isermann P, et al. Nuclear envelope rupture and repair during cancer cell migration. Science. 2016;352:353–358.
- Skowyra ML, Schlesinger PH, Naismith TV, et al. Triggered recruitment of ESCRT machinery promotes endolysosomal repair. Science. 2018;360:eaar5078.
- Radulovic MS, Schink KO, Wenzel EM, et al. ESCRT-mediated lysosome repair precedes lysophagy and promotes cell survival. Embo J. 2018;37:e99753.
- Nara A, Mizushima N, Yamamoto A, et al. SKD1 AAA ATPase-dependent endosomal transport is involved in autolysosome formation. Cell Struct Funct. 2002;27:29–37.
- Filimonenko M, Stuffers S, Raiborg C, et al. Functional multivesicular bodies are required for autophagic clearance of protein aggregates associated with neurodegenerative disease. J Cell Biol. 2007;179:485–500.
- Rusten TE, Vaccari T, Lindmo K, et al. ESCRTs and Fab1 regulate distinct steps of autophagy. Curr Biol. 2007;17:1817–1825.
- Djeddi A, Michelet X, Culetto E, et al. Induction of autophagy in ESCRT mutants is an adaptive response for cell survival in C. elegans. J Cell Sci. 2012;125:685–694.
- Lee JA, Beigneux A, Ahmad ST, et al. ESCRT-III dysfunction causes autophagosome accumulation and neurodegeneration. Curr Biol. 2007;17:1561–1567.
- Shirahama K, Noda T, Ohsumi Y. Mutational analysis of Csc1/Vps4p: involvement of endosome in regulation of antophagy in yeast. Cell Struct Funct. 1997;22:501–509.
- Rusten TE, Stenmark H. How do ESCRT proteins control autophagy? J Cell Sci. 2009;122:2179–2183.
- Hurley JH. ESCRTs are everywhere. Embo J. 2015;34:2398–2407.
- Takahashi Y, He H, Tang Z, et al. An autophagy assay reveals the ESCRT-III component CHMP2A as a regulator of phagophore closure. Nat Commun. 2018;9:2855.
- Kabeya Y, Mizushima N, Ueno T, et al. LC3, a mammalian homologue of yeast Apg8p, is localized in autophagosome membranes after processing. Embo J. 2000;19:5720–5728.
- Klionsky DJ, Abdelmohsen K, Abe A, et al. Guidelines for the use and interpretation of assays for monitoring autophagy (3rd edition). Autophagy. 2016;12:1–222.
- Shen Y, Rosendale M, Campbell RE, et al. pHuji, a pH-sensitive red fluorescent protein for imaging of exo- and endocytosis. J Cell Biol. 2014;207:419–432.
- Guizetti J, Schermelleh L, Mantler JM, et al. Cortical constriction during abscission involves helices of ESCRT-III-dependent filaments. Science. 2011;331:1616–1620.
- Wenzel EM, Schultz SW, Schink KO, et al. Concerted ESCRT and clathrin recruitment waves define the timing and morphology of intraluminal vesicle formation. Nat Commun. 2018;9:2932.
- Berg TO, Fengsrud M, Stromhaug PE, et al. Isolation and characterization of rat liver amphisomes - Evidence for fusion of autophagosomes with both early and late endosomes. J Biol Chem. 1998;273:21883–21892.
- Hussain AF, Amoury M, Barth S. SNAP-tag technology: a powerful tool for site specific conjugation of therapeutic and imaging agents. Curr Pharm Des. 2013;19:5437–5442.
- Chavrier P, Parton RG, Hauri HP, et al. Localization of low molecular weight GTP binding proteins to exocytic and endocytic compartments. Cell. 1990;62:317–329.
- Pickles S, Vigie P, Youle RJ. Mitophagy and quality control mechanisms in mitochondrial maintenance. Curr Biol. 2018;28:R170–R185.
- Allen GF, Toth R, James J, et al. Loss of iron triggers PINK1/Parkin-independent mitophagy. EMBO Rep. 2013;14:1127–1135.
- Teis D, Saksena S, Emr SD. Ordered assembly of the ESCRT-III complex on endosomes is required to sequester cargo during MVB formation. Dev Cell. 2008;15:578–589.
- Shen QT, Schuh AL, Zheng Y, et al. Structural analysis and modeling reveals new mechanisms governing ESCRT-III spiral filament assembly. J Cell Biol. 2014;206:763–777.
- Wang H, Vilela M, Winkler A, et al. LOVTRAP: an optogenetic system for photoinduced protein dissociation. Nat Methods. 2016;13:755–758.
- Soreng K, Munson MJ, Lamb CA, et al. SNX18 regulates ATG9A trafficking from recycling endosomes by recruiting Dynamin-2. EMBO Rep. 2018;19:e44837.
- Abudu YP, Pankiv S, Mathai BJ, et al. NIPSNAP1 and NIPSNAP2 act as “eat-me signals” for mitophagy. Dev Cell. 2019;49:509–525.
- Carlsson SR, Simonsen A. Membrane dynamics in autophagosome biogenesis. J Cell Sci. 2015;128:193–205.
- Zhou F, Wu Z, Zhao M, et al. Rab5-dependent autophagosome closure by ESCRT. J Cell Biol. 2019;218:1908–1927.
- Knorr RL, Lipowsky R, Dimova R. Autophagosome closure requires membrane scission. Autophagy. 2015;11:2134–2137.
- Itakura E, Kishi-Itakura C, Mizushima N. The hairpin-type tail-anchored SNARE syntaxin 17 targets to autophagosomes for fusion with endosomes/lysosomes. Cell. 2012;151:1256–1269.
- Babst M, Katzmann DJ, Estepa-Sabal EJ, et al. Escrt-III: an endosome-associated heterooligomeric protein complex required for mvb sorting. Dev Cell. 2002;3:271–282.
- Christ L, Wenzel EM, Liestol K, et al. ALIX and ESCRT-I/II function as parallel ESCRT-III recruiters in cytokinetic abscission. J Cell Biol. 2016;212:499–513.
- Katzmann DJ, Odorizzi G, Emr SD. Receptor downregulation and multivesicular-body sorting. Nat Rev Mol Cell Biol. 2002;3:893–905.
- Gruenberg J, Stenmark H. The biogenesis of multivesicular endosomes. Nat Rev Mol Cell Biol. 2004;5:317–323.
- Yang Z, Klionsky DJ. Mammalian autophagy: core molecular machinery and signaling regulation. Curr Opin Cell Biol. 2010;22:124–131.
- Campeau E, Ruhl VE, Rodier F, et al. A versatile viral system for expression and depletion of proteins in mammalian cells. PloS One. 2009;4:e6529.
- Sagona AP, Nezis IP, Pedersen NM, et al. PtdIns(3)P controls cytokinesis through KIF13A-mediated recruitment of FYVE-CENT to the midbody. Nat Cell Biol. 2010;12:362–371.
- Carpenter AE, Jones TR, Lamprecht MR, et al. CellProfiler: image analysis software for identifying and quantifying cell phenotypes. Genome Biol. 2006;7:R100.