
ABSTRACT
Drought stress seriously affects crop yield, and the mechanism underlying plant resistance to drought stress via macroautophagy/autophagy is not clear. Here, we show that a dehydrin, Medicago truncatula MtCAS31 (cold acclimation-specific 31), a positive regulator of drought response, plays a key role in autophagic degradation. A GFP cleavage assay and treatment with an autophagy-specific inhibitor indicated that MtCAS31 participates in the autophagic degradation pathway and that overexpressing MtCAS31 promotes autophagy under drought stress. Furthermore, we discovered that MtCAS31 interacts with the autophagy-related protein ATG8a in the AIM-like motif YXXXI, supporting its function in autophagic degradation. In addition, we identified a cargo protein of MtCAS31, the aquaporin MtPIP2;7, by screening an M. truncatula cDNA library. We found that MtPIP2;7 functions as a negative regulator of drought response. Under drought stress, MtCAS31 facilitated the autophagic degradation of MtPIP2;7 and reduced root hydraulic conductivity, thus reducing water loss and improving drought tolerance. Taken together, our results reveal a novel function of dehydrins in promoting the autophagic degradation of proteins, which extends our knowledge of the function of dehydrins.
Abbreviations: AIM: ATG8-interacting motif; ATG: autophagy-related; ATI1: ATG8-interacting protein1; BiFC: Biomolecular fluorescence complementation; CAS31: cold acclimation-specific 31; ConcA: concanamycin A; DSK2: dominant suppressor of KAR2; ER: endoplasmic reticulum; ERAD: ER-associated degradation; NBR1: next to BRCA1 gene 1; PM: plasma membrane; PIPs: plasma membrane intrinsic proteins; TALEN: transcription activator-like effector nuclease; TSPO: tryptophan-rich sensory protein/translocator; UPR: unfolded protein response; VC: vector control
Introduction
The development of plants is deeply affected by abiotic stresses, such as salt, drought and cold stress. As a type of environmental stress, drought stress negatively affects the growth and development of plants [Citation1–Citation3]. To minimize the effects of stresses, plants have developed a protein quality control system to maintain homeostasis. When subjected to stresses, plants respond by protein folding and processing [Citation4–Citation6]. Misfolded proteins and protein aggregates accumulate in the endoplasmic reticulum (ER) lumen, a condition known as ER stress. To maintain ER homeostasis, plants exhibit an elaborate protein quality control system that includes the unfolded protein response (UPR), ER-associated degradation (ERAD), and autophagy [Citation7,Citation8]. UPR caused by the accumulation of aggregated misfolded proteins was shown to activate ERAD and autophagy, the 2 main degradation pathways [Citation9]. A recent study showed that autophagy can efficiently degrade protein aggregates and proteins that are not efficiently processed by the canonical ERAD machinery due to their structure [Citation7]. Studies have also shown that chaperones, such as Bip, participate in the UPR and ERAD pathways by regulating the endoplasmic reticulum stress (ERS) sensor [Citation10].
Autophagy, a process that delivers proteins and organelles to lysosomes for degradation and recycling, functions in many biological processes, such as pollen germination [Citation11], nutrient recycling [Citation12] and abiotic and biotic stress in plants. Over 30 ATG (autophagy-related) genes, which are activated by nutrient starvation and inhibited by MTOR (mechanistic target of rapamycin kinase) signaling, have been demonstrated to participate in autophagy [Citation13]. In the past, autophagy was thought to be a housekeeping mechanism, but recent data have shown that autophagy is an adaptive process that is involved in biotic and abiotic stress adaptation [Citation14,Citation15]. The autophagic degradation pathway acts in a selective manner in which ATG8s (autophagy-related 8) play critical roles [Citation16,Citation17]. Nine ATG8 isoforms have been identified in Arabidopsis thaliana, each of which can be used as an indicator of the autophagosome [Citation18–Citation20]. In selective autophagic degradation, proteins targeted for degradation are recognized by a cargo receptor that interacts with ATG8 and are then degraded through autophagy [Citation21–Citation23]. The cargo receptor ATI1 (ATG8-interacting protein 1) recognizes chloroplast proteins and interacts with ATG8f, which mediates the autophagic degradation of chloroplast proteins [Citation24]. TSPO (tryptophan-rich sensory protein/translocator) functions as a cargo receptor that mediates the autophagic degradation of PIP2 (plasma membrane intrinsic protein 2) in Arabidopsis under stress conditions [Citation17]. NBR1 (next to BRCA1 gene 1) functions as a cargo receptor and interacts with ATG8 to mediate protein degradation [Citation23]. Exploring the new cargo receptor and cargo under drought stress is a significant research project.
Dehydrins are classified as group 2 LEA (late embryogenesis abundant) proteins and are widely distributed in many plant species [Citation25,Citation26]. The accumulation of dehydrins improves abiotic stress tolerance [Citation27,Citation28]. Because they exhibit both hydrophilic and hydrophobic characteristics, dehydrins lack a stable secondary structure [Citation26,Citation29] and easily bind to biomolecules, such as DNA, RNA, proteins, ions and membrane components [Citation25,Citation26]. Previous studies have suggested that dehydrins exhibit various types of potential biochemical activities, including ion isolation, membrane stabilization, and chaperone activities [Citation30,Citation31]. In addition, dehydrins protect their target proteins from degradation under abiotic stress in vitro [Citation29]. The in vivo mechanism of dehydrins in the drought response was first characterized in 2012 [Citation27]. Heterologous expression of the Medicago truncatula dehydrin MtCAS31, a Y2K4-type dehydrin, in Arabidopsis decreases stoma density and improves drought tolerance [Citation27]. In addition, MtCAS31 was shown to protect the leghemoglobin MtLb120-1 under drought stress to aid symbiotic nitrogen fixation in M. truncatula [Citation32]. However, the function of MtCAS31 in protein quality control under severe drought stress has not been reported. Further studies addressing the functions of dehydrins in protein quality control under drought stress are needed.
In this study, we determined that a dehydrin, MtCAS31, functions as a positive regulator of drought stress in Medicago. MtCAS31 participates in drought-induced autophagic degradation as a cargo receptor. We further identified a cargo protein of MtCAS31, aquaporin MtPIP2;7. This study is the first to show that dehydrin plays an essential role in the autophagic degradation pathway, which enriches our understanding of the function of dehydrins in protein quality control.
Results
MtCAS31 is expressed in the water transport system
In a previous study by our group, heterologous expression of MtCAS31pro:GUS in A. thaliana and Nicotiana benthamiana revealed that MtCAS31 was expressed in stomata and vascular bundles [Citation27]. To characterize the expression patterns of MtCAS31 in M. truncatula, we generated transgenic M. truncatula plants expressing MtCAS31pro:GUS construct. β-glucuronidase (GUS) staining was detected in vascular bundles and guard cells (), which was the same as that in Arabidopsis.
Figure 1. Expression pattern of MtCAS31. (A) GUS staining of transgenic M. truncatula expressing MtCAS31pro:GUS. (i) Root, bar: 100 μm. (ii) Stem, bar: 100 μm. (iii) Vascular and stomal tissue of a leaf, bar: 100 μm. (iv) Whole plant, bar: 1 cm. (B) Immunoblotting assay of the membrane, nuclear and soluble components separated from N. benthamiana leaf cells expressing CaMV35S:MtCAS31-FLAG. H+-ATPase, Histone 3 and cFBPase were employed as markers of the membrane, nucleus and cytoplasm, respectively. (C) Subcellular localization of MtCAS31-GFP driven by CaMV35S. HDEL-RFP (i) and GmMAN1-RFP (ii) were co-transformed with MtCAS31-GFP. Protoplasts from plants expressing MtCAS31-GFP were stained with DAPI (iii). Fluorescence was detected by confocal laser scanning microscopy with excitation at 488 nm (for the detection of GFP), 546 nm (for the detection of RFP) and 518 nm (for the detection of DAPI). HDEL, endoplasmic reticulum retention signal. GmMAN1, endoplasmic reticulum membrane protein. DAPI, 4ʹ,6-diamidino-2-phenylindole, a nuclear dye. Bar: 10 μm.
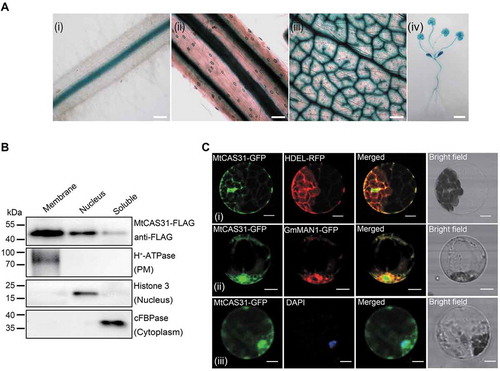
To determine the cellular localization of MtCAS31, cellular fractionation of N. benthamiana leaf cells transiently expressing the CaMV35S:MtCAS31-FLAG protein was performed. The leaf protein extract was immunoblotted with an anti-FLAG antibody to explore the localization of MtCAS31 as well as with anti-cFBPase (cytosolic fraction marker), anti-H+-ATPase (membrane marker), and anti-Histone H3 (nuclear marker). Immunoblot analysis showed that MtCAS31 was detected in the membranes (a mixture of ER, tonoplasts, plasma membrane [PM] fragments and Golgi) as well as in nuclear and soluble cytoplasmic fractions ().
To further verify these results, we co-expressed CaMV35S:MtCAS31-GFP and CaMV35S:HDEL-RFP in Arabidopsis protoplasts. Fluorescence signals were detected using confocal laser scanning microscopy. The green fluorescence signals showed colocalization with red fluorescence signals, indicating that MtCAS31 was localized at the ER lumen (, i). Additionally, MtCAS31 partly colocalized with GmMAN1, an ER- and Golgi-localized protein (, ), and MtCAS31-GFP colocalized with DAPI (, ), which was used for nuclear staining. These results suggested that the vast majority of MtCAS31 localized to the ER and nucleus.
MtCAS31 is a positive regulator of the drought response in M. truncatula
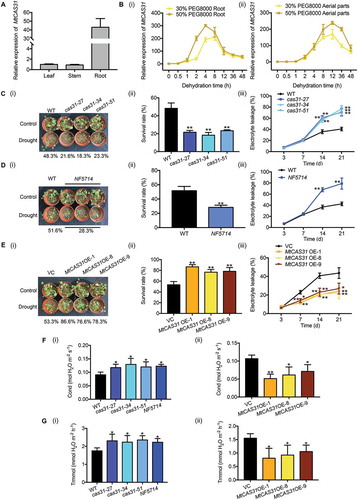
Dehydrin expression is generally considered a potential marker of drought stress [Citation27,Citation33]. Dehydrins are mainly described as cryo- and dehydro-protectants in vitro under stress conditions [Citation34]. For further study, qRT-PCR was used to explore the expression pattern of MtCAS31 in different tissues. Actin (Medtr3g095530) was employed as the reference [Citation35,Citation36]. The highest MtCAS31 expression was detected in the roots (45-fold compared to leaves and 50-fold compared to stems) (). Next, 2-week-old seedlings were treated with PEG 8000 at different concentrations to simulate moderate (30%, w:v) and severe (50%, w:v) dehydration. The expression of MtCAS31 was highly induced in both the roots (, ) and aerial parts (leaves and stems) (, ). In addition to drought stress, MtCAS31 was induced by high salinity (150 mM NaCl) (Fig. S1A). Under chilled (4°C) conditions, the expression level of MtCAS31 was elevated in the roots, but no obvious change was observed in the aerial parts (Fig. S1B). Because the effect of chilling on MtCAS31 expression was weak, the treatment time was extended to 72 h. The expression of MtCAS31 was also induced by abscisic acid (ABA) in both the roots and aerial parts (Fig. S1C).
Figure 2. Overexpression of MtCAS31 in M. truncatula increases drought tolerance. (A) Relative expression of MtCAS31 in leaves, stems and roots of M. truncatula in the absence of stress. The values were normalized to Actin expression. The data represent the mean±SD of 3 replicates. (B) Using qRT-PCR, the relative expression of MtCAS31 under dehydration (30% and 50% PEG 8000 treatment, w:v) in roots (i) and aerial parts (ii) was determined at the indicated time points. The values were normalized to Actin expression. The data represent the mean±SD of 3 replicates. (C) Phenotypes of cas31 mutant and wild-type plants after 3 drought-rewatering cycles (i). The survival rate was scored (ii), and relative electrolyte leakage was calculated (iii). The data represent the mean±SD of 2 replicates with 15 plants each. Asterisks indicate statistically significant differences between the wild-type and cas31 mutant plants. *P < 0.05, **P < 0.01, Student’s t-test. (D) After 3 drought-rewatering cycles, photographs of the NF5714 and wild-type phenotypes were collected (i). The survival rate (ii) and relative electrolyte leakage (iii) were calculated. NF5714, the Tnt1-insertion mutant of MtCAS31. The data represent the mean±SD of 2 replicates with 15 plants each. Asterisks indicate statistically significant differences between wild-type and NF5714. *P < 0.05, **P < 0.01, Student’s t-test. (E) MtCAS31OE and VC plants were exposed to drought stress, and the phenotype (i), survival rate (ii) and relative electrolyte leakage (iii) were scored. VC, vector control. The data represent the mean±SD of 2 replicates with 15 plants each. Asterisks indicate statistically significant differences between wild-type and NF5714. *P < 0.05, **P < 0.01, Student’s t-test. (F) Stoma conductivity was measured with a photosynthesis system (LI-6400TX). (i) Wild-type, cas31 mutant, (ii) VC and MtCAS31OE plants after 3 drought-rewatering cycles. The data represent the mean±SD of 2 replicates with 15 plants each. Asterisks indicate statistically significant differences. *P < 0.05, **P < 0.01, Student’s t-test. (G) The transpiration rates of wild-type, cas31 mutant, VC and MtCAS31OE plants under 3 drought-rewatering cycles were determined with a photosynthesis system (LI-6400TX). (i) Wild-type and cas31 mutant. (ii) VC and MtCAS31OE. The data represent the mean±SD of 2 replicates with 15 plants each. Asterisks indicate statistically significant differences. *P < 0.05, **P < 0.01, Student’s t-test.
To explore the function of MtCAS31 in M. truncatula, leaf disk transformation mediated by Agrobacterium tumefaciens EHA105 was performed to generate MtCAS31-overexpressing (MtCAS31OE) transgenic plants, in which expression was driven by the CaMV35S promoter. M. truncatula R108 was used as the receptor material. Eleven T1 transgenic MtCAS31OE lines were obtained. Three independent transgenic lines, MtCAS31OE-1, MtCAS31OE-8 and MtCAS31OE-9 (Fig. S2A), were used in further experiments. Immunoblot analysis with an anti-FLAG antibody showed that MtCAS31 was expressed at the protein level in MtCAS31OE plants (Fig. S2B). A Tnt1 retrotransposon insertion mutant of MtCAS31, NF5714, was also employed for analysis. The Tnt1 retrotransposon insertion was located in the third exon of MtCAS31 in NF5714 [Citation32]. We also generated MtCAS31-knockout mutant plants using transcription activator-like effector nuclease (TALEN) technology. T1 homozygotes of cas31-27, cas31–34 and cas31-51 were used for further studies. Immunoblot analysis showed that MtCAS31 was not detectable in any of the mutants [Citation32].
To assess the performance of the MtCAS31OE and cas31 mutants under water-deficient conditions, 2-week-old seedlings were exposed to drought stress by withholding water for 7 d and then rewatered (i.e., a drought-rewatering cycle). Survival rates were scored after 3 drought-rewatering cycles, and the survival rates of the mutants (21.6% in cas31-27, 18.3% in cas31-34 and 23.3% in cas31-51) were significantly lower than that of wild-type seedlings (48.3%) (, and ). The survival rate of NF5714 (28.3%) was significantly lower than that of the wild-type plants (51.6%) (, and ). Consistent with this finding, when subjected to drought stress, the survival rates of MtCAS31OE plants (86.6% in MtCAS31OE-1, 76.6% in MtCAS31OE-8 and 78.3% in MtCAS31OE-9) were significantly higher than that of vector control (VC) plants (53.3%) (, and ). Cell membrane stability and integrity under water stress are important indicators of drought tolerance in plants. Mutants of cas31 exhibited significantly higher relative electrolyte leakage than wild-type plants at selected time points during drought stress (, and , ). MtCAS31OE plants exhibited lower relative electrolyte leakage than VC plants (, ).
Because MtCAS31 is expressed in vascular bundles, the transpiration rate and stoma conductivity of cas31 mutants and MtCAS31OE plants under drought stress were analyzed. The stoma conductivity (, ) and transpiration rate ( ) were significantly higher in cas31 mutants than in wild-type plants under drought stress. Consistent with this finding, MtCAS31OE plants showed lower stoma conductivity (, ) and transpiration rates (, ) than VC plants. These results indicate that MtCAS31 functions as a positive regulator of the drought response in M. truncatula.
MtCAS31 participates in autophagy under drought stress
To explore the function of MtCAS31 under consistent drought stress, M. truncatula R108 was subjected to dehydration (30% PEG 8000) to simulate drought stress. Immunoblotting analysis with anti-MtCAS31 was employed to detect the protein level of MtCAS31 roots under drought stress. MtCAS31 was barely detectable in the absence of stress (0 h). After 2 h of dehydration, MtCAS31 could be detected; its expression peaked at 4 h of dehydration and was thereafter highly reduced (). The expression level of MtCAS31 mRNA was continuously upregulated from 0 h to 8 h under 30% PEG 8000 dehydration (, ), but MtCAS31 protein expression was significantly downregulated from 4 h to 8 h (), suggesting that MtCAS31 may be degraded from 4 h to 8 h.
Figure 3. MtCAS31 promotes autophagic degradation under drought stress. (A) Immunoblot analysis of MtCAS31 under dehydration at different PEG 8000 treatment timepoints. (B) M. truncatula hairy roots expressing MtCAS31pro:MtCAS31-GFP were evaluated by confocal laser scanning microscopy in the absence of stress (dehydration for 0 h) (i), under dehydration treatment for 2 h (ii), under dehydration treatment for 4 h (iii), under dehydration treatment for 8 h (iv) and a under a combined 4 h ConcA with 8-h dehydration treatment (v). Bar: 35 μm. No fluorescence signal was detected in the absence of stress, probably because MtCAS31-GFP was driven by the MtCAS31 native promoter, which is induced by dehydration. (C) Immunoblotting analysis of MtCAS31-GFP and free GFP under dehydration treatment at different PEG 8000 treatment timepoints (0, 2, 4 and 8 h) and a combined 4 h ConcA with 8-h dehydration treatment using anti-GFP. (D) Transgenic hairy roots expressing MtATG8f-GFP driven by CaMV35S were detected in wild-type, cas31 mutant and MtCAS31OE plants under no stress and dehydration with ConcA combination treatment. Fluorescence signals were detected by confocal laser scanning microscopy at a 488 nm excitation. Bar: 75 μm. (E) Significance analysis of the number of GFP-MtATG8f puncta per section in Figure 3D. Three sections were used for analysis. Significant differences, indicated by letters, were determined by one-way ANOVA and LSD. (F) Immunoblot analysis of free GFP and GFP-MtATG8f in wild-type, cas31 mutant and MtCAS3OE plants under no stress and 8-h dehydration treatment. NPTII was employed for quantification.
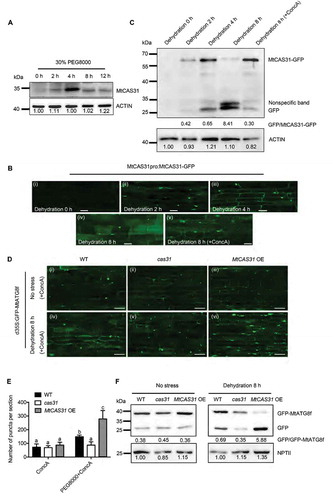
To examine whether MtCAS31 plays a role in drought-induced autophagic degradation, we generated stable transgenic plants mediated by Agrobacterium tumefaciens to express MtCAS31pro:MtCAS31-GFP. Treatment with 30% PEG 8000 was applied to explore the change in MtCAS31-GFP under drought-induced autophagy. Concanamycin A (ConcA), a vacuolar (V)-type H+-ATPase inhibitor that blocks hydrolase activity by increasing the vacuolar pH to block the autophagic degradation pathway, was added to block autophagy for 4 h in the middle of the 8-h dehydration treatment in all of the following experiments. GFP fluorescence was detected by confocal microscopy. Little GFP fluorescence was detected in the absence of stress (0 h) (, ). After dehydration for 2 h, MtCAS31 was induced, resulting in GFP fluorescence (, ). More GFP fluorescence accumulated in the membrane and nucleus at 4 h than at 2 h (, ). Partial GFP fluorescence was detected in vacuoles after 8 h of treatment, indicating MtCAS31 degradation (,), consistent with the results shown in . When ConcA (1 μM) was added to block autophagy for 4 h in the middle of the 8-h treatment, punctate GFP fluorescence accumulated (, ), suggesting that MtCAS31 is degraded via the autophagy pathway.
A GFP cleavage assay was also performed to verify the autophagic degradation of MtCAS31. MtCAS31pro:MtCAS31-GFP transgenic plants were treated with dehydration at different time points, as shown in . Immunoblotting with anti-GFP was used to detect the cleavage of MtCAS31-GFP. After 2 h of dehydration, MtCAS31-GFP was detectable and accumulated more at 4 h. At 8 h of treatment, MtCAS31-GFP was decreased (, up lane). However, free GFP accumulated as the dehydration progressed (, down lane). After combining dehydration with ConcA treatment, the ratio of free GFP to MtCAS31-GFP was largely reduced (), indicating that MtCAS31 was degraded via the autophagic degradation pathway.
To further investigate the function of MtCAS31 in autophagic degradation, MtATG8f, an autophagy indicator in plants, was fused with GFP and transformed into wild-type, cas31 mutant, and MtCAS31OE plants mediated by Agrobacterium rhizogenes. After a combination treatment with dehydration and ConcA, punctate GFP fluorescence was significantly reduced in the cas31 mutant and more accumulated in MtCAS31OE compared to that in wild-type ( - and ). After treatment with only ConcA, there was no significant difference in the number of punctate GFP in these materials, which was regarded as the control ( - and ). To confirm the effect of MtCAS31 on the autophagic degradation pathway, a GFP cleavage assay was performed. NPTII was used as the reference, which was expressed in the same vector as GFP-MtATG8f but from a different expression cassette. When treated with dehydration, the ratio of free GFP to GFP-ATG8f was increased in MtCAS31OE and reduced in cas31 (), indicating that MtCAS31 functions during drought-induced autophagy pathway, and it can be degraded by autophagy. In the absence of stress, no significant difference in these materials was observed, but free GFP was detected, which may have resulted from A. rhizogenes growth with these plants at all times.
MtCAS31 specifically interacts with the autophagy-related protein 8a
Because dehydrins are intrinsically disordered proteins and easily bind with other biological molecules, we investigated whether CAS31 is functional as a cargo receptor in the autophagy pathway. Generally, ATG8-interacting proteins contain the ATG8-interacting motif (AIM; W/F/YX1X2L/I/V). Hence, we analyzed the sequence of MtCAS31 and found 2 AIM-like motifs (YGNPL22, YGNPI35) (). We examined the interaction between MtCAS31 and ATG8 proteins. MtCAS31 interacted with MtATG8a, as determined by a yeast two-hybrid assay and a bimolecular fluorescence complementation (BiFC) assay ( and ), but not with other ATG8 isoforms (Fig. S3A). We replaced YGNPL22 with AGNPA and found that ATG8a could still interact with MtCAS31 (Fig. S3C). However, when we replaced YGNPI35 with AGNPA, MtCAS31 could no longer interact with ATG8a, as demonstrated by yeast two-hybrid and BiFC assays ( and ). Furthermore, when YGNPL35 was replaced with AGNPA35, MtCAS31 could not interact with MtATG8a in the coimmunoprecipitation (Co-IP) assay (). These results suggested that MtCAS31 specifically interacts with ATG8a in the AIM-like motif YGNPI35.
Figure 4. MtCAS31 interacts with MtATG8a. (A) Interaction between MtCAS31 and MtATG8a determined in a yeast two-hybrid assay. MtCAS31 was inserted into pGBKT7 (TaKaRa, 630,443) and fused with the GAL4-binding domain (pGBKT7-MtCAS31). MtATG8a was inserted into pGADT7 (TaKaRa, 630,442) and fused with the GAL4 active domain (pGADT7-MtATG8a). pGBKT7-53/pGADT7-RecT was employed as the positive control. pGBKT7-MtCAS31/pGADT7, pGBKT7/pGADT7-MtATG8a, and pGBKT7-MtCAS31/pGADT7 were used as negative controls. Different co-transformed yeast cells were dropped onto synthetic dropout medium (SD/-Trp/-Leu/-Ade/-His) containing 20 mg/mL X-α-gal. (B) The 2 AIM-like motifs in the MtCAS31 sequence, YGNPL22 and YGNPI35. (C) The AIM-like motif YGNPI35 of MtCAS31 affects the interaction with MtATG8a. When the AIM-like motif YNGPI35 was mutated to ANGPA, MtCAS31 could not interact with MtATG8a. The MtCAS31[AGNPA] mutant was inserted into pGBKT7 and fused with the GAL4-binding domain (pGBKT7-MtCAS31[AGNPA]). (D) Bimolecular fluorescence complementation assay to determine the interaction between MtCAS31 and MtATG8a. MtCAS31 was fused with the N terminus of YFP (MtCAS31-YFP[N]). MtATG8a was fused with the C terminus of YFP (YFP[C]-MtATG8a). Arabidopsis protoplasts were co-transformed with the indicated constructs and incubated for 16 h. MtCAS31-YFP[N]/YFP[C]-MtATG5 and MtCAS31[AGNPA]-YFP[N]/YFP[C]-MtATG8a were employed as the negative controls. Fluorescence signals were observed with confocal laser scanning microscopy at a 488-nm excitation wavelength. YFP, yellow fluorescent protein. Bar: 10 μm. (E) Detection of MtCAS31-MtATG8a interaction by coimmunoprecipitation (Co-IP). MtCAS31 was tagged with FLAG (MtCAS31-FLAG). MtATG8a was tagged with HA (MtATG8a-HA). MtCAS31[AGNPA]-FLAG/MtATG8-HA and GFP-FLAG/MtATG8-HA were employed as the negative controls. Total proteins were extracted from Arabidopsis protoplasts that were co-transformed with the indicated constructs and incubated with FLAG beads (Sigma-Aldrich, M8823) to immunoprecipitate the target protein. Coprecipitated proteins were analyzed by immunoblotting using anti-FLAG and anti-HA antibodies.
![Figure 4. MtCAS31 interacts with MtATG8a. (A) Interaction between MtCAS31 and MtATG8a determined in a yeast two-hybrid assay. MtCAS31 was inserted into pGBKT7 (TaKaRa, 630,443) and fused with the GAL4-binding domain (pGBKT7-MtCAS31). MtATG8a was inserted into pGADT7 (TaKaRa, 630,442) and fused with the GAL4 active domain (pGADT7-MtATG8a). pGBKT7-53/pGADT7-RecT was employed as the positive control. pGBKT7-MtCAS31/pGADT7, pGBKT7/pGADT7-MtATG8a, and pGBKT7-MtCAS31/pGADT7 were used as negative controls. Different co-transformed yeast cells were dropped onto synthetic dropout medium (SD/-Trp/-Leu/-Ade/-His) containing 20 mg/mL X-α-gal. (B) The 2 AIM-like motifs in the MtCAS31 sequence, YGNPL22 and YGNPI35. (C) The AIM-like motif YGNPI35 of MtCAS31 affects the interaction with MtATG8a. When the AIM-like motif YNGPI35 was mutated to ANGPA, MtCAS31 could not interact with MtATG8a. The MtCAS31[AGNPA] mutant was inserted into pGBKT7 and fused with the GAL4-binding domain (pGBKT7-MtCAS31[AGNPA]). (D) Bimolecular fluorescence complementation assay to determine the interaction between MtCAS31 and MtATG8a. MtCAS31 was fused with the N terminus of YFP (MtCAS31-YFP[N]). MtATG8a was fused with the C terminus of YFP (YFP[C]-MtATG8a). Arabidopsis protoplasts were co-transformed with the indicated constructs and incubated for 16 h. MtCAS31-YFP[N]/YFP[C]-MtATG5 and MtCAS31[AGNPA]-YFP[N]/YFP[C]-MtATG8a were employed as the negative controls. Fluorescence signals were observed with confocal laser scanning microscopy at a 488-nm excitation wavelength. YFP, yellow fluorescent protein. Bar: 10 μm. (E) Detection of MtCAS31-MtATG8a interaction by coimmunoprecipitation (Co-IP). MtCAS31 was tagged with FLAG (MtCAS31-FLAG). MtATG8a was tagged with HA (MtATG8a-HA). MtCAS31[AGNPA]-FLAG/MtATG8-HA and GFP-FLAG/MtATG8-HA were employed as the negative controls. Total proteins were extracted from Arabidopsis protoplasts that were co-transformed with the indicated constructs and incubated with FLAG beads (Sigma-Aldrich, M8823) to immunoprecipitate the target protein. Coprecipitated proteins were analyzed by immunoblotting using anti-FLAG and anti-HA antibodies.](/cms/asset/2afd413c-0afa-4d0c-83d5-de740baea097/kaup_a_1643656_f0004_oc.jpg)
The aquaporin MtPIP2;7 interacts with MtCAS31 and plays a negative role in the drought response
To identify MtCAS31 cargo, we used MtCAS31 as the bait to screen an M. truncatula cDNA library. We identified 35 proteins, including metabolic enzymes, abiotic stress response proteins, and other proteins (Table S1). Among these proteins, we were particularly interested in the plant aquaporin MtPIP2;7 (Medtr2g094270). In phylogenetic analyses, MtPIP2;7 clustered with a group of proteins belonging to the aquaporin PIP2 subfamily (Fig. S4), which has previously been reported to participate in abiotic stress [Citation37–Citation39].
To further confirm the interaction between MtCAS31 and MtPIP2;7, we first employed a split-ubiquitin system yeast two-hybrid (SuY2H) assay. When co-transformed with NubG-MtCAS31 and MtPIP2;7-Cub, the yeast strain Saccharomyces cerevisiae NMY51 grew in synthetic dropout (SD) medium (-Trp/-Leu/-Ade/-His), and the reporter gene LacZ was activated (). A GST affinity-isolation assay was also performed to confirm the interaction between MtCAS31 and MtPIP2;7 (). This result was further examined in the plants with a BiFC assay. Full-length MtCAS31 was fused with the N terminus of YFP (MtCAS31-YFP[N]), and MtPIP2;7 was fused with the C terminus of YFP (MtPIP2;7-YFP[C]). These constructs were co-transformed into Arabidopsis protoplasts via PEG-mediated transformation. HDEL was fused with RFP and co-transformed into Arabidopsis protoplasts. GFP fluorescence colocalized with HDEL-RFP in protoplasts co-transformed with MtCAS31-YFP[N] and MtPIP2;7-YFP[C], whereas no green fluorescence was detected in the negative controls (), indicating that MtCAS31 interacted with MtPIP2;7 in the ER. Co-IP was also performed to verify the results. MtCAS31-FLAG and MtPIP2;7-MYC were co-expressed in Nicotiana benthamiana. Protein was immunoprecipitated with anti-FLAG beads and detected with anti-MYC. MtCAS31 and MtPIP2;7 were coimmunoprecipitated (). These results indicate that MtCAS31 interacts with MtPIP2;7 both in vitro and in vivo.
Figure 5. MtCAS31 interacts with MtPIP2;7. (A) Interaction of MtCAS31 and MtPIP2;7 in the transformed yeast strain NMY51, determined by a split-ubiquitin yeast two-hybrid assay. MtPIP2;7 was fused with the C terminus of ubiquitin (MtPIP2;7-Cub), and MtCAS31 was fused with the N terminus of mutant ubiquitin (NubG-MtCAS31). MtPIP2;7-Cub/Alg5-NubI was used as the positive control. MtPIP2;7-Cub/Alg5-NubG, MtPIP2;7-Cub/NubG and Alg5-CubI/NubG-MtCAS31 were employed as negative controls. Different co-transformed yeast cells were dropped onto synthetic dropout (SD) medium lacking tryptophan, leucine, adenine, and histidine (SD/-Trp/-Leu/-Ade/-His) and containing 20 mg/mL X-α-gal. (B) GST affinity-isolation assay to identify the interaction between MtPIP2;7 and MtCAS31. MtPIP2;7 was fused with a GST tag (GST-MtPIP2;7), and MtCAS31 was fused with a His tag (MtCAS31-His). GST-MtPIP2;7 or GST alone was precipitated with glutathione Sepharose 4B agarose beads for 3 h and incubated with MtCAS31-His. The precipitates were separated via SDS-PAGE and analyzed by immunoblotting using anti-His and anti-GST antibodies. (C) Interaction of MtCAS31 with MtPIP2;7 as determined by bimolecular fluorescence complementation. MtCAS31 was fused with the N terminus of YFP (MtCAS31-YFP[N]), and MtPIP2;7 was fused with the C terminus of YFP (MtPIP2;7-YFP[C]). Both constructs were driven by CaMV35S. HDEL-RFP, an ER marker, was co-transformed into Arabidopsis protoplasts. Co-transformed protoplasts were incubated for 16 h, and the fluorescence signals were detected by confocal laser scanning microscopy (Olympus FluoView FV1000) with excitation at 488 nm (for GFP fluorescence detection) and 546 nm (for RFP detection). MtCAS31-YFP[N]/Medtr4g415300-YFP[C]/HDEL-RFP and MtCAS31-YFP[N]/Medtr1g095070-YFP[C]/HDEL-RFP were employed as negative controls. YFP, yellow fluorescent protein. HDEL, amino acid sequence for localization to the ER. RFP, red fluorescent protein. Bar: 10 μm. (D) Detection of the MtCAS31-MtPIP2;7 interaction by coimmunoprecipitation (Co-IP). MtPIP2;7 was tagged with MYC (MtPIP2;7-MYC). GFP-FLAG/MtPIP2;7-MYC was employed as the negative control. Total proteins were extracted from the N. benthamiana leaf, which was co-transformed with the indicated constructs and incubated with FLAG beads to immunoprecipitate the target protein. Coprecipitated proteins were analyzed by immunoblotting using anti-FLAG and anti-MYC antibodies.
![Figure 5. MtCAS31 interacts with MtPIP2;7. (A) Interaction of MtCAS31 and MtPIP2;7 in the transformed yeast strain NMY51, determined by a split-ubiquitin yeast two-hybrid assay. MtPIP2;7 was fused with the C terminus of ubiquitin (MtPIP2;7-Cub), and MtCAS31 was fused with the N terminus of mutant ubiquitin (NubG-MtCAS31). MtPIP2;7-Cub/Alg5-NubI was used as the positive control. MtPIP2;7-Cub/Alg5-NubG, MtPIP2;7-Cub/NubG and Alg5-CubI/NubG-MtCAS31 were employed as negative controls. Different co-transformed yeast cells were dropped onto synthetic dropout (SD) medium lacking tryptophan, leucine, adenine, and histidine (SD/-Trp/-Leu/-Ade/-His) and containing 20 mg/mL X-α-gal. (B) GST affinity-isolation assay to identify the interaction between MtPIP2;7 and MtCAS31. MtPIP2;7 was fused with a GST tag (GST-MtPIP2;7), and MtCAS31 was fused with a His tag (MtCAS31-His). GST-MtPIP2;7 or GST alone was precipitated with glutathione Sepharose 4B agarose beads for 3 h and incubated with MtCAS31-His. The precipitates were separated via SDS-PAGE and analyzed by immunoblotting using anti-His and anti-GST antibodies. (C) Interaction of MtCAS31 with MtPIP2;7 as determined by bimolecular fluorescence complementation. MtCAS31 was fused with the N terminus of YFP (MtCAS31-YFP[N]), and MtPIP2;7 was fused with the C terminus of YFP (MtPIP2;7-YFP[C]). Both constructs were driven by CaMV35S. HDEL-RFP, an ER marker, was co-transformed into Arabidopsis protoplasts. Co-transformed protoplasts were incubated for 16 h, and the fluorescence signals were detected by confocal laser scanning microscopy (Olympus FluoView FV1000) with excitation at 488 nm (for GFP fluorescence detection) and 546 nm (for RFP detection). MtCAS31-YFP[N]/Medtr4g415300-YFP[C]/HDEL-RFP and MtCAS31-YFP[N]/Medtr1g095070-YFP[C]/HDEL-RFP were employed as negative controls. YFP, yellow fluorescent protein. HDEL, amino acid sequence for localization to the ER. RFP, red fluorescent protein. Bar: 10 μm. (D) Detection of the MtCAS31-MtPIP2;7 interaction by coimmunoprecipitation (Co-IP). MtPIP2;7 was tagged with MYC (MtPIP2;7-MYC). GFP-FLAG/MtPIP2;7-MYC was employed as the negative control. Total proteins were extracted from the N. benthamiana leaf, which was co-transformed with the indicated constructs and incubated with FLAG beads to immunoprecipitate the target protein. Coprecipitated proteins were analyzed by immunoblotting using anti-FLAG and anti-MYC antibodies.](/cms/asset/56927a0f-75c5-45d9-8aa3-af5e1eea910e/kaup_a_1643656_f0005_oc.jpg)
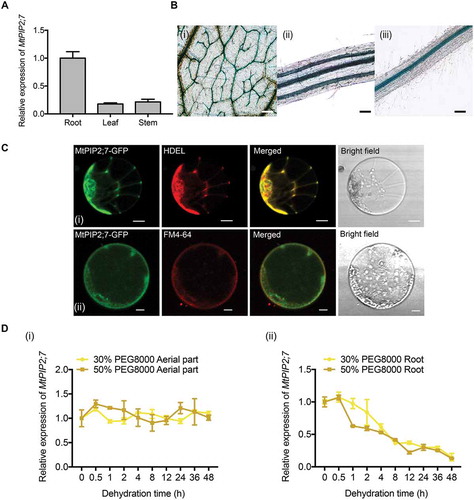
To investigate the characteristics and function of MtPIP2;7, we analyzed the expression pattern of MtPIP2;7 in M. truncatula. The highest expression was detected in the roots by qRT-PCR (), which was consistent with a previous study in Arabidopsis [Citation40]. Moreover, GUS activity was detected mainly in vascular bundles in the leaves (, ), stems (, ) and roots (, ) by GUS staining of MtPIP2;7pro:GUS transgenic M. truncatula. The examination of subcellular localization showed that MtPIP2;7 localized to both the ER and PM (). After dehydration (PEG 8000 treatment, 30% and 50%, w:v), the relative expression of MtPIP2;7 was not altered in aerial parts (Fig. 6Di) but was substantially decreased in the roots (Fig. 6Dii). Under other abiotic stresses, such as high salinity and chilling (4°C), the relative expression of MtPIP2;7 was not obviously changed, and ABA also had no significant effect on MtPIP2;7 (Fig. S5).
Figure 6. Expression pattern of MtPIP2;7. (A) Tissue expression patterns of MtPIP2;7 in roots, stems and leaf under well-watered conditions. The values were normalized to Actin expression. The data represent the mean±SD of 3 replicates. (B) GUS staining of MtPIP2;7pro:GUS transgenic Medicago truncatula. (i) Vascular bundles in leaves, bar: 200 μm. (ii) Vascular bundles in stems, bar: 100 μm. (iii) Vascular bundles in roots, bar: 200 μm. (C) Subcellular localization of MtPIP2;7-GFP driven by CaMV35S in Arabidopsis protoplasts. Arabidopsis protoplasts were co-transformed with HDEL-RFP and MtPIP2;7-GFP (i). Protoplasts expressing MtPIP2;7-GFP were stained with FM 4–64 (ii). The fluorescence signals were detected via confocal laser scanning microscopy with 488 nm and 546 nm excitation. FM 4–64, a cellular membrane-specific lipophilic dye. Bar: 10 μm. (D) Relative expression of MtPIP2;7 in aerial parts (i) and roots (ii) under dehydration conditions (30% and 50% PEG 8000 treatment, respectively) at the indicated time points. The values were normalized to ACTIN expression. The data represent the mean±SD of 3 replicates.
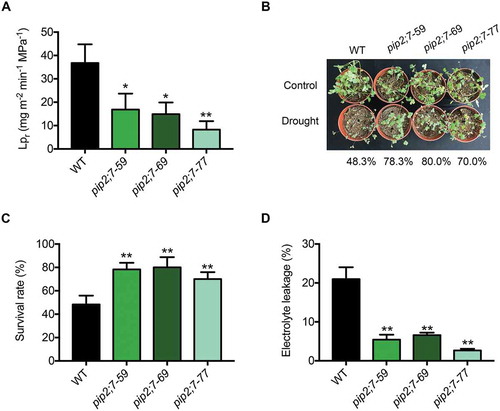
Many PIP2s have been reported to play roles in the drought response [Citation41–Citation45]. To understand the biological function of MtPIP2;7, we generated MtPIP2;7 knockout mutants using TALEN technology (Fig. S6A). Three independent T1-generation lines, pip2;7–59, pip2;7–69 and pip2;7–77, in which MtPIP2;7 was not detected by immunoblot analysis (Fig. S6B) were selected for further experiments. The water transduction ability of roots is reflected by the root hydraulic conductivity (Lpr), which mainly relies on the content of PIP2s in the PM [Citation46–Citation48]. Lpr was significantly lower in pip2;7 mutants than in wild-type plants, indicating that MtPIP2;7 contributes to water conduction and affects the hydraulic conductivity of roots (). To further understand the function of MtPIP2;7, wild-type and pip2;7 mutant plants were exposed to drought stress. After 3 drought-rewatering cycles, the survival rates of pip2;7 mutants (78.3% pip2;7–59, 80.0% pip2;7–69, and 70.0% pip2;7–77) were significantly higher than that of wild-type plants (48.3%) ( and ), and electrolyte leakage was significantly lower (), indicating that MtPIP2;7 plays a negative role in the drought response.
Figure 7. Function of MtPIP2;7 in M. truncatula. (A) Root hydraulic conductivity (Lpr) in wild-type and pip2;7 mutant plants in the absence of stress. The data represent the mean±SD of 3 replicates with 10 plants each. Asterisks indicate statistically significant differences between wild-type and pip2;7 mutant plants. *P < 0.05, and **P < 0.01, Student’s t-test. (B) Wild-type and pip2;7 plants were grown in soil at 24°C under 16-h light/8-h dark conditions. Two-week-old plants were exposed to drought stress for 7 d and rewatered, representing a drought-rewatering cycle. After 3 drought-rewatering cycles, the pip2;7 mutant and wild-type phenotypes were scored. (C) Survival rate of (B). The data represent the mean±SD of 3 replicates. Asterisks indicate statistically significant differences between wild-type and pip2;7 mutant plants, *P < 0.05, and **P < 0.01, Student’s t-test. (D) Electrolyte leakage of (B). The data represent the mean±SD of 3 replicates. Asterisks indicate statistically significant differences between wild-type and pip2;7 mutant plants, *P < 0.05, and **P < 0.01, Student’s t-test.
MtCAS31 facilitates the autophagic degradation of MtPIP2;7
We wanted to determine whether MtPIP2;7, a negative regulator of drought stress, is degraded by autophagy. We used immunoblotting analysis to detect the protein level of MtPIP2;7 in wild-type roots that were dehydrated for 8 h (30% PEG 8000), revealing reduced MtPIP2;7 expression after dehydration compared to that in the absence of stress (, ). However, the decrease in MtPIP2;7 was inhibited by ConcA (, ), suggesting that MtPIP2;7 can be degraded via the autophagic degradation pathway.
Figure 8. MtCAS31 promotes the autophagic degradation of MtPIP2;7. (A) Immunoblot analysis of the MtPIP2;7 protein levels in wild-type roots under no stress or dehydration conditions for 8 h (PEG 8000 treatment, 30% w:v) (i); DMSO or ConcA (1 μM) was added to PEG 8000 treatment for 8 h (ii) in M. truncatula using an anti-MtPIP2;7 antibody. DMSO, dimethyl sulfoxide; ConcA, concanamycin A, a vacuolar (V) type H+-ATPase inhibitor that blocks hydrolase activity by elevating the vacuolar pH to block the autophagic degradation pathway. The values represent the relative intensity of the band. Actin was employed for quantification. (B) Protein levels of MtPIP2;7 in wild-type and cas31 mutant roots under dehydration (PEG 8000, 30% w:v) combined with ConcA (1 μM) or spautin-1 (1 μM) treatment for 8 h. After treatment, the protein level of MtPIP2;7 was detected by immunoblot analysis using an anti-MtPIP2;7 antibody. Actin was used for quantification. (C) Transgenic hairy roots expressing MtPIP2;7-GFP driven by CaMV35S were detected in wild-type (i, ii and iii) and cas31 mutant (vi, v and vi) roots in the absence of stress (i and iv) and after 8 h of dehydration (PEG 8000, 30% w:v) (ii and v) and 8 h of dehydration combined with ConcA treatment (iii and vi) by confocal laser scanning microscopy at a 488 nm excitation. Bar: 20 μm. (D) Analysis of the significance of the numbers of MtPIP2;7-GFP puncta per section in (iii) and (vi). Three sections were employed for the analysis of significance. **P < 0.01, Student’s t-test. (E) Root hydraulic conductivity (Lpr) of wild-type and cas31 mutant plants under no stress and after 8-h dehydration treatment. Data represent the mean±SD of 3 replicates with 10 plants each. Significant differences, indicated by letters, were determined by one-way ANOVA and LSD.
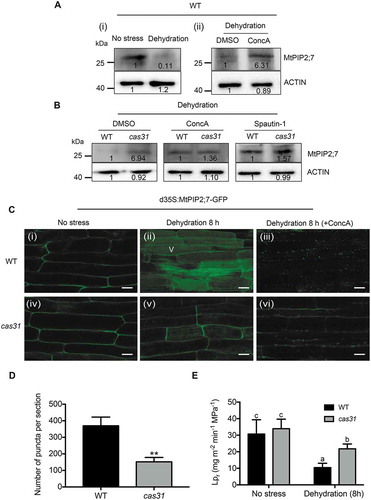
To explore whether MtPIP2;7 is a cargo protein in the MtCAS31-ATG8a-mediated autophagic degradation pathway, the autophagy inhibitors ConcA (1 µM) and spautin-1 (1 µM) were used on the wild-type and cas31 mutant plants, respectively. Spautin-1 is a USP10 and USP13 (ubiquitin-specific peptidases) inhibitor that blocks the autophagic degradation pathway. After combining dehydration with ConcA or spautin-1 treatment, no significant difference in the MtPIP2;7 protein level was observed between the cas31 mutant and wild-type plants (). These results indicated that MtCAS31 affects MtPIP2;7 degradation via the autophagy pathway.
To further verify the above results, MtPIP2;7-GFP driven by the CaMV35S promoter was transformed into wild-type and cas31 mutant plants by hairy root transformation. GFP fluorescence was detected with confocal laser scanning microscopy. MtPIP2;7-GFP was mainly localized in the PM in both the wild-type and cas31 mutant plants without dehydration (, i and iv). After 8 h of dehydration, the GFP fluorescence in wild-type plants was mainly detected in vacuoles (V) (, ), implying that MtPIP2;7 was degraded. However, some GFP fluorescence remained in the PM in the cas31 mutant (, ). After 8 h of dehydration and ConcA combination treatment, punctate GFP fluorescence was significantly increased in wild-type plants, while more MtPIP2;7 remained in the PM in cas31 mutants (, and , ), indicating that MtCAS31 promoted MtPIP2;7 degradation via the autophagic degradation pathway.
Because high MtPIP2;7 expression indicates a higher Lpr, we measured Lpr in wild-type and cas31 mutant plants. Mutants of cas31 exhibited a significantly higher Lpr than wild-type plants under dehydration, but no difference was observed in the absence of stress (). The phenotypic experiments proved that MtCAS31 promoted MtPIP2;7 degradation.
MtCAS31 functions as a cargo receptor in drought-induced autophagic degradation
We found that the dehydrin MtCAS31 specifically interacts with ATG8a in the AIM-like motif YGNPI35 () and interacts with MtPIP2;7 to facilitate its autophagic degradation (, ). However, MtPIP2;7 could not interact with the ATG8 proteins directly (Fig. S7A). M. truncatula was subjected to Co-IP analysis to verify the interaction of MtPIP2;7-MtCAS31- MtATG 8 using MtCAS31- FLAG and Medtr6g012980- FLAG transgenic M. truncatula plants. Medtr6g012980, which could not interact with ATG8 (Fig. S7B), was employed as the negative control. Total proteins were incubated with anti-FLAG beads to immunoprecipitate the target protein. The coprecipitated proteins were detected with anti-MtPIP2;7 and anti-MtATG8, which indicated that the MtPIP2;7-MtCAS31-MtATG8 complex exists in M. truncatula ().
Figure 9. Function of MtCAS31 in MtPIP2;7 autophagic degradation. (A) Detection of the MtATG8a-MtCAS31-MtPIP2;7 interaction by coimmunoprecipitation. Total proteins were extracted from the roots of transgenic M. truncatula, which express MtCAS31-FLAG. Medtr6g012980-FLAG was employed as the negative control. Total proteins were incubated with anti-FLAG beads to immunoprecipitate the target protein. Coprecipitated proteins were analyzed by immunoblotting using anti-ATG8 and anti-MtPIP2;7. (B) In the absence of stress, MtPIP2;7 is localized to the PM to transport water from soil into plant cells. Under drought stress, MtCAS31 is highly induced and participates in protein quality control. MtCAS31 works as a cargo receptor to form the MtPIP2;7-MtCAS31-MtATG8 complex, which promotes MtPIP2;7 autophagic degradation and thus reduces water loss. MtCAS31 may facilitate the autophagic degradation of other proteins, which needs to be examined in further studies.
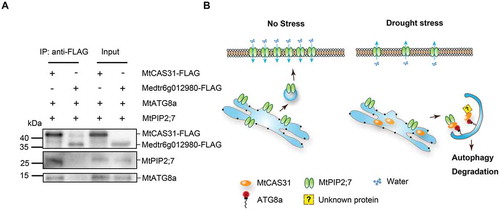
Taken together, our results demonstrate that the dehydrin MtCAS31 participates in drought-induced autophagic degradation as a cargo receptor. In the absence of stress, MtPIP2;7 in roots was translocated to the PM to transport water from the soil to plant cells. Under drought stress, MtCAS31 was highly induced in the ER and interacted with the cargo protein MtPIP2;7 to facilitate autophagic degradation. These phenomena will result in less water loss under drought stress and thus improve the drought tolerance of M. truncatula ().
Discussion
Dehydrins play roles in protein quality control under persistent drought stress
The development of plants is substantially influenced by abiotic stresses, such as heat, salt and drought stress. Drought is the most common type of environmental stress and triggers the misfolding of proteins that are toxic to plants. Hence, protein quality control is critical for plant survival. To relieve stress in plants, protective proteins, such as chaperones and LEA (late embryogenesis abundant) proteins, prevent proteins from aggregating under mild and moderate stress [Citation49]. In addition, protein degradation systems remove damaged proteins to protect plants under severe stress. Dehydrins have previously been considered molecular protectors that protect the proteins with which they interact, such as lactate dehydrogenase and lysozyme, from degradation or aggregation under abiotic stress [Citation29,Citation30]. We previously demonstrated that the dehydrin MtCAS31 interacts with ICE1 (Inducer of CBF expression 1) and affects stomatal development to improve drought tolerance [Citation27]. Moreover, we found that MtCAS31 can protect the leghemoglobin MtLb120-1 under drought stress [Citation32]. However, whether MtCAS31 plays a role in protein degradation and recycling remains unknown.
In this study, we defined a new dehydrin function, demonstrating that they play an important role in the autophagic degradation pathway under severe drought. During drought stress, MtCAS31 first accumulated and then became degraded (). A GFP cleavage assay and treatment with the ConcA indicated that MtCAS31 participates in the autophagy pathway and that overexpression of MtCAS31 promotes autophagy under drought stress (–). Further experiments proved that MtCAS31 interacted with MtATG8a in the AIM-like motif YGNPI35, supporting its function in autophagic degradation (). Because subcellular localization analysis of MtCAS31 proved that the vast majority of MtCAS31 localized to the ER and nucleus (, ) and previous studies showed that autophagosome membranes are derived from the ER or PM [Citation13,Citation50], we hypothesized that MtCAS31 from the ER participates in the autophagy pathway. The autophagic cargo receptors identified thus far in plants include ATI1/2, NBR1/Joka2, orosomucoid ORM1/2, DSK2, TSPO and ubiquitin receptor RPN10 [Citation14,Citation17,Citation21,Citation22,Citation51]. Among these proteins, the first 5 all interact with ATG8 in the typical AIM motif except ubiquitin receptor RPN10, which interacts with ATG8 in the ubiquitin-interacting motif (UIM) motif [Citation52]. Unlike these reported cargo receptors, MtCAS31 interacts with MtATG8a in the AIM-like motif YXXXI, which enriches our understanding of proteins that interact with ATG8 in different regions.
Studies have also shown that ATI1 plays a dual role in the autophagy pathway under carbon starvation and salt stress and during senescence, as it localizes at ER-associated bodies or plastid bodies to transport plastid proteins to the vacuole [Citation24]. NBR1 was shown to promote the selective autophagic degradation of ubiquitinated targets via interacting with AtATG8 [Citation51]. Orosomucoid ORM1/2 can maintain the function of the plant immune system by interacting with FLS2 (flagellin-sensing 2) and ATG8 [Citation53]. Under drought and starvation stress, DSK2 is phosphorylated by BIN2 (a GSK3-like kinase) to promote the DSK2-ATG8 interaction and then enhances BES1 (BRI1-EMS suppressor 1) autophagic degradation [Citation14]. Ubiquitin receptor RPN10 also functions as a selective autophagy cargo receptor that facilitates the degradation of inactive 26S proteasomes by interacting with ATG8 in the UIM [Citation21]. Under ABA treatment, TSPO is highly induced and interacts with AtPIP2;7 in the ER and Golgi. At the same time, TSPO acts as a cargo receptor and interacts with AtATG8 to promote AtPIP2;7 autophagic degradation. In our work, we found that MtCAS31 interacts with MtPIP2;7 and MtATG8 to form the MtPIP2;7-MtCAS31-MtATG8 complex in the ER and facilitate MtPIP2;7 degradation under drought stress. We also found that PIP2;7 has another cargo receptor in addition to TPSO, MtCAS31, that participates in the autophagy pathway, extending our knowledge of the relationship between cargo and cargo receptors.
We speculated that the functions of MtCAS31 under moderate and severe stress are different. Under mild and moderate drought stress, MtCAS31 is upregulated and accumulates [Citation13] in the membrane, nucleus, and soluble cytoplasm. MtCAS31 functions as a molecular protector, preventing enzymes such as leghemoglobin from inactivation [Citation29,Citation32]. When stress becomes more severe, MtCAS31 promotes the autophagic degradation of proteins, such as aquaporin MtPIP2;7, to resist drought stress (). According to the above hypothesis and observations, we speculated that dehydrins play roles in protein quality control under persistent drought stress.
Aquaporins can be degraded via different pathways under drought stress
Aquaporins, membrane proteins that belong to the MIP (major intrinsic protein) superfamily [Citation54], play key roles in the drought response in plants. According to their structure and function, aquaporins are mainly divided into 5 groups: PIPs (plasma membrane intrinsic proteins), TIPs (tonoplast intrinsic proteins), NIPs (NOD26-like intrinsic proteins), SIPs (small basic intrinsic proteins), and XIPs (X intrinsic proteins) [Citation55]. Among these 5 groups, studies have primarily focused on PIPs, which include 2 subgroups: PIP1 and PIP2 [Citation56,Citation57]. PIP2 proteins play important roles in water transport in the PM [Citation46–Citation48] and have been reported to participate in abiotic stress responses [Citation40,Citation45,Citation58,Citation59]. Overexpression of PIP2s can improve water use efficiency and enhance drought tolerance in rice, soybean and barley [Citation42,Citation46,Citation59]. In this study, we found that MtPIP2;7 was downregulated and degraded under drought stress, playing a negative role in the drought response, which is consistent with previously reported results [Citation17,Citation43,Citation60].
In plants, aquaporin expression is regulated at both the transcript and protein levels under environmental stress. Salt stress induces the dephosphorylation and internalization of PIPs, and drought stress induces the ubiquitylation of PIPs [Citation48], which are then degraded in the proteasome. The level of PIP2s directly affects water transport activity. Under drought stress, AtPIP2;1 was found to be degraded by the 26S proteasome pathway [Citation43]. AtPIP2;7 can be recognized by the stress-induced cargo receptor AtTSPO and is degraded via the autophagic degradation pathway [Citation17]. According to the present study, both the transcript and protein levels of the aquaporin MtPIP2;7 are reduced under dehydration conditions ( and ). Our results suggest that MtCAS31 interacts with MtPIP2;7 and facilitates the autophagic degradation of MtPIP2;7 (, ). In the cas31 mutant, the autophagic degradation of MtPIP2;7 was reduced under drought stress (), but MtPIP2;7 could not interact with MtATG8s (Fig. S7A), identifying MtCAS31 as a new cargo receptor of MtPIP2;7 in M. truncatula. Elucidation of whether MtCAS31, as a cargo receptor, promotes the autophagic degradation of other proteins requires further study.
In conclusion, the dehydrin MtCAS31 acts as a cargo receptor to form the MtPIP2;7-MtCAS31-MtATG8 complex, which facilitates MtPIP2;7 autophagic degradation, thus reducing water loss under drought stress and improving drought tolerance. This report is the first to demonstrate that a dehydrin is involved in the autophagic degradation pathway in the drought response and enriches our knowledge regarding the molecular mechanisms of dehydrins.
Materials and methods
Plant materials
MtCAS31OE, pip2;7-TALEN and MtCAS31pro:GUS transgenic plants were generated via the leaf disk transformation method [Citation61].
The full-length MtCAS31 fused with 3× FLAG was inserted into pMDC32 vector to generate MtCAS31OE, and pMDC32 vector was modified from pCAMBIA1300 (Cambia) with double CaMV35S. The vector used to generate pip2;7-TALEN was modified from pCAMBIA1300 and driven by a double CaMV35S promoter. The vector employed to generate MtCAS31pro:GUS was pCAMBIA1381 (Cambia). Transgenic plants were obtained through Agrobacterium- mediated transformation of M. truncatula R108 (UMR 1097, INRA, Montpellier, France). The plants were grown at room temperature after vernalization at 4°C for 16 h. Thereafter, the plants were grown in a 24°C chamber under 16-h light (light intensity of 200 μmol m−2s−1)/8-h dark conditions and 70% relative air humidity.
Hairy root transformation
The constructs that were needed for hairy root transformation (MtPIP2;7-GFP and NGFP-MtATG8f driven by a double CaMV35S [dCaMV35S] promoter) were introduced into the Agrobacterium rhizogenes ARqua1 strain. M. truncatula hairy root transformation was conducted as described and modified by Boisson-Dernier et al. [Citation62]. In brief, wild-type, cas31 mutant and MtCAS31 OE plants were germinated on 0.8% agar (BD, 214,010) until the length of the roots reached 1 cm. The root tips of the seedlings were cut, and the wounds were wrapped with ARqua1 expressing dCaMV35S:MtPIP2;7-GFP or dCaMV35S:GFP-MtATG8f. The treated seedlings were plated on half-strength Murashige and Skoog (MS) medium (Phytotech Labs, M519) with 25 mM kanamycin (Gentihold, 25,389–94-0) at 20°C for 7 d and then cultured at 24°C for 14 d until hairy roots emerged.
Dehydration treatment and gene expression analysis
To examine the expression patterns of MtCAS31 and MtPIP2;7 under dehydration, M. truncatula plants were cultured on half-strength MS medium in bottles under 16-h light (light intensity was 200 μmol m−2s−1)/8-h dark conditions and 70% relative air humidity for a week. Then, the seedlings were soaked in 30% (w:v) PEG 8000 (VWR, 25,322–68-3) and 50% (w:v) PEG 8000 for the indicated times. The relative expression of the selected genes was detected by qRT-PCR using a CFX-96 real-time system (Bio-Rad) and SYBR Premix Ex Taq (TaKaRa, RR420A). RNA was extracted with TRIzol reagent (Ambion, 15,596,018), and cDNA was obtained by reverse transcription using M-MLV reverse transcriptase (Promega, M1701). The relative expression of the target genes was normalized to Actin expression.
Drought treatment, survival rate and electrolyte leakage measurement
Plants (VC, MtCAS31OE, wild-type, cas31 mutant and pip2;7 mutant) were exposed to drought stress to study their performance in response to drought stress. The seedlings were grown in chambers with an equal weight of dry soil:vermiculite (1:3, v:v) at 24°C under 16-h light (light intensity was 200 μmol m−2s−1)/8-h dark conditions and 70% relative air humidity. Two-week-old seedlings were exposed to drought for 7 d and then re-watered with 200 mL of water, which represented a drought-rewatering treatment cycle. After 3 drought treatment cycles, the survival rate and electrolyte leakage were determined. To calculate the survival rate, plants with extended and green leaves after 3 drought-rewatering cycles were considered to be alive. In contrast, plants with withered leaves were considered dead. The survival rate was calculated as the number of surviving plants: total plants. Electrolyte leakage was measured with an ion leakage meter (Hanna, HI8733) at 3, 7, 14 and 21 d after the resumption of watering after the last cycle. In the assay, the ion concentration in Milli-Q water without any treatment was measured using an ion leakage meter, and this concentration was considered S0. Then, plant material subjected to drought stress was soaked in Milli-Q water and placed under vacuum for 15 min, at which point the initial ion concentration (S1) was recorded. Next, the Milli-Q water from the treated plant material was boiled for 15 min and shaken for 30 min until it reached room temperature, and the ion concentration was measured again (S2). Electrolyte leakage was calculated as follows: (S1-S0):(S2-S0) × 100%.
Measurement of transpiration rates and stomatal conductance
The transpiration rate and stomatal conductance were measured using a photosynthesis system (LI-6400XT) at a 300 μmol m−2 s−1 light intensity, as described by Li et al. [Citation63]. Wild-type, VC, cas31 mutant and MtCAS31OE plants were subjected to drought stress and used to assess transpiration rates and stomatal conductance.
Measurement of root hydraulic conductivity
Lpr was measured using the hydrostatic pressure method described by Ehlert et al. [Citation64]. To measure the Lpr of wild-type plants and pip2;7 mutants, 2-week-old seedlings that were grown at 24°C under 16-h light (light intensity was 200 μmol m−2s−1)/8-h dark conditions and 70% relative air humidity were employed. The detached root systems of the plants were inserted into a glass bottle filled with half-strength MS culture medium [Citation65] in a pressure chamber. The pressure was gradually increased from 0.2 MPa to 0.8 MPa, and the sap from the de-topped roots was collected and weighed. Finally, the slope of the flow rate-pressure curve (K) was determined, the surface area (A) of the roots was measured using ImageJ (NIH) software, and Lpr was calculated as K:A.
Split-ubiquitin yeast two-hybrid (SuY2H) assay
Because MtPIP2;7 is a membrane protein, the interaction between MtCAS31 and MtPIP2;7 in yeast was verified with the split-ubiquitin system described by Hachez et al. [Citation66]. The vectors pBT3-STE (Dualsystems Biotech, P03233) and pPR3-N (Dualsystems Biotech, P03234) were employed in the SuY2H assay. MtPIP2;7 was inserted into pBT3-STE and fused with Cub (MtPIP2;7-Cub), in which expression was driven by CaMV35S. MtCAS31 was inserted into pPR3-N and fused with NubG (NubG-MtCAS31), and expression was again driven by CaMV35S. Cub represents the C terminus of ubiquitin, and NubG represents the mutant N terminus of ubiquitin. MtPIP2;7-Cub and NubG-MtCAS31 were co-transformed into the Saccharomyces cerevisiae NMY51 strain (Dualsystems Biotech, P04005) via PEG-mediated transformation. MtPIP2;7-Cub/Alg5-NubI was used as the positive control. NubI (N terminus of ubiquitin without mutation), Alg5 (Alg5 protein from yeast), MtPIP2;7-Cub/Alg5-NubG, NubG, and Alg5-Cub/MtCAS31-NubG were employed as negative controls. The positive and negative controls were also transformed into yeast. After transformation, the yeast cells were first plated on SD/-Leu/-Trp. Next, yeast cells transformed with both vectors were dropped onto SD medium (SD/-Trp/-Leu/-Ade/-His) with 70 mM 3-AT (Sangon Biotech, 61–82-5), and the yeast were incubated for 48 h at 30°C. A 20 mg/mL concentration of X-α-gal (Inalco, 1758–0200) was used to test the expression of the LacZ reporter gene.
Subcellular localization and biomolecular fluorescence complementation (BiFC) assay
CaMV35S:MtCAS31-GFP or CaMV35S:MtPIP2;7-GFP was expressed in Arabidopsis protoplasts to study the MtCAS31 and MtPIP2;7 protein subcellular localization. HDEL-RFP was co-transformed with MtCAS31-GFP or MtPIP2;7-GFP into the protoplasts as the ER marker, and GmMAN1-RFP was co-transformed with MtCAS31-GFP into the protoplasts as the ER/Golgi marker. DAPI (20 μg/mL, Sigma, D9542) was used to stain with the nuclear. FM 4–64 (30 μg/mL, Thermo Fisher Scientific, T13320) was used to stain with the cellular membrane. BiFC was employed to study the interaction of MtPIP2;7-MtCAS31 and MtCAS31-MtATG8a in vivo. The vectors that we used in this study were pUC-SPYCE(MR) (C terminus of YFP, YFP[C]) and pUC-SPYNE(R)173 (N terminus of YFP, YFP[N]) driven by the CaMV35S promoter, and the vectors were obtained from Weihua Wu’s lab [Citation67]. The constructs and the respective negative controls were co-transformed into Arabidopsis protoplasts via PEG-mediated transformation. After incubation for 16 h at 24°C, fluorescence was observed via confocal laser scanning microscopy (Olympus FluoView FV1000) with excitation at 488 nm (for GFP fluorescence detection), 518 nm (for DAPI detection) or 546 nm (for RFP detection). Z-stacks (1-3 μm per slice) were then captured.
GST affinity-isolation assay
For protein affinity-isolation experiments, recombinant proteins (MtCAS31-His and GST-MtPIP2;7) were purified using E. coli. MtPIP2;7 was then inserted into the pGEX-4T-1 vector (addgene, 27–4580-01) and fused with a GST tag, and MtCAS31 was inserted into the pET-30a vector (Novagen, 69,909–3) and fused with a His tag. Because MtPIP2;7 is a membrane protein, the nonionic denaturant NP-40 (1%; VWR, VWRCM158-50ML) was added when this protein was prepared. The target proteins (GST-MtPIP2;7) were released from the cells by sonication and further centrifuged and filtered through a 0.45-μm filter. Then, the proteins were purified with Glutathione-Sepharose beads (GE, 52–2303-00AK). Thereafter, the GST protein and GST-MtPIP2;7 were immobilized with Glutathione-Sepharose beads and incubated with MtCAS31-His protein in binding buffer (Binding buffer: 20mM Tris-HCl [PH 7.5], 150mM NaCl, 3mM MgCl2, 1mM DTT and 0.1% Triton X-1000) at 4°C for 3 h [Citation68]. The beads were then washed 3 times with binding buffer, and the samples were boiled, separated via SDS-PAGE, and analyzed by immunoblotting with anti-His and anti-GST antibodies.
Coimmunoprecipitation
Total proteins were extracted from the plant materials that were co-transformed with the indicated constructs and incubated with FLAG beads for 3 h at 4°C to immunoprecipitate the target protein. The FLAG beads were washed with cold IP buffer 3–5 times. The lysis and IP buffer were as follows: 10 mM Tris-HCl (pH 7.4), 150 mM NaCl, 10% glycerin, and 0.5% NP-40 (Amresco, E109). Before use, a protease inhibitor PMSF (2mM, Thermo Fisher Scientific, 36,978) and DTT (1mM, Beyotime, 27,565–41-9) were added to the lysis buffer.
Dehydration and autophagy inhibitor treatment
For dehydration treatment, the transformed hairy roots of wild-type and cas31 mutant plants were soaked in half-strength MS medium with 30% (w:v) PEG 8000 for 8 h. For combined dehydration with ConcA (Abcam, ab144227) or spautin-1 (Sigma, SML0440-5MG) treatment, the inhibitors were added to block autophagy for 4 h in the middle of the 8-h dehydration. After treatment, fluorescence was detected by confocal laser scanning microscopy (Olympus FluoView FV1000).
GFP cleavage assay
To test the autophagy flux, GFP-MtATG8f was expressed in wild-type, cas31 and MtCAS31OE plants by hairy root transformation. Total root protein was extracted in the absence of stress and under 30% PEG dehydration treatment. The protein extract was analyzed with anti-GFP, and GFP-MtATG8f and free GFP were detected. In this assay, NPTII was used as the reference, which was in the same vector as GFP-MtATG8f but expressed from a different cassette. Meanwhile, free GFP was also analyzed by immunoblotting with anti-GFP in M. truncatula hairy roots expressing MtCAS31pro:MtCAS31-GFP under dehydration at different PEG 8000 treatment timepoints and a combined 4 h ConcA with 8-h dehydration treatment.
Antibody
MtCAS31 (full-length) and MtPIP2;7 (full-length) were expressed in the E. coli Rosseta strain using the pET-30a vector, purified and used to produce anti-MtCAS31 and anti-MtPIP2;7, respectively. The antibodies were produced by Beijing Huada Protein (http://proteomics.biogo.net/). The following antibodies were used: anti-FLAG (Sigma, F1804), anti-MYC (Sigma, M4439), anti-HA (Sigma, R3663), anti-GFP (Abmart, M20004S), anti-ATG8 (Abcam, ab4753), anti-His (Proteintech, 66,005–1-Ig), anti-GST (Proteintech, 66,001–2-Ig), anti-H+-ATPase (Agrisera, AS07-260), anti-Histone 3 (Agrisera, AS16-3968), anti-cFBPase (Agrisera, AS04-043), and anti-NPTII (Abcam, ab60018), anti-Actin (CWBIO, CW0264).
Primers
The primers used to construct the vectors in this study are provided in Data Set S1.
Accession numbers
The sequence data from this article have been deposited into the NCBI database. The accession numbers for the genes referenced in this article can be found in Data Set S2 online.
Statistical measurements
The data are presented as the mean±SD. Significant differences between two groups or multiple groups were conducted using the Student’s t-test and one-way ANOVA with the SPSS statistical software (Version 16.0). Asterisks indicate statistically significant differences, *P < 0.05 were considered significant, **P < 0.01 were considered very significant.
Supplemental Material
Download Zip (32.4 MB)Acknowledgments
We thank Wenhao Zhang (Institute of Botany, China Academy of Science) for measuring Lpr. We thank Weihua Wu (State Key Laboratory of Plant Physiology and Biochemistry) for providing the BiFC vectors
Disclosure statement
No potential conflict of interest was reported by the authors.
Supplementary material
Supplemental data for this article can be accessed here.
Additional information
Funding
Related Research Data
References
- Zhu JK. Salt and drought stress signal transduction in plants. Annu Rev Plant Biol. 2002;53(9):247–273.
- Zhu JK. Abiotic stress signaling and responses in plants. Cell. 2016;167(2):313–324.
- Basu S, Ramegowda V, Kumar A, et al. Plant adaptation to drought stress. F1000Res. 2016;5 (F1000 Facultlly Rev):1554.
- Vanhee C, Zapotoczny G, Masquelier D, et al. The Arabidopsis multistress regulator TSPO is a heme binding membrane protein and a potential scavenger of porphyrins via an autophagy-dependent degradation mechanism. Plant Cell. 2011;23(2):785–805.
- Zhai Y, Guo M, Wang H, et al. Autophagy, a conserved mechanism for protein degradation, responds to heat, and other abiotic stresses in Capsicum annuum L. Front Plant Sci. 2016;7(4):131.
- Wang Y, Cai SY, Yin LL, et al. Tomato HsfA1a plays a critical role in plant drought tolerance by activating ATG genes and inducing autophagy. Autophagy. 2015;11(11):2033–2047.
- Hetz C, Papa FR. The unfolded protein response and cell fate control. Mol Cell. 2018;69(2):169–181.
- Hwang J, Qi L. Quality control in the endoplasmic reticulum: crosstalk between ERAD and UPR pathways. Trends Biochem Sci. 2018;43(8):593–605.
- Song S, Tan J, Miao Y, et al. Crosstalk of ER stress-mediated autophagy and ER-phagy: involvement of UPR and the core autophagy machinery. J Cell Physiol. 2018;233(5):3867–3874.
- Senft D, Ronai ZA. UPR, autophagy, and mitochondria crosstalk underlies the ER stress response. Trends Biochem Sci. 2015;40(3):141–148.
- Harrison-Lowe NJ, Olsen LJ. Autophagy protein 6 (ATG6) is required for pollen germination in Arabidopsis thaliana. Autophagy. 2008;4(3):339–348.
- Masclaux-Daubresse C, Chen Q, Have M. Regulation of nutrient recycling via autophagy. Curr Opin Plant Biol. 2017;39(5):8–17.
- Pavel M, Rubinsztein DC. Mammalian autophagy and the plasma membrane. Febs J. 2017;284(5):672–679.
- Nolan TM, Brennan B, Yang M, et al. Selective autophagy of BES1 mediated by DSK2 balances plant growth and survival. Dev Cell. 2017;41(1):33–46.e37.
- Vanhee C, Batoko H. Autophagy involvement in responses to abscisic acid by plant cells. Autophagy. 2011;7(6):655–656.
- Shibata M, Oikawa K, Yoshimoto K, et al. Highly oxidized peroxisomes are selectively degraded via autophagy in Arabidopsis. Plant Cell. 2013;25(12):4967–4983.
- Hachez C, Veljanovski V, Reinhardt H, et al. The Arabidopsis abiotic stress-induced TSPO-related protein reduces cell-surface expression of the aquaporin PIP2;7 through protein-protein interactions and autophagic degradation. Plant Cell. 2014;26(12):4974–4990.
- Ryabovol VV, Minibayeva FV. Molecular mechanisms of autophagy in plants: role of ATG8 proteins in formation and functioning of autophagosomes. Biochemistry (Mosc). 2016;81(4):348–363.
- Zhuang XH, Wang H, Lam SK, et al. A BAR-domain protein SH3P2, which binds to phosphatidylinositol 3-phosphate and ATG8, regulates autophagosome formation in Arabidopsis. Plant Cell. 2013;25(11):4596–4615.
- Kellner R, de la Concepcion JC, Maqbool A, et al. ATG8 expansion: a driver of selective autophagy diversification? Trends Plant Sci. 2017;22(3):204–214.
- Marshall RS, Li F, Gemperline DC, et al. Autophagic degradation of the 26S proteasome is mediated by the dual ATG8/Ubiquitin receptor RPN10 in Arabidopsis. Mol Cell. 2015;58(6):1053–1066.
- Honig A, Avin-Wittenberg T, Ufaz S, et al. A new type of compartment, defined by plant-specific Atg8-interacting proteins, is induced upon exposure of Arabidopsis plants to carbon starvation. Plant Cell. 2012;24(1):288–303.
- Svenning S, Lamark T, Krause K, et al. Plant NBR1 is a selective autophagy substrate and a functional hybrid of the mammalian autophagic adapters NBR1 and p62/SQSTM1. Autophagy. 2011;7(9):993–1010.
- Michaeli S, Honig A, Levanony H, et al. Arabidopsis ATG8-INTERACTING PROTEIN1 is involved in autophagy-dependent vesicular trafficking of plastid proteins to the vacuole. Plant Cell. 2014;26(10):4084–4101.
- Hernandez-Sanchez IE, Martynowicz DM, Rodriguez-Hernandez AA, et al. A dehydrin-dehydrin interaction: the case of SK3 from Opuntia streptacantha. Front Plant Sci. 2014;5(2):520.
- Graether SP, Boddington KF. Disorder and function: a review of the dehydrin protein family. Front Plant Sci. 2014;5(1):576.
- Xie C, Zhang R, Qu Y, et al. Overexpression of MtCAS31 enhances drought tolerance in transgenic Arabidopsis by reducing stomatal density. New Phytol. 2012;195(1):124–135.
- Xing X, Liu YK, Kong XP, et al. Overexpression of a maize dehydrin gene, ZmDHN2b, in tobacco enhances tolerance to low temperature. Plant Growth Regul. 2011;65(1):109–118.
- Kovacs D, Kalmar E, Torok Z, et al. Chaperone activity of ERD10 and ERD14, two disordered stress-related plant proteins. Plant Physiol. 2008;147(1):381–390.
- Hara M. The multifunctionality of dehydrins: an overview. Plant Signal Behav. 2010;5(5):503–508.
- Hara M, Fujinaga M, Kuboi T. Metal binding by citrus dehydrin with histidine-rich domains. J Exp Bot. 2005;56(420):2695–2703.
- Li X, Feng H, Wen J, et al. MtCAS31 aids symbiotic nitrogen fixation by protecting the leghemoglobin MtLb120-1 under drought stress in Medicago truncatula. Front Plant Sci. 2018;9(5):633.
- Madge J. The protection of membranes from cold-stress: a structural study of the intrinsically disordered dehydrin bound to micelles and liposomes. Biophys J. 2014;106(2):426a.
- Cuevas-Velazquez CL, Rendon-Luna DF, Covarrubias AA. Dissecting the cryoprotection mechanisms for dehydrins. Front Plant Sci. 2014;5(1):583.
- Wang TZ, Zhang JL, Tian QY, et al. A Medicago truncatula EF-Hand family gene, MtCaMP1, is involved in drought and salt stress tolerance. PLoS One. 2013;8(4):358952.
- Larrainzar E, Molenaar JA, Wienkoop S, et al. Drought stress provokes the down-regulation of methionine and ethylene biosynthesis pathways in Medicago truncatula roots and nodules. Plant Cell Environ. 2014;37(9):2051–2063.
- Almeida-Rodriguez AM, Cooke JEK, Yeh F, et al. Functional characterization of drought-responsive aquaporins in populus balsamifera and populus simonii x Balsamifera clones with different drought resistance strategies. Physiol Plant. 2010;140(4):321–333.
- Wang L, Li QT, Lei Q, et al. MzPIP2;1: an aquaporin involved in radial water movement in both water uptake and transportation, altered the drought and salt tolerance of transgenic Arabidopsis. PLoS One. 2015;10(11):e0142446.
- Aharon R, Shahak Y, Wininger S, et al. Overexpression of a plasma membrane aquaporin in transgenic tobacco improves plant vigor under favorable growth conditions but not under drought or salt stress. Plant Cell. 2003;15(2):439–447.
- Li J, Ban L, Wen H, et al. An aquaporin protein is associated with drought stress tolerance. Biochem Biophys Res Commun. 2015;459(2):208–213.
- Gomes D, Agasse A, Thiebaud P, et al. Aquaporins are multifunctional water and solute transporters highly divergent in living organisms. Biochim Biophys Acta Biomembr. 2009;1788(6):1213–1228.
- Porcel R, Aroca R, Azcon R, et al. PIP aquaporin gene expression in Arbuscular mycorrhizal glycine max and Lactuca sativa plants in relation to drought stress tolerance. Plant Mol Biol. 2006;60(3):389–404.
- Lee HK, Cho SK, Son O, et al. Drought stress-induced Rma1H1, a RING membrane-anchor E3 ubiquitin ligase homolog, regulates aquaporin levels via ubiquitination in transgenic Arabidopsis plants. Plant Cell. 2009;21(2):622–641.
- Alexandersson E, Danielson JAH, Rade J, et al. Transcriptional regulation of aquaporins in accessions of Arabidopsis in response to drought stress. Plant J. 2010;61(4):650–660.
- Kayum MA, Park JI, Nath UK, et al. Genome-wide expression profiling of aquaporin genes confer responses to abiotic and biotic stresses in Brassica rapa. BMC Plant Biol. 2017;17(1):23.
- Nada RM, Abogadallah GM. Aquaporins are major determinants of water use efficiency of rice plants in the field. Plant Sci. 2014;227(2):165–180.
- Yue C, Cao HL, Wang L, et al. Molecular cloning and expression analysis of tea plant aquaporin (AQP) gene family. Plant Physiol Biochem. 2014;83(1):65–76.
- Chaumont F, Tyerman SD. Aquaporins: highly regulated channels controlling plant water relations. Plant Physiol. 2014;164(4):1600–1618.
- Goyal K, Walton LJ, Tunnacliffe A. LEA proteins prevent protein aggregation due to water stress. Biochem J. 2005;388(Pt 1):151–157.
- Zhuang X, Chung KP, Cui Y, et al. ATG9 regulates autophagosome progression from the endoplasmic reticulum in Arabidopsis. Proc Natl Acad Sci U S A. 2017;114(3):E426–E435.
- Hafren A, Macia JL, Love AJ, et al. Selective autophagy limits cauliflower mosaic virus infection by NBR1-mediated targeting of viral capsid protein and particles. Proc Natl Acad Sci U S A. 2017;114(10):E2026–E2035.
- Marshall RS, Hua Z, Mali S, et al. ATG8-binding UIM proteins define a new class of autophagy adaptors and receptors. Cell. 2019;177:766–781.e24.
- Yang F, Kimberlin AN, Elowsky CG, et al. A plant immune receptor degraded by selective autophagy. Mol Plant. 2019;12(1):113–123.
- Maurel C, Verdoucq L, Luu DT, et al. Plant aquaporins: membrane channels with multiple integrated functions. Annu Rev Plant Biol. 2008;59(1):595–624.
- Yaneff A, Vitali V, Amodeo G. PIP1 aquaporins: intrinsic water channels or PIP2 aquaporin modulators? FEBS Lett. 2015;589(23):3508–3515.
- Yang L, Jin G, Zhao X, et al. PIP: a database of potential intron polymorphism markers. Bioinformatics. 2007;23(16):2174–2177.
- Hachez C, Besserer A, Chevalier AS, et al. Insights into plant plasma membrane aquaporin trafficking. Trends Plant Sci. 2013;18(6):344–352.
- Da Silva MD, Silva RL, Costa Ferreira Neto JR, et al. Expression analysis of sugarcane aquaporin genes under water deficit. J Nucleic Acids. 2013;2013(7):763945.
- Alavilli H, Awasthi JP, Rout GR, et al. Overexpression of a barley aquaporin gene, HvPIP2;5 confers salt and osmotic stress tolerance in yeast and plants. Front Plant Sci. 2016;7(2):1566.
- Zupin M, Sedlar A, Kidric M, et al. Drought-induced expression of aquaporin genes in leaves of two common bean cultivars differing in tolerance to drought stress. J Plant Res. 2017;130(4):735–745.
- Cosson V, Eschstruth A, Ratet P. Medicago truncatula transformation using leaf explants. Agrobacterium Protoc. 2015;1223(4):43–56.
- Boisson-Dernier A, Chabaud M, Garcia F, et al. Agrobacterium rhizogenes-transformed roots of Medicago truncatula for the study of nitrogen-fixing and endomycorrhizal symbiotic associations. Mol Plant Microbe Interact. 2001;14(6):695–700.
- Li H, Ma DY, Jin YS, et al. Helper component-proteinase enhances the activity of 1-deoxy-(D)-xylulose-5-phosphate synthase and promotes the biosynthesis of plastidic isoprenoids in Potato virus Y-infected tobacco. Plant Cell Environ. 2015;38(10):2023–2034.
- Ehlert C, Maurel C, Tardieu F, et al. Aquaporin-mediated reduction in maize root hydraulic conductivity impacts cell turgor and leaf elongation even without changing transpiration. Plant Physiol. 2009;150(2):1093–1104.
- Li YS, Mao XT, Tian QY, et al. Phosphorus deficiency-induced reduction in root hydraulic conductivity in Medicago falcata is associated with ethylene production. Environ Exp Bot. 2009;67(1):172–177.
- Hachez C, Laloux T, Reinhardt H, et al. Arabidopsis SNAREs SYP61 and SYP121 coordinate the trafficking of plasma membrane aquaporin PIP2;7 to modulate the cell membrane water permeability. Plant Cell. 2014;26(7):3132–3147.
- Ren XL, Qi GN, Feng HQ, et al. Calcineurin B-like protein CBL10 directly interacts with AKT1 and modulates K+ homeostasis in Arabidopsis. Plant J. 2013;74(2):258–266.
- Xu ZY, Kim SY, Hyeon Do Y, et al. The Arabidopsis NAC transcription factor ANAC096 cooperates with bZIP-type transcription factors in dehydration and osmotic stress responses. Plant Cell. 2013;25(11):4708–4724.