
ABSTRACT
Macroautophagy (autophagy) is a key catabolic pathway for the maintenance of proteostasis through constant digestion of selective cargoes. The selectivity of autophagy is mediated by autophagy receptors that recognize and recruit cargoes to autophagosomes. SQSTM1/p62 is a prototype autophagy receptor, which is commonly found in protein aggregates associated with major neurodegenerative diseases. While accumulation of SQSTM1 implicates a disturbance of selective autophagy pathway, the pathogenic mechanism that contributes to impaired autophagy degradation remains poorly characterized. Herein we show that amyotrophic lateral sclerosis (ALS) and frontotemporal lobar degeneration (FTLD)-linked mutations of TBK1 and SQSTM1 disrupt selective autophagy and cause neurotoxicity. Our data demonstrates that proteotoxic stress activates serine/threonine kinase TBK1, which coordinates with autophagy kinase ULK1 to promote concerted phosphorylation of autophagy receptor SQSTM1 at the UBA domain and activation of selective autophagy. In contrast, ALS-FTLD-linked mutations of TBK1 or SQSTM1 reduce SQSTM1 phosphorylation and compromise ubiquitinated cargo binding and clearance. Moreover, disease mutation SQSTM1G427R abolishes phosphorylation of Ser351 and impairs KEAP1-SQSTM1 interaction, thus diminishing NFE2L2/Nrf2-targeted gene expression and increasing TARDBP/TDP-43 associated stress granule formation under oxidative stress. Furthermore, expression of SQSTM1G427R in neurons impairs dendrite morphology and KEAP1-NFE2L2 signaling. Therefore, our results reveal a mechanism whereby pathogenic SQSTM1 mutants inhibit selective autophagy and disrupt NFE2L2 anti-oxidative stress response underlying the neurotoxicity in ALS-FTLD.
Abbreviations: ALS: amyotrophic lateral sclerosis; FTLD: frontotemporal lobar degeneration; G3BP1: GTPase-activating protein (SH3 domain) binding protein 1; GSTM1: glutathione S-transferase, mu 1; HMOX/HO-1: Heme oxygenase 1; IP: immunoprecipitation; KEAP1: kelch-like ECH associated protein 1; KI: kinase inactive; KIR: KEAP1 interaction region; KO: knockout; MAP1LC3/LC3: microtubule-associated protein 1 light chain 3; MBP: maltose binding protein; NBR1: NBR1, autophagy cargo receptor; NFE2L2/Nrf2: nuclear factor, erythroid derived 2, like 2; NQO1: NAD(P)H quinone dehydrogenase 1; SQSTM1/p62: sequestosome 1; SOD1: superoxide dismutase 1, soluble; S.S.: serum starvation; TARDBP/TDP-43: TAR DNA binding protein; TBK1: TANK binding kinase 1; UBA: ubiquitin association; ULK1: unc-51 like autophagy activating kinase 1; WT: wild type.
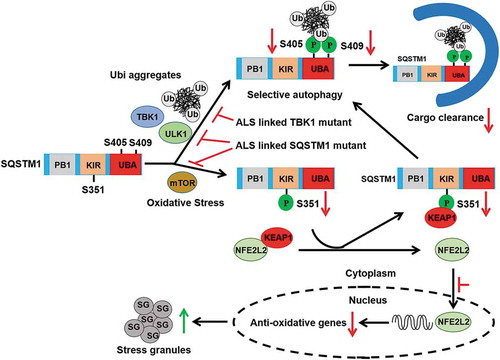
Graphic abstract
Introduction
Amyotrophic lateral sclerosis (ALS) and frontotemporal lobar degeneration (FTLD) are closely related neurodegenerative disorders that are considered part of the same disease spectrum [Citation1–Citation3]. A common feature of ALS and FTLD is the presence of protein and protein-RNA aggregates in affected motor neurons, implicating impairment of protein degradation in the disease process [Citation4]. More than 30 different genes are associated with ALS-FTLD, including SOD1, C9ORF72, TARDBP/TDP-43, OPTN (optineurin), SQSTM1/p62 and TBK1 (TANK-binding kinase 1). TARDBP is an RNA binding protein linked to RNA metabolism that harbors prion-like domains allowing it relocate to cytosol stress granules upon stress condition [Citation5]. SQSTM1 and OPTN are autophagy receptors that mediate selective autophagy, which is a critical pathway for the removal of aggregation-prone proteins and damaged organelles [Citation6–Citation8]. Autophagy receptors recognize specific cargoes and recruit them to the autophagosome for degradation via the lysosome. TBK1, a kinase known to phosphorylate both SQSTM1 and OPTN [Citation8–Citation10], was recently identified as an ALS causal gene [Citation11,Citation12]. Recent studies showed that reduced TBK1 expression in mice promotes TARDBP aggregation, axonal degeneration and neuronal loss [Citation13]. Specific mutations of TBK1, e.g. TBK1E696K, disrupt OPTN-TBK1 interaction and block efficient autophagosome formation [Citation12,Citation14]. Thus, the evidence raises the possibility that aberrant phosphorylation of autophagy receptors by TBK1 affects the recognition of autophagic cargoes, leading to a defect in clearance of protein aggregates.
SQSTM1 is a scaffold protein that functions in diverse signaling pathways, including amino acid sensing, oxidative stress and DNA damage response [Citation15,Citation16]. SQSTM1 harbors different types of protein – protein interaction domains, including Phox and Bem1 (PB1), LC3-interacting region (LIR) and ubiquitin association (UBA) domains. Multiple kinases have been shown to phosphorylate SQSTM1. Both CSNK2A1/CK2 and TBK1 phosphorylate SQSTM1 at Ser403 (equivalent to Ser405 in mice) in the UBA domain, which increases the affinity of SQSTM1 for ubiquitinated cargo [Citation9,Citation17]. Autophagy kinase ULK1 phosphorylates neighboring Ser407 (equivalent to Ser409 in mice), leading to the destabilization of the UBA dimer of SQSTM1 and promotion of Ser403 phosphorylation, and thus enhancing selective autophagy degradation [Citation6]. The evidence suggests a concerted action of multiple kinases for regulating SQSTM1 functions during selective autophagy.
SQSTM1-associated neuronal inclusions are common in ALS-FTLD brains [Citation18–Citation20]. The prevalence of SQSTM1 inclusions in ALS-FTLD patients suggests that ALS-FTLD is a proteinopathy in which aggregation and phosphorylation of SQSTM1 represents a stress response that invokes selective autophagy [Citation21,Citation22]. Recent reports showed that SQSTM1 promotes the clearance of stress granule, a hallmark of ALS-FTLD via selective autophagy [Citation23,Citation24]. Knockdown of Sqstm1 in zebrafish caused an abnormal locomotor phenotype, which was ameliorated by an Mtor inhibitor (rapamycin, an autophagy activator) and could also be rescued by wild-type (WT) human SQSTM1 but not the ALS-FTLD-associated SQSTM1P394L mutant [Citation25]. In addition, the ALS-FTLD-associated mutation SQSTM1L341V mutant was shown to occur in LIR motifs that were defective for recognizing MAP1LC3B/LC3B and ubiquitinated cargo delivery [Citation26].
Emerging evidence suggests that oxidative stress is an important contributing factor in ALS [Citation27]. A central regulator of the antioxidant response in cells is the NFE2L2/Nrf2 (nuclear factor, erythroid derived 2, like 2)-KEAP1 (kelch-like ECH-associated protein 1) signal. NFE2L2 is a basic region leucine zipper transcription factor, which is negatively regulated by KEAP1 under normal condition. When the cell is insulted by oxidative stress, NFE2L2 dissociates from KEAP1, translocates into the nucleus and promotes the transcription of antioxidant response genes [Citation28–Citation30]. Notably, the impairment of NFE2L2 antioxidant pathway has been linked to ALS [Citation27,Citation31]. SQSTM1 is a pivotal regulator of the NFE2L2 antioxidative stress response through KEAP1 binding (via SQSTM1 motif KEAP1 interacting region [KIR]) [Citation32]. Interestingly, biochemical analysis of the ALS-linked mutations of SQSTM1 (SQSTM1P348L and SQSTM1G351A) show a loss of KEAP1 binding and reduced ability to activate NFE2L2 signaling [Citation33]; however, the pathogenic role for mutant SQSTM1 in neurotoxicity relevant to ALS-FTLD remains poorly understood.
Here, we investigated the potential pathogenic mechanism for TBK1 and SQSTM1 linked ALS-FTLD. We show that ALS-FTLD-associated mutations of TBK1 and SQSTM1 disrupt selective autophagy. Our results reveal a mechanism whereby pathogenic SQSTM1 mutant impairs selective autophagy and causes neurotoxicity by disrupting NFE2L2 anti-oxidative stress response underlying the cause of ALS-FTLD.
Results
Proteotoxic stress activates TBK1 activity and ALS-FTLD-linked mutations of TBK1 impair SQSTM1 phosphorylation at UBA
Our previous study showed that ULK1 phosphorylation of SQSTM1 regulated SQSTM1-mediated selective autophagy in response to proteotoxic stress [Citation6]. Here we asked if TBK1 can be activated under the similar stress conditions such as proteasome inhibition and expression of disease protein aggregates [Citation6]. Our results showed that MG132 treatment, which increases ubiquitinated proteins by inhibiting proteasome, causes an increase of phosphorylation of TBK1 at Ser172, an autophosphorylation site indicative of TBK1 activity [Citation34,Citation35], as shown in western blot and immunostaining analysis (, and Figure S1A). Cell fractionation assay indicated that p-Ser172 TBK1 primarily localizes in the insoluble fraction upon MG132 treatment (Figure S1B). In addition, expression of poly-103Q-mCFP (carrying polyQ expansion) in HeLa cells also increased p-Ser172 TBK1 levels. We also assessed TBK1 autophosphorylation in cells expressing SOD1G93A or WT SOD1. SOD1G93A is associated with familial form of ALS and prone to aggregate formation [Citation36]. We found that phosphorylation of TBK1 at Ser172 was increased upon the expression of SOD1G93A but not WT SOD1 (). Thus, the above evidence suggests that TBK1, similar to ULK1, is activated upon proteotoxic stress.
Figure 1. Proteotoxic stresses activate TBK1 activity and ALS-FTLD-linked mutations of TBK1 impair SQSTM1 phosphorylation. (A) WT MEFs were treated with or without MG132 (2 μM) for 16 h to induce proteotoxic stress. Cells were lysed, followed by immunoblot analysis with the indicated antibodies. (B) The ratio of p-TBK1 (Ser172) to total TBK1 in A was shown. One sample t-tests were used, and values are presented as the mean ± SEM (n = 4). ** p < 0.01. (C) HeLa/103QHTT-mCFP inducible stable cells were treated with doxycycline to control the expression of polyQ-mCFP protein. Cells were lysed, followed by immunoblot analysis with the indicated antibodies. GFP antibody was used to indicate the induction of polyQ-mCFP proteins. (D) The ratio of p-TBK1 (Ser172) to total TBK1 proteins in C was shown. One sample t-tests were used, and values are presented as the mean ± SEM (n = 4). ** p < 0.01. (E) NSC34 stable cells including mock, SOD1 WT, and SOD1G93A were lysed, followed by immunoblot analysis with the indicated antibodies. (F) The ratio of p-TBK1 (Ser172) to total TBK1 protein in E was shown. Student t-tests were used, and values are presented as the mean ± SEM (n = 3). ** p < 0.01; ns, not significant. (G) Schematic view of TBK1 protein functional domain. S/T, serine/threonine; Ub-like, ubiquitin like domain; CCD1/2, two C-terminal coiled-coil domains. The positions for ALS-FTLD-linked mutations of TBK1 are indicated. (H) HEK 293T cells were co-transfected with Flag-SQSTM1 and different TBK1 variants. IP was performed with Flag antibody. Immunoblot analysis was done with indicated antibodies. (I) The ratio of p-S409 and p-S405, to total Flag-SQSTM1 in H was shown. One-way ANOVA test was used and followed by Tukey’s post hoc test, and values are presented as the mean ± SEM (n = 3). *** p < 0.001; ns, not significant. (J) Expression of different TBK1 variants in HEK293T cells were examined with the indicated antibodies. (K) The ratio of p-TBK1 (Ser172) to total MYC-TBK1 in J was shown. One-way ANOVA test was used and followed by Tukey’s post hoc test, and values are presented as mean ± SEM (n = 3). *** p < 0.001; ns, not significant.
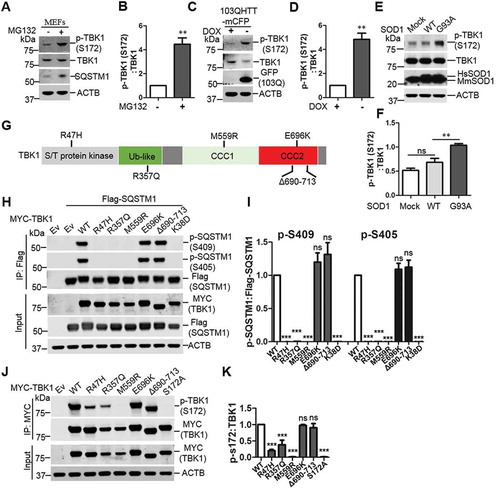
Since TBK1 phosphorylates SQSTM1 at Ser403 (equivalent to mouse SQSTM1 Ser405) [Citation9], we next examined if TBK1 pathogenic mutants affect SQSTM1 Ser405 phosphorylation. Multiple variants of TBK1 have been reported as risk factors for ALS-FTLD [Citation11,Citation12,Citation37]. We then co-expressed SQSTM1 and different TBK1 mutants in HEK293T cells. The results showed that three TBK1 variants, TBK1R47H, TBK1R357Q and TBK1M559R, lost their abilities to phosphorylate Ser405 or Ser409 of SQSTM1, while two other mutants, TBK1E696K and TBK1∆690–713, displayed no significant change in SQSTM1 phosphorylation (). As controls, TBK1K38D (kinase-dead mutant) or TBK1S172A (autophosphorylation null) failed to induce SQSTM1 phosphorylation at Ser405 or Ser409 (Figure S1C). We verified the kinase activity of the above TBK1 mutants by assaying p- Ser172 ().
TBK1 phosphorylation of SQSTM1 depends on ULK1 activity and ALS-FTLD-linked SQSTM1 mutations reduce phosphorylation of SQSTM1 mediated by ULK1
Our previous study suggested a concerted phosphorylation of Ser409 and Ser405 of SQSTM1 upon proteotoxic stress including expression of disease related proteins and proteasome inhibition through MG132 treatment [Citation6]. We next asked if ULK1 and TBK1 coordinated the phosphorylation of Ser409 and Ser405. First, we performed phosphorylation assays with purified recombinant SQSTM1 and ULK1-ATG13 or TBK1. ULK1 phosphorylated SQSTM1 at Ser409 but not Ser405, whereas TBK1 modestly phosphorylated SQSTM1 at Ser405 but not at Ser409. However, combining ULK1-ATG13 and TBK1 in the same assay with SQSTM1 caused a marked increase in the p-Ser405 but not p-Ser409 of SQSTM1 (). Second, we observed that TBK1 overexpression induced the phosphorylation of SQSTM1 at both Ser405 and Ser409 in the cells (Figure S1C). However, the phosphorylation of Ser409 and Ser405 diminished when TBK1 was co-expressed with the ULK1 mutant with kinase inhibition (KI), a dominant negative mutant of ULK1 kinase activity [Citation38] (Figure S2). Furthermore, we found that, under proteasome inhibition condition, treatment of an ULK1 kinase specific inhibitor (SBI0206965) reduced the levels of p-Ser409 as well as p-Ser405 (), consistent with the idea that the p-Ser405 depends on p-Ser409 [Citation6]. The above results suggest that TBK1-mediated p-Ser405 depends on ULK1 mediated p-Ser409 in SQSTM1 UBA ().
Figure 2. The effects of ULK1 in TBK1 mediated SQSTM1 phosphorylation and ALS-FTLD-linked mutations of SQSTM1 in the phosphorylation of SQSTM1. (A) Phosphorylation assay was performed with purified SQSTM1, TBK1 and ULK1 proteins. The immunoblot analysis was done with the indicated antibodies. (B) MEFs were treated with MG132 (2 μM) and/or SBI-0206965 (2 μM), ULK1 inhibitor. Cells were lysed, followed by immunoblot analysis with the indicated antibodies. (C-D) The ratio of p-SQSTM1 (at Ser405 and Ser409) to total SQSTM1 protein in B was shown. One sample t-tests were used, and values are presented as the mean ± SEM (n = 3). ** p < 0.01, * p < 0.05. (E) Schematic depiction of the sequential phosphorylation of SQSTM1 mediated by ULK1 and TBK1. (F) Schematic view of SQSTM1 protein functional domains. PB1: Phox and Bem1 domain; ZZ: zinc finger motif; TRAF6: TNF receptor associated factor 6; PEST: proline, glutamic acid, serine, and threonine domain; LIR: LC3 interaction region; KIR: KEAP1 interaction region; UBA: ubiquitin association domain. The amino acid number in red indicates the phosphorylation site relevant to this study. The number in black indicates ALS-FTLD linked mutations in the UBA domain. The number is based on the mouse SQSTM1 sequence, and those in brackets indicate the corresponding position in human SQSTM1. (G-J) In vitro phosphorylation assays were performed with ULK1-TBK1 and purified SQSTM1 variants proteins. Immunoblot analysis with the indicated antibodies was followed. The ratio of p-S409 (H) or p-S405 (J) to total SQSTM1 protein was shown. One-way ANOVA test was used and followed by Tukey’s post hoc test, and values are presented as the mean ± SEM (H: n = 5; J: n = 3). * p < 0.05, *** p < 0.001. (K) HEK 293T cells were co-transfected with Flag-SQSTM1 and MYC-ULK1-WT or ULK1-KI. Immunoblot analysis was done with the indicated antibodies. (L-M) The ratio of p-SQSTM1, including p-S409 (L) and p-S405 (M), to total Flag-SQSTM1 protein was shown. One-way ANOVA test was used and followed by Tukey’s post hoc test, and values are presented as the mean ± SEM (n = 3). *** p < 0.001; ns, not significant.
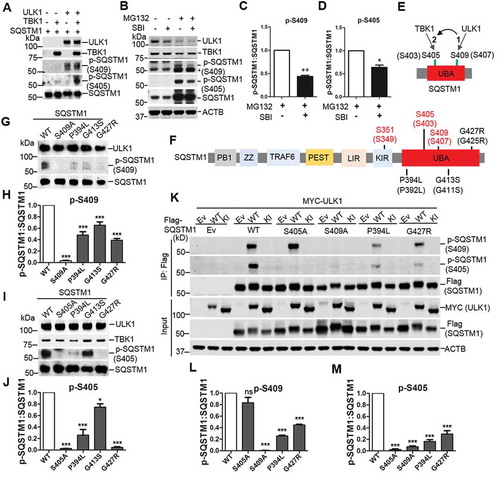
Moreover, we determined if disease-associated SQSTM1 mutants affect SQSTM1 phosphorylation at the UBA domain by ULK1 and TBK1. We selected three UBA domain mutants of SQSTM1, SQSTM1P394L, SQSTM1G413S, and SQSTM1G427R, for the test (). We used purified SQSTM1 mutant proteins in a phosphorylation assay in the presence of ULK1-ATG13 kinase complex. Our results showed that p-Ser409 or p-Ser405 levels are diminished in the above SQSTM1 mutants (). In HEK293T cells co-transfected with the ULK1 and SQSTM1 variant plasmids, the p-Ser409 and p-Ser405 are both reduced in the SQSTM1P394L and SQSTM1G427R mutants. As controls, SQSTM1S409A mutant displayed impaired p-Ser405, but the S405A retains normal levels of p-Ser409 (), in agreement with the idea that the p-Ser409 is required for the p-Ser405 [Citation6].
ALS-FTLD-linked mutation in SQSTM1 reduces the binding of ubiquitinated proteins and ULK1
Phosphorylation of SQSTM1 at the UBA domain enhances its binding affinity to ubiquitinated (Ub) cargoes, promoting their delivery to autophagosome for degradation [Citation6,Citation17]. We then determined whether the Ub binding was altered in the SQSTM1 mutants. Purified fusion MBP (maltose binding protein)-SQSTM1 mutants were incubated with K63 poly-Ub chains, followed by MBP-SQSTM1 pull down. The results showed reduced binding affinity of the SQSTM1P394L, SQSTM1G413S, and SQSTM1G427R mutants to K63 poly-Ub chains compared to WT. As controls, SQSTM1S409E exhibited an increased binding, whereas SQSTM1S409A displayed a decreased binding, to K63 poly-Ub chains (), consistent with our previous report [Citation6]. We next examined the binding between SQSTM1 mutants and poly-Ub proteins in the cells by following a previously established procedure that distinguishes SQSTM1-associated poly-Ub proteins from SQSTM1 self-ubiquitination [Citation6]. The results again indicated that the SQSTM1P394L, SQSTM1G413S, and SQSTM1G427R variants have reduced binding to poly-Ub proteins. Similarly, SQSTM1S405A or SQSTM1S409A diminished the binding, while SQSTM1S409E enhanced the binding to poly-Ub proteins (). Proteasome inhibition through MG132 treatment induces the interaction of ULK1 and SQSTM1, which contributes to the ULK1-mediated SQSTM1 phosphorylation [Citation6]. We then tested the interaction of ULK1 with SQSTM1 variants. The results demonstrated a reduced ULK1 binding to SQSTM1P394L, SQSTM1G413S, and SQSTM1G427R, compared to WT ().
Figure 3. ALS-FTLD-linked mutations of SQSTM1 in the UBA domain affect its binding to ubiquitin and ULK1. (A) MBP and MBP-SQSTM1 variants were subjected to pull down in the presence of K63-linked ubiquitin peptides. Interaction of SQSTM1 variants and Ubs was detected by immunoblot analysis with Ub antibody. (B) Ubiquitin levels pulled down by the MBP-SQSTM1 variants were normalized to protein input and compared to that of MBP-SQSTM1 WT protein. One-way ANOVA test was used and followed by Tukey’s post hoc test, and values are presented as mean ± SEM (n = 6). ** p < 0.01, *** p < 0.001. (C) Cellular lysates of sqstm1 KO MEFs transfected with Flag-SQSTM1 variants were incubated with sqstm1 KO MEFs lysates treated with MG132, followed by IP with anti-Flag antibody. (D) Quantification of the results from C was obtained by normalizing the levels of immunoprecipitated Ub to each Flag-SQSTM1 variant, and then variants were normalized to WT. One-way ANOVA test was used and followed by Tukey’s post hoc test, and values are presented as mean ± SEM (n = 4). *** p < 0.001. (E) Cellular lysates of sqstm1 KO MEFs transfected with Flag-SQSTM1 variants were immunoprecipitated with anti-ULK1 antibody. Immunoblot analysis with the indicated antibodies was followed. (F) Quantification of the results from E was obtained by normalizing levels of immunoprecipitated Flag to the level of input, then further normalized to the level of immunoprecipitated ULK1. One-way ANOVA test was used and followed by Tukey’s post hoc test, and values are presented as the mean ± SEM (n = 3). *** p < 0.001. (G) The SQSTM1P394L and SQSTM1G427R mutations are mapped onto the model structure of the SQSTM1 UBA domain complexed with ubiquitin. The mutated residues are shown as stick models. (H) Binding affinities of SQSTM1 UBA WT or UBAG427R mutant to mono-Ub were measured by ITC. Representative ITC profiles are shown.
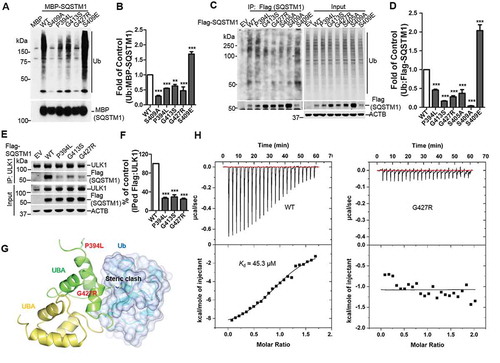
To understand the molecular mechanism for how these ALS-FTLD-linked mutations affect the interaction of SQSTM1 and ubiquitinated protein, we applied structural modeling of SQSTM1 UBA domain in complex with mono-ubiquitin (mono-Ub) by docking the SQSTM1 UBA structure (PDB ID 3B0F) onto the structure of the NBR1 UBA domain in complex with mono-Ub (PDB ID 2MJ5). The SQSTM1P394L, SQSTM1G413S and SQSTM1G427R mutations were then mapped onto the model accordingly ( and S3A). Similar to a previous report, the SQSTM1P394L mutation is located far away from either the ubiquitin binding site or the dimer interface of the UBA domain () [Citation39]. Thus, the impact of this mutation on SQSTM1-ubiquitin interaction cannot be readily derived from the modeling. On the other hand, residue Gly427 is found in the vicinity of ubiquitin binding area and the SQSTM1G427R mutation, with its extended side chain, is predicted to lead to direct steric clash with Ub and thus weakening the SQSTM1-Ub interaction (). Furthermore, the SQSTM1G413S mutation is at the dimer interface of the UBA domain and predicted to form an additional hydrogen bond with Arg415 of another UBA molecule (Figure S3A). This interaction may modestly stabilize the dimeric form of the UBA domain, which would negatively affect its interaction with Ub as shown in our previous study [Citation6].
To validate our modeling predictions on SQSTM1G413S and SQSTM1G427R, we measured the binding affinity of these UBA domain mutants to mono-Ub by Isothermal Titration Calorimetry (ITC) assays. Our data confirms that the SQSTM1G427R mutation completely abolishes the interaction between the UBA domain and mono-Ub, whereas the SQSTM1G413S mutation shows little difference in binding of mono-Ub as compared to WT (Kd of 40.7 μM vs 45.3 μM) ( and S3B). This ITC result is largely consistent with the previous report, in which NMR titration experiments were used to measure the impact of these mutations on UBA dimer formation and interaction with mono-Ub [Citation39]. One notable difference is the measured value of Kd. While the NMR study estimated 5 to 10-fold reduction for the SQSTM1G427R mutant, our ITC data showed complete abolishment of interaction. Moreover, our data suggests that SQSTM1G413S may affect SQSTM1 binding of poly-Ub proteins through a different mechanism (in contrast to SQSTM1G427R) that has yet to be determined.
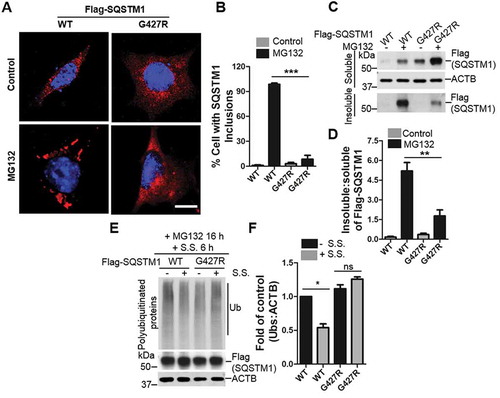
ALS-FTLD-linked mutation SQSTM1G427R impairs SQSTM1-mediated sequestration and clearance of ubiquitinated proteins under proteotoxic stress
We then focused on characterization of the mutant SQSTM1G427R, which showed a significant impairment in Ub binding in the ITC analysis. We established a stable mouse embryonic fibroblast (MEF) cell line expressing SQSTM1G427R in sqstm1 knockout (KO) background. Under normal conditions, immunofluorescence analysis showed that the SQSTM1G427R cells displayed no difference in localization from the control WT SQSTM1. However, upon MG132 treatment, SQSTM1 formed large inclusions in the WT SQSTM1 MEFs, whereas the MEF expressing the SQSTM1G427R mutant showed reduced inclusion body formation (). Immunoblot analysis showed that the insoluble fraction of the SQSTM1G427R was markedly reduced compared to WT SQSTM1 upon MG132 treatment (), consistent with the cell imaging result. These results demonstrate the defective sequestration in the SQSTM1G427R mutant. Furthermore, we treated WT SQSTM1 and SQSTM1G427R MEF with MG132 and then induced autophagy through serum starvation (S.S.) to examine the clearance of ubiquitinated proteins. In WT SQSTM1 cells, accumulated ubiquitinated proteins were efficiently cleared upon serum starvation, whereas serum starvation has little effect in the clearance of ubiquitinated proteins in SQSTM1G427R MEF. Thus, the SQSTM1G427R mutation blocks the degradation of ubiquitinated proteins under proteotoxic stress ().
Figure 4. ALS-FTLD mutant SQSTM1G427R of SQSTM1 displays impaired sequestration and clearance of ubiquitinated proteins. (A) MEFs sqstm1 KO stably expressing Flag-SQSTM1 WT or SQSTM1G427R mutant were treated with MG132, followed by immunofluorescent staining with anti-SQSTM1 antibody. Scale bar: 10 μm. (B) Quantification of the results in A was performed by counting the number of cells containing SQSTM1 inclusions. Then, the number of cells containing SQSTM1 inclusions was normalized to the total number of cells. Student t-test was used, and values are presented as the mean ± SEM (n = 3). *** p < 0.001. (C) MEFs sqstm1 KO stably expressing Flag-SQSTM1 WT and SQSTM1G427R mutant were treated with MG132, followed by cell fractionation. Soluble and insoluble fractions were subjected to immunoblot analysis with the indicated antibodies. (D) Quantification of the results in C was performed by normalized the level of insoluble SQSTM1 to the level of soluble SQSTM1. Student’s t-tests were used, and values are presented as the mean ± SEM (n = 4). ** p < 0.01. (E) Flag-SQSTM1 WT and SQSTM1G427R mutant stable cells were treated with MG132 (μM) for 16 h, as indicated, and then the medium was switched to serum starvation (S.S.). (F) Quantification of the results from E was obtained by normalizing the level of polyubiquitinated proteins to the level of ACTB, and further to SQSTM1-WT without S.S. Student-t test was used and values are presented as mean ± SEM (n = 3). * p < 0.05, ns, not significant.
A critical role for SQSTM1 in the regulation of KEAP1-NFE2L2 pathway that is disrupted by SQSTM1G427R
Despite the role of SQSTM1 as an autophagy receptor that co-aggregates with disease related proteins in affected neurons, its physiological function in the brain remains poorly understood. SQSTM1 controls ubiquitinated protein aggregate formation; however, it does not contribute to neurodegeneration caused by inactivation of autophagy [Citation40]. To identify potential cargoes that are degraded by SQSTM1-mediated selective autophagy, we performed quantitative proteomics analysis of sqstm1 knockout (KO) mouse brains with triplication through a multiplex isobaric labeling mass spectrometry (MS) pipeline with extensive separation power and high mass resolution [Citation41] (Figure S4 A,B). Approximately 14,000 unique proteins were screened in the analysis. To our surprise only a few showed differentiated expression in sqstm1 KO brains (e.g. KEAP1) with adjusted p < 0.05 (Figure S4B and Dataset 1). By western blot analysis, we were able to validate the increased KEAP1 protein levels and the reduction of GSTM1, which is a target gene of NFE2L2 and controlled by KEAP1 (). As reported, we did not find the accumulation of ubiquitinated protein [Citation42] or altered LC3-II level (Figure S4 C,D) in sqstm1 KO brain. In addition, we did not observe any changes in SQSTM1-related autophagy receptors such as CALCOCO2/NDP52 and NBR1 in sqstm1 KO brains, suggesting no possible compensatory mechanism for loss of SQSTM1 expression (). Thus, the results revealed a primary function of SQSTM1 in regulating the KEAP1-NFE2L2 pathway at basal level in mouse brain.
Figure 5. A key role for brain SQSTM1 is the regulation of KEAP1-NFE2L2 pathway that is disrupted by SQSTM1G427R disease mutation. (A) Brain lysates of Sqstm1 WT and sqstm1 KO mice were subject to immunoblot analysis with the indicated antibodies. (B) Quantification analysis of A was shown. Student t-tests were used, and values are presented as mean ± SEM (n = 3 in each genotyping of mice). * p < 0.05, ** p < 0.01; ns, not significant. (C) sqstm1 KO MEFs stably expressing Flag-SQSTM1 WT or SQSTM1G427R mutant were treated with sodium arsenite (10 μM) and then cells were harvested, followed by IP with Flag antibody. An immunoblotting assay was then performed with the indicated antibodies. (D) The ratio of p-SQSTM1 (Ser351) to Flag-SQSTM1 was shown. One sample t-tests were used, and values are presented as the mean ± SEM (n = 3). *** p < 0.001. (E) The results were quantified by normalizing the level of immunoprecipitated KEAP1 to the level of the input and the level of immunoprecipitated Flag. One sample t-tests were used, and the values are presented as the mean ± SEM (n = 3). * p < 0.05. (F) sqstm1 KO MEFs stably expressing Flag-SQSTM1 WT or SQSTM1G427R mutant were treated with sodium arsenite (AS; 10 μM), followed by immunofluorescent staining with anti-SQSTM1 (red) and anti-KEAP1 (green) antibodies and visualizing via fluorescent microscope. Colocalization of SQSTM1 and KEAP1 was illustrated by line profile. Red and green lines indicate SQSTM1 and KEAP1 staining profiles, respectively. Scale bar: 10 μm. (G) sqstm1 KO MEFs stably expressing Flag-SQSTM1 WT and SQSTM1G427R mutant were treated with AS (10 μM), followed by cell fractionation. The soluble and insoluble fractions were subjected to immunoblot analysis with indicated antibodies. (H-I) Quantification of the results in G was performed by normalizing the levels of insoluble SQSTM1 and KEAP1 to the levels of soluble SQSTM1 and KEAP1, respectively. Student t-tests were used, and the values are presented as the mean ± SEM (n = 3). ** p < 0.01, * p < 0.01. (J) sqstm1 KO MEFs stably expressing Flag-SQSTM1 WT or SQSTM1G427R mutant were treated with AS (10 μM) for the indicated times, and then cells were assayed by immunoblotting analysis with the indicated antibodies. (K-L) Quantification of the results from J was obtained by normalizing the level of proteins to ACTB, respectively, and further to the respective control. Two-way ANOVA analysis were used, and values are presented as mean ± SEM (n ≥ 3). *** p < 0.001, ** p < 0.01, * p < 0.05.
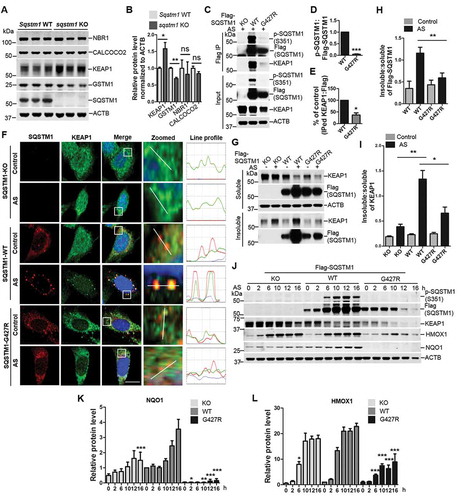
Previous study showed that SQSTM1 regulated KEAP1-NFE2L2 interaction through SQSTM1 phosphorylation at Ser351 (in the KIR motif), thus controlling NFE2L2 anti-oxidative stress response [Citation43]. We next asked whether SQSTM1G427R also alters p-Ser351 under oxidative stress. We treated WT SQSTM1 and SQSTM1G427R MEF with sodium arsenite (AS), which induces p-Ser351 and oxidative stress [Citation43] and then assayed p-Ser351 in SQSTM1. The results showed that the ratio p-Ser351:total SQSTM1 were significantly lower in SQSTM1G427R cells than that in WT cells (). As p-Ser351 markedly enhanced the interaction of SQSTM1 and KEAP1 [Citation43], we next questioned whether the SQSTM1-KEAP1 interaction was altered by G427R mutation. Co-IP experiment result indicated that SQSTM1G427R displayed reduced binding to KEAP1 (). We next examined the localization of SQSTM1G427R and KEAP1 in cells by immunofluorescence staining. AS treatment causes WT SQSTM1 to form prominent puncta, which co-localizes with KEAP1 foci; however, in SQSTM1G427R cells, SQSTM1 and KEAP1 failed to form foci (). Immunoblot analysis showed that the insoluble fraction of SQSTM1 and KEAP1 was markedly reduced in SQSTM1G427R cells when compared to WT SQSTM1 cells upon AS treatment (), consistent with the imaging result. The result also supports the idea that SQSTM1G427R fails to sequester cargo under oxidative stress.
As SQSTM1-KEAP1 interactions regulate NFE2L2 activity, which transcribes antioxidative gene expression, we next assayed NFE2L2 target gene expression in SQSTM1G427R cells. While the KEAP1 levels are decreased (correlated with the increase of p-Ser351), two NFE2L2 target genes Hmox1/Ho-1 and Nqo1 are increased in a time-dependent manner in WT SQSTM1 cells upon treatment of AS (). Interestingly, HMOX1 and NQO1 expression levels are either significantly reduced or nearly abolished in SQSTM1G427R cells compared to Sqstm1 WT or sqstm1 KO cells (). The results suggest that SQSTM1G427R disrupts NFE2L2 antioxidant response resulted from impaired KEAP1-SQSTM1 binding. It is surprising to see a further reduction of HMOX1 and NQO1 levels in SQSTM1G427R cells compared to sqstm1 KO cells. The result implies that SQSTM1G427R does not simply cause a loss of function in SQSTM1; it may trigger a gain of toxic function to further impair NFE2L2 response.
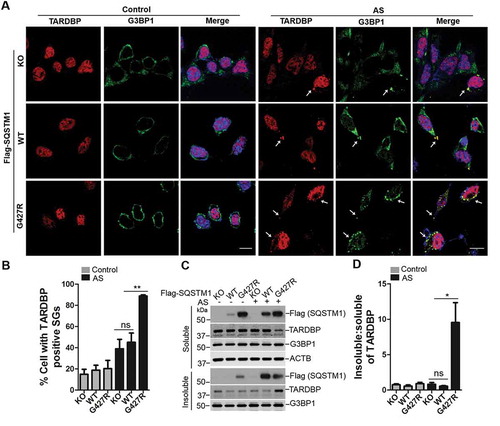
Disease mutation SQSTM1G427R enhances TARDBP-associated stress granule formation upon oxidative stress
Previous reports showed that oxidative stress, e.g., AS, induces the formation of cytosol foci of TARDBP, which co-localizes to stress granules [Citation44]. Given our results that SQSTM1G427R inhibits NFE2L2-mediated antioxidant response, we asked if the SQSTM1G427R mutation affects the cytosol foci formation (or stress granule) of TARDBP induced by oxidative stress. There is no significant change in the fraction of cells containing TARDBP-positive stress granules (marked by G3BP1) in SQSTM1G427R MEFs compared to WT or sqstm1 KO MEFs [Citation45] (). However, the fraction of cells with TARDBP stress granules is markedly increased in SQSTM1G427R cells compared with WT or sqstm1 KO cells upon AS treatment (). Immunoblot analysis showed that the insoluble TARDBP protein levels were also increased in SQSTM1G427R cells, when compared to WT or sqstm1 KO cells upon AS treatment. In contrast, there is no significant difference between WT and sqstm1 KO cells (), consistent with the imaging results. The result suggests that SQSTM1G427R mutation disrupts cell stress response that handles stress granule; this dysfunction of SQSTM1G427R is not caused by a loss of function in SQSTM1, as sqstm1 KO cells show little change in the fraction of cells containing TARDBP stress granules.
Figure 6. SQSTM1 mutation SQSTM1G427R enhances TARDBP-associated stress granule formation upon oxidative stress. (A) MEFs sqstm1 KO stably expressing Flag-SQSTM1 WT or SQSTM1G427R mutant were treated with AS (10 μM for 6 h), followed by immunofluorescent staining with anti-TARDBP (red) and anti-G3BP1 (green) antibodies and visualizing with fluorescent microscope. Scale bar: 10 μm. Arrows indicate cytosol TARDBP foci co-localized to stress granule marker G3BP1. (B) Quantification of the results in A was performed by counting the number of cells containing TARDBP-positive stress granules as the fraction of the total number of cells. Student t-test was used, and values are presented as the mean ± SEM (n = 3). ** p < 0.01; ns, not significant. (C) MEFs sqstm1 KO stably expressing Flag-SQSTM1 WT or SQSTM1G427R mutant were treated with AS (10 μM for 6 h), followed by cell fractionation. The soluble and insoluble fractions were subjected to immunoblot analysis with the indicated antibodies. (D) Quantification of the results in C was performed by normalizing the level of insoluble TARDBP to the level of soluble TARDBP. Student’s t-tests were used, and values are presented as the mean ± SEM (n = 4). * p < 0.05; ns, not significant.
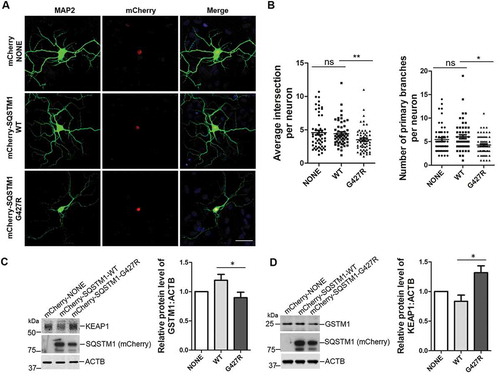
SQSTM1G427R reduces the dendritic complexity and impairs NFE2L2 signaling in neurons
We next examined the effect of SQSTM1G427R mutation in neuron morphology and NFE2L2 signaling [Citation46–Citation48]. We transfected primary cortical neurons with mCherry, mCherry-SQSTM1-WT or mCherry-SQSTM1G427R plasmids. We found that the number of primary branches and the average intersection per neuron is significantly reduced in neurons expressing mCherry-SQSTM1G427R compared to those producing mCherry-SQSTM1-WT (). To determine whether the effects of SQSTM1G427R result from altered KEAP1-NFE2L2 signaling, we detect the protein level of KEAP1 and GSTM1 in neurons infected with AAV-mCherry, -mCherry-SQSTM1-WT or -mCherry-SQSTM1G427R. The results showed that the KEAP1 level is increased, while GSTM1 is reduced, in neurons infected by AAV-mCherry-SQSTM1G427R, compared to neurons infected by AAV-mCherry-SQSTM1-WT (). The above results indicate that expression of SQSTM1G427R disrupts dendrite morphology and KEAP1-NFE2L2 pathway in neurons, further supporting a gain of toxic function in SQSTM1G427R mutant, given that sqstm1 KO brain displays little neuronal phenotypes [Citation40] or alteration in whole proteomics (Figure S4B).
Figure 7. SQSTM1G427R mutation reduces the dendritic complexity and impairs NFE2L2 signaling in neurons. (A) Primary cortical neurons from sqstm1 KO mice at DIV 6 were transfected with mCherry tagged SQSTM1 variants. At DIV 14, neurons were subjected to immunostaining with MAP2. Scale bar: 40 μm. (B) Quantification of the results in A was performed with Sholl analysis comparing the number of primary branches and intersection in transfected neurons. One-way ANOVA analysis were used, and values are presented as the mean ± SEM (mCherry, n = 55; SQSTM1 WT, n = 54; SQSTM1G427R, n = 60 in four transfections). * p < 0.05, ** p < 0.01; ns, not significant. (C-D) Primary cortical neurons from E15-18 embryos of sqstm1 KO mice were infected with AAV viruses carrying indicated SQSTM1 variants. Infected neurons were harvested and subjected to western blot analysis with indicated antibodies. Student t-test was used, and values are presented as the mean ± SEM (n = three infections). * p < 0.05.
Discussion
Here we report that proteotoxic stress stimulates TBK1 kinase activity, which is impaired by ALS-FTLD mutations in TBK1; TBK phosphorylation of SQSTM1 in UBA domain depends on ULK1 activity. ALS-FTLD associated mutations of SQSTM1 prevent ULK1- or TBK1-mediated phosphorylation of SQSTM1 and impede SQSTM1 binding of ubiquitinated cargo. Thus, our results suggest that TBK1 and SQSTM1 pathogenic ways in ALS-FTLD merge at the deregulation of selective autophagy in ALS-FTLD. Moreover, we demonstrate an ALS-FTLD mutation G427R of SQSTM1 blocks KEAP1-SQSTM1 interaction, impairing the expression of NFE2L2 targeted genes and increasing TARDBP-associated stress granule formation under oxidative stress. Therefore, our results reveal a mechanism by which pathogenic SQSTM1 mutants in ALS-FTLD inhibit selective autophagy and disrupt NFE2L2 anti-oxidative stress response.
Modifications of SQSTM1 play a critical role for selective degradation of autophagy cargoes, which is implicated in multiple neurodegenerative diseases [Citation22,Citation49]. We previously showed that ULK1 phosphorylation of SQSTM1 at Ser409 is required for phosphorylation of Ser405 [Citation6]. Here our data demonstrates that TBK1 mediated p-Ser405 in SQSTM1 depends on ULK1, as block of ULK1 activity either by genetic or pharmacological inhibition prevents p-Ser405 mediated by TBK1. Our data together with the previous report shows the concerted phosphorylation of SQSTM1 by ULK1 and TBK1 in regulating SQSTM1 ubiquitinated cargo binding and recruitment: ULK1 phosphorylation of Ser409 destabilizes UBA dimer formation and allows the exposure of Ser405 for TBK1 phosphorylation to occur [Citation6]. The p-Ser405 significantly enhances the binding affinity of SQSTM1 and ubiquitinated cargo [Citation17]. The significance of the dual phosphorylation of SQSTM1 by both ULK1 and TBK1 may reflect an intrinsic mechanism that cells develop to tightly control the formation of large ubiquitinated aggregates in coordination with induction of autophagy through ULK1 to clear the ubiquitinated cargo in a timely fashion.
The phosphorylation and activation of TBK1 are critical for antiviral innate immunity [Citation50]. TBK1 may regulate immunological autophagy through the phosphorylation of SQSTM1 [Citation9]. TBK1 was shown to phosphorylate SQSTM1 and autophagy receptor OPTN in the regulation of selective autophagy including mitophagy [Citation8–Citation10,Citation51]. Recent studies also demonstrated a role for TBK1 phosphorylation of SQSTM1 in large aggregate formation in hepatocyte induced by lipotoxicity [Citation52]. Interestingly, phosphorylation of SQSTM1 by TBK1 also promotes degradation of TMEM173/STING to attenuate DNA stimulated type I IFN response [Citation53]. In addition, overexpression of WT TBK1, but not kinase dead variant, facilitates mutant SOD1G93A clearance [Citation54]. It would be interesting to test if TBK1 variants of ALS-FTLD affect SQSTM1 phosphorylation by TBK1. Our data demonstrated that inhibition of proteasomes and expression of aggregate-prone disease proteins, including mutant SOD1 (SOD1G93A) and mutant Htt related protein (polyQ-expansion), activates TBK1, suggesting that the activation of TBK1 is a general response to proteotoxic stress that induces SQSTM1-mediated selective autophagy, while ALS-FTLD mutations of TBK1 reduce TBK1 activity and SQSTM1 phosphorylation thus blocking selective autophagy. Our data further suggested that ULK1 and TBK1 synergistically promote selective autophagy in response to proteotoxic stress.
Our whole proteome analysis of sqstm1 KO mice revealed that only few proteins are altered in the brains despite the large coverage of the proteome – a surprising finding for a common ubiquitinated cargo receptor of autophagy, suggesting a primary function of SQSTM1 at basal level in mediating autophagy degradation of KEAP1 in the brain. We further showed impaired KEAP1-NFE2L2 signaling pathway in sqstm1 KO brain. Our observation is consistent with the previous reports that sqstm1 KO brain do not accumulate poly-ubiquitinated proteins [Citation40,Citation42]. Therefore, we proposed that a key physiological function for SQSTM1 in the CNS is the control of homeostatic levels of KEAP1-NFE2L2 anti-oxidative signaling pathways. It is likely that the degradation of KEAP1 is mediated through poly-ubiquitination-independent manner as reported for other SQSTM1 binding protein SOD1 [Citation55].
Multiple variants of SQSTM1 have been identified in ALS-FTLD, but the impact of these mutations in selective autophagy has yet to be determined. Our data reveal that ALS-FTLD-linked mutations of SQSTM1 in the UBA domain, including SQSTM1P394L, SQSTM1G413S and SQSTM1G427R mutations, significantly reduce SQSTM1 phosphorylation at Ser405 and Ser409, impair SQSTM1 binding of ubiquitinated proteins, and impede ubiquitinated proteins clearance [Citation6,Citation17]. Our biochemical and cell-based assays further showed that the SQSTM1G427R mutant suffers a complete loss of UBA–Ub interaction and inability to sequester ubiquitinated cargo under proteasome inhibition. The loss of Ub binding in the SQSTM1G427R variant is consistent with a previous report [Citation39]. In addition, our results also showed that the SQSTM1G427R mutant abolished SQSTM1 phosphorylation at Ser351 in the KIR motif and reduced the sequestration of KEAP1, thus preventing NFE2L2 target gene expression, which functions as one of the critical cellular defense mechanisms against oxidative stress [Citation32].
Oxidative stress causes an increase of SQSTM1 levels over the 16 h of arsenite treatment; it is interesting, however, to notice the reduction of SQSTM1G427R and KEAP1 levels under the same condition (). While the mechanism underlying this change is unclear, the result could be due to reduced protein stability in the SQSTM1 variant and KEAP1 induced by certain protein modifications or enhanced proteasome or lysosome degradation. It is also puzzling that the levels of HMOX1 and NQO1 fail to increase when KEAP1 is reduced in SQSTM1G427R cells. The observation suggests additional unknown mechanism for SQSTM1G427R regulation of KEAP1 levels or NFE2L2 downstream signaling. Therefore, SQSTM1G427R may not act as a simple loss of function mutant. Despite the unclear mechanism, NFE2L2-mediated anti-oxidative response is clearly compromised in SQSTM1G427R cells. Future experiments should investigate the details for the additional mechanism for SQSTM1G427R toxicity.
Moreover, our results showed that under oxidative stress, ALS-FTLD-linked mutation SQSTM1G427R impairs cellular response to TARDBP stress granule formation, which is relevant to pathogenesis of ALS-FTLD [Citation5]. The increased stress granules in SQSTM1G427R cells under oxidative stress may result from the reduced NFE2L2 activity, which leads to compromised anti-oxidative response and thus sensitizes cells to oxidative stress. Furthermore, SQSTM1G427R is unable to effectively promote the degradation of stress granules under oxidative stress [Citation23].
Finally, our results showed that SQSTM1G427R affects the dendritic morphology of neurons accompanied by aberrant levels of KEAP1-NFE2L2 target gene expression, providing supportive evidence for neurotoxicity of SQSTM1G427R mutant in disrupting KEAP1-NFE2L2 signaling as underlying molecular mechanism for ALS-FTLD.
In summary, our study suggests a model that ALS/FTLD-linked variants of TBK1 and SQSTM1 share a common disease mechanism whereby they cause dysfunctional selective autophagy and disruption of NFE2L2 anti-oxidative response in neurons.
Materials and methods
Cell culture
HeLa cells, HEK 293T cells and MEFs were maintained in Dulbecco’s modified Eagle’s medium (Thermo Fisher Scientific, 11965-092) supplemented with 50 μg/ml penicillin and streptomycin (Thermo Fisher Scientific, 25300-054) and 10% fetal bovine serum (Atlanta Biologicals, S11550). Sqstm1 WT and sqstm1 KO mouse embryonic fibroblasts (MEFs) were provided by Dr. Masaaki Komatsu (Niigata University) [Citation43]. Mock, WT SOD1 and SOD1G93A NSC34 stable cell lines were provided by Giovanni Manfredi (Weill Cornell Medicine) [Citation56], HeLa/polyQ-mCFP cells were provided by Dr. Ai Yamamoto (Columbia University) [Citation57], and were maintained as previously described. Transient transfection was performed using Lipofectamine 2000 or 3000 as per the manufacturer’s instruction.
Plasmids and reagents
FLAG-SQSTM1-WT and MBP-SQSTM1-WT constructs were provided by Dr. Masaaki Komatsu (Niigata University). Flag and MBP tagged SQSTM1S409A, SQSTM1S409E, SQSTM1P394L, SQSTM1G413S and SQSTM1G427R, as well as LPC-Flag-SQSTM1G427R were constructed using a Quik-Change Lightning Site-Directed Mutagenesis Kit (Agilent Technologies, 210518). Myc-ULK1 WT and kinase inactivated (KI) mutant Myc-ULK1KI were provided by Dr. Sharon Tooze (London Research Institute). MG132 (Calbiochem,474791), sodium arsenate (Sigma-Aldrich, 35000), polybrene (Sigma-Aldrich, H9268), puromycin (Thermo Fisher Scientific, A11138-03), Lipofectamine 2000/3000 (Thermo Fisher Scientific, 11668-019/L3000-015), protease and phosphatase inhibitor cocktail (Thermo Fisher Scientific, 1861281), IPTG (isopropyl-β-D-thiogalactopyranoside, Sigma-Aldrich, 367-93-1), factor Xa (New England Biolabs, P8010S), Dynabeads protein G (Thermo Fisher Scientific, 10004D), PVDF membrane (Millipore, IPFL00010), and BCA Protein Assay Reagent Kit (Thermo Fisher Scientific, 23228) were also utilized.
Antibodies
The following antibodies were used: SQSTM1 (Progen Biotechnik, GP62-C-WBC), p-SQSTM1 Ser403 (Millipore, MABC186-I), p-SQSTM1 Ser409 (constructed by our lab), p-SQSTM1 Ser351 (MBL, PM074), ULK1 (Sigma-Aldrich, A7481), Flag-M2 (Sigma-Aldrich, F1804), anti-ACTB/β-Actin (Cell Signaling Technology, 3700), MYC (Cell Signaling Technology, 2278), Ubiquitin (Dako, Z0458), GFP (Thermo Fisher Scientific, A11122), TBK1 (Abcam, ab40676), p-TBK1 Ser172 (Cell Signaling Technology, 5483), SOD1 (Santa Cruz Biotechnology, SC11407), KEAP1 (Proteintech, Cosmo Bio, 10503-2-AP), CALCOCO2/NDP52 (Proteintech, Cosmo Bio, 12229-1-AP), NBR1 (Proteintech, Cosmo Bio, 16004-1-AP), NQO1 (Proteintech, Cosmo Bio, 11451-1-AP), HMOX1/HO-1 (Santa Cruz Biotechnology, sc-10789), GSTM1 (Proteintech, Cosmo Bio, 12412-1-AP), TARDBP (Proteintech Cosmo Bio, 12892-1-AP), G3BP1 (Sigma-Aldrich, HPA004052), LC3B (MBL, PM036) and MAP2 (Sigma-Aldrich, M4403).
Immunoblot and immunoprecipitation
Total cellular lysates were prepared using cell lysates buffer (50 mM Tris-HCl, pH 7.4, 1% NP-40 [Sigma-Aldrich, I3021], 0.25% Na deoxycholate [Sigma-Aldrich, D6750], 150 mM NaCl, 1 mM EDTA [Corning, 46–034-CI], 1% SDS, complete protease inhibitor cocktail, phosphatase inhibitor cocktail). Cells were lysed on ice for 30 min, and then centrifuged at 13,000 g for 30 min at 4°C. Supernatants were collected after centrifugation and subjected to BCA assay and then were resolved by SDS-PAGE.
For immunoprecipitation (IP), cells were lysed in IP buffer (1% NP-40, 10 mM Tris- HCl pH 7.5, 100 mM NaCl, 2 mM EDTA, complete protease inhibitor cocktail, phosphatase inhibitor cocktail) for 30 min on ice, and then centrifuged at 13,000 g for 30 min at 4°C. Supernatants were collected after centrifugation and subjected to BCA assay. Supernatants were incubated with the indicated antibodies overnight at 4°C. Lysates were further incubated with Dynabeads protein G for 1.5 h at 4°C, and then washed with PBS (0.1% Triton X-100) 5 times and subjected to immunoblot assay. Membranes were detected by either LI-COR Odyssey (LI-COR Biosciences, 9120) or Medical film Processor (Konica Minolta, SRX-101A). In LI-COR Odyssey system, the linear range of band intensities was set and the blots in the ranges were analyzed using Image Studio (LI-COR Biosciences). In Medical film Processor system, membranes were developed by Super Chemiluminescent ECL detection system (Thermo Fisher Scientific, 34580) and imaged in Medical film Processor. To get the unsaturated bands with the intensities in the linear range, a short pre-exposure was performed to calculate the signal intensity. According to this information, the exposure time to get the highest possible signal under saturation was determined. The images were analyzed with ImageJ software (NIH).
Fluorescence microscopy
Cells were fixed in 4% PFA (paraformaldehyde) for 30 min at room temperature. After washing four times with PBS (5 min each time), cells were permeabilized with 0.2% Triton X-100 for 15 min at room temperature. Cells were further blocked in blocking buffer containing 5% goat serum (Abcam, ab7481) and 0.2% Triton X-100 for 1 h. The cells were then incubated with primary antibodies in blocking buffer containing 1% goat serum and 0.2% Triton X-100 overnight at 4°C. After washing four times with PBS, cells were incubated with Alexa-conjugated secondary antibody for 1 h at room temperature. Goat anti-rabbit Alexa Fluor 488 (Thermo Fisher Scientific, A11034), goat anti-mouse Alexa Fluor 488 (Thermo Fisher Scientific, A21202), goat anti-rabbit Alexa Fluor 647 (Thermo Fisher Scientific, A21246) and goat anti-guinea pig Alexa Fluor 647 (Thermo Fisher Scientific, A21450) secondary antibodies were used. Then cells were washed four times with PBS and mounted with mounting medium (ProLong Gold antifade mountant with DAPI, Invitrogen, P36962). Cells were examined under Carl Zeiss upright or invert confocal microscopes (LSM780 system). Images were taken with 63X oil immersion objective lens at room temperature and image acquisition was performed using Zen2012 software (Carl Zeiss). Digitized images were analyzed and processed by using ImageJ software.
Triton X-100-soluble and insoluble fraction
Cells were lysed on ice with 1% Triton X-100 [Sigma-Aldrich, T8787] (supplemented with complete protease and phosphatase inhibitor cocktails) for 30 min. Then, cells were centrifuged at 15,000 g for 30 min at 4°C, and the supernatants (soluble fractions) were collected. The pellets were washed four times with 1% Triton X-100 and then further solubilized with 1% Triton X-100 containing 1% SDS for 1 h at 60°C. Subsequently, the insoluble fractions were collected by centrifugation at 15,000 g for 30 min at 4°C and each fraction was submitted to immunoblot assay.
Protein expression and purification
MBP-SQSTM1 WT, SQSTM1P394L and SQSTM1G427R were expressed in E. coli BL21 (DE3) cells induced with IPTG (Sigma-Aldrich, I6758). Cellular lysates were prepared with TNE buffer (10 mM Tris-HCl, pH 8.0, 150 mM NaCl, 1 mM EDTA, 1% NP-40) on ice for 30 min and then centrifuged for 20 min at 9,000 g at 4°C. The supernatants were incubated with amylose resin (New England Biolabs, E8021S) at 4°C overnight, washed three times with TNE buffer, and then eluted with 10 mM of maltose (Sigma-Aldrich, 63418) in 20 mM Tris-HCl, pH 7.5, 150 mM NaCl. UBA WT, UBAG427R and UBAG413S in fusion with His*6 tag were expressed in E. coli BL21 (DE3) cells induced by IPTG. Cellular lysates were prepared with His-binding buffer (20 mM sodium phosphate, pH 7.4, 500 mM NaCl, 40 mM imidazole, 10% glycerol (Sigma-Aldrich, G5516) with additives (1 mM PMSF [Sigma-Aldrich, 10837091001] as serine and cysteine protease inhibitor, 0.7% β- mercaptoethanol [Sigma-Aldrich, M6250] as antioxidant) by sonication on ice and then centrifuged for 2 h at 20,000 g at 4°C. The supernatants were purified on a His-Trap column (GE healthcare, 17524701) by following the instructions. The fused His*6 tag was removed by 3C protease cleavage and the untagged protein was further purified by size-exclusion chromatography (Superdex 75, GE Healthcare) in Tris-NaCl buffer (50 mM Tris. HCl, pH 8.0, 150 mM NaCl).
In vitro kinase assay
Bacterially purified MBP-SQSTM1 proteins including SQSTM1 WT, SQSTM1P394L, SQSTM1G413S and SQSTM1G427R, were cleaved with factor Xa, and then the cleaved proteins were incubated with active kinase ULK1-ATG13 proteins, or TBK1 protein (commercial in OriGene) in kinase buffer (20 mM HEPES, pH 7.4, 1 mM EGTA, 0.4 mM EDTA, 5 mM MgCl2, 0.05 mM dithiothreitol containing ATP (Sigma-Aldrich, FLAAS) at 37°C for 30 min. The reaction was terminated by adding SDS sample buffer and subjected to SDS-PAGE.
Ub binding assay
Cell-based poly-Ub binding assays and in vitro K63 Ub binding assays were performed as described in our previous report [Citation6]. For cell-based poly-Ub binding assays, briefly, sqstm1 KO MEFs transfected with Flag-SQSTM1-WT, SQSTM1P394L, SQSTM1G413S, SQSTM1G427R, SQSTM1S405A, SQSTM1S409A, SQSTM1S409E and empty vector were lysed using IP buffer (50 mM Tris-HCl, pH 7.4, 1% NP-40, 0.25% Na deoxycholate, 150 mM NaCl, 1 mM EDTA, complete protease inhibitor cocktail, phosphatase inhibitor cocktail) for 30 min on ice, and then centrifuged at 13,000 g for 30 min at 4°C. Normal sqstm1 KO MEFs were incubated with proteasome inhibitor (MG132) to accumulate poly-Ub proteins. MG132-treated cells were lysed using the same IP buffer for 30 min on ice, and then centrifuged at 13,000 g for 30 min at 4°C. An equal amount of the supernatants from each pool were mixed and incubated with Flag antibody overnight at 4°C. Lysates were further incubated with Dynabeads protein G for 1.5 h at 4°C, and then washed with PBS (0.1% Triton X-100) 5 times and subjected to immunoblot assay. For in vitro K63 Ub binding assays, equal amount of purified MBP-SQSTM1-WT and mutant variants were incubated with amylose resin at 4°C overnight in reaction buffer containing 150 mM NaCl, 1% Triton X-100, 50 mM HEPES, pH 7.5, 10% glycerol, 1 mM EDTA, 1 mM EGTA, complete protease and phosphatase inhibitor cocktail, and followed by incubation with an equal amount of K63-linked poly-Ub chains (homemade) at 4°C for 2 h. Amylose resin was washed 5 times with reaction buffer containing 150 mM NaCl, 1% Triton X-100, 50 mM HEPES, pH 7.5, 10% glycerol, 1 mM EDTA, 1 mM EGTA, complete protease inhibitor cocktail, phosphatase inhibitor cocktail, and then subjected to western blot assay.
Retroviral infection and generation of stable cell lines
ALS-linked SQSTM1 stable cell lines (MEFs; Flag-SQSTM1G427R) were constructed as described previously [Citation58].
Isothermal titration calorimetry
Isothermal Titration Calorimetry (ITC) was performed using an iTC200 microcalorimeter (Microcal Inc.) at 25°C. Protein samples were dialyzed against 50 mM Tris, pH 8.0, and 150 mM NaCl, and thoroughly degassed before each experiment. For UBA-Ub interactions, the injection syringe was loaded with 40 μl mono-Ub (homemade), and the cell was loaded with 220 μl of the respective UBA domain sample including UBA WT, UBAG413S or UBAG427R. Typically, each titration consisted of 24 injections of 1.65 μl mono-Ub, with 150 s intervals between injections. The resulting data were processed using Origin 7.0 software provided by the manufacturer.
Preparation of brain lysates and whole proteome analysis
All animal studies were performed in compliance with IACUC (Institutional Animal Care and Use Committee) at Icahn School of Medicine at Mount Sinai. Cortices were dissected from three Sqstm1 WT and three sqstm1 KO brains with 8-months-old for proteomics analysis with a previously optimized procedure [Citation41]. Briefly, the samples were lysed, trypsinized in solution, followed by desalting and tandem mass tag (TMT) labeling. The labeled samples were equally pooled, fractionated by offline basic pH reverse phase liquid chromatography (LC) [Citation59]. Each fraction was analyzed on a reverse phase C18 column (75 µm x 30 cm, 1.9 µm C18 resin [Dr. Maisch GmbH, Germany]) interfaced with a Q-Exactive HF mass spectrometer (Thermo Fisher Scientific). The mass spectrometer was operated in data-dependent mode with a survey scan in Orbitrap (60,000 resolution, 1 × 10⁶ AGC target and 50 ms maximal ion time) and 20 MS/MS scans (60,000 resolution, 1 × 10⁵ AGC target, 105 ms maximal ion time, 35 normalized collision energy in HCD, 1.0 m/z isolation window, and 20 s dynamic exclusion).
Computational processing was performed with the recently developed JUMP search engine to improve the sensitivity and specificity [Citation60], with the following settings: 10 ppm mass tolerance for both precursor ions and product ions, fully tryptic restriction, two maximal missed cleavages and the assignment of a, b, and y ions, static modifications of tandem mass tag (TMT) on lysine residues and peptide N termini (+229.16293 Da) and carbamidomethylation on cysteine residues (+57.02146 Da), and dynamic modification of oxidation on methionine residues (+15.99491 Da). The assigned peptides were filtered by mass accuracy, matching scores, and charge state to reduce protein false discover rate to approximately 1%. Protein quantification analysis was also performed by our JUMP software suite, and ratio compression was largely alleviated by extensive fractionation, and interference-based correction [Citation61]. The proteomic expression was log2 transformed, quantile normalized and corrected for sex as a covariate. Limma was used to identify differentially expressed protein between Sqstm1 WT and sqstm1 KO [Citation62]. Benjamini-Hochberg (BH) adjusted p value<0.05 was considered statistically significant. The proteomics pipeline has been used for deep profiling of mammalian samples (e.g. >16,000 proteins in mice) [Citation63].
Cultures of primary cortical neurons and image analysis
For immunostaining, primary cortical neurons were dissected from P0-1 mice pups with sqstm1 KO mice of either sex, and digested with trypsin (Sigma-Aldrich, D5025). Appropriate number of cortical neurons were plated on coverslips in 24-well plates coated with poly-D-lysine and grown in the MEM-based neuronal medium (Gibco, 51200-038) supplemented with 10% fetal bovine serum (Atlanta Biologicals, S11510H), 24 ug/ml INS (insulin; Sigma- Aldrich, I6634) and 0.1mg/ml TRF (transferrin; Calbiochem, 616420), 2% B-27 (Gibco, 17504-044) and 0.5 mM glutamax (Gibco, 35050-061). Cortical neurons were transfected at DIV 6 using Lipofectamine 2000. Transfected cortical neurons were subject to Sholl analysis using ImageJ according to previous report [Citation64]. For western blot, primary cortical neurons were prepared from E15-18 embryos of sqstm1 KO mice and grown on poly-L-lysine-coated 6-well plates in neurobasal medium supplemented with 2% B-27 and 0.5 mM glutamax. Neurons were infected at day 6–8 with equal amount of AAV viruses. Post-infection 12 h, AAV viruses were removed and switched to fresh medium. After 7–9 d, neurons were harvested and analyzed by western blot.
Statistical analysis
The data in each figure are presented as the mean ± SEM of at least three independent experiments. Statistical analyses were performed using R 3.2.3 and GraphPad Prism v5.0. One sample t-test, student’s t-test and one-way or two-way analysis of variance (ANOVA) were used. A p value ≤ 0.05 was considered as statistically significant unless otherwise stated.
Supplemental Material
Download Zip (27 MB)Acknowledgments
This work was partially supported by NIH grant R01 NS060123 (ZY); Hubei Province’s Outstanding Medical Academic Leader Program (SC); R01AG047928 (J.P.); R01 R01NS062055 (GM); Research Grants Council GRF grants PolyU 151052/16M (YZ).
Disclosure statement
No potential conflict of interest was reported by the authors.
Supplementary material
Supplemental data for this aticle can be accessed here.
Additional information
Funding
Related Research Data
References
- Achi EY, Rudnicki SA. ALS and frontotemporal dysfunction: a review. Neurol Res Int. 2012;2012:806306.
- Ling SC, Polymenidou M, Cleveland DW. Converging mechanisms in ALS and FTD: disrupted RNA and protein homeostasis. Neuron. 2013;79(3):416–438.
- Raffaele Ferrari DK, Huey ED, Momeni P. FTD and ALS a tale of two diseases. Curr Alzheimer Res. 2011;8(3):273–294.
- Blokhuis AM, Groen EJN, Koppers M, et al. Protein aggregation in amyotrophic lateral sclerosis. Acta Neuropathol. 2013;125(6):777–794.
- Li YR, King OD, Shorter J, et al. Stress granules as crucibles of ALS pathogenesis. J Cell Biol. 2013;201(3):361–372.
- Lim J, Lachenmayer ML, Wu S, et al. Proteotoxic stress induces phosphorylation of SQSTM1/SQSTM1 by ULK1 to regulate selective autophagic clearance of protein aggregates. PLoS Genet. 2015;11(2):e1004987.
- Wong YC, Holzbaur EL. Optineurin is an autophagy receptor for damaged mitochondria in parkin-mediated mitophagy that is disrupted by an ALS-linked mutation. Proc Natl Acad Sci U S A. 2014;111(42):E4439–E4448.
- Wild P, Farhan H, McEwan DG, et al. Phosphorylation of the autophagy receptor optineurin restricts Salmonella growth. Science. 2011;333(6039):228–233.
- Pilli M, Arko-Mensah J, Ponpuak M, et al. TBK-1 promotes autophagy-mediated antimicrobial defense by controlling autophagosome maturation. Immunity. 2012;37(2):223–234.
- Richter B, Sliter DA, Herhaus L, et al. Phosphorylation of OPTN by TBK1 enhances its binding to Ub chains and promotes selective autophagy of damaged mitochondria. Proc Natl Acad Sci U S A. 2016;113(15):4039–4044.
- Cirulli ET, Petrovski BNL,S, Sapp PC, et al. Exome sequencing in amyotrophic lateral sclerosis identifies risk genes and pathways. Science. 2015;347:1436–1441.
- Freischmidt A, Wieland T, Richter B, et al. Haploinsufficiency of TBK1 causes familial ALS and fronto-temporal dementia. Nat Neurosci. 2015;18(5):631–636.
- Xu D, Jin T, Zhu H, et al. TBK1 suppresses RIPK1-driven apoptosis and inflammation during development and in aging. Cell. 2018;174(6):1477–1491.e19.
- Moore AS, Holzbaur EL. Dynamic recruitment and activation of ALS-associated TBK1 with its target optineurin are required for efficient mitophagy. Proc Natl Acad Sci U S A. 2016;113(24):E3349–E3358.
- Kang C, Xu Q, Martin TD, et al. The DNA damage response induces inflammation and senescence by inhibiting autophagy of GATA4. Science. 2015;349(6255):aaa5612.
- Linares JF, Duran A, Reina-Campos M, et al. Amino acid activation of mTORC1 by a PB1-domain-driven kinase complex cascade. Cell Rep. 2015;12(8):1339–1352.
- Matsumoto G, Wada K, Okuno M, et al. Serine 403 phosphorylation of SQSTM1/SQSTM1 regulates selective autophagic clearance of ubiquitinated proteins. Mol Cell. 2011;44(2):279–289.
- Mizuno Y, Amari M, Takatama M, et al. Immunoreactivities of SQSTM1, an ubiqutin-binding protein, in the spinal anterior horn cells of patients with amyotrophic lateral sclerosis. J Neurol Sci. 2006;249(1):13–18.
- Arai T, Nonaka T, Hasegawa M, et al. Neuronal and glial inclusions in frontotemporal dementia with or without motor neuron disease are immunopositive for SQSTM1. Neurosci Lett. 2003;342(1–2):41–44.
- Hiji M, Takahashi T, Fukuba H, et al. White matter lesions in the brain with frontotemporal lobar degeneration with motor neuron disease: TDP-43-immunopositive inclusions co-localize with SQSTM1, but not ubiquitin. Acta Neuropathol. 2008;116(2):183–191.
- Lim J, Yue Z. Neuronal aggregates: formation, clearance, and spreading. Dev Cell. 2015;32(4):491–501.
- Deng Z, Purtell K, Lachance V, et al. Autophagy receptors and neurodegenerative diseases. Trends Cell Biol. 2017;27:491–504.
- Guo H, et al. Autophagy supports genomic stability by degrading retrotransposon RNA. Nat Commun. 2014;5:5276.
- Chitiprolu M, Jagow C, Tremblay V, et al. A complex of C9ORF72 and SQSTM1 uses arginine methylation to eliminate stress granules by autophagy. Nat Commun. 2018;9(1):2794.
- Lattante S, de Calbiac H, Le Ber I, et al. Sqstm1 knock-down causes a locomotor phenotype ameliorated by rapamycin in a zebrafish model of ALS/FTLD. Hum Mol Genet. 2015;24(6):1682–1690.
- Goode A, Butler K, Long J, et al. Defective recognition of LC3B by mutant SQSTM1/SQSTM1 implicates impairment of autophagy as a pathogenic mechanism in ALS-FTLD. Autophagy. 2016;12(7):1094–1104.
- Petri S, Korner S, Kiaei M. NFE2L2/ARE signaling pathway: key mediator in oxidative stress and potential therapeutic target in ALS. Neurol Res Int. 2012;2012:878030.
- Zhang DD. Mechanistic studies of the NFE2L2-Keap1 signaling pathway. Drug Metab Rev. 2006;38(4):769–789.
- Taguchi K, Motohashi H, Yamamoto M. Molecular mechanisms of the Keap1-NFE2L2 pathway in stress response and cancer evolution. Genes Cells. 2011;16(2):123–140.
- Tong KI, Kobayashi A, Katsuoka F, et al. Two-site substrate recognition model for the Keap1-NFE2L2 system: a hinge and latch mechanism. Biol Chem. 2006;387(10–11):1311–1320.
- Mimoto T, Miyazaki K, Morimoto N, et al. Impaired antioxydative Keap1/NFE2L2 system and the downstream stress protein responses in the motor neuron of ALS model mice. Brain Res. 2012;1446:109–118.
- Komatsu M, Kurokawa H, Waguri S, et al. The selective autophagy substrate SQSTM1 activates the stress responsive transcription factor NFE2L2 through inactivation of Keap1. Nat Cell Biol. 2010;12(3):213–223.
- Goode A, Rea S, Sultana M, et al. ALS-FTLD associated mutations of SQSTM1 impact on Keap1-NFE2L2 signalling. Mol Cell Neurosci. 2016;76:52–58.
- Zhan Z, Cao H, Xie X, et al. Phosphatase PP4 negatively regulates type I IFN production and antiviral innate immunity by dephosphorylating and deactivating TBK1. J Immunol. 2015;195(8):3849–3857.
- Clark K, Plater L, Peggie M, et al. Use of the pharmacological inhibitor BX795 to study the regulation and physiological roles of TBK1 and IkappaB kinase epsilon: a distinct upstream kinase mediates Ser-172 phosphorylation and activation. J Biol Chem. 2009;284(21):14136–14146.
- Rosen DR, Siddique T, Patterson D, et al. Mutations in Cu/Zn superoxide dismutase gene are associated with familial amyotrophic lateral sclerosis. Nature. 1993;362:59.
- Pottier C, Bieniek KF, Finch N, et al. Whole-genome sequencing reveals important role for TBK1 and OPTN mutations in frontotemporal lobar degeneration without motor neuron disease. Acta Neuropathol. 2015;130(1):77–92.
- Chan EY, Longatti A, McKnight NC, et al. Kinase-inactivated ULK proteins inhibit autophagy via their conserved C-terminal domains using an Atg13-independent mechanism. Mol Cell Biol. 2009;29(1):157–171.
- Garner TP, Long J, Layfield R, et al. Impact of SQSTM1/SQSTM1 UBA domain mutations linked to Paget’s disease of bone on ubiquitin recognition. Biochemistry. 2011;50(21):4665–4674.
- Komatsu M, Waguri S, Koike M, et al. Homeostatic levels of SQSTM1 control cytoplasmic inclusion body formation in autophagy-deficient mice. Cell. 2007;131(6):1149–1163.
- Bai B, Tan H, Pagala VR, et al. Deep profiling of proteome and phosphoproteome by isobaric labeling, extensive liquid chromatography, and mass spectrometry. Methods Enzymol. 2017;585:377–395.
- Riley BE, Kaiser SE, Shaler TA, et al. Ubiquitin accumulation in autophagy-deficient mice is dependent on the NFE2L2-mediated stress response pathway: a potential role for protein aggregation in autophagic substrate selection. J Cell Biol. 2010;191(3):537–552.
- Ichimura Y, Waguri S, Sou Y-S, et al. Phosphorylation of SQSTM1 activates the Keap1-NFE2L2 pathway during selective autophagy. Mol Cell. 2013;51(5):618–631.
- Colombrita C, Zennaro E, Fallini C, et al. TDP-43 is recruited to stress granules in conditions of oxidative insult. J Neurochem. 2009;111(4):1051–1061.
- Tourriere H, Chebli K, Zekri L, et al. The RasGAP-associated endoribonuclease G3BP assembles stress granules. J Cell Biol. 2003;160(6):823–831.
- Kweon JH, Kim S, Lee SB. The cellular basis of dendrite pathology in neurodegenerative diseases. BMB Rep. 2017;50(1):5–11.
- Kulkarni VA, Firestein BL. The dendritic tree and brain disorders. Mol Cell Neurosci. 2012;50(1):10–20.
- Lee SB, Bagley JA, Lee HY, et al. Pathogenic polyglutamine proteins cause dendrite defects associated with specific actin cytoskeletal alterations in Drosophila. Proc Natl Acad Sci U S A. 2011;108(40):16795–16800.
- Stolz A, Ernst A, Dikic I. Cargo recognition and trafficking in selective autophagy. Nat Cell Biol. 2014;16(6):495–501.
- Loo YM, Gale M Jr. Immune signaling by RIG-I-like receptors. Immunity. 2011;34(5):680–692.
- Matsumoto G, Shimogori T, Hattori N, et al. TBK1 controls autophagosomal engulfment of polyubiquitinated mitochondria through SQSTM1/SQSTM1 phosphorylation. Hum Mol Genet. 2015;24(15):4429–4442.
- Cho C-S, Park HW, Ho A, et al. Lipotoxicity induces hepatic protein inclusions through TANK binding kinase 1–mediated SQSTM1/sequestosome 1 phosphorylation. Hepatology. 2018;68(4):1331-1346.
- Prabakaran T, Bodda C, Krapp C, et al. Attenuation of cGAS‐STING signaling is mediated by a SQSTM1/SQSTM1‐dependent autophagy pathway activated by TBK1. Embo J. 2018;37(8):e97858.
- Korac J, Schaeffer V, Kovacevic I, et al. Ubiquitin-independent function of optineurin in autophagic clearance of protein aggregates. J Cell Sci. 2013;126(Pt 2):580–592.
- Gal J, Ström A-L, Kwinter DM, et al. Sequestosome 1/SQSTM1 links familial ALS mutant SOD1 to LC3 via an ubiquitin-independent mechanism. J Neurochem. 2009;111(4):1062–1073.
- Magrane J, Hervias I, Henning MS, et al. Mutant SOD1 in neuronal mitochondria causes toxicity and mitochondrial dynamics abnormalities. Hum Mol Genet. 2009;18(23):4552–4564.
- Yamamoto A, Cremona ML, Rothman JE. Autophagy-mediated clearance of huntingtin aggregates triggered by the insulin-signaling pathway. J Cell Biol. 2006;172:719–731. PMID: 16505167.
- Pan JA, Ullman E, Dou Z, et al. Inhibition of protein degradation induces apoptosis through a microtubule-associated protein 1 light chain 3-mediated activation of caspase-8 at intracellular membranes. Mol Cell Biol. 2011;31(15):3158–3170.
- Wang H, Yang Y, Li Y, et al. Systematic optimization of long gradient chromatography mass spectrometry for deep analysis of brain proteome. J Proteome Res. 2015;14(2):829–838.
- Wang X, Li Y, Wu Z, et al. JUMP: a tag-based database search tool for peptide identification with high sensitivity and accuracy. Mol Cell Proteomics. 2014;13(12):3663–3673.
- Niu M, Cho J-H, Kodali K, et al. Extensive peptide fractionation and y(1) ion-based interference detection method for enabling accurate quantification by isobaric labeling and mass spectrometry. Anal Chem. 2017;89(5):2956–2963.
- Ritchie ME, Phipson B, Wu D, et al. limma powers differential expression analyses for RNA-sequencing and microarray studies. Nucleic Acids Res. 2015;43(7):e47.
- Stewart E, McEvoy J, Wang H, et al. Identification of therapeutic targets in rhabdomyosarcoma through integrated genomic, epigenomic, and proteomic analyses. Cancer Cell. 2018;34(3):411–426.e19.
- Ferreira TA, Blackman AV, Oyrer J, et al. Neuronal morphometry directly from bitmap images. Nat Methods. 2014;11(10):982–984.