
ABSTRACT
In the adult mammalian skin, cells are constantly renewing, differentiating and moving upward, to finally die in a yet not fully understood manner. Here, we provide evidence that macroautophagy/autophagy has a dual role in the skin. In addition to its known catabolic protective role as an evolutionary conserved upstream regulator of lysosomal degradation, we show that autophagy induced cell death (CDA) occurs in epithelial lineage-derived organs, such as the inter-follicular epidermis, the sebaceous- and the Harderian gland. By utilizing GFP-LC3 transgenic and ATG7-deficient mice, we show that CDA is initiated during terminal differentiation at a stage when the cells have become highly resistant to apoptosis. In these transitional cells, the Golgi compartment expands, which accounts for the formation of primary lysosomes, and the nucleus starts to condense. During CDA a burst of autophagosome formation is observed, first the endoplasmic reticulum (ER) is phagocytosed followed by autophagy of the nucleus. By this selective form of cell death, most of the cytoplasmic organelles are degraded, but structural proteins remain intact. In the absence of autophagy, consequently, parts of the ER, ribosomes, and chromatin remain. A burst of autophagy was stochastically observed in single cells of the epidermis and collectively in larger areas of ductal cells, arguing for a coordinated induction. We conclude that autophagy is an integral part of cell death in keratinocyte lineage cells and participates in their terminal cell fate.
Abbreviations: Atg7: autophagy related 7; BECN1: beclin 1; CDA: cell death-induced autophagy; Cre: Cre-recombinase; DAPI: 4′,6-diamidino-2-phenylindole; ER: endoplasmatic reticulum; GFP: green fluorescent protein; HaGl: haderian gland; IVL: involucrin; KRT14: keratin 14; LD: lipid droplet; LSM: laser scanning microscope; MAP1LC3/LC3: microtubule-associated protein 1 light chain 3; PN: perinuclear space; RB: residual body; rER: rough endoplasmatic reticulum; SB: sebum; SG-SC: stratum granulosum – stratum corneum; SGl: sebaceous gland; SQSTM1: sequestosome 1; TEM: transmission electron microscopy; TUNEL: terminal deoxynucleotidyl transferase dUTP nick end labelling.
Introduction
The epidermis of adult mammalian skin consists of a constantly renewing stratified squamous epithelium, in which cells from a basal proliferative layer commit to differentiate and move upward. Differentiating cells produce a robust mechanical network of keratin filaments and become increasingly resistant to apoptosis and necrosis by NFKB/NFκB and CTNNA1/α-catenin activated target genes [Citation1–Citation4]. In the last stage of terminal differentiation, cells die in a yet not fully understood manner. All metabolic activity ceases, cells lose their organelles including the nucleus, extrude lipids and proteins on the cornified envelope scaffold, which effectively seals the skin. Finally, these squames of dead cells are shed off the surface and replaced by new cells. Terminal differentiation in the granular layer is also accompanied by the formation of secretory vesicles of lysosomal origin, containing various cargoes, such as CTSD (cathepsin D). These vesicles are called lamellar granules/Odland bodies (LGs) and become extruded in sac-like protrusion of the trans-Golgi network at the stratum granulosum-stratum corneum (SG-SC) border [Citation5].
Despite modulations in their differentiation programs, the execution of terminal cell death is conserved between cells of the skin and its appendages, such as the sebaceous gland (SGl). In a pioneering work, Lavker and Matoltsy, performing detailed transmission electron microscopy (TEM) at a site of enhanced cell transition in the bovine ruminal epithelium, alluded to lysosomes as the potential driving organelles for this type of cell death [Citation6]. The functional relevance of lysosomal proteolytic enzymes for cornification is supported by numerous animal models. Ctsd-deficient mice display an increased number of corneocyte layers and reduced TGM1 (transglutaminase 1, K polypeptide) activity along with a reduction of the differentiation markers IVL (involucrin), LOR (loricrin), and FLG (filaggrin), resembling the human skin disease lamellar ichthyosis. In vitro, excessive CTSD activity can induce cell death [Citation7]. The deficiency of the cysteine protease inhibitor cystatin M/E also leads to disturbed cornification, impaired barrier function, and dehydration, caused by an increased TGM activity altering loricrin crosslinking [Citation8]. Mice lacking CTSL (cathepsin L) activity develop hyperplasia and hyperkeratosis of the epidermis as well as periodic hair loss, without exhibiting an inflammatory response [Citation9]. Although CTSB (cathepsin B)-deficient mice do not display a spontaneous phenotype, mice with a combined Ctsb Ctsl deficiency die at weaning as a result of a neuronal lysosomal storage defect [Citation10,Citation11]. The importance of these lysosomal enzymes is also reinforced by mutations in the gene encoding human CTSC (cathepsin C), which cause Papillon–Lefèvre syndrome, a hyperkeratosis of palms and soles of feet [Citation12].
Macroautophagy, hereafter called autophagy, is an upstream regulator, controlling and accelerating lysosomal degradation. This is an evolutionary – from yeast to mammals – conserved catabolic process by which cellular components are targeted to lysosomes for degradation and recycling. When autophagy declines, lysosomes are re-formed from autolysosomes by extrusion of proto-lysosomal tubules and vesicles [Citation13,Citation14]. Autophagy, on the one hand, serves as a pro-survival stress response, providing energy and rescuing metabolic precursors under conditions of starvation and during cell stress through the clearance of damaged proteins and organelles, which is critical for cell survival. It is initiated by a cascade of conversion steps leading to the formation of a phagophore that is decorated by the LC3/ATG8-conjugation system. By fusion with a lysosome, the autophagosome delivers its cargo to the autolysosome [Citation15,Citation16]. A crucial step in this cascade is the processing and conversion of MAP1LC3/LC3 (microtubule-associated protein light chain 3) from its nonlipidated form (LC3-I) to a lipid-conjugated form (LC3-II), which is incorporated into the autophagosome membrane. Molecularly, autophagic turnover can be monitored using a GFP-conjugated form of LC3 and/or the conversion of LC3-I to LC3-II [Citation17]. By these criteria, autophagy is one of the most diverse intracellular clearing systems and may affect a broad spectrum of cellular processes. Consequently, deficiencies in autophagy lead to pleiotropic degenerative diseases [Citation18].
On the other hand, autophagy can facilitate cell death. This specialized form of cell death, now referred to as cell death induced autophagy (CDA), was first described in insects (Antheraea polyphemus). It occurs during the metamorphosis-related degeneration of intersegmental muscles, as a selective lysosomal-mediated destruction mechanism of the cytoplasmic content. Two phases were morphologically characterized in a Tat-BECN1 induced CDA model (termed autosis) in HeLa cells. Initially, the Golgi system expands and the nucleus becomes irregular showing darker condensed chromatin with fuzzy borders. This is in contrast to apoptosis, where chromatin clumps, appears black due to DNA fragmentation and has sharp borders. In addition, in CDA, the ER is dilated and fragmented, and numerous autophagic vacuoles are seen. At the end of this first phase, the perinuclear space swells at discrete regions surrounding the inner nuclear membrane and can extend into the cytoplasm over a substantial distance with an appearance similar to the cytosol. In the rapid second phase, cells become necrotic, showing focal ballooning of the perinuclear space fenced by a concave nuclear surface. At this late stage, the autophagy compartments and ER are barely visible, and the plasma membrane becomes perforated, yet, cytoskeletal elements remain intact and the cell corpse adheres to culture-dish surfaces [Citation19,Citation20]. In contrast to other regulated cell death processes, such as caspase-mediated apoptosis (type I) or necrosis (type III), CDA (type II) is controlled by autophagy-related genes. Thus, abrogation of these genes delays cell death [Citation21]. CDA branched from the pro-survival form of autophagy by evolving a separate initiation mechanism. This is currently best understood in the salivary glands clearance process of D. melanogaster. Here, CDA controls cell death and is initiated in a cluster of neighboring cells collectively [Citation22,Citation23]. In Arabidopsis, CDA has evolved as an additional defense strategy for bacteria/fungal infection [Citation24]. Several mammalian cell lines display CDA either after inhibition of apoptosis and/or by a specific receptor-mediated activation or can be triggered by chromosomal instability [Citation25–Citation27]. In the human epidermal keratinocyte cell line NHEK, CDA was described to occur during senescence [Citation28].
In the mammalian skin, autophagy markers are massively up-regulated during granular layer formation in embryonic development [Citation29]. Here, autophagy is constitutively active in suprabasal layers executing a pro-survival/homeostatic function [Citation30]. So far, depending on the experimental model, grafting atg7-deficient neonatal skin or generating Krt14 (keratin 14)-Cre atg7-deficient mice, a severe perturbation of granular layer formation or a mildly increased thickness of the corneum and number of corneocytes is observed, respectively [Citation30,Citation31]. Yet, autophagy in the skin has not been linked to CDA so far.
Based on the analyses presented here, examining the GFP-LC3 reporter in the interfollicular epidermis and SGls of Krt14-Cre atg7-deficient mice, we concluded that autophagy plays a dual role in skin cells. As previously proposed, it serves as a pro-survival homeostatic control mechanism during differentiation. In addition, it mediates CDA in transitional cells at the SG-SC border by a massive induction of autophagosomes. Hence as a consequence, abrogation of autophagy causes an accumulation of lytic vesicles, remnants of the ER and the nucleus, and alters the terminal keratinocyte cell fate.
Results
Transitional cells of the skin undergo an autophagic cell death
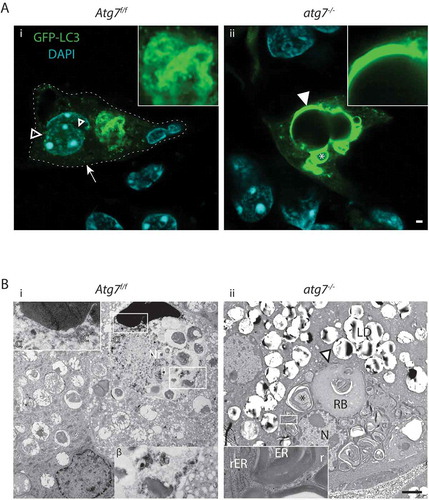
The deletion efficacy of the Atg7-floxed allele (Atg7f/f) by Krt14-Cre recombinase, hereafter referred to as atg7−/- mice, in the epidermis (62% deletion in the analyzed samples) and its appendages, has already previously been demonstrated by us and others [Citation30,Citation32,Citation33]. These mice displayed by conventional histology a rather inconspicuous epidermal phenotype (Figure S1A); an increase in corneocyte thickness and number [Citation30]. Yet, strikingly together with some GFP bright spots, both, the intensity and thickness of the GFP-positive transitional skin layer of double-transgenic GFP-LC3;atg7−/- mice were significantly increased compared to floxed controls (Atg7f/f 0.8 µm to atg7−/- 2.2 µm, p ≤ 0.01, N = 3) (). In addition, in some GFP bright spots, small DAPI-positive dots were detected suggesting the presence of un-degraded nucleic acids (Figure S2A). Enhancing the DAPI channel allowed quantification of the dots, which were absent in the Atg7f/f controls (0.2 µm2/image) to atg7−/- (4.9 µm2/image, p ≤ 0.05, N = 3) ( and S2B). Furthermore, the lysosomal marker LAMP1, associated with autophagic cell death, accumulated in the atg7−/- epidermis (2.7-fold, p < 0.05). The active form of the cornification accompanying lysosomal and potentially cell death-inducing enzyme CTSD also accumulated in atg7−/- epidermis (active/intermediate [48 kDa]) (1.4-fold, p < 0.05), as did the mature (32 kDa) form, while the pro-form (55 kDa) was only barely detectable (). No significant changes were detected in the levels of the terminal keratinization markers FLG and IVL, the keratins KRT14 (basal) and KRT10 (suprabasal), and RPL26 (ribosomal protein L26) (). Functionally, the inhibition of autophagy in the atg7−/- skin was demonstrated by the abrogation of LC3-I/II conversion and concomitant GFP-LC3 accumulation (), as previously shown [Citation30]. Interestingly, the cargo receptor SQSTM1 (sequestosome 1) was barely detectable and accumulated with a high variability in the atg7−/- epidermis (11.2 ± 5-fold, p = 0.1), arguing for a primarily SQSTM1-independent mode of autophagy. Although hardly any autophagosomes were detected by conventional fluorescence microscopy in the wild type controls (Figure S1A), based on the thickening and the strong accumulation of GFP at the SG-SC border and of DNA in the atg7−/- corneum, we hypothesized that autophagy may participate in the conversion of living cells to dead corneocytes, hence, in the terminal cell death of keratinocytes by a process referred to as cell death induced autophagy (CDA).
Figure 1. Autophagy in the back skin of GFP-LC3 reporter mice. (A) LSM of GFP-LC3 transgenic Atg7f/f and atg7−/–deficient skin samples. Atg7f/f skin displays a discrete number of GFP puncta reminiscent of autophagosomes (→) in all layers of the epidermis (epi). Based on co-immunofluorescence with the epidermal cornification marker IVL (magenta), most of the GFP is found in the transitional layer at the stratum corneum in Atg7f/f and atg7−/- skin. Note that the corneal layer above the transitional layer is negative for GFP. In atg7−/–deficient skin, GFP-LC3 is diffusely distributed, indicative of free GFP-LC3 not incorporated into autophagosomes. In addition, some aggregates are found (►) and both the intensity and thickness of the GFP-positive transitional layer is increased (→←). Below: Quantification of transitional layer thickness, with 0.8 µm Atg7f/f vs. 2.2 µm atg7−/-, p < 0.01, N = 3. Quantification of un-degraded DNA in the corneum, p < 0.05, N = 3. (B) Immunoblot for autophagy and differentiation markers. SQSTM1, at the detection limit with a high variability (11.2 ± 5-fold, p = 0,1); GFP-LC3 levels increased by 2.2-fold in atg7−/- samples due to the abrogation of LC3-I/II conversion (13-fold inhibition). Basal keratin KRT14 (K14) and suprabasal KRT10 (K10) show no alterations. The lysosome marker LAMP1 (2.7-fold, p*<0.05), the intermediate (48 kDa; 1.4-fold, p*<0.05) and the mature (32 kDa) forms of CTSD accumulate in atg7−/- epidermis. The CTSD pro-form is barely detectable. No statistically significant changes are detected in the levels of the terminal keratinization markers FLG (filaggrin) and IVL (involucrin), and RPL26 (ribosomal protein L26). (C) SR-LSM images of the back skin (i) and ear (iii) of Atg7f/f and atg7−/- mice. (i) High abundance of peri-nuclear autophagosomes (open arrowhead) in a basally located cell (α) and the cell above (β). In a higher magnification (ii) the β cell displaying a reticular pattern of GFP-LC3 with one pole of the net being connected to the nucleus (nuclear border is marked by a dotted line). Note: the β cell nucleus is shrunken. (iii) An example of an extremely GFP bright, flattened cell (γ) in the final stage of CDA at the corneum. (iv) Higher magnification images revealing large bubbles of GFP-positive autophagosomes surrounding the hydrolyzed nuclear DNA. (v) Absence of GFP-LC3-positive autophagosomes in atg7−/- cells, showing only occasional spots of aggregated GFP (►). (D) Quantification of keratinocytes undergoing CDA at the SG-SC border in the BS (N = 3). Autophagosomes (→), ACD (open arrowhead), GFP-LC3 aggregates (►). Abbreviations and labels: apical corneal border (dashed line), basal cell (α), basal membrane (fine dashed line), cell moving upward (β), epidermis (epi), fold change relative to KRT10 (fc/K10), IVL (involucrin), GFP-LC3 (green), stratum corneum (SC), stratum granulosum (SG). Nuclear stain: DAPI. Scale bars: 5 µm.
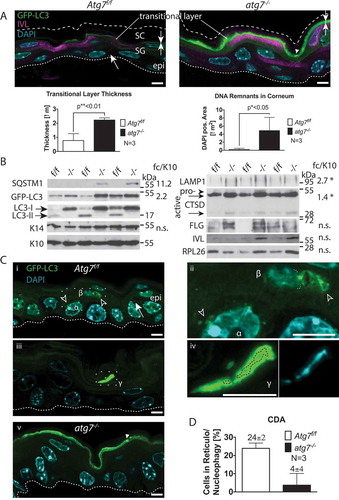
Indeed, using super-resolution laser scanning microscopy (SR-LSM) differentiating cells with abundant autophagosome formation were detected in the epidermis of GFP-LC3;Atg7f/f mice (). The basally located cell shown here (α) displayed a high abundance of peri-nuclear autophagosomes (Cii, magnification). Yet, in this stage, normal autophagic turnover was indistinguishable from the onset of CDA. More indicative, the adjacent cell moving upward (β) displayed a very particular autophagic structure (). Higher magnification revealed that GFP-LC3 was concentrated in a reticular pattern at one pole of the cell (β; ). Strikingly, at the very bright GFP-LC3 spot, this autophagic structure was connected to the nucleus. The nucleus itself was macerated in a net of faint GFP dots and has shrunken to a tiny ball (nucleophagy). The reticular GFP-LC3 pattern and its juxtanuclear localization were symptomatic for selective autophagy of the ER (reticulophagy). Moreover, the observed clearance of cellular core organelles was typical for autophagic cell death [Citation19]. In the corneum, an extremely GFP bright condensed flattened cell was visible (γ) (). At higher magnification, large blobs of autophagosomes surrounding the hydrolyzed DNA of a nucleus were seen (Civ). This represents the late phase of autophagic cell death. In contrast, no autophagosomes were seen in atg7−/- cells, only occasional spots of aggregated GFP were observed, and in GFP bright cells, the signal was uniformly distributed indicating a lack of LC3 autophagosome association (). Lysosomal CTSD was abundant in the basal layer and declined in the upper layers of the skin. CTSD colocalized with GFP-LC3 vesicles, suggesting that CTSD was delivered to autophagosomes (Figure S1B). In the upper layers of the atg7−/- epidermis, lysosomes stained negative for CTSD independent of autophagosomes.
Applying optimized SR-LSM by multiple averaging to overcome the high opacity of the corneum, approximately 20% of cells in the transitional layer underwent CDA based on the occurrence of reticulophagy and nucleophagy ( and S1C). In contrast, apoptosis measured by terminal deoxynucleotidyl transferase dUTP nick end labelling (TUNEL) was very low (~1 cell/cm) in the corneum and occurred in both, control and atg7−/- mice (Figure S2A). The high prevalence of CDA and the uniform accumulation of GFP and DNA in the atg7−/- skin suggested that autophagy participated in a constitutive form of cell death in the epidermis.
Morphology of keratinocytes undergoing autophagic and lytic cell death
Previously, lysosomes have been proposed to act as potential executors of cell death in the scattered transitional cells of the bovine ruminal epithelium based on detailed TEM studies [Citation6]. In order to further understand the process of autophagy occurring in the transitional cells in the skin, we performed TEM on cells at the SG-SC border. Here, ballooning cells with a partially cleared cytoplasm were observed in the epidermis of Atg7f/f control mice (). In the image shown, the nucleus of the centrally located cell was still intact, but at the lateral edges, the rough endoplasmic reticulum (rER) was dissolved (). Several different fragmentation stages of the rER were observed, ranging from swollen rER (, *), over smooth ER membranes devoid of ribosomes (, **), to membrane fragments (, ***). It appeared that the onset of ER fragmentation was concentrated in a compartment of heterologous content (surrounded by7 ►), where ribosomes and ER were digested into arising small vesicles (darker secondary lysosomes) – a process we refer to as reticulophagy. At high magnification, another cell undergoing reticulophagy () showed incorporation of ribosomes into ring-like structures, which were interconnected (») to secondary lysosomes (labeled sLy in ), which appeared as dark structures. Similar features of reticulophagy were seen in at the apical side; here, the cytoplasm was decorated with secondary lysosomes and other vesicles ranging from rod to oval shapes, some even had a stripe-like pattern that was reminiscent of LGs at the SG-SC border.
Figure 2. Ultrastructure of the epidermal SG-SC border. (A) Atg7f/f terminal differentiating keratinocytes, with the centrally located ballooning cell being in a transitional state. The nucleus of the cell being large and most of its cytoplasm being lysed. The ER of this cell is well preserved at the left side of the nucleus (rER) but undergoes swelling and fragmentation (ER) at the right side (see also B). Its cytoplasm is mostly clear, for the exception of small vesicles at the upper center of the cell. (B) Higher magnification of the dissolving ER. Partially intact rER with attached ribosomes (*), swollen and fragmented ER (**) and fully dissolved ER (***). Degradation of the ER is seen in a discrete area (encircled by ►), ribosomes (r) are incorporated into vesicles, which are maturing to secondary lysosomes (sLy). (C) High magnification of late-stage reticulophagy in another cell. Ribosomes are incorporation of into ring-like structures, which are interconnected (») to dark secondary lysosomes. (D) Higher magnification of the condensed cell (seen in A) with a deformed, shrunken, and hyperchromatic nucleus. Its outer nuclear membrane (om) is detached at one pole and forms a ballooning perinuclear space (PN), characteristic for CDA (open arrowheads). In the PN, ribosomes and the ER are degraded. Fuzzy heterochromatin (f), a sign for hydrolysis, at the apical nuclear periphery. The cell membrane located towards the corneum is perforated (open →) by sac-like protrusions. Prominent corneodesmosomes (CD) connect the cell to the first layer of flattened corneocytes. (E) Corresponding site in the atg7−/- epidermis with the nucleus of the lower cell being embedded in a cytoplasm full of rER. Ribosomes remain mostly intact until they begin to concentrate at keratohyalin fibers (→, F). The Golgi apparatus (Gg) is prominent and contains very small vesicles (inset). The transitional layer is thickened (→←) with partially degraded cellular material. The nucleus visible in the layer at the left side is condensed and its chromatin appears to have segregated from the main nuclear body. (G) Higher magnification of the transitional layer. Aberrant ribosomal accumulation (→) causing highly electron-dense ribosomal aggregates (⇉) adjacent to areas containing lysosomes (Ly) are visible. (H) Morphometric measurement of accumulating ribosomes (acc., →) 0.8 µm2 Atg7f/f vs. 4.5 µm2 atg7−/-, p < 0.05, ribosomal aggregates (agg., ⇉) 0.1 µm2 Atg7f/f vs. 1.7 µm2 atg7−/-, p < 0.02 and amorphous lysosomal areas (Ly) of the transitional layer 1.4 µm2 Atg7f/f vs. 3.2 µm2 atg7−/-, n.s. Abbreviations and labels: CD, corneodesmosomes; open ►, borders of the PN; closed ►, discrete compartment of ER fragmentation; ER, endoplasmic reticulum; f, fuzzy nuclear periphery; », interconnections between lysosomes; Gg, Golgi apparatus; im, inner nuclear membrane; om, outer nuclear membrane; K, keratohyalin; Ly, lysosomes; M, mitochondria; N, nucleus; open →, perforated plasma membrane; PN, perinuclear space; r, →, ribosomes; rER, rough ER; ⇉, ribosomal aggregates; sLy, secondary Ly; *, **, *** stages of dissolving ER. Scale bars: 1 µm (A, E), 500 nm (B, D, F, G), 100 nm (C).
Besides reticulophagy, another hallmark of CDA was the moderate condensation of chromatin and ballooning of the perinuclear space. These morphological changes were observed in cells at later differentiation stages at the SG-SC border (upper right nucleus in ). Here at one pole, the outer nuclear membrane, which is continuous with the rER, was detached and formed a ballooning perinuclear space (PN) (, encircled by open arrowheads). The heterochromatin was concentrated at the nuclear periphery and appeared fuzzy towards the side of the PN – a sign for hydrolyzed DNA. We refer to this process as nucleophagy. At the apical side, the plasma membrane was perforated (open arrow) by sac-like protrusions, potentially releasing material into the intercellular space of the corneum. Prominent corneodesmosomes (CD) connected the cell to the first layer of flattened corneocytes ().
Cells at the SG-SC border in the atg7−/- epidermis had a strikingly different appearance (). Here, the Golgi (Gg) was expanded and the cytoplasm incompletely degraded. Ribosomes remained attached and concentrated to newly formed keratohyalin bundles (). In a more advanced differentiated cell (upper left corner), these aggregates were packed into darkened spheres (double arrow in ). Adjacent to these sites were areas with an amorphous material that consisted of residual lysosomes (labeled Ly in ). The most obvious difference to Atg7f/f cells was the wide transitional layer under the SG-SC border with partially degraded cellular material (). Quantification of the TEM images revealed a statistically significant accumulation of ribosomes (p ≤ 0.05), ribosomal aggregates (p ≤ 0.02), and a tendency towards the formation of residual lysosomal areas in the atg7−/- epidermis ().
Based on these observations, we concluded that in the absence of autophagy the rER was incompletely processed in transitional cells, leading to the formation of ribosomal and other aggregates. This residual material together with un-hydrolyzed nucleic acids contributed to the thickened and darkened corneocytes in the epidermis of atg7−/- mice.
Cell death of terminally differentiated sebocytes parallels that of keratinocytes
As the structural resolution in the epidermis at the SG-SC border was limited, we examined another epithelial cell-lineage undergoing terminal differentiation, the sebocytes. Sebocytes form skin appendages, such as the SGl associated with hair follicles and the closely related preputial gland, a large SGl located at the male genitals in mice. Although sebocytes differ in their metabolic activity from keratinocytes, they display some striking similarities. Both cell types replicate at the basal lamina and subsequently form columns of differentiating cells. During differentiation keratinocytes mostly synthesize intermediate filaments, while sebocytes produce lipids. Finally, both cell types undergo cell death, lose their nucleus, and deposit their cellular content. In sebocytes, this procedure of self-expelling is referred to as holocrine secretion, a process producing the sebum, which acts as a protectant. Analogously, dead keratinocytes build up the rigid corneum, which participates in the skin barrier function.
These similarities between keratinocytes and sebocytes prompted us to further investigate autophagy and cell death in SGls. Similar to the skin, SGls of Atg7f/f GFP-LC3 transgenic mice stochastically displayed cells with GFP-positive autophagosomes (). The number of vesicles was highest in cells right underneath the sebum located at the efferent tract of the duct (). Two cells bordering the sebum next to a hair follicle showed an increased number of autophagosomes and a shrunken irregularly shaped nucleus. The amount of GFP-LC3 was higher in the left cell () infiltrating the nucleus, whose DNA was hydrolyzed (reflected by the fuzzy DAPI staining in ). Close inspection revealed that the nucleus was heavily occupied with small GFP vesicles (arrows ), peripheral DNA and one nucleolus was excluded from autophagosomes (merged ). Next to the nucleolus the autophagosome marker GFP-LC3 was significantly concentrated (). CTSD staining was more intense in SGls compared to the epidermis but was mostly absent in cells undergoing CDA (Figure S4). As in the epidermis during CDA, autophagosomes ‘consumed’ CTSD containing lysosomes, seen by the channel overlay (Figure S4).
Figure 3. CDA in sebocytes. (A) Sections of GFP-LC3 transgenic Atg7f/f and atg7−/- mice counterstained with DAPI. In Atg7f/f sebocytes, glandular cells at the border to the sebum contain GFP-LC3 labeled autophagosomes (→). Lipid droplets present in the cytoplasm generate a netlike pattern. (Ai) Higher magnification of one nucleus, which is heavily occupied with autophagosomes (→), some parts of the chromatin are excluded as well as one nucleolus, its DNA appears milky as it is hydrolyzed. (A) Atg7−/- SGs are devoid of GFP-LC3 vesicles but GFP accumulates throughout the cytoplasm, forms aggregates and appears speckled (►). (Aii) Higher magnification of a nucleus, which is highly occupied with GFP. DAPI staining reveals that the nucleus is condensed and hyperchromatic. (B) Sections of an Atg7f/f preputial gland counterstained with Hoechst showing sebocytes undergoing massively and collectively autophagy. Towards the efferent ductal lumen (L), autophagosome formation culminates in disintegrating cells. The cells are in different stages of autophagy induced cell death (I-IIb). Stage I: Cells furthest distant to the ductal lumen display the onset of autophagic vesicles formation. Their nuclei are large and the GFP-LC3 signal is more pronounced close to the nucleus. Stage II: Burst of autophagy in dying cells. Cells are filled with a tremendous amount of autophagosomes and have a slightly condensed nucleus and partially degraded cytoplasm. Stage IIb: Terminal stage. The cytoplasm is mostly cleared, the nucleus is hyper-condensed, decreased numbers of autophagosomes, which are primarily concentrate perinuclear. Abbreviations and labels: ►, accumulation of GFP; →, autophagosomes: h, hair; L, efferent ductal lumen; nu, nucleoli. Scale bars: 5 µm (A), 10 µm (B).
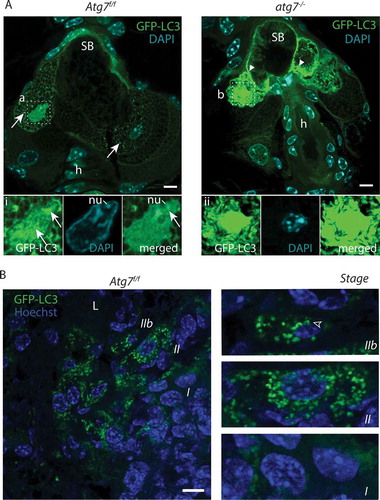
In contrast to Atg7f/f, atg7−/- sebocytes were devoid of GFP-LC3 vesicles but GFP accumulated throughout the cytoplasm, formed aggregates and appeared speckled (). Compared to controls, atg7−/- cells seemed to maintain their cytoplasm longer and obviously disintegrated later. Consequently, the ductal lumen in atg7-deficient SGl was occupied by more material (Figure S3A), a phenotype which has previously been characterized [Citation34]. In atg7−/- glands, the nuclei of sebocytes were fully occupied with GFP without discernible vesicles () and the chromatin was condensed and blebbing (, high magnification). Applying a high gain-DAPI channel, diffuse and DAPI-positive acerate structures, similar to those seen in the epidermis, were observed in the atg7−/- sebum indicative of nucleic acids (Figure S3B). Also, CTSD was diffuse in cytoplasmic areas or aggregates at the cell periphery (Figure S4).
To gain further insights, whether CDA was a general process in skin appendages, we examined preputial glands of Atg7f/f GFP-LC3 transgenic mice as well. These large SGls contain numerous sebocytes, increasing the prospects to detect cells undergoing CDA. Here, close to the efferent channel, areas were detected, where cells underwent CDA massively and collectively (). This is insofar remarkable as it suggested that CDA was initiated spatially coordinated. A similar observation was made for fewer cells in large SGls of the back skin (Figure S3B).
In these areas of collective autophagy, two stages of CDA could be distinguished. Stage I (prophase): cells, furthest away from the ductal opening, displayed some concentration of GFP-LC3 interpreted as an early stage of autophagic vesicles formation (). The nuclei of these cells were still large, surrounded by cytoplasm with diffusely distributed GFP-LC3, and the cells were embedded in a homogenous tissue area. Stage II (execution phase of CDA): a burst of autophagy occurred, with a high number of GFP-LC3-positive vesicles. Stage II cells were disintegrated, displaying the highest amount of autophagosomes along with a shrunken nucleus and degraded cytoplasm. A few cells were in a slightly advanced state with an already hyper-condensed nucleus and u-shaped autophagosomes right at the nucleus or chromatin (nucleophagy, stage IIb).
Autophagy in sebaceous glands participates in a lysosomal form of cell death
Sebocytes within the SGls of Atg7f/f mice showed the typical arrangement in form of columnar stacks with an increasing number of lipid droplets as they advanced in differentiation (bottom to top in ) [Citation35]. The most advanced cells contained deformed nuclei with darkened and peripherally condensed chromatin (, cell at the top). In these cells, the rER was declined and ribosomes were concentrated at the cell membrane or around the nucleus. The perinuclear space was widened and embedded in an amorphous mass with numerous vesicles (). Secondary lysosomes of different opacity and size were numerous in these advanced cells. The darkened appearance of the secondary lysosomes was a consequence of ongoing ribosomal nucleic acids hydrolysis. Partially dissolving sebocytes with several cells being affected simultaneously were also detected within the SGl (). In the upper part, the cellular content had been processed to sebum (SB), which appeared translucent in the apical region due to a homogenous fusion of lipid droplets (LD). A nuclear remnant (Nr) could be seen. Below that, an area containing lipid droplets (LD) at various stages of fusion and dissolution was seen (boxed area in shown in 4D). In that region, the sebum (SB) appeared speckled and several dark secondary lysosomes and lipid droplets surrounded by a darker mass containing small Golgi derived lysosomes were observed (). Around most cells, the cytoplasmic membrane was not visible anymore. Interestingly, the conversion to sebum affected several cells at the same time and spread to other cells continuously (). The major vesicle sorting organelle, the Golgi compartment, accounts for the formation of primary lysosomes. The Golgi network was significantly expanded in cells at this terminal stage (). Hence, we propose that the numerous vesicles in the most advanced cells are Golgi-derived primary lysosomes, which accumulate before the initiation of lysosomal cell death.
Figure 4. Ultrastructure of the sebaceous gland. (A) Column of differentiating sebocytes in Atg7f/f glands, with lipid droplets (LD) accumulating during differentiation (bottom to top) and dark secondary lysosomes (sLy). (B) Higher magnification of the condensed nucleus of the terminally differentiated cell (in A). The cytoplasm is filled with a darker mass, numerous small primary lysosomes, dark secondary lysosomes (sLy), and lipid droplets (LD). (C) Transitional SGl cells, with sebum (SB) in the upper half. Different stages of cell lysis are visible, with the cytoplasmic membrane being degraded (dashed line indicates a previous cell border) resulting in an open border to the cells below (open→). The lower cells are in a dissolving state, containing lipid droplets (LD) at various stages of fusion and disintegration. The cell at the bottom left contains a dilated, slightly hyperchromatic nucleus (N). (D) Higher magnification of the area (in C) displaying the onset of cell lysis, visible by the LD fusion and break up. In the lower left, the expanded trans-Golgi network of another cell is seen. (E) Column of terminal differentiating sebocytes in a hypertrophic atg7−/- gland. Cells are abundantly filled with LDs and several darkened secondary lysosomes (sLy). In cells bordering the sebum (SB) the nuclei are at different stages of condensation, one being pyknotic (F). The sebum has a more electron-dense and speckled appearance. (F) Higher magnification of the highly condensed and pyknotic nucleus of one of the sebocytes from the gland shown in E. The cytoplasm of this cell is filled with a perinuclear electron-dense material containing an expanded Golgi with numerous primary lysosomal vesicles. (G, H) Cells from a different SGl showing the formation of pathological residual bodies (RB), tertiary lysosomes, which occupies a large area of the cytoplasm. The inside of RB structure has a similar appearance as the sebum seen in the upper ductal part of the image shown in E. (H) At the border and in inner areas of the RB, rER, and ribosomes (→) accumulate, darkening the material. Many primary lysosomes are lined up at the border and are incorporated into the RB (►). Lipid droplets give the RB its speckled appearance. Abbreviations: Gg, Golgi apparatus; LD, lipid droplet; Ly, lysosomes; ►, lysosomes incorporated into the RB; N, nucleus; Nr, nuclear remnant; sLy, secondary lysosomes; RB, residual bodies; rER, rough ER; SB, sebum. Scale bars: 5 µm (A, C, and E), 1 µm (D, G, and H), 500 nm (B and F).
In contrast, the SGls of the atg7−/- animals were enlarged and their sebum (SB) was of different opacity and granularity (). This observation is consistent with the alterations of the sebum previously described in the absence of autophagy [Citation34]. Most obvious, cell borders and nuclear remnants were still visible in the sebum. The presence of prominent cell borders pointed to a lack of degradation of the cell membrane or displacement of cytoplasmic material to the border. Inside late stage cells with pyknotic nuclei, primary lysosomes accumulated, visible as a punctuated perinuclear dark mass (). Here, the pyknotic nucleus had lost its membrane and was in an advanced stage of chromatin condensation and segmental dissociation (karyorrhexis). Both the sebum and the nucleus were of higher opacity than in Atg7f/f control samples ().
The most striking cellular phenotype in the pathology of autophagy deficient SGls was the appearance of huge (tertiary) lysosomes termed residual bodies (RB) that contained lipids and other remnants (). Here, the granularity was similar to that of the sebum (). The RB was surrounded by a fragmented sphere of dark material, which consisted of accumulating ribosomes (). This accumulation of ribosomes, lysosomes, and the darkening of cellular remnants of un-degraded nucleic acids in the absence of CDA were re-emerging features observed in the keratinocyte lineage.
The Harderian gland displays unique features of cell death induced autophagy
The Harderian gland, a retro-orbital appendix of the skin formed by keratinocyte lineage cells, is present in mice but not in humans. It is an excellent model to study the role of autophagy in glandular function (Figure S4A) [Citation32]. Comparable to other epithelial tissues, 1–5 out of ~ 1000 cells contained an abnormal amount of autophagosomes in the Atg7f/f GFP-LC3 mice – the example shown here is a ductal poly-nucleated cell undergoing CDA (). The nuclei of this cell were in different stages of autophagic dissociation. Besides a wide distribution of autophagosomes in the cytoplasm, the left nucleus was surrounded and infiltrated with GFP-LC3 vesicles. Its nuclear envelope appeared fragmented with degraded regions on the left and right side. The central nucleus of this cell was a fully eroded, with an immense accumulation of autophagosomes (, inset). During CDA, CTSD containing lysosomes were numerous and concentrated in a separate cytoplasmic area than autophagosomes (Figure S6A). A few autophagosomes merged to CTSD-positive lysosomes (Figure S6Ai, ii). By TEM, the remnant of a nucleus of a late stage CDA Atg7f/f cell was encircled by autophagic vesicles and a ballooning perinuclear space (). The nuclear DNA was highly condensed but fuzzy at the edges (inset α). The ballooning perinuclear space was filled with hydrolyzing chromatin and nucleoli. It appeared that many autophagosomes had fused to generate a giant tubular vesicle compartment, comparable to the GFP-LC3 vesicles in . The cytoplasm of the late stage CDA cell was mostly degraded and macerated with a large amount of small autophagic vesicles ().
Figure 5. CDA in HaGl cells. (A) Confocal laser scanning microscopy images of HaGl cells. (a) Poly-nucleated Atg7f/f HaGl cell undergoing CDA (encircled), with two different stages of nucleo-phagy occurring. Plenty of autophagosomes are present in the cytoplasm (→) and around the left nucleus. Autophagosomes are degrading and infiltrating the nucleus (open ►). The more central located nucleus (double arrows) is fully eroded within a massive accumulation of autophagosomes (inset). (b) Accumulation of GFP-LC3 in atg7−/- cells. The aggregates here are of spherical and dense appearance and present around a vacuole of the size of a nucleus (white triangle) or form pseudo crystalline structures (*). (B) TEM analysis of ductal HaGl cells. (a) Atg7f/f cells in phase 2 (full CDA). Remnants of a nucleus (Nr), with hyper-condensed chromatin at the upper edge (inset α) and a ballooning perinuclear space filled with hydrolyzed chromatin (c´) and degrading nucleoli (nu) (inset β). The perinuclear space is surrounded by a large number of small vesicles; some are fusing to the perinuclear space (→). The cytoplasm of this cell is mostly degraded and filled with numerous small vesicles. (b) Atg7−/- HaGl cell with multiple aggregates and a centrally located tertiary lysosome = residual body (RB) and many aggregates forming pseudo-crystalline structures (*), which consists of ER stacks (inset). Ribosomes (r) have previously been stripped off and accumulate at the periphery. The RB contains un-degraded material and at its periphery additional stacks of ER. The ER stacks correspond to the pseudo crystalline GFP structures seen above in Ab (*). Abbreviations and labels: →, autophagosomes; c, degraded chromatin; ⇉, full nucleophagy in CDA; LD, lipid droplet; N, nucleus; Nr, nuclear remnant; nu, nucleoli; ►, onset of nucleophagy; RB, open residual body/tertiary lysosome; –, poly-nucleated cell encircled; rER, rough ER; r, ribosomes. Scale bars: 1 µm (A, B).
As for the other tissues, the most striking phenotype seen in the HaGl (Haderian gland) of atg7−/- GFP-LC3 transgenic mice was the accumulation of GFP (Aii). In a few of these cells, spherical and pseudo-crystalline GFP aggregates were observed (). These aggregates were located around vacuoles of impressive size and were formed, based on TEM, by stacks of ER from which ribosomes had been stripped off and accumulated at the periphery (, inset). A large portion of the cell shown here was filled with a tertiary lysosome referred to as residual body (). The adjacent nucleus was intact and showed no alterations in its chromatin. Thus, we conclude that the formation of pseudo-crystalline aggregates and the residual body is caused by defective reticulophagy. In another atg7−/- cell, we observed that defective reticulophagy began with the dilation of the ER and accumulation of ribosomes and small perinuclear lysosomes (Figure S4B).
Similar to keratinocytes and sebocytes, CDA in the HaGl was essential for the degradation of the ER and nuclei. Consequently, the absence of CDA in atg7−/- cells caused an accumulation of nuclear remnants, which could be seen in the DAPI and TUNEL channel (Figure S4C).
Discussion
The current view on cell death of keratinocytes has been that they undergo a unique form of programmed cell death referred to as cornification [Citation36]. Thereby lysosomes and lysosomal proteases, such as CTSD (cathepsin D), are of crucial importance [Citation7]. A novel addendum to this concept is, that in the skin, autophagy subject cellular organelles to lysosomal degradation during cell death. Not surprisingly autophagy-deficient mice have a similar, although weaker ichthyosis phenotype compared to Ctsd-deficient mice. Very likely, this is due to the possibility that lysosomal proteases bypass autophagy by direct lysosomal membrane permeabilization as during necrosis [Citation37]. Based on our analysis, we estimated that around 20% of cells in the transitional layer were in a state of active CDA. Nevertheless, as these were only snapshots of a continuous process, we would argue that the constitutive fate of each cell is to undergo CDA. This is supported by a very homogenous phenotype of nucleic acids and GFP-LC3 accumulation and the thickening of the transitional layer in autophagy-deficient skin.
The execution of CDA described in the epidermis, SGl, PrGl, and HaGl showed striking parallels to the autosis phases described in HeLa cells induced in vitro by Tat-BECN1 [Citation19]. In vivo, it started with the expansion of the Golgi, thereby generating primary lysosomes, chromatin condensation, ER restructuring, and perinuclear space expansion ( and ). The first autophagic event was the removal of the rER. Hereby, the ER fragmented and together with ribosomes incorporated into small vesicles. These darker stained vesicles were secondary lysosomes with a higher opacity due to their nucleic acid content. Their sometimes-striped appearance could be due to residual ER membranes. In sebocytes, the increase of secondary lysosomes during differentiation correlated with the rER decline (). In this phase, the observed conversion of the ER during CDA may give rise to autophagosomes. Reticulophagy proceeded to concentrate juxtanuclear, where it increasingly targeted the perinuclear ER and the nucleus itself. This was the beginning of the striking second phase of CDA. Here, chromatin was further compacted, the nucleus started to shrink and was massively attacked by autophagosomes. The process of nucleophagy could be studied best in the HaGl, where autophagy sequestered and degraded nuclear proteins, thus making genomic DNA more accessible for hydrolytic enzymes (). The term nucleophagy has been referred to as selective autophagy of bits of the nucleus [Citation38]. Here, we observed a complete removal of the nucleus. Another peculiar feature was the formation of giant autolysosomes by constant fusion of autophagosomes close to the nucleus (). Large autophagosomes may result upon ablation of the negative MTOR (mechanistic target of rapamycin kinase) feedback loop during disintegration of the cells [Citation13]. The sequential clearance of the ER followed by nucleophagy seen during CDA may also result from a temporal controlled selective targeting of these organelles by different receptors. Indeed, in Saccharomyces cerevisiae, two specific proteins, Atg39 and Atg40, control the targeted degradation of the nucleus and ER [Citation39]. The homologous receptor RETREG1/FAM134B in humans is responsible for reticulophagy and mutations cause sensory neuropathy [Citation40]. Hence, the autosis-inducing Tat-BECN1 peptide has been considered as a therapeutic candidate to cure neuropathies [Citation41]. In this context, CDA-inducing agents may be beneficial to treat psoriatic skin diseases and especially differentiating epithelial tumors, like squamous cell carcinomas [Citation42,Citation43].
CDA was often occurring collectively in neighboring cells. The coordinated induction and the replacement of the cytoplasm by autophagosomes could best be observed in sebocytes of the preputial gland (). Also in other tissues, we observed that small groups of cells were triggered to undergo CDA, while others remained quiescent (Figure S3B). This can be translated to a concept of a cyclic activation of CDA. First, several cells mature. Followed, in a second step by a collective activation of autophagic cell death. Third, the thereby generated material or cellular corpses are being ejected or shed from the surface. In the end, a new cycle is initiated by the replacement of basal cells moving up and starting to differentiate. The concept of a cyclic CDA activation fits well with the observation of a stochastic expulsion of sebum and the squamous cell layer formation in the skin. A cyclic regulation of sebum production has been previously suggested to occur in other rodents as well [Citation44].
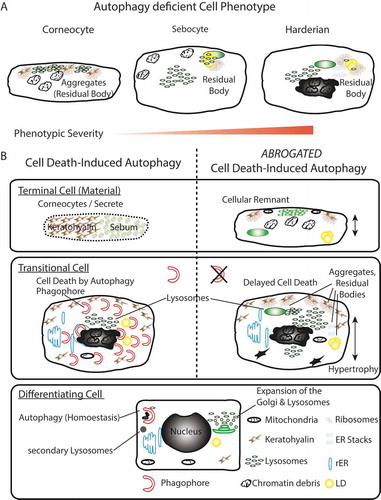
In their cellular phenotype, keratinocytes, sebocytes, and HaGl cells displayed a high degree of similarity in absence of CDA (). Common to all three cell types was the observed accumulation of nucleic acids, chromatin debris, primary lysosomes and residual bodies (tertiary lysosomes). These similarities and the fact that we did not see significant alterations of differentiation markers, we intepret as evidence that CDA is a selective adaptation to remove cellular organelles, independent of the keratinocyte anabolic functions. Of all cell lineages mentioned, HaGl cells were the most severely affected. In these, stacks of the smooth ER accumulated to geometrically ordered structures and nuclei dramatically shrank or were removed by holocrine secretion [Citation32].
Figure 6. Summary model. (A) Phenotypic homology of terminally differentiated autophagy-deficient keratinocytes, sebocytes, and HaGl cells. In all cell types, the aggregation of ribosomes and accumulation of lysosomes is observed upon ablation of autophagy. In keratinocytes, these aggregates occur at keratohyalin fibres and cause only a very mild phenotype. In the lipid producing SGl and HaGl, additionally, lipids are incorporated into an RB. A unique feature for the HaGl cells are the observed lamellar stacks of smooth ER, which form pseudo-crystalline structures. (B) Model for the dual role of autophagy in cells of the epithelial lineage. On the one hand in basal cells autophagy is required to maintain cell viability by eliminating toxic metabolic by-products. On the other hand, during terminal differentiation when cells have become increasingly resistant to apoptosis, autophagy controls cell death. In this type II cell death (CDA), the trans-Golgi expands and produced an excess of lysosomes. During CDA, autophagosomes target cellular constituents and degrade them by the fusion with lysosomes. Through the perforation of the cell membranes, either a homogenous sebum or flattened corneocytes are generated, respectively, in the glands or the skin. When autophagy is blocked, lysosomes accumulate and together with cellular remnants form aggregates (RB). Ultimately, cell death is delayed and cells remain incompletely degraded.
Autophagy is also required to maintain cell viability. This ‘classical’ homeostatic function of autophagy acts to protect metabolically active cells from the deleterious effects of misfolded proteins, toxic lipids or damaged organelles. This is typically associated with changes in the autophagy receptor SQSTM1/p62 [Citation45]. Yet, as we detected only traces of this marker in the epidermis with a tendency to accumulate in atg7−/- mice, this pathway may not be prevalent in the skin [Citation30]. Nevertheless, it may be of higher significance in the SGl and the HaGl [Citation30,Citation32,Citation34].
Thus, we propose a model for a dual role of autophagy in epithelial lineage cells (). On the one hand, in basal cells autophagy, it is required to maintain cell viability by eliminating toxic metabolic products. On the other hand, during terminal differentiation, when cells have become increasingly resistant to apoptosis, autophagy determines the terminal cell fate. When autophagy is blocked, lysosomes accumulate and form together with cellular remnants aggregates. Ultimately, cell death is delayed, and cells remain incompletely solubilized. In conclusion, autophagy is an integral part of cell death in keratinocytes in vivo and determines their terminal cell fate.
Materials and methods
Mouse husbandry
To obtain epithelial autophagy-deficient Atg7 mice (referred to as atg7−/-), mice carrying the Atg7-floxed allele (referred to Atg7f/f) were crossed to Krt14-Cre transgenic mice (strain Tg[Krt14-cre]1Amc/J; Jackson Laboratory, 004782) [Citation46]. For the generation of autophagosome reporter mice, the GFP-LC3 transgene was crossed into the Atg7f/f Krt14-Cre background [Citation47]. The alleles were genotyped as previously described [Citation30]. Analyses were performed on samples from approximately 1-year-old mice. The animal experiments were approved by the Ethics Review Committee for Animal Experimentation of the Medical University of Vienna, Austria (approval number BMWF-66.009/0124-II/10b/2010).
Histology & fluorescence microscopy
For the in situ GFP-LC3 fluorescence analysis, mice were euthanized by carbon dioxide asphyxiation, then immediately perfused through the left ventricle first with cold dulbecco’s phosphate-buffered saline (DPBS; ThermoFisher, 21600–044), followed by 4% paraformaldehyde (Sigma, 6148) in DPBS to fix the tissue. Samples were collected and further fixed with the same fixative for 4 h, followed by treatment with 15% sucrose (Sigma, S9378) in DPBS for 4 h at room temperature and then with 30% sucrose solution overnight at 4°C. Tissue samples were embedded in optimal cutting temperature (OCT) medium (Tissue-Tek, 4583) and stored at -80°C. 10 µm sections were investigated for the presence of GFP-LC3 puncta using a confocal laser scanning microscope (LSM880 and LSM700, Zeiss, Germany) in super resolution mode. Channels were acquired separately. For the visualization of autophagosomes at the corneum high laser power and multiple averaging was applied. Quantification of epidermal keratinocytes undergoing CDA was performed as following: cells with either a high number of autophagosomes or a high concentration of GFP-LC3 at the nucleus were counted in three independent SR-LSM pictures of three biological samples/genotype each and displayed as the percentage of CDA cells relative to the total number of cells (determined by counting the nuclei). Conventional fluorescence was performed on an AxioImager Z2 (Zeiss, Germany). The primary antibody, rabbit anti-IVL/involucrin (Covance, PRB-140C) was used in a 4°C overnight incubation at a 1:500 dilution DPBS/2% BSA/10% normal horse serum (Vector Labs, S-2000), goat anti-CTSD 1:1000 (R&D Systems, AF1029) in a concentration 5 µg/ml. Hoechst 33258 (Life Technologies, H3569) or DAPI (4′,6-diamidino-2-phenylindole, Sigma, D9564) 1 ng/ml was used to label the nuclei. The secondary antibodies, donkey anti-rabbit Alexa Fluor 647 (Life Technologies, A-31573) or donkey anti-goat Alexa Fluor 647 (Life Technologies, A-21447), respectively, were used at a 1:500 dilution. For TUNEL staining, the in situ Cell Death Detection Kit TMR red Roche (Sigma, 11684795910) was used. H&E staining of sections from paraffin-embedded tissue was performed according to standard protocols.
Transmission electron microscopy
Aged animals were perfused as described above. Samples of approximately 1 mm3 were dissected from Harderian glands and subsequently fixed with 2.5% glutaraldehyde (Sigma, G7526) in 0.1 mol/l phosphate buffer, post-fixed with 2% osmium tetroxide (Sigma, 75633) in the same buffer, dehydrated in a graded series of ethanol, and embedded in Agar 100 epoxy resin (Agar Scientific, AGR1045). Ultra-thin sections were cut at a nominal thickness of 70 nm, post-stained with 2% uranyl acetate and lead citrate and inspected in a transmission electron microscope (Morgagni, FEI 268D TEM, UK) operated at 80 kV. Images were acquired using an 11-megapixel CCD camera from Olympus (Germany).
Immunoblotting
Epidermal sheets were collected from the shaved back of the mice. After floating ~1 cm2 skin on 0.5 M ammonium thiocyanate (Sigma, 221988) in DPBS for 30 min at 37°C, the epidermis was separated from the dermis and in parallel with Harderian glands homogenized in RIPA buffer containing protease inhibitors complete Roche (Sigma, 11697498001) in a Precellys bead tissue grinder (Peqlab, 91-PCS-CK14). Insoluble debris was removed by centrifugation and the protein concentration was measured by the BCA (Pierce, 23235) method. 10–20 µg of each sample was separated on precast polyacrylamide gels (BioRad, 456–1094) and transferred to PVDF membranes (Amersham Highbond P 0.45; GE Healthcare, GE10600023). After incubation, bands were visualized with ECL (GE Healthcare, RPN2209) on films. The following primary antibodies were used for the detection of specific antigens in an overnight incubation in 5% non-fat dry milk in TBS-T: rabbit polyclonal anti-SQSTM1 1:2000 (Enzo, PW9860), rabbit polyclonal anti-LC3 1:2000 (GeneTex, GTX82986), rabbit anti-involucrin 1:5000 (BioLegend, 924401), rabbit anti-filaggrin 1:1000 (BioLegend, 905801), rabbit anti-keratin 10 1:1000 (BioLegend, 905403), rabbit anti-keratin 14 1:1000 (BioLegend, 905303), goat anti-CTSD 1:1000 (R&D Systems, AF1029), rat anti-LAMP1 1:1000 (Thermo, 14-1071-85), rabbit anti-RPL26 1:1000 (Bethyl, A300-686), chicken anti-GFP-HRP 1:10,000 (Promega, 61351). Secondary antibodies against the respective species were diluted 1:10,000. For re-probing, blots were inactivated in 15% H2O2 (Sigma, H1009) for 15 min at 40°C or stripped in 6 M guanidine hydrochloride (Sigma, G3272), 0.2% NP-40S/Tergitol (Sigma, NP40S), 20 mM Tris-HCl (Sigma, T1378), pH 7.5, 0.1 M β-mercaptoethanol (CarlRoth, 4227.1) for 2 × 5 min at RT.
Quantification and statistical analysis
Electron micrographs were quantified using ImageJ (NIH). Scanned immunoblots were quantified as greyscales in Adobe Photoshop CS6. Statistical analyses were calculated and blotted in GraphPad Prism 6 in a Student t-test (2 tailed, unpaired samples), the error bars represent ±SD. Independent biological samples analyzed, N ≥ 3.
Supplemental Material
Download Zip (51 MB)Acknowledgments
We thank Erwin Tschachler for hosting and supporting this project at the Medical University of Vienna, Department of Dermatology. Thomas Zobel from the Münster Imaging Network and Christian Klämbt from the Institute of Neuro- and Behavioral Biology for their support in confocal microscopy. Thomas Weide and Ulf Schulze from the Department of Experimental Nephrology at the UKM, for providing reagents. The EM Facility of the Vienna BioCenter Core Facilities GmbH (VBCF) acknowledges funding from the Austrian Federal Ministry of Education, Science and Research and the City of Vienna. Masaaki Komatsu, Noboru Mizushima and Ludger Klein for providing and transferring Atg7 and LC3 mice and Leopold Eckhart and Heidemarie Rossiter for providing material and their thoughtful discussion.
Disclosure statement
No potential conflict of interest was reported by the authors.
Supplementary material
Supplemental data for this article can be accessed here.
References
- Omori E, Matsumoto K, Sanjo H, et al. TAK1 is a master regulator of epidermal homeostasis involving skin inflammation and apoptosis. J Biol Chem. 2006 Jul 14;281(28):19610–19617.
- Pasparakis M, Courtois G, Hafner M, et al. TNF-mediated inflammatory skin disease in mice with epidermis-specific deletion of IKK2. Nature. 2002 Jun 20;417(6891):861–866.
- Bonnet MC, Preukschat D, Welz PS, et al. The adaptor protein FADD protects epidermal keratinocytes from necroptosis in vivo and prevents skin inflammation. Immunity. 2011 Oct 28;35(4):572–582.
- Livshits G, Kobielak A, Fuchs E. Governing epidermal homeostasis by coupling cell-cell adhesion to integrin and growth factor signaling, proliferation, and apoptosis. Proc Natl Acad Sci U S A. 2012 Mar 27;109(13):4886–4891.
- Ishida-Yamamoto A, Simon M, Kishibe M, et al. Epidermal lamellar granules transport different cargoes as distinct aggregates. J Invest Dermatol. 2004 May;122(5):1137–1144.
- Lavker RM, Matoltsy AG. Formation of horny cells: the fate of cell organelles and differentiation products in ruminal epithelium. J Cell Biol. 1970 Mar;44(3):501–512.
- Egberts F, Heinrich M, Jensen JM, et al. Cathepsin D is involved in the regulation of transglutaminase 1 and epidermal differentiation. J Cell Sci. 2004 May 1;117(Pt 11):2295–2307.
- Zeeuwen PL, Ishida-Yamamoto A, van Vlijmen-Willems IM, et al. Colocalization of cystatin M/E and cathepsin V in lamellar granules and corneodesmosomes suggests a functional role in epidermal differentiation. J Invest Dermatol. 2007 Jan;127(1):120–128.
- Nakagawa T, Roth W, Wong P, et al. Cathepsin L: critical role in Ii degradation and CD4 T cell selection in the thymus. Science. 1998 Apr 17;280(5362):450–453.
- Felbor U, Kessler B, Mothes W, et al. Neuronal loss and brain atrophy in mice lacking cathepsins B and L. Proc Natl Acad Sci U S A. 2002 Jun 11;99(12):7883–7888.
- Stahl S, Reinders Y, Asan E, et al. Proteomic analysis of cathepsin B- and L-deficient mouse brain lysosomes. Biochim Biophys Acta. 2007 Oct;1774(10):1237–1246.
- Dhanrajani PJ. Papillon-Lefevre syndrome: clinical presentation and a brief review. Oral Surg Oral Med Oral Pathol Oral Radiol Endod. 2009 Jul;108(1):e1–7.
- Yu L, McPhee CK, Zheng L, et al. Termination of autophagy and reformation of lysosomes regulated by mTOR. Nature. 2010 Jun 17;465(7300):942–946.
- Bright NA, Reaves BJ, Mullock BM, et al. Dense core lysosomes can fuse with late endosomes and are re-formed from the resultant hybrid organelles. J Cell Sci. 1997 Sep;110(Pt 17):2027–2040.
- Ktistakis NT, Tooze SA. Digesting the expanding mechanisms of autophagy. Trends Cell Biol. 2016 Aug;26(8):624–635.
- He C, Klionsky DJ. Regulation mechanisms and signaling pathways of autophagy. Annu Rev Genet. 2009;43:67–93.
- Klionsky DJ, Abdelmohsen K, Abe A, et al. Guidelines for the use and interpretation of assays for monitoring autophagy (3rd edition). Autophagy. 2016;12(1):1–222.
- Jiang P, Mizushima N. Autophagy and human diseases. Cell Res. 2014 Jan;24(1):69–79.
- Liu Y, Shoji-Kawata S, Sumpter RM Jr., et al. Autosis is a Na+,K+-ATPase-regulated form of cell death triggered by autophagy-inducing peptides, starvation, and hypoxia-ischemia. Proc Natl Acad Sci U S A. 2013 Dec 17;110(51):20364–20371.
- Bursch W, Hochegger K, Torok L, et al. Autophagic and apoptotic types of programmed cell death exhibit different fates of cytoskeletal filaments. J Cell Sci. 2000 Apr;113(Pt 7):1189–1198.
- Fulda S, Kogel D. Cell death by autophagy: emerging molecular mechanisms and implications for cancer therapy. Oncogene. 2015 Oct 1;34(40):5105–5113.
- McPhee CK, Logan MA, Freeman MR, et al. Activation of autophagy during cell death requires the engulfment receptor Draper. Nature. 2010 Jun 24;465(7301):1093–1096.
- Lin L, Rodrigues F, Kary C, et al. Complement-related regulates autophagy in neighboring cells. Cell. 2017 Jun 29;170(1):158–171 e8.
- Hofius D, Schultz-Larsen T, Joensen J, et al. Autophagic components contribute to hypersensitive cell death in Arabidopsis. Cell. 2009 May 15;137(4):773–783.
- Yu L, Alva A, Su H, et al. Regulation of an ATG7-beclin 1 program of autophagic cell death by caspase-8. Science. 2004 Jun 4;304(5676):1500–1502.
- Leng ZG, Lin SJ, Wu ZR, et al. Activation of DRD5 (dopamine receptor D5) inhibits tumor growth by autophagic cell death. Autophagy. 2017 Aug 3;13(8):1404–1419.
- Nassour J, Radford R, Correia A, et al. Autophagic cell death restricts chromosomal instability during replicative crisis. Nature. 2019 Jan;565(7741):659–663.
- Gosselin K, Deruy E, Martien S, et al. Senescent keratinocytes die by autophagic programmed cell death. Am J Pathol. 2009 Feb;174(2):423–435.
- Akinduro O, Sully K, Patel A, et al. Constitutive autophagy and nucleophagy during epidermal differentiation. j invest dermatol. 2016 Jul;136(7):1460–1470.
- Rossiter H, Konig U, Barresi C, et al. Epidermal keratinocytes form a functional skin barrier in the absence of Atg7 dependent autophagy. J Dermatol Sci. 2013 Jul;71(1):67–75.
- Yoshihara N, Ueno T, Takagi A, et al. The significant role of autophagy in the granular layer in normal skin differentiation and hair growth. Arch Dermatol Res. 2015 Mar;307(2):159–169.
- Koenig U, Fobker M, Lengauer B, et al. Autophagy facilitates secretion and protects against degeneration of the Harderian gland. Autophagy. 2015;11(2):298–313.
- Fischer H, Fumicz J, Rossiter H, et al. Holocrine secretion of sebum is a unique DNase2-dependent mode of programmed cell death. J Invest Dermatol. 2017 Mar;137(3):587–594.
- Rossiter H, Stubiger G, Groger M, et al. Inactivation of autophagy leads to changes in sebaceous gland morphology and function. Exp Dermatol. 2018 Oct;27(10):1142–1151.
- Niemann C, Horsley V. Development and homeostasis of the sebaceous gland. Semin Cell Dev Biol. 2012 Oct;23(8):928–936.
- Eckhart L, Lippens S, Tschachler E, et al. Cell death by cornification. Biochim Biophys Acta. 2013 Dec;1833(12):3471–3480.
- Guicciardi ME, Gores GJ. Complete lysosomal disruption: a route to necrosis, not to the inflammasome. Cell Cycle. 2013 Jul 1;12(13):1995.
- Mijaljica D, Devenish RJ. Nucleophagy at a glance. J Cell Sci. 2013 Oct 1;126(Pt 19):4325–4330.
- Mochida K, Oikawa Y, Kimura Y, et al. Receptor-mediated selective autophagy degrades the endoplasmic reticulum and the nucleus. Nature. 2015 Jun 18;522(7556):359–362.
- Khaminets A, Heinrich T, Mari M, et al. Regulation of endoplasmic reticulum turnover by selective autophagy. Nature. 2015 Jun 18;522(7556):354–358.
- Shoji-Kawata S, Sumpter R, Leveno M, et al. Identification of a candidate therapeutic autophagy-inducing peptide. Nature. 2013 Feb 14;494(7436):201–206.
- Lemound J, Stucki-Koch A, Stoetzer M, et al. Aberrant expression of caspase 14 in salivary gland carcinomas. J Oral Pathol Med. 2015 Jul;44(6):444–448.
- Koenig U, Sommergruber W, Lippens S. Aberrant expression of caspase-14 in epithelial tumors. Biochem Biophys Res Commun. 2005 Sep 23;335(2):309–313.
- Parnell JP. Postnatal development and functional histology of the sebaceous glands in the rat. Am J Anat. 1949 Jul;85(1):41–71.
- Komatsu M, Kurokawa H, Waguri S, et al. The selective autophagy substrate p62 activates the stress responsive transcription factor Nrf2 through inactivation of Keap1. Nat Cell Biol. 2010 Mar;12(3):213–223.
- Komatsu M, Waguri S, Ueno T, et al. Impairment of starvation-induced and constitutive autophagy in Atg7-deficient mice. J Cell Biol. 2005 May 9;169(3):425–434.
- Mizushima N, Yamamoto A, Matsui M, et al. In vivo analysis of autophagy in response to nutrient starvation using transgenic mice expressing a fluorescent autophagosome marker. Mol Biol Cell. 2004 Mar;15(3):1101–1111.