
ABSTRACT
The roles of SUMOylation and the related enzymes in autophagic regulation are unclear. Based on our previous studies that identified the SUMO2/3-specific peptidase SENP3 as an oxidative stress-responsive molecule, we investigated the correlation between SUMOylation and macroautophagy/autophagy. We found that Senp3± mice showed increased autophagy in the liver under basal and fasting conditions, compared to Senp3+/+ mice. We constructed a liver-specific senp3 knockout mouse; these Senp3-deficient liver tissues showed increased autophagy as well. Autophagic flux was accelerated in hepatic and other cell lines following knockdown of SENP3, both before and after the cells underwent starvation in the form of the serum and amino acid deprivation. We demonstrated that BECN1/beclin 1, the core molecule of the BECN1-PIK3C3 complex, could be SUMO3-conjugated by PIAS3 predominantly at K380 and deSUMOylated by SENP3. The basal SUMOylation of BECN1 was increased upon cellular starvation, which enhanced autophagosome formation by facilitating BECN1 interaction with other complex components UVRAG, PIK3C3 and ATG14, thus promoting PIK3C3 activity. In contrast, SENP3 deSUMOylated BECN1, which impaired BECN1-PIK3C3 complex formation or stability to suppress the PIK3C3 activity. DeSUMOylation of BECN1 restrained autophagy induction under basal conditions and especially upon starvation when SENP3 had accumulated in response to the increased generation of reactive oxygen species. Thus, while reversible SUMOylation regulated the degree of autophagy, SENP3 provided an intrinsic overflow valve for fine-tuning autophagy induction.
Abbreviations
AL: autolysosome; AP: autophagosome; ATG: autophagy related; ATG14: autophagy related 14; BECN1: beclin 1, autophagy related; cKO: conditional knockout; co-IP: co-immunoprecipitation; CQ: chloroquine; EBSS: Earle’s balanced salt solution; GFP: green fluorescent protein; MAP1LC3/LC3: microtubule-associated protein 1 light chain 3; MTOR: mechanistic target of rapamycin kinase; NAC: N-acetyl-L-cysteine; PIK3C3: phosphatidylinositol 3-kinase catalytic subunit type 3; PTM: post-translational modification; RFP: red fluorescent protein; ROS: reactive oxygen species; RUBCN/rubicon: RUN domain and cysteine-rich domain containing, BECN1-interacting protein; SENP3: SUMO specific peptidase 3; shRNA: small hairpin RNA; siRNA: small interfering RNA; SQSTM1: sequestosome 1; SUMO: small ubiquitin-like modifier; UVRAG: UV radiation resistance associated gene.
Introduction
Autophagy is a process of cellular self-degradation for recycling damaged proteins and organelles, which allows cells and organisms to maintain homeostasis and survive under stress conditions, such as nutrient deprivation, hypoxia, chemotherapeutic exposure, and inflammation. The autophagic sequestration of the organelles or portions of the cytosol within double-membrane vesicles result into autophagosomes that will fuse with lysosomes to form autolysosomes for degradation [Citation1–Citation5]. The regulation of autophagy at the transcriptional, post-transcriptional and post-translational levels has been extensively researched [Citation6]. Post-translational modifications (PTMs) of proteins play a key role in the rapid regulation of signaling events. Several types of PTMs, such as phosphorylation, glycosylation, ubiquitination, acetylation, and lipidation, are considered crucial for autophagy induction, regulation and fine-tuning under various stresses [Citation7–Citation9].
BECN1/Vps30/Atg6 is a well-conserved protein and plays a central role in autophagy initiation. Following stress, BECN1 is released from BCL2 and then promotes autophagy. BECN1 binds with the class III phosphatidylinositol 3-kinase (containing PIK3C3/Vps34) and the positive cofactors UVRAG and ATG14/BARKOR, and some negative cofactors, such as RUBCN/rubicon, to form the BECN1-PIK3C3 complex. This complex is important for the localization of autophagic proteins to a phagophore assembly site, followed by autophagosome formation [Citation10,Citation11]. PIK3C3 phosphorylates phosphatidylinositol to generate phosphatidylinositol-3-phosphate (PtdIns3P), and the overall activity of PIK3C3 is positively regulated by BECN1 [Citation12,Citation13]. To date, phosphorylation, ubiquitination, acetylation and ISGylation have been reported to affect the function of BECN1 in autophagy [Citation14–Citation22]. Whether any other PTMs of BECN1, in response to autophagy inducers, contribute to the regulation of autophagy remains to be explored.
SUMOylation, in which a small ubiquitin-like modifier (SUMO) is attached to a multitude of proteins, is a lately discovered type of PTMs that affects numerous cellular processes. A few papers recently reported that overexpression of SUMO1 or SUMO E2 enzyme UBE2I/UBC9 accelerates the accumulation of autophagosomes [Citation23–Citation25]. PIK3C3/Vps34, an important component of the BECN1 complex, has been reported to be SUMOylated in MCF-7 cells in response to amino acid starvation, etoposide or doxorubicin treatments, or exposure to heat shock, UV light, or reactive oxygen species (ROS) [Citation26]. Whether BECN1 is modified by SUMOylation under various stresses is not mentioned, and whether SUMO2/3 modification involves in autophagy is unknown.
Our previous study identified the SUMO2/3-specific peptidase SENP3 as an oxidative stress-responsive molecule [Citation27–Citation31]. When analyzed the phenotype of mice with a systemic heterozygous deficiency of Senp3, we found that this enzyme and reversible SUMO2/3 modification might be involved in autophagy. Here, we demonstrated that BECN1 could be SUMO3-conjugated by PIAS3 predominantly at K380 and deconjugated by SENP3. The basal SUMOylation of BECN1 was readily increased upon cellular starvation, which enhanced autophagosome formation by facilitating the BECN1 interaction with the BECN1-PIK3C3 complex components UVRAG, PIK3C3 and ATG14, thus promoting PIK3C3 activity. SENP3 deSUMOylated BECN1, and then weakened BECN1 binding with the complex components and suppressed the PIK3C3 activity. SENP3 accumulated in the cytoplasm upon cellular starvation in a ROS-dependent manner, which enhanced its interaction with BECN1. In addition to identification of SUMOylation as a novel PTM of BECN1, we also elucidated an intrinsic negative regulatory mechanism of autophagy. This previously undescribed fine-tuning negative regulation represents a type of self-control of autophagy to avoid excess digestion, which reinforces the biological significance of autophagy in homeostasis.
Results
Senp3 deficiency in mouse livers leads to an enhanced autophagy at basal and fasting conditions
We investigated the correlation between SENP3 and autophagy in adult mouse livers with a systemic heterozygous deficiency of the Senp3 gene [Citation32]. The major indicators of autophagy were analyzed. Accumulation of lipidated MAP1LC3/LC3 (microtubule-associated protein 1 light chain 3; LC3-II) was more sustained in Senp3± mouse liver homogenates compared with that in the Senp3+/+ counterparts, and when the mice were fasted for 2 d, this difference was similar (). Immunofluorescence staining showed that the LC3 dots were more numerous in Senp3± mouse liver sections compared with those of their Senp3+/+ counterparts, and this difference was remained under fasting conditions (). Additionally, electron microscopy revealed that the numbers of autophagosomes (double-membrane-enclosed vacuoles containing the intact organelles) and the autolysosomes (single-membrane-enclosed vacuoles containing the contents or debris of digestion) were increased in the Senp3± mouse livers compared with those of their counterparts under both normal and fasting conditions (). These results implied a negative correlation between SENP3 and autophagy.
Figure 1. SENP3 inhibits the basal and starvation-induced autophagy in mouse livers. Senp3+/- or senp3 cKO mice were fed or fasted for 48 h. n = 3 for each group. (A) The levels of LC3-II in Senp3+/- and control liver tissues were assessed by IB. Quantification of LC3-II:ACTB levels are shown as the mean±SEM of 3 experiments. ** P < 0.01. (B) The dots of LC3 in liver tissues were visualized by immunofluorescence. The representative images are shown (left). Scale bar: 10 μm. LC3 dots number per cell in 20 cells chosen in random were counted and shown as mean±SEM for each group (right). **P < 0.01. (C) The autophagosome (AP) and autolysosome (AL) structures in liver tissues were examined by transmission EM. The representative images are shown (left). A few AL are pointed out with arrows. Scale bar: 500 nm. The numbers of AP + AL per cell in 20 cells chosen in random were counted and shown as mean±SEM for each group (right). **P < 0.01. (D) The levels of LC3-II in senp3 cKO and control liver tissues were assessed by IB. Quantification of LC3-II:ACTB levels are shown as the mean±SEM of 3 experiments. ** P < 0.01, ***P< 0.001. (E) The AP and AL structures in liver tissues were examined by transmission EM. The representative images are shown (left). Some ALs are pointed out with arrows. Scale bar: 1 μm. The numbers of AP + AL per cell in 20 cells chosen in random were counted and shown as mean±SEM for each group (right). ***P < 0.001.
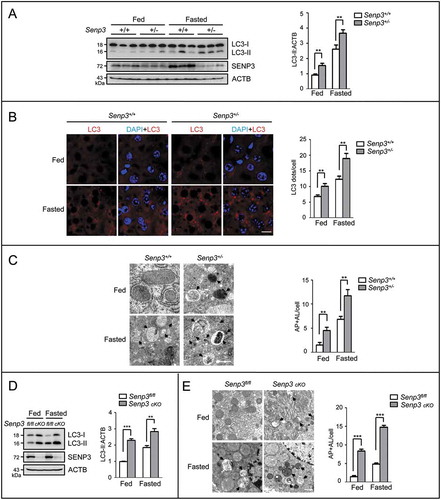
We then generated Senp3flox/flox Alb-Cre mice to make a liver-specific senp3 knockout (conditional knockout, cKO) (Figure S1A). The genotype of these mice was validated (Figure S1B). The basal LC3-II levels in the cKO mouse livers were higher, compared to the Senp3-intact mouse livers. Starvation for 2 d induced LC3-II accumulation, which was more marked in the cKO mouse livers (). Electron microscopy revealed that the numbers of autophagosomes and the autolysosomes were increased in the cKO mouse livers, compared to their wild-type (WT) counterparts under both fed and fasting conditions (). These in vivo data confirmed a negative correlation of SENP3 with autophagy in the liver.
SENP3 inhibits the basal and starvation-induced autophagy in human hepatic and other cell lines
We then examined autophagy in the human hepatic carcinoma cell line HepG2 with stable knockdown of SENP3 (sh-SENP3) or with transient overexpression of SENP3 after cells were starved by culture in EBSS medium that was free of the serum and amino acids [Citation33,Citation34]. SENP3 knockdown resulted in the increase in LC3-II levels, which was more substantial under starvation (, upper panel, left four lanes). The increases in LC3-II can be caused either by increased autophagosome formation or a blockage of autophagosomes fusion with lysosomes, i.e., the maturation of autolysosomes [Citation35,Citation36]. Chloroquine (CQ), which inhibits autophagy by blocking lysosomal acidification, was used to prevent autophagosome digestion, leading to an increase in LC3-II accumulation. While SENP3 knockdown enhanced the LC3-II levels, this augmentation was also clearly seen under CQ treatment condition. Nevertheless, the ratio differences of LC3-II levels between the SENP3 shRNA and the control remained similar under the CQ-absent or -present conditions (, upper), suggesting an increased autophagosome formation, or an accelerated autophagic flux, in SENP3-deficient cells. In contrast, overexpression of SENP3 inhibited the starvation-induced increase in LC3-II levels. Notably, overexpression of the SENP3 mutant C532A, which had no enzymatic activity, did not affect the LC3-II levels (, upper), indicating that the role of SENP3 in suppression of LC3-II accumulation or autophagy flux was dependent on its deSUMOylation activity. In accordance, overexpression of SUMO3 led to a starvation-induced LC3-II increase similar to that caused by SENP3 knockdown (Figure S2A).
Figure 2. SENP3 inhibits the basal and starvation-induced autophagy in human hepatic and other cell lines. (A, B) The levels of LC3-II and SQSTM1 were assessed by IB in HepG2 cells cultured in EBSS for the indicated times. sh-NC, non-specific shRNA. (A) HepG2 cells with stably knocked down SENP3 (sh-SENP3) or sh-NC were starved in the presence or absence of CQ (10 μM) (upper). HepG2 cells with sh-SENP3 or sh-NC were rescued with mock or Flag-SENP3 under starvation (bottom). Quantifications of LC3-II:ACTB and SQSTM1:ACTB levels are shown as the mean±SEM of 2-3 experiments. *P < 0.05.LE, long exposure; SE, short exposure.(B) HepG2 cells transiently transfected with Flag-tagged WT or mutated SENP3C532A were starved in the presence or absence of CQ (10 μM) (upper). HepG2 cells transiently transfected with Flag-tagged WT or mutated SENP3C532A were starved with EBSS for the indicated times (bottom). Quantifications of LC3-II:ACTB and SQSTM1:ACTB levels are shown as the mean ±SEM of 2 experiments. *P < 0.05, **P < 0.01. (C) The dots of LC3 were visualized by immunofluorescence. HepG2 sh-SENP3 or sh-NC cells were starved with EBSS for 1 h. The representative images are shown (left). Scale bar: 10 μm. LC3 dots number per cell in 30 cells chosen in random were counted and shown as mean±SEM (right). **P < 0.01. (D) The AP and AL structures were examined by transmission EM. HepG2 sh-SENP3 or sh-NC cells were starved with EBSS for 1 h. The representative images are shown (left). Some ALs are pointed out with arrows. Scale bar: 500 nm. The numbers of AP + AL per cell in 20 cells chosen in random were counted and shown as mean±SEM (right). *P < 0.05, **P < 0.01. (E) The levels of LC3-II or SQSTM1/p62 were assessed by IB. Liver carcinoma cell line SMMC-7721 and immortalized non-cancer hepatocytes LO2 with stably knocked down SENP3 or sh-NC were starved with EBSS for the indicated times in the presence or absence of CQ (10 μM). Quantifications of LC3-II:ACTB and SQSTM1:ACTB levels are shown as the mean ±SEM of 2-3 experiments. *P < 0.05, **P < 0.01. (F, G) The levels of LC3-II in the presence or absence of CQ (10 μM) and the levels of SQSTM1/p62 were assessed by IB in various cell lines. GFP-SENP3 was overexpressed in MCF-7 and Hep-2 cells. SENP3 was stably knocked down in HeLa and HCT116 cells. Quantifications of LC3-II:ACTB and SQSTM1:ACTB levels are shown as the mean±SEM of 2-3 experiments. *P < 0.05.
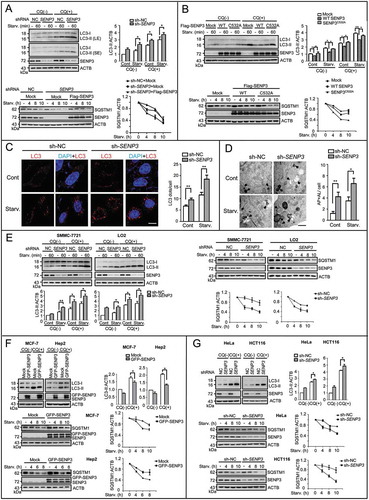
The degradation of SQSTM1/p62 at later time points, which indicates the digestion in autolysosomes, is another marker of acceleration of autophagic flux. We found that the SQSTM1 degradation was potentiated in HepG2 cells with SENP3 knockdown, which could be reversed by adding-back of SENP3 ( bottom). In contrast, the SQSTM1 degradation was blunted in HepG2 cells with the SENP3 wild type, not the inactive mutant overexpression ( bottom). The transcription levels of SQSTM1 were not changed by either knockdown or overexpression of SENP3 in HepG2 cells (Figure S2B).
Other two autophagy markers, the fluorescent LC3 dots and the autophagosomes and autolysosomes observed under EM, were also determined. An increase in dots of both endogenous LC3 () and mCherry-labeled exogenous LC3 (Figure S2C), and an increase in autophagosomes and autolysosomes (AP+AL) () were observed in HepG2 cells with the SENP3 knockdown under both basal and starvation conditions.
To determine the generality of the correlation between the SENP3 level and the level of autophagic flux, we examined the LC3-II and SQSTM1 protein levels in other hepatic and non-hepatic cell lines in the presence or absence of CQ. The liver carcinoma cell line SMMC-7721, QGY-7701 and the immortalized non-cancer hepatocytes LO2 were exposed to EBSS. SENP3 knockdown-induced LC3-II accumulation and SQSTM1 degradation were more significant under starvation, in the presence or absence of CQ treatment ( and S2D). Furthermore, SENP3 was transiently overexpressed in the cells with lower basal levels of SENP3 (MCF-7, Hep2), while it was knocked down in cells with higher basal levels (HeLa and HCT116). The LC3-II and SQSTM1 protein levels were compared between cells with the intact and interfered SENP3 levels. The results confirmed the negative correlation between the SENP3 levels and the autophagic flux (). Although the interference of SENP3 slightly up- or downregulated the basal SQSTM1 protein levels in different cell lines (Figure S2E), normalization of SQSTM1 (over ACTB) to 1 at time 0 for each condition allowed seeing a clear trend difference in SQSTM1 degradation speed, which indicated that SENP3 inhibited SQSTM1 degradation (as shown in []).Collectively, these data showed that SENP3 played a suppressive role in autophagy in vivo and in vitro.
SENP3 impairs the activity of PIK3C3 and the formation or stability of the BECN1-PIK3C3 complex
Because SENP3 slowed down the autophagic flux by interfering with autophagosome formation rather than blocking lysosomal activity, we next determined the targets of SENP3 in autophagosome formation. MTORC1 is an upstream complex in autophagy [Citation37–Citation39]. We examined the activity of MTOR signaling and found no significant difference between the control and SENP3 overexpression cells (), which excluded the MTOR complex or its upstream molecules as targets of SENP3.
Figure 3. SENP3 impairs the activity of PIK3C3 and the formation of BECN1-PIK3C3 complex. (A) The levels of phos-EIF4EBP1 and phos-RPS6KB1 were assessed by IB. HepG2 cells transiently transfected with mock DNA or GFP-SENP3 were starved with EBSS for the indicated times.Quantifications of phos-EIF4EBP1:EIF4EBP1 (left) and phos-RPS6KB1:RPS6KB1 (right) levels are shown. (B) The PIK3C3 activity was determined by RFP-FYVE dots. HepG2 sh-SENP3 or sh-NC cells were transfected with RFP-FYVE and starved with EBSS for 1 h. The representative images are shown (left). Scale bar: 10 μm. RFP-FYVE dots number per cell in 30 cells chosen in random were counted and shown as mean±SEM (right), *P < 0.05, **P < 0.01. (C) HepG2 sh-SENP3 or sh-NC cells were transfected with Flag-BECN1 for 48 h and starved with EBSS for the indicated times. The interaction of BECN1 with the PIK3C3 complex components was assessed by Flag-IP assay. (D) HepG2 sh-SENP3 or sh-NC cells were transfected with Flag-tagged UVRAG for 48 h and starved with EBSS for the indicated times. The interaction of UVRAG with the PIK3C3 complex components was assessed by Flag-IP assay. (E) The endogenous interaction of BECN1 with the complex components was analyzed by co-IP assay in liver tissues. Liver tissues were derived from Senp3-intact and senp3 cKO mice fed or fasted for 48 h. Liver tissue lysates were immunoprecipitated with anti-BECN1 or anti-UVRAG antibodies respectively.
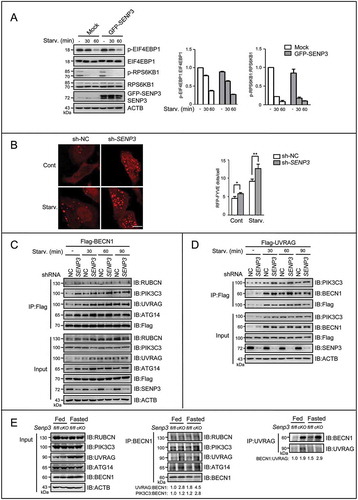
PIK3C3 activity is critical for the production of PtdIns3P, which initiates autophagosome formation downstream of MTORC1 [Citation1,Citation37]. Because PtdIns3P is the preferred ligand of FYVE domains [Citation40,Citation41], the red fluorescence protein-labeled FYVE plasmid (RFP-FYVE) has been used to measure the cellular levels of PtdIns3P and the activity of PIK3C3, as indicated by the number of the RFP-FYVE dots [Citation18,Citation42,Citation43]. We transfected RFP-FYVE in HepG2 cells with sh-SENP3 and quantified the RFP-FYVE dots. The results showed that the RFP-FYVE dots in the sh-SENP3 transfected cells were significantly greater than those in the control cells under both normal and starvation conditions (), suggesting that SENP3 inhibited the production of PtdIns3P.
The PIK3C3 activity is predominantly determined by the BECN1-PIK3C3 complex [Citation15,Citation18,Citation43], in which BECN1 binds to PIK3C3 and other proteins [Citation44–Citation48], and the activity of PIK3C3 is positively regulated by BECN1 [Citation18]. To assess the complex formation or stability in the starved cells with normal and knocked-down SENP3, we overexpressed Flag-tagged BECN1 and performed co-immunoprecipitation (co-IP) assays using an antibody against the tag to co-precipitate the other four major partners of BECN1. We found that along with starvation, the interaction of BECN1 with UVRAG, PIK3C3 and ATG14 was enhanced in the cells with SENP3 knockdown, and the interaction between BECN1 and RUBCN was basically unchanged in these cells (). Because the levels of UVRAG in the lysates slightly varied along with cell starvation and SENP3 knockdown in , we performed a reverse IP using the tagged UVRAG to evaluate the complex formation. In the setting with the identical quantity of UVRAG, the bindings of UVRAG with BECN1 or with PIK3C3 were enhanced in SENP3 knockdown cells (). We further examined BECN1 interaction with the complex components in liver homogenates of the senp3 cKO mice. An increased BECN1 interaction with UVRAG, PIK3C3 and ATG14 was observed in Senp3 deficient livers, but BECN1 interaction with RUBCN was not changed. The reverse co-IP assay using the antibody against UVRAG demonstrated a significantly increased binding of UVRAG with BECN1 in the senp3 cKO samples, compared to the Senp3 WT counterparts (). These in vitro and in vivo data indicated a negative effect of SENP3 on the BECN1-PIK3C3 complex formation or stability.
BECN1 is subject to reversible SUMOylation catalyzed by PIAS3 and SENP3
PIK3C3/Vps34 has been previously reported to be conjugated by SUMO1 but not SUMO2 during panobinostat-induced autophagy in MCF7 cells [Citation26]. We examined SUMOylation of PIK3C3/Vps34 and BECN1 in parallel in an exogenous setting. Human embryonic kidney (HEK) 293T cells were transiently transfected with Flag-tagged BECN1, GFP-tagged PIK3C3, together with RGS-His (RH)-tagged SUMO3. The results of Ni-bead affinity-isolation assays showed RH-SUMO3 conjugated only to BECN1, not PIK3C3; The SUMO3 conjugates included one major band at about 90 kD and two minor bands ranging at 110 ~ 120 kD (Figure S3A). After transfected with SUMO1, SUMO2 or SUMO3, SUMO conjugates were readily detectable in Ni-bead affinity-isolation extracts (Figure S3B). We thus speculated that SENP3 regulation of PIK3C3 activity would not through deSUMOylation of PIK3C3, and BECN1 was the substrate of SENP3.
To identify the endogenous SUMO-related proteins interacting with BECN1, we transiently transfected HEK293T cells with Flag-tagged BECN1 and recovered the co-immunoprecipitates for mass spectrometry analysis. A number of proteins required for SUMOylation, e.g., SUMO3, SUMO E2 ligase UBE2I (UBC9), SUMO E3 ligase RANBP2 and SUMO-specific peptidase SENP3, were among the BECN1-interacting proteins but not SUMO1, SUMO2 or other SENP family members (data not shown). We examined the SUMO3 conjugates on BECN1 after an increasing dose of SUMO3; the Ni-bead affinity-isolation assays showed a marked increase in SUMOylation of BECN1 in a SUMO dose-dependent manner (). These SUMO conjugates were enhanced in the presence of UBE2I (). Overexpression of RANBP2ΔFG, a short version of RANBP2 with the SUMO ligation activity [Citation49], did not increase the SUMO3 conjugation of BECN1 (Figure S3C), which excluded RANBP2 as the SUMO E3 ligase for BECN1. Overexpression of another E3 ligase, PIAS3, amplified the SUMO3 conjugates of BECN1 in a dose-dependent manner ( left), and knockdown of PIAS3 using siRNA, though less effective, reduced the SUMO conjugates of BECN1 ( right). The interactions of BECN1 with PIAS3 were verified under exogenous and endogenous settings ().
Figure 4. BECN1 is subject to the reversible SUMOylation catalyzed by PIAS3 and SENP3. (A-C, E, F and H) The SUMO3 conjugates of BECN1 in HEK293T cells were assessed by Ni-NTA affinity-isolation assay. (A) Cells were transfected with Flag-BECN1 and an increasing dose of RH-SUMO3 for 48 h. (B) Cells were transfected with Flag-BECN1and RH-SUMO3 in the presence or absence of Flag-UBE2I for 48 h. (C) Cells were transfected with Flag-BECN1, RH-SUMO3 and an increasing dose of HA-PIAS3 for 48 h (left). Cells were transiently transfected with si-PIAS3 or si-control for 24 h, and then transfected with Flag-BECN1 and RH-SUMO3 for another 48 h (right). (D) The exogenous or endogenous interaction of PIAS3 and BECN1 was assessed by Flag-IP and co-IP assays. HEK293T cells were transfected with Flag-BECN1 and HA-PIAS3 for 48 h (upper). HepG2 cell lysates were immunoprecipitated with anti-BECN1 and assessed by IB with the indicated antibodies (bottom). (E) Cells were transfected with Flag-BECN1, RH-SUMO3 and an increasing dose of GFP-SENP3 for 48 h (left). Cells were transfected with Flag-BECN1, RH-SUMO3 and GFP-tagged WT SENP3 or mutated SENP3 (C532A) for 48 h (right). (F) Cells were transfected with Flag-BECN1, Flag-UBE2I, RH-SUMO3, HA-PIAS3 and GFP-SENP3 for 48 h. Cell lysates were assessed by IB with a condensed gel. Curly brace indicated conjugated SUMO3. (G) The exogenous or endogenous interaction of BECN1 and SENP3 was assessed by Flag-IP and co-IP assays. HEK293T cells were transfected with Flag-BECN1and GFP-SENP3 for 48 h (upper). HepG2 cell lysates were immunoprecipitated with anti-BECN1and assessed by IB with the indicated antibodies (bottom). (H) Cells were transfected with RH-SUMO3, Flag-tagged WT or mutated BECN1 (K26R and K380R individually).
Moreover, the SUMO3 modification of BECN1 was decreased in the presence of the wild type SENP3 in a SENP3 dose-dependent manner ( left). The catalytically inactive mutant SENP3C532A could not remove SUMO3 modification of BECN1 ( right). To verify that changes in the SUMOylation bands are based on conjugation instead of expression of SUMO, we used a condensed gel to distinguish the high molecular weight conjugates from the free SUMO monomers. It was clear that when co-expressing PIAS3 with UBE2I, SUMO3 and BECN1, the SUMO bands on the pull-down BECN1 and global proteins were increased, and the free SUMO monomers were decreased simultaneously (, 4th lane). In contrast, when co-expressing SENP3, the SUMO bands were decreased in global proteins and even eliminated in the affinity isolation of BECN1, and the free SUMO monomers were increased simultaneously (, 5th lane). The interactions of BECN1 with SENP3 were verified under exogenous and endogenous settings ().
To map the SUMOylation sites on BECN1, we used the SUMOylation prediction software SUMOplotTM, which identified several lysines with a high probability, and we mutated these lysines (K) to arginines (R). Compared to others, K380R resulted in a marked reduction but not complete elimination of BECN1 SUMOylation (). Replacement of most of remaining lysine (except those in the extreme C- and N-termini) with arginine individually did not lead to complete elimination of SUMO conjugates (Figure S3D), indicating that K380 was a major, but not unique, SUMOylation site.
Lysine residues can also be sites for acetylation and ubiquitination, in addition to SUMOylation. To ensure that only SUMOylation, not these two other lysine modifications, was absent on the K380R BECN1, we examined these modifications on the K380R mutant and found that acetylation and ubiquitination were both present (Figure S3E). This K380R mutant was thus used as a SUMOylation-partially deficient BECN1 in the following assays.
These results demonstrated that SUMO3 modification of BECN1 could be reversibly catalyzed by the SUMO E3 ligase PIAS3 and the peptidase SENP3.
SUMOylation/deSUMOylation of BECN1 modulates complex formation/stability and PIK3C3 activity to affect autophagic flux
To elucidate the role of BECN1 SUMOylation in autophagy, we knocked down endogenous BECN1 using a siRNA targeting the 3-untranslated region and then added back wild-type (WT) BECN1 or the mutant BECN1K380R in HepG2 cells. The indicators for autophagic flux were examined. We found that starvation-induced LC3-II accumulation rapidly occurred in WT BECN1 cells but was markedly hindered in the K380R mutant cells. Treatment with CQ enhanced LC3-II accumulation, but the enhancement was limited in the K380R mutant cells ( upper). Starvation-induced SQSTM1 degradation was impaired in the K380R mutant cells ( bottom).
Figure 5. SUMOylation/deSUMOylation of BECN1 modulates complex formation and PIK3C3 activity to affect autophagic flux. (A) The levels of LC3-II and SQSTM1 were assessed by IB in HepG2 cells starved with EBSS for the indicated times. Before starvation, cells were transfected with si-BECN1 (3-untranslated region, 3’UTR) for 24 h, and then added back with Flag-tagged WT, SUMOless mutant BECN1(K380R) respectively for another 48 h in the presence or absence of CQ (10 μM). Quantifications of LC3-II:ACTB and SQSTM1:ACTB levels are shown as the mean ±SEM of 2-3 experiments. *P < 0.05. (B) The mCherry-LC3 dots were measured. BECN1-silenced HepG2 cells were added back with GFP-tagged WT or mutant BECN1 (K380R) and co-transfected with mCherry-LC3 for 48 h. Cells were starved with EBSS for 1 h. The representative images are shown (left). Scale bar: 10 μm. mCherry-LC3 dots number in both mCherry-LC3 and GFP-BECN1 positive cells (n = 20) chosen in random were counted and shown as mean±SEM (right), *P < 0.05, **P < 0.01. (C) The PIK3C3 activity was assessed by RFP-FYVE dots. BECN1-silenced HepG2 cells were added back with GFP-tagged WT BECN1 or mutant BECN1K380R and co-transfected with RFP-FYVE for 48 h. Cells were starved with EBSS for 1 h. The representative images are shown (left). Scale bar: 10 μm. RFP-FYVE dots number in both RFP-FYVE and GFP-BECN1 WT or GFP-BECN1K380R-positive cells (n = 50) chosen in random were counted and shown as mean±SEM (right), ***P < 0.001. (D) The interaction between BECN1 and its binding partners in the BECN1-PIK3C3 complex was assessed by Flag-IP assay. BECN1-silenced HepG2 cells were added back with Flag-tagged WT BECN1 or SUMOless mutant BECN1K380R for 48 h respectively.
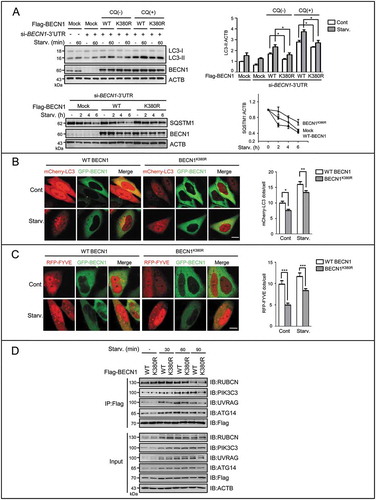
We then examined the LC3-II dots in cells co-transfected with the mCherry-LC3 and GFP-BECN1 WT or the K380R mutant, and further measured the PIK3C3 activity in cells co-transfected with the RFP-FYVE and GFP-BECN1 WT or the K380R mutant. Fluorescence imaging showed that the numbers of LC3 dots as well as FYVE dots were significantly fewer in the cells with the K380R mutant, compared to those in the cells with WT BECN1 (). These comparisons suggested that SUMOylation of BECN1 facilitated the production of PtdIns3P and autophagy.
Because SUMOylation usually modulates protein-protein interactions, we examined the interaction between BECN1 and its binding partners in the complex. Co-IP assays were performed using Flag-tagged WT or mutant BECN1. The SUMO-partially deficient BECN1 mutant K380R obviously weakened the interaction with UVRAG, a positive regulator of autophagosome formation, and impaired the interaction with PIK3C3 and ATG14. Binding of BECN1 with RUBCN was not affected (). These data indicated that SUMOylation of K380 regulated the BECN1-PIK3C3 complex by modulating recruitment of UVRAG and other complex components to BECN1.
As the requirement for UVRAG in BECN1 complex formation is controversial [Citation11,Citation50], we evaluated whether UVRAG affected autophagy in HepG2 cells in the given conditions. We found that the starvation-induced LC3-II accumulation was substantially impeded by UVRAG knockdown in a dose-dependent manner, and even the basal LC3-II levels were suppressed by UVRAG knockdown (Figure S4A). Starvation-induced LC3 dot formation was decreased in cells with UVRAG knockdown (Figure S4B). In addition, starvation-induced SQSTM1 degradation was also hindered by UVRAG knockdown, whereas promoted by overexpression of UVRAG (Figure S4C). These data confirmed that UVRAG was a positive regulator of autophagy in HepG2 cells.
Taken together, these results demonstrated that SUMOylation of BECN1 facilitated the formation or stability of the BECN1-PIK3C3 complex and the activity of PIK3C3, which might explain why the overall autophagic flux was accelerated in cells with knockdown of SENP3.
SENP3 accumulates in the cytoplasm and increases its interaction with BECN1 to enhance deSUMOylation upon starvation
Based on the results described above, we sought to verify whether SENP3 functions as a natural regulator when autophagy occurs. To address this aim, we first determined the temporal and spatial changes of SENP3 in response to starvation stress.
Our previous studies identified SENP3 as a redox-sensitive protein that rapidly accumulated in response to oxidative stress by preventing its ubiquitin-proteasome-mediated degradation [Citation28,Citation30]. We assessed whether the levels of SENP3 or other SENPs increased under starvation. When HepG2 cells experienced starvation, SENP3 and SENP2, but not others, displayed rapid increases in their protein levels (). Measurements of the mRNA levels of SENP3 and SENP2 indicated that the increases in these two proteins upon starvation occurred at the post-transcriptional level (Figure S5A). However, SENP2 was not a regulator of autophagy in the present context because the overexpression of SENP2 did not affect the levels of LC3-II (Figure S5B). In literature, starvation may induce generation of ROS [Citation33,Citation51]. To confirm whether EBSS culture could increase the ROS generation in HepG2 cells, a sensitive genetically encoded fluorescent biosensor for hydrogen peroxide (H2O2), HyPer-3 was used, because the routine ROS-capturing dye could not display the rapid and dynamic changes in short time period in our experiment. After the transfection of the plasmid HyPer-3, the ratio of 488:405 wavelength reported an increase in H2O2 generation for 90 min (). Meanwhile starvation induced the accumulation of the SENP3 protein in HepG2 cells within 90 min, and this time-dependent SENP3 accumulation could be blocked by the antioxidant N-acetyl cysteine (NAC) (), indicating that the starvation-induced SENP3 accumulation was ROS-dependent.
Figure 6. SENP3 accumulates in the cytoplasm and increases its interaction with BECN1 to enhance deSUMOylation upon starvation. (A) The expression levels of SENP family were assessed by IB. HepG2 cells were starved with EBSS for the indicated times. (B) The level of H2O2 was detected by HyPer-3 biosensor. HepG2 cells transiently transfected with HyPer-3 biosensor was starved with EBSS for the indicated times. Live-cell imaging of HyPer-3 biosensor was performed within the indicated times. Representative pseudo-color images are shown (left). Purple represented the lowest 488:405 nm ratio, and the red represented the highest ratio. Scale bar: 50 μm. The ROS change over time in the representative cell is shown (right). (C) The level of SENP3 was assessed by IB. HepG2 cells were starved with EBSS for the indicated times in the presence or absence of 10 mM NAC preincubation for 12 h. Quantifications of SENP3:ACTB levels are shown as the mean±SEM of 2 experiments. *P < 0.05, ***P < 0.001. (D) The levels of nuclear (Nu) and cytoplasmic (Cyto) fractions of SENP3 were assessed by IB. HepG2 cells starved with EBSS for the indicated time. PARP1 and TUBA were taken as the internal controls for nucleus and cytoplasm. (E) The cytoplasmic level of endogenous SENP3 was visualized by immunofluorescence following a modest permeabilization. HepG2 cells were starved with EBSS for the indicated times. Scale bar: 5 μm. (F) The interaction of BECN1 with endogenous SENP3 or PIAS3 was determined by FRET analysis in HepG2 cells transfected with GFP-tagged BECN1 starved with EBSS for the indicated times after SENP3 or PIAS3 immunofluorescence. Scale bar: 10 μm. N-FRET values in 10 cells are shown. **P < 0.01, ***P < 0.001. (G) The dynamic interaction of PIAS3 or SENP3 and BECN1 was assessed by Flag-IP assay. HepG2 cells transfected with Flag-BECN1 were starved with EBSS for the indicated times. (H) The endogenous SUMO2/3 conjugates of BECN1 were assessed by co-IP assay in liver tissues derived from Senp3-intact and -cKO mice fed or fasted for 48 h. Liver tissue lysates (identical to those used for the co-IP in Figure 3(E)) were immunoprecipitated with anti-BECN1 and assessed by IB with the indicated antibodies.
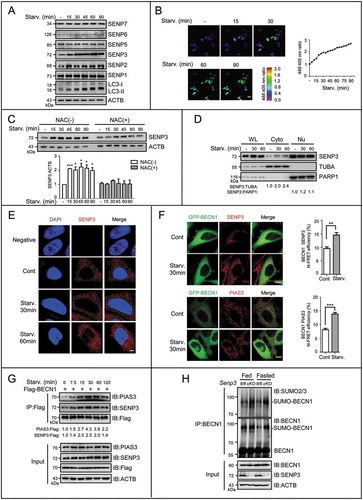
SENP3 is a nucleolar protein and is preferentially located in the nuclear compartments [Citation28,Citation29,Citation52], but a recent study revealed that it might also function in the cytoplasm [Citation53]. To verify the cytoplasmic increase of SENP3, we performed nuclear and cytoplasmic fractionation and found that the cytoplasmic SENP3 was notably accumulated upon starvation stress (). To visualize the cytoplasmic SENP3 that was at low levels, and to avoid simultaneous staining of the highly abundant nuclear SENP3, digitonin was used to permeabilize the plasma membranes but not the nuclear membranes [Citation53]. The results of immunostaining for endogenous SENP3 showed that the cytoplasmic SENP3 was detectable and increased upon starvation (), although the nuclear SENP3 was predominant under routine permeabilization (Figure S6A).
We then asked how BECN1 SUMOylation was modulated through changes in the interaction with both of SENP3 and PIAS3. Like SENP3, PIAS3 was predominantly a nuclear protein, but had the cytoplasmic fraction that could be visualized by immunostaining following digitonin permeabilization (Figure S6B) and detected by immunoblotting (Figure S6C). Fluorescence resonance energy transfer (FRET) assays showed that BECN1 colocalized with the cytoplasmic SENP3 and the cytoplasmic PIAS3; its interaction with both enzymes was potentiated along with starvation (). After pulling down the Flag-tagged BECN1 with equal quantities of antibody against Flag, the endogenous SENP3 and PIAS3 were examined in the co-immunoprecipitates during the starvation time course. Modest interactions of BECN1 with both SENP3 and PIAS3 were observed before the starvation stress, but the binding of SENP3 with BECN1 was gradually increased with starvation, along with the accumulation of total SENP3 (, Figure S6D). The binding of PIAS3 with BECN1 was also enhanced upon starvation, although its total levels remained stable (). Finally, the endogenous SUMOylation of BECN1 was examined in the liver tissues of Senp3 WT and cKO mice by co-IP assay using the antibody against BECN1 (the same lysates used for , therefore the same input proteins). It is noticed that the band pattern of endogenous SUMO conjugates in the tissue differed with exogenous one, such as in ; the SUMO conjugates of BECN1 in vivo were seen as one band at about 90 kD. Compared to the WT mouse liver tissue, the liver of senp3 cKO mice had more abundant SUMO2/3 conjugates on BECN1 under normal condition and had a further increase upon starvation for 2 d (). Collectively, these results indicated a suppressive role of SENP3 preset in the induction of autophagy.
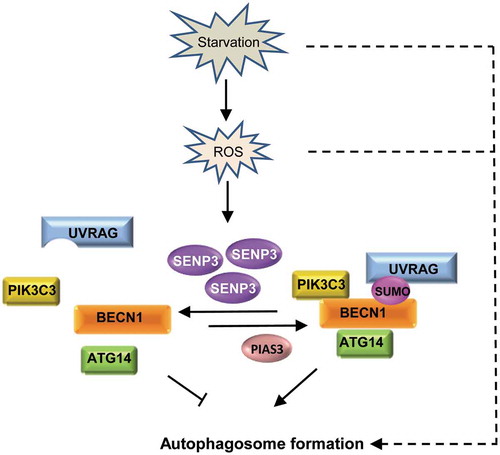
Taken together, we concluded that BECN1 underwent reversible SUMOylation during autophagy, which was catalyzed by SUMO E3 ligase PIAS3 and SUMO2/3 specific peptidase SENP3. SENP3 was a negative regulator that could fine-tune autophagy, which not only allowed for self-control in the basal condition but also autonomously strengthened its role as an overflow brake upon the onset of stress along with the increase of ROS ().
Figure 7. A working model for BECN1 SUMOylation and deSUMOylation and role of SENP3 in fine-tuning autophagy. BECN1 undergoes reversible SUMOylation during autophagy, which is catalyzed by SUMO E3 ligase PIAS3 and SUMO2/3 protease SENP3 respectively. Under starvation stress condition, BECN1 SUMOylation is increased, which is important for BECN1 interaction with UVRAG, ATG14, PIK3C3 and the activation of PIK3C3, and thus the autophagosome formation. Meanwhile, starvation can lead to the increase of ROS and the ROS-dependent accumulation of SENP3, which weakens the BECN1 SUMOylation to some extent. This strengthens its role as a brake upon the occurrence of starvation stress to avoid excess autophagy. Dashed lines indicate other regulation on autophagosome formation downstream of starvation and ROS.
Discussion
The balance between SUMOylation and deSUMOylation of BECN1 as a fine-tuning regulator of autophagy
Both addition and removal of the post-translational modifiers are crucial for maintaining normal autophagic flux. However, when phosphorylation, ubiquitination, acetylation and ISGylation are reported to modulate the function of BECN1 in diverse ways [Citation14–Citation22,Citation42], data on the reverse reaction of BECN1 modification is relatively limited [Citation6,Citation17,Citation42].
The involvement of SUMOylation in autophagy control has not been demonstrated until recently, when SUMO1 and SUMO E2 UBE2I were shown to enhance autophagy [Citation23,Citation24]. Our study uncovered a positive correlation between SUMO2/3 modification and autophagy facilitation. BECN1 was conjugated by SUMO2/3 under normal conditions, which ensured basal autophagy. This SUMOylation was potentiated following starvation, which accelerated the autophagic flux. We also identified the SUMO E3 ligase PIAS3, which increased its interaction with BECN1 upon starvation.
As an antagonistic factor, the SUMO2/3-specific protease SENP3 deSUMOylated BECN1 under unstressed condition. The deSUMOylation of BECN1 was enhanced upon starvation, automatically applying a brake to the drastic BECN1 SUMOylation and the consequent excessive autophagy. Therefore, our study delineated the SUMOylation dynamics of conjugation-deconjugation in the induction of autophagy, which was inevitably imposed with a nature of fine-tuning. Indeed, using the knockdown even knockout of SENP3 and overexpression of the SUMO-deficient BECN1 mutant K380R, we showed that SUMOylation and deSUMOylation finely controlled the autophagic flux; two opposing effects of starvation simultaneously worked on it. Neither the presence of SENP3 under basal conditions nor its increase upon starvation could ultimately block the occurrence of autophagy. Thus, an imbalance in this reversible modification might explain the biased autophagy levels in certain physiological or pathological circumstances and might provide a strategy for manipulation of autophagic flux.
It was notable that SENP3 knockdown usually led to a fairly marked enhancement of autophagy, while the enhancement in BECN1-PIK3C3 complex formation and/or stability and PIK3C3 activity was relatively modest. This indicated that SENP3 might affect autophagy through multiple targets; SUMOylation of BECN1 might be one of the variables.
A negative regulator of autophagy at the post-translational level
The normal basal levels of autophagy provide an intracellular quality control for proteins and organelles and thus maintain cellular homeostasis. Similarly, stress-induced autophagy must be limited to a proper extent. An extensive body of recent studies has identified numerous molecules as positive or negative regulators of autophagy [Citation10,Citation44,Citation46–Citation48,Citation54]. However, how cells negatively control autophagy during its occurrence is largely unknown. In particular, as autophagy is usually a fast response to stress, how post-translational mechanisms function to downregulate autophagy under inducing conditions (i.e., to prevent excessive autophagy) is an outstanding question [Citation6]. Very few papers have identified the modifications and their enzymes that act as negative role in autophagy induction [Citation17,Citation42].
The present study identified an intrinsic negative regulatory mechanism allowing autonomous self-control of autophagy in liver tissues and hepatic and other cell types. SENP3, a SUMO2/3 protease, mediated this negative regulatory loop. The contribution of SENP3 could be observed during basal autophagy activity, as the ablation of SENP3 led to increased LC3-II accumulation and PIK3C3 activity. More importantly, cytoplasmic SENP3 was induced upon starvation, accompanying the occurrence of autophagy, but it in turn suppressed autophagic flux. This fact emphasized that SENP3 served as an intrinsic overflow valve.
Our results demonstrated that SENP3 removed BECN1 SUMOylation at K380 and then decreased the recruitment of UVRAG, ATG14 and PIK3C3, thus negatively regulated the BECN1-PIK3C3 complex formation/stability. RUBCN is a negative cofactor within the BECN1-PIK3C3 complex. RUBCN stabilizes BECN1 BARA ß sheet-1 and then blocks membrane docking [Citation55,Citation56], It is noticed that BARA overlaps with the region known as the evolutionarily conserved domain (ECD) [Citation57], where K380 locates. As the K380R mutant BECN1, compared to the wild type, didn’t show the increased binding with RUBCN, deSUMOylated BECN1 could not regain the RUBCN-BECN1 BARA connection. Therefore, SENP3 and RUBCN, though similarly working on the BECN1-ECD to suppress BECN1-PIK3C3 activity, might be through distinct mechanisms: impairing the membrane docking and the formation/stability of the complex, respectively.
A novel player downstream of ROS in autophagy
The induction of cellular autophagy under various stress conditions has been shown to require ROS [Citation33,Citation58–Citation61]. H2O2 and ROS-generating agents can be direct inducers of autophagy [Citation51,Citation62]. The specific types of ROS and the mechanisms underlying ROS regulation of autophagy are open for further investigation. Chen et al. [Citation62] showed that O2− was selectively induced by starvation of glucose, L-glutamine, pyruvate and serum, whereas starvation of amino acids and serum induced O2− and H2O2; the time points for the ROS increases were later than 24 h. In contrast to their findings in HeLa cells, we found a prompt elevation of H2O2 levels, as early as 5 min, in HepG2 cells exposed to amino acid and serum starvation. HyPer-3 biosensors with improved dynamic range allow real-time visualization of H2O2 in single cells and cellular compartments [Citation63]. This biosensor used in our study might sense and report generation of H2O2 with increased sensitivity and specificity, compared with the routine fluorescence dyes.
Several downstream or target molecules critical for ROS-induced autophagy have been identified. The starvation-induced oxidative inactivation of ATG4 through H2O2 promotes lipidation of ATG8, facilitating autophagosome formation [Citation33]. ATM and AMPK are among the essential mediators of autophagy induction by oxidative stress [Citation51,Citation61,Citation64,Citation65]. Our previous studies identified SENP3 as an unique redox-sensitive SUMO protease; we clearly demonstrated that it was rapidly stabilized within the first few minutes of oxidative stress through oxidation of the cysteine residues, which blocked ubiquitin-proteasomal degradation that would otherwise occur under basal conditions [Citation28,Citation30]. The present work thereby demonstrated a dual regulatory role of ROS in autophagy: ROS was required for autophagy initiation; however, SENP3, which was concomitantly induced by ROS during starvation and autophagy occurrence, functioned as a suppressor of autophagic flux, forming an intrinsic negative feedback loop. This type of dual regulation has not been previously reported and might shed light on the major open questions in the field of how ROS and oxidative stress affect autophagy [Citation59]. These findings also added a sophisticated layer to the regulatory mechanism in which the redox modification of SENP3 coupled with the deSUMOylation of an important autophagy molecule.
Interestingly, following the increase in ROS under starvation conditions, SENP3 accumulated in the cytoplasm. SENP3 is abundant in the nucleus but is relatively scarce in the cytoplasm. It is known as a stress molecule that modulates nuclear events, e.g. transcriptional regulation [Citation27–Citation29,Citation31,Citation52]. Very few studies have examined its function in the cytoplasm [Citation53]. The present work underscored the role of stress responder of SENP3 in the cytoplasm.
Materials and methods
Cell culture and treatments
The cell lines HepG2, SMMC-7721, QGY-7701, LO2 and Hep-2 cells were cultured in RPMI 1640 medium (HyClone, SH30809.01) supplemented with 10% fetal bovine serum (GIBCO, 16,000–044). The cell lines MCF7, HEK293T, HEK293FT, HeLa and HCT116 cells were cultured in Dulbecco’s modified Eagle’s medium (HyClone, SH30022.01B) supplemented with 10% fetal bovine serum.
For cells starvation, cells were washed with PBS (GIBCO, 21,300,025) for two times and cultured in Earle’s balanced salts solution (EBSS; GIBCO, 14,155–063) for the indicated time. When needed, the NAC was pre-administered for 12 h before other treatments, and chloroquine diphosphate was pre-administered for 3 h before other treatments.
Antibodies and reagents
Antibodies against LC3B (3868), SENP3 (5591), BECN1/Beclin 1 (3495), SQSTM1 (5114) SUMO2/3 (4971), UVRAG (13,115), ATG14 (5504), RUBCN/rubicon (8465), PIAS3 (4164), PIK3C3 (4263), TUBA/tubulin (2144), PARP1 (9542), EIF4EBP1 (9452), phospho-EIF4EBP1 (9451), phospho-RPS6KB1 (9234), RPS6KB1 (9202) acetylated-lysine (9441) and normal rabbit IgG (2729) were purchased from Cell Signaling Technology. Antibodies against SENP2 (ab124724), HA (ab137838), GFP (ab1218), ubiquitin (ab7254) were obtained from Abcam. Antibodies against SENP6 (sc-100,585) and SENP7 (sc-373,821) were obtained from Santa Cruz Biotechnology. Antibodies against SENP1 (25,349–1-AP) and SENP5 (19,529–1-AP) were obtained from Proteintech. Antibody against RH (34,610) and Ni-NTA Agarose (30,210) were purchased from Qiagen. Antibodies against ACTB/actin (A5441) and Flag (F1804), and reagents polybrene (H9268), NAC (A9165), chloroquine diphosphate (C6628) and digitonin (D141) were ordered from Sigma Aldrich.
Plasmid constructs and mutagenesis
The plasmid Flag-BECN1 was constructed by inserting a BECN1 fragment amplified from GFP-BECN1 into HindIII and KpnI sites in the p3xFLAG-CMV-10 (Sigma Aldrich, E7658) vector. The plasmid Flag-UVRAG was purchased from Transheep Bio-Tech Co.,Ltd (Shanghai, China). The pEGFP-C1-SENP3 and its mutant were constructed as previously described [Citation30].The Flag-BECN1 Lys to Arg mutant construct was generated by site-directed mutagenesis based on the Flag-BECN1 construct using a QuikChange Mutagenesis Kit (Agilent Technologies, 210,518) following described method [Citation30]. The primers for mutagenesis were described in the Supplementary information.
Primers, shRNA and siRNA
The sequences of primers, shRNA and siRNAs are listed in .
Table 1. The primers and siRNA/shRNA sequences used in this study.
siRNA transient transfections were performed using Lipofectamine 2000 (Invitrogen, 11,668,019) according to the manufacturer’s instruction.
Establishment of stable cell lines
To establish the stable cell lines with SENP3 knockdown, shRNA against SENP3 was constructed with the plvx-shRNA system (Clontech, 632,179), and lentivirus packaging plasmids were transiently transfected into HEK293FT cells. After 72 h, the viral supernatants were harvested and filtered with a 0.45-μm filter. The culture medium of cells was added with viral supernatants at a final concentration of 10 μg/ml polybrene (Sigma Aldrich, H9268). Finally, the ZsGreen1-positive cells were sorted on a FACSAria II flow cytometer (BD Biosciences, New Jersey, USA). The primers used in the establishment of stable cell lines are described in .
Mice and liver tissue sampling
The Senp3± and Senp3flox/flox mice were described previously by our group [Citation32]. Alb-Cre mice were bought from Model Animal Research Center of Nanjing University (Nanjing, China). Senp3flox/flox mice were crossed with Alb-Cre mice to generate Senp3flox/+; Alb-Cre progeny, which were then crossed to Senp3flox/flox mice to produce liver-specific Senp3-deficient mice (senp3flox/flox; Alb-Cre). The littermates (Senp3flox/flox) were used as control. All mice were maintained in an environmentally-controlled room (lights on 8:00 to 20:00) and had free access to drinking water. For starvation studies, female mice (8 weeks) were deprived of food for 48 h in clean cages but they received water ad libitum. Experimental mice were killed by cervical dislocation, and the livers were collected immediately, washed in PBS for 3 times. All animal studies were conducted with the approval and guidance of shanghai Jiao Tong University Medical Animal Ethics Committees.
For electron microscopy (EM) observation of livers, the liver tissues were cut into small cubes and then immersed in 2.5% glutaraldehyde for overnight. Fresh liver tissues were frozen, and proteins were lysed in lysis buffer using a Tissue Lyser (Jingxin, Shanghai, China) on ice for 3 min and then quantified using Bradford before immunoblotting or co-immunoprecipitation assays. Parts of liver tissues from the same mice were prepared for immunofluorescence. Briefly, small tissue cubes were fixed in a buffered 4% paraformaldehyde (Sigma Aldrich,16,005) solution for 4 h and immersed in a 30% sucrose solution for cryo-preservation. Tissues were then embedded in Optimal Cutting Temperature (SAKURA, 4583) matrix compound and stored at −20°C before cryo-sectioning.
Immunofluorescence
After fixed with cold 4% paraformaldehyde, the cells or frozen tissue sections were permeabilized with 0.2% Triton X-100 (Cell Signaling Technology, X100) for 5 min at room temperature, blocked with 10% goat serum (Cell Signaling Technology, G9023) for 1 h at room temperature and incubated with primary antibody overnight at 4°C. Immunofluorescent staining was performed and visualized using the ZEISS 710 confocal microscope (Jena, Germany). The cells were counterstained with DAPI.
To visualize the cytoplasmic staining of SENP3 and PIAS3 that were predominantly in the nucleus, a mild permeabilization approach was used according to the literature [Citation53] .Briefly, cells were fixed and permeabilized with digitonin (Sigma Aldrich, D141) to permeabilize the plasma membrane but not the nuclear membrane.
Electron microscopy
Cells or tissues were fixed in 2.5% glutaraldehyde overnight at 4°C. Cell pellets or tissue cubes were then washed twice by phosphate buffer, post-fixed in 1.0% osmium tetroxide in 0.1 M phosphate buffer, pH 7.2 for 2 h at 4°C, before being washed 3 times with double-distilled water and dehydrated through a graded series of ethanol to 100%. Subsequently, they were infiltrated with Epon resin (TedPella, 18,005) in a 1:1 solution of Epon: propylene oxide. The following day, they were placed through a graded series of Epon to 100% for 6 h at 37°C and then embedded in pure Epon overnight at 60°C. Thin sections were cut on a Leica EM UC7 ultramicrotome (Wetzlar, Germany), collected onto formvar-coated grids (Gilder Grids, AG100N), stained with 3% uranyl acetate and lead citrate, and examined in a transmission electron microscope PHILIPS CM-120 (Amsteldam, Holland) at 80 kV.
Immunoblotting (IB)
The methods were as previously described [Citation30]. Cells were lysed in sample solution (12 mM Tris, 0.4% SDS, 144 mM β-Mercaptoethanol, 3% glycerin, 0.1% Bromocresol Blue). Tris (A600194-0500), SDS (A600485) and Bromocresol Blue (BB2230) were obtained from BBI Life Sciences. β-Mercaptoethanol (07604) was obtained from Sigma Aldrich. Denatured proteins were separated on 8, 10 or 12% sodium dodecyl sulfate polyacrylamide gels, and transferred to a polyvinylidene difluoride membrane (Millipore, ISEQ00010). The membrane was incubated in 5% (w:v) BSA (Sangon Biotech, A500023-0025) and the bands were detected with the corresponding primary and secondary antibodies. Visualized images were obtained using ImageQuant TM LAS-4000 mini (GE Healthcare Life Sciences). Antibodies are listed above. Protein mass marker was a mixture of proteins from 10 kDa to 170 kDa (Thermo Fisher Scientific, 26,616).
Co-immunoprecipitation (co-IP)
The routine co-IP was carried out using methods described previously [Citation28]. Briefly, cells or tissues were lysed in RIPA buffer (Thermo Fisher Scientific, 89,900) for 30 min at 4°C, and then centrifuged at 13,800 × g at 4°C for another 30 min. The lysates were incubated with protein A/G-agarose (Pierce, 20,421) for 2 h at 4°C for preclearing. Specific antibodies were incubated overnight at 4°C followed by protein-A/G agarose beads incubation at 4°C for 4 h. The beads were washed 6 times, mixed with loading buffer and examined by IB.
Ni-NTA affinity-isolation assay
The methods were as previously described [Citation32]. HEK293T cells transfected with corresponding plasmids were lysed in a lysis buffer according to the manufacturer’s protocols, Ni2+-NTA agarose resin was then added to the cell lysates and incubated under shaking at 4°C overnight. The resin was washed at room temperature with 4 different washing buffers. After last wash, samples were eluted in elution buffer and examined by IB.
Flag immunoprecipitation assay (co-IP with flag M2 beads)
Transfected cells were lysed in a lysis buffer (50 mM Tris-HCl, pH 7.4, with 150 mM NaCl, 1 mM EDTA and 1%Triton X-100) for 30 min at 4°C, then centrifuged at 13,800 × g at 4°C for another 30 min. Anti-Flag M2 Affinity Gel (Sigma Aldrich, A2220) was added to the cell lysates and incubated overnight at 4°C. After six-time washing, samples were eluted in elution buffer and examined by IB.
Nuclear and cytoplasmic fractionation
The methods were as previously described [Citation31]. The cells were harvested and resuspended in 0.2 ml of buffer A (10 mM HEPES-KOH, pH 7.4, 10 mM KCl, 1.5 mM MgCl2, 0.5 mM EDTA, 0.5 mM EGTA, plus cocktail inhibitor [Roche Group, 04913914001]) for 15 min on ice and flushed through a 23G needle syringe 20 times. They were centrifuged at 1000 × g for 5 min at 4°C, the supernatant was the cytoplasmic fraction and treated with high-speed spin to clear the debris/membranes (18,630 × g, 10 min). And the nuclear pellets were washed in buffer A twice and resuspended in 0.1 ml buffer B (10 mM HEPES-KOH, pH 7.4, 0.42 NaCl, 2.5% [v:v] glycerol, 1.5 mM MgCl2, 0.5 mM EDTA, 0.5 mM EGTA, 1 mM DTT), rotated nuclear fractions at low speed for 30 min at 4°C. At last, the supernatant was the nuclear fraction and treated with high-speed spin to clear the debris (18,630 × g, 10 min).
FRET imaging
HepG2 cells grown on coverslips were transfected with GFP-BECN1 vector for 24 h, and then were prepared for immunofluorescence with primary antibodies against SENP3 or PIAS3 overnight at 4°C followed by Alexa Fluor 546-labelled secondary antibodies (Thermo Fisher Scientific, A21085) at 37°C for 1 h. FRET was performed on Zeiss LSM 710 laser scanning confocal microscope with a Plan Apochromat 63.0×, 1.4 NA oil-immersion, differential interference contrast objective, and a 488-nm argon laser. The approach using ‘normalized FRET (N-FRET) measurement’ was similar to that was previously reported [Citation31]. Three channels of images were recorded as following: donor, 488-nm excitation and 490 ~ 582 nm filter; acceptor, 532-nm excitation and 552 ~ 672 nm filter; FRET, 488-nm excitation and 552 ~ 672 nm filter. Individual donor and acceptor images were analyzed and loaded into the two-positive images and calculated for the final N-FRET images
H2O2 detection by HyPer-3 biosensor
The plasmids of HyPer-3 were used following the method in the literature [Citation63]. Cells were plated on a 35 mm glass-bottom dish and transfected with the plasmid DNA of HyPer-3 for 24 h. Live cell images were acquired every 5 min using the Zeiss 710 laser scanning confocal microscopy system when cells were maintained at 37°C in a humidified atmosphere using a CO2 incubator. Samples were excited with the 488-nm and 405-nm lasers and emission detection was set to 500–550 nm. Image processing was performed by ImageJ software (NIH), and the pixel-by-pixel ratio of the 488-nm excitation image by the 405-nm excitation image of the same cells was used to pseudo-color the images in HSB color space. Simply, the purple (255, 0, 255) represented the lowest 488:405-nm ratio, and the red (255, 0, 0) represented the highest ratio, while the color brightness was proportional to the fluorescent intensities in both channels. A higher ratio of 488:405 indicated a greater level of H2O2.
Statistical analysis
The statistical significance of differences between groups was assessed using the GraphPad Prism 5 software. Differences between individual groups are analyzed using the student’s t-test. A P-value of <0.05 was considered significant.
Supplemental Material
Download Zip (1.7 MB)Acknowledgments
We are deeply indebted to Drs. Junying Yuan (Shanghai institute of Organnic Chemistry, Chinese Academy of Sciences) for the RFP-FYVE plasmid, Mian Wu (University of Science and Technology of China) for GFP-BECN1 plasmid, Xuejun Jiang (Memorial Sloan Kettering Cancer Center) for the mCherry-LC3 plasmid, Jiyan Zhang (Department of Molecular Immunology, Institute of Basic Medical Sciences, China) for the HA-RanBP2ΔFG plasmid. We thank Drs. Qing Zhong (Shanghai Jiao Tong University School of Medicine), Wei Liu (Zhejiang University School of Medicine)and Xuejun Jiang for their helps in comments and reagents. The work was supported by grants from the National Natural Science Foundation of China (31230037, 31471263, 31771522), Shanghai Municipal Science and Technology Commission (11DZ2260200, 16ZR1418400), Innovative Research Team of High-level Local Universities in Shanghai and Shanghai Charity Race for Cancer Research 2016.
Disclosure statement
No potential conflict of interest was reported by the authors.
Supplementary material
Supplementary data for this article can be accessed here.
Additional information
Funding
References
- Mizushima N, Komatsu M. Autophagy: renovation of cells and tissues. Cell. 2011;147:728–741.
- Yorimitsu T, Klionsky DJ. Autophagy: molecular machinery for self-eating. Cell Death Differ. 2005;12(Suppl 2):1542–1552.
- Levine B, Klionsky DJ. Development by self-digestion: molecular mechanisms and biological functions of autophagy. Dev Cell. 2004;6:463–477.
- Mizushima N, Levine B, Cuervo AM, et al. Autophagy fights disease through cellular self-digestion. Nature. 2008;451:1069–1075.
- Levine B, Kroemer G. Autophagy in the pathogenesis of disease. Cell. 2008;132:27–42.
- Feng Y, Yao Z, Klionsky DJ. How to control self-digestion: transcriptional, post-transcriptional, and post-translational regulation of autophagy. Trends Cell Biol. 2015;25:354–363.
- Xie Y, Kang R, Sun X, et al. Posttranslational modification of autophagy-related proteins in macroautophagy. Autophagy. 2015;11:28–45.
- McEwan DG, Dikic I. The Three Musketeers of autophagy: phosphorylation, ubiquitylation and acetylation. Trends Cell Biol. 2011;21:195–201.
- Wani WY, Boyer-Guittaut M, Dodson M, et al. Regulation of autophagy by protein post-translational modification. Lab Invest. 2015;95:14–25.
- Liang C, Feng P, Ku B, et al. Autophagic and tumour suppressor activity of a novel Beclin1-binding protein UVRAG. Nat Cell Biol. 2006;8:688–699.
- Kang R, Zeh HJ, Lotze MT, et al. The Beclin 1 network regulates autophagy and apoptosis. Cell Death Differ. 2011;18:571–580.
- Backer JM. The regulation and function of class III PI3Ks: novel roles for Vps34. Biochem J. 2008;410:1–17.
- Wirawan E, Lippens S, Vanden Berghe T, et al. Beclin1: a role in membrane dynamics and beyond. Autophagy. 2012;8:6–17.
- Platta HW, Abrahamsen H, Thoresen SB, et al. Nedd4-dependent lysine-11-linked polyubiquitination of the tumour suppressor Beclin 1. Biochem J. 2012;441:399–406.
- Wei Y, Zou Z, Becker N, et al. EGFR-mediated Beclin 1 phosphorylation in autophagy suppression, tumor progression, and tumor chemoresistance. Cell. 2013;154:1269–1284.
- Gurkar AU, Chu K, Raj L, et al. Identification of ROCK1 kinase as a critical regulator of Beclin1-mediated autophagy during metabolic stress. Nat Commun. 2013;4:2189.
- Shi CS, Kehrl JH. TRAF6 and A20 regulate lysine 63-linked ubiquitination of Beclin-1 to control TLR4-induced autophagy. Sci Signal. 2010;3:ra42.
- Russell RC, Tian Y, Yuan H, et al. ULK1 induces autophagy by phosphorylating Beclin-1 and activating VPS34 lipid kinase. Nat Cell Biol. 2013;15:741–750.
- Zalckvar E, Berissi H, Mizrachy L, et al. DAP-kinase-mediated phosphorylation on the BH3 domain of beclin 1 promotes dissociation of beclin 1 from Bcl-XL and induction of autophagy. EMBO Rep. 2009;10:285–292.
- Sun T, Li X, Zhang P, et al. Acetylation of Beclin 1 inhibits autophagosome maturation and promotes tumour growth. Nat Commun. 2015;6:7215.
- Xia P, Wang S, Du Y, et al. WASH inhibits autophagy through suppression of Beclin 1 ubiquitination. Embo J. 2013;32:2685–2696.
- Wang RC, Wei Y, An Z, et al. Akt-mediated regulation of autophagy and tumorigenesis through Beclin 1 phosphorylation. Science. 2012;338:956–959.
- Cho SJ, Yun SM, Jo C, et al. SUMO1 promotes Abeta production via the modulation of autophagy. Autophagy. 2015;11:100–112.
- Gupta MK, McLendon PM, Gulick J, et al. UBC9-mediated sumoylation favorably impacts cardiac function in compromised hearts. Circ Res. 2016;118:1894–1905.
- Gupta MK, Robbins J. Making the connections: autophagy and post-translational modifications in cardiomyocytes. Autophagy. 2016;12:2252–2253.
- Yang Y, Fiskus W, Yong B, et al. Acetylated hsp70 and KAP1-mediated Vps34 SUMOylation is required for autophagosome creation in autophagy. PNAS. 2013;110:6841–6846.
- Han Y, Huang C, Sun X, et al. SENP3-mediated de-conjugation of SUMO2/3 from promyelocytic leukemia is correlated with accelerated cell proliferation under mild oxidative stress. J Biol Chem. 2010;285:12906–12915.
- Huang C, Han Y, Wang Y, et al. SENP3 is responsible for HIF-1 transactivation under mild oxidative stress via p300 de-SUMOylation. Embo J. 2009;28:2748–2762.
- Ren YH, Liu KJ, Wang M, et al. De-SUMOylation of FOXC2 by SENP3 promotes the epithelial-mesenchymal transition in gastric cancer cells. Oncotarget. 2014;5:7093–7104.
- Yan S, Sun X, Xiang B, et al. Redox regulation of the stability of the SUMO protease SENP3 via interactions with CHIP and Hsp90. Embo J. 2010;29:3773–3786.
- Zhou Z, Wang M, Li J, et al. SUMOylation and SENP3 regulate STAT3 activation in head and neck cancer. Oncogene. 2016;35:5826–5838.
- Lao Y, Yang K, Wang Z, et al. DeSUMOylation of MKK7 kinase by the SUMO2/3 protease SENP3 potentiates lipopolysaccharide-induced inflammatory signaling in macrophages. J Biol Chem. 2018;293:3965–3980.
- Scherz-Shouval R, Shvets E, Fass E, et al. Reactive oxygen species are essential for autophagy and specifically regulate the activity of Atg4. Embo J. 2007;26:1749–1760.
- Ng S, Wu Y-T, Chen B, et al. Impaired autophagy due to constitutive mTOR activation sensitizes TSC2-null cells to cell death under stress. Autophagy. 2011;7:1173–1186.
- Klionsky DJ, Abdelmohsen K, Abe A, et al. Guidelines for the use and interpretation of assays for monitoring autophagy (3rd edition). Autophagy. 2016;12:1–222.
- Mizushima N, Yoshimori T. How to interpret LC3 immunoblotting. Autophagy. 2007;3:542–545.
- Dunlop EA, Tee AR mTOR and autophagy: a dynamic relationship governed by nutrients and energy. Semin Cell Dev Biol. 2014;36:121–129.
- Kim YC, Guan KL. mTOR: a pharmacologic target for autophagy regulation. J Clin Invest. 2015;125:25–32.
- Wirawan E, Vanden Berghe T, Lippens S, et al. Autophagy: for better or for worse. Cell Res. 2012;22:43–61.
- Kutateladze TG, Ogburn KD, Watson WT, et al. Phosphatidylinositol 3-phosphate recognition by the FYVE domain. Mol Cell. 1999;3:805–811.
- Stenmark H, Aasland R, Driscoll PC. The phosphatidylinositol 3-phosphate-binding FYVE finger. FEBS Lett. 2002;513:77–84.
- Xu D, Zhang T, Xiao J, et al. Modification of BECN1 by ISG15 plays a crucial role in autophagy regulation by type I IFN/interferon. Autophagy. 2015;11:617–628.
- Furuya T, Kim M, Lipinski M, et al. Negative regulation of Vps34 by Cdk mediated phosphorylation. Mol Cell. 2010;38:500–511.
- Matsunaga K, Saitoh T, Tabata K, et al. Two Beclin 1-binding proteins, Atg14L and Rubicon, reciprocally regulate autophagy at different stages. Nat Cell Biol. 2009;11:385–396.
- Zhong Y, Wang QJ, Li X, et al. Distinct regulation of autophagic activity by Atg14L and Rubicon associated with Beclin 1-phosphatidylinositol-3-kinase complex. Nat Cell Biol. 2009;11:468–476.
- Takahashi Y, Coppola D, Matsushita N, et al. Bif-1 interacts with Beclin 1 through UVRAG and regulates autophagy and tumorigenesis. Nat Cell Biol. 2007;9:1142–1151.
- Di Bartolomeo S, Corazzari M, Nazio F, et al. The dynamic interaction of AMBRA1 with the dynein motor complex regulates mammalian autophagy. J Cell Biol. 2010;191:155–168.
- Sun Q, Fan W, Chen K, et al. Identification of Barkor as a mammalian autophagy-specific factor for Beclin 1 and class III phosphatidylinositol 3-kinase. PNAS. 2008;105:19211–19216.
- Zhu T, Wang J, Pei Y, et al. Neddylation controls basal MKK7 kinase activity in breast cancer cells. Oncogene. 2016;35:2624–2633.
- Knaevelsrud H, Ahlquist T, Merok MA, et al. UVRAG mutations associated with microsatellite unstable colon cancer do not affect autophagy. Autophagy. 2010;6:863–870.
- Li L, Chen Y, Gibson SB. Starvation-induced autophagy is regulated by mitochondrial reactive oxygen species leading to AMPK activation. Cell Signal. 2013;25:50–65.
- Wang M, Sang J, Ren Y, et al. SENP3 regulates the global protein turnover and the Sp1 level via antagonizing SUMO2/3-targeted ubiquitination and degradation. Protein Cell. 2016;7:63–77.
- Guo C, Hildick KL, Luo J, et al. SENP3-mediated deSUMOylation of dynamin-related protein 1 promotes cell death following ischaemia. Embo J. 2013;32:1514–1528.
- Pattingre S, Tassa A, Qu X, et al. Bcl-2 antiapoptotic proteins inhibit Beclin 1-dependent autophagy. Cell. 2005;122:927–939.
- Chang C, Young LN, Morris KL, et al. Bidirectional control of autophagy by BECN1 BARA domain dynamics. Mol Cell. 2019;73:339–53 e6.
- Klionsky DJ, Hurley JH. Self-eating with your fingers. Cell Res. 2012;22:783–785.
- Huang W, Choi W, Hu W, et al. Crystal structure and biochemical analyses reveal Beclin 1 as a novel membrane binding protein. Cell Res. 2012;22:473–489.
- Azad MB, Chen Y, Gibson SB. Regulation of autophagy by reactive oxygen species (ROS): implications for cancer progression and treatment. Antioxid Redox Signal. 2009;11:777–790.
- Filomeni G, De Zio D, Cecconi F. Oxidative stress and autophagy: the clash between damage and metabolic needs. Cell Death Differ. 2015;22:377–388.
- Kim HW, Lin A, Guldberg RE, et al. Essential role of extracellular SOD in reparative neovascularization induced by hindlimb ischemia. Circ Res. 2007;101:409–419.
- Scherz-Shouval R, Elazar Z. Regulation of autophagy by ROS: physiology and pathology. Trends Biochem Sci. 2011;36:30–38.
- Chen Y, Azad MB, Gibson SB. Superoxide is the major reactive oxygen species regulating autophagy. Cell Death Differ. 2009;16:1040–1052.
- Bilan DS, Pase L, Joosen L, et al. HyPer-3: a genetically encoded H(2)O(2) probe with improved performance for ratiometric and fluorescence lifetime imaging. ACS Chem Biol. 2013;8:535–542.
- Alexander A, Cai SL, Kim J, et al. ATM signals to TSC2 in the cytoplasm to regulate mTORC1 in response to ROS. PNAS. 2010;107:4153–4158.
- Zhang J, Tripathi DN, Jing J, et al. ATM functions at the peroxisome to induce pexophagy in response to ROS. Nat Cell Biol. 2015;17:1259–1269.