
ABSTRACT
The trabecular meshwork (TM) is a key regulatory tissue of intraocular pressure (IOP) in the anterior chamber of eye. Dysfunction of the TM causes resistance to outflow of aqueous humor, which in turn leads to elevated IOP, a main risk factor of glaucomatous neurodegeneration. Due to variations in IOP, TM cells are continuously exposed to mechanical deformations. We previously reported activation of macroautophagy/autophagy, as one of the physiological responses elicited in TM cells following mechanical strain application. By using biochemical fractionation analysis and imaging techniques, we demonstrate here for the first time the nuclear accumulation of the autophagic marker MAP1LC3/LC3 (microtubule associated protein1 light chain 3)-II, endogenous and exogenously added (AdGFP-LC3, AdtfLC3), in response to cyclic mechanical stress (CMS). Wheat germ agglutinin (WGA) and leptomycin B treatment suggest LC3 to enter the nucleus by passive diffusion, but to exit in an XPO1/CRM1 (exportin 1)-dependent manner in human TM (hTM) cells. While blockage of nuclear export leads to accumulation of LC3 with promyelocytic leukemia (PML) bodies, nuclear LC3 localizes in the nucleolus in cells under CMS. Moreover, nuclear LC3 co-immunoprecipitated with NUFIP1, a ribosome receptor for starvation-induced ribophagy. More interestingly, we further demonstrate that NUFIP1 translocates from the nucleus to LAMP2 (lysosomal associated membrane protein 2)-positive organelles in the stretched cells without triggering ribophagy, suggesting a more general role of NUFIP1 as a selective autophagy receptor for another yet-to-be-identified target in CMS and a surveillance role of nuclear LC3 against stretch-induced damage.
Abbreviation
AdGFP: adenovirus encoding GFP; ATG: autophagy-related; BSA: bovine serum albumin; CMS: cyclic mechanical stretch; Co-IP: coimmunoprecipitation; DAPI: 4′,6-diamidino-2-phenylindole; DFCs: dense fibrillar components; EM: electron microscopy; FCs: fibrillar centers; GCs: granular components; GFP: green fluorescent protein; hTM: human trabecular meshwork; HBSS: Hanks balanced salt solution; IOP: intraocular pressure; LAMP1/2: lysosomal associated membrane protein 1/2; LepB: leptomycin B; MTOR: mechanistic target of rapamacyin kinase; NES: nuclear export signals; MAP1LC3/LC3: microtubule associated protein 1 light chain 3; NLS: nuclear localization signal; NPCs: nuclear pore complexes; NUFIP1: nuclear FMR1 interacting protein 1; NS: non-stretched; PBS: phosphate-buffered saline; PE: phosphatidylethanolamine; pfu: plaque-forming units; PML: promyelocytic leukemia; RFP: red fluorescent protein; RPS15A: ribosomal protein S15a; RPL26: ribosomal protein L26; rRNA: ribosomal RNA; SIRT1: sirtuin 1; SQSTM1/p62: sequestosome 1; tfLC3: mRFP-GFP tandem fluorescent-tagged LC3; TM: trabecular meshwork; WB: western blot; WDR36: WD repeat domain 36; WGA: wheat germ agglutinin; XPO1/CRM1: exportin 1.
Introduction
The trabecular meshwork (TM) is a key regulatory tissue of intraocular pressure (IOP) in the anterior chamber of eye. Dysfunction of the TM causes resistance to outflow of aqueous humor, which in turn leads to elevated IOP, a main risk factor of glaucomatous neurodegeneration [Citation1]. TM cells are continuously exposed to mechanical strain and undergo morphological deformations due to the variations in IOP with changing pressure gradients and fluid movement [Citation2]. We and other labs have shown that TM cells sense and respond to mechanical strain. In this light, a variety of mechanical stress-induced responses have been reported [Citation3–Citation17]. Among these, we recently showed the activation of autophagy in primary cultures of TM cells following application of biaxial static stretch [Citation18] and cyclic mechanical stretch (CMS) [Citation19], suggesting activation of autophagy as part of a physiological response to adapt to the mechanical forces and maintain cellular homeostasis. However, the exact role of stretch-induced autophagy has not yet been elucidated.
Autophagy is a degradative process by which abnormal cellular components, such as protein aggregates and damaged organelles, are encapsulated within double-membrane structures called autophagosomes, that fuse with lysosomes forming autolysosomes where cargo is degraded [Citation20–Citation22]. More than 30 autophagy-related (ATG) genes are involved in every step of this process [Citation21]. Among them, MAP1LC3/LC3 (microtubule associated protein1 light chain 3), a mammalian homolog of yeast Atg8, is considered a key regulator of autophagy participating in several steps, including the growth of autophagic membranes, recognition of autophagic cargoes, and the fusion of autophagosomes with lysosomes [Citation23–Citation25]. LC3 is synthesized as a precursor form that is cleaved by the protease ATG4B, resulting in the cytosolic isoform LC3-I. In turn, LC3-I is conjugated to phosphatidylethanolamine (PE) to form LC3-II upon autophagy induction [Citation26–Citation28]. LC3-II binds to the autophagosome membrane and remains bound to it until degraded in the autolysosomes. LC3-II is an important marker for assessing autophagy activity and the only reliable autophagy marker so far [Citation29].
Generally, LC3 is believed to be located and function in the cytoplasm where the autophagic process occurs. The presence of LC3 in the nuclei has not gone unnoticed among the research community. Karim et al. first reported the presence of LC3-II in the nuclear fraction of rat hepatocytes [Citation30]. Since then, nuclear LC3 has slowly become a focus of attention, in particular during the last two years. Nuclear LC3 has been reported to serve as a reservoir of cytosolic LC3 under starvation conditions [Citation31–Citation33], to facilitate the degradation of nuclear lamina upon oncogenic stress [Citation34], and to play a role in surveillance of nucleolar function [Citation35].
The nucleolus is a non-membranous, subnuclear organelle, found in eukaryotic cells. Nucleoli are the site of ribosomal RNA (rRNA) transcription, pre-rRNA processing and ribosome subunit assembly [Citation36,Citation37]. In addition to its primary role in ribosomal biogenesis, new evidence suggest that the nucleolus play additional roles in RNA transport and modification, ribonucleoprotein maturation, and cell cycle regulation [Citation37–Citation41], as well as serving as a central hub for stress response [Citation42]. The nucleolus is structurally and functionally compartmentalized into three components called fibrillar centers (FCs), dense fibrillar components (DFCs) and granular components (GCs). Nucleolar machineries are distributed in these different components to perform their optimized functions [Citation36,Citation43]. The organization and composition of the nucleolus are altered by different types of cellular stress including mechanical stress, which leads to changes in nucleolar activity [Citation42,Citation44–Citation47]. Indeed, malfunction of nucleolus causes nucleolopathies and has been considered as a pathophysiological mechanism of age-related neurodegenerative diseases including glaucoma [Citation48–Citation52].
In a recent study, LC3 was identified to be associated with nuclear complexes that scan the nucleolus [Citation35]. LC3 has been additionally found to physically interact with TP53INP2/DOR (tumor protein p53 inducible nuclear protein 2), which is localized to the nucleolus and functions as a co-activator in rRNA transcription [Citation53–Citation56]. Moreover, upon starvation, nuclear LC3 has been reported to be deacetylated by SIRT1 (sirtuin 1) and to redistribute together with TP53INP2 to the cytoplasm for initiation of autophagy [Citation31]. Taken together, these data strongly suggest the autophagy-mediated control of nucleolar activity. Nevertheless, it is still unknown whether or how, nuclear LC3 is involved in the quality controls of the nucleolar activity in response to cellular stress, including mechanical stress.
In this study, we investigate the presence and role of CMS-induced nuclear LC3 in TM cells. We report here that LC3 translocates to the nucleus and associates to the nucleolus in response to CMS, where it interacts with the ribophagy receptor NUFIP1.
Results
Cyclic mechanical stress increases nuclear LC3-II levels in human TM (hTM) cells
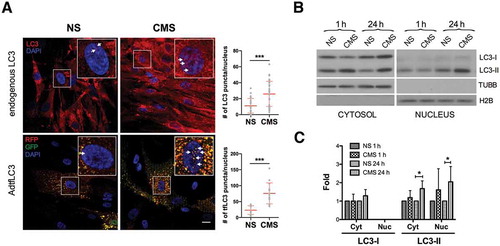
Our previous studies demonstrated the activation of autophagy with mechanical stretch in cultured hTM cells [Citation18,Citation19]. While conducting these studies, we observed an apparent increase in mRFP-GFP tandem fluorescent-tagged LC3 (tfLC3) puncta in the nucleus of stretched cells [Citation18]. We wanted to follow up on this unpublished observation. For this, we examined the presence and number of endogenous and exogenous LC3 puncta in the nucleus of hTM cells subjected to CMS. As seen in , control hTM cells displayed low basal levels of LC3 and tfLC3 puncta-like structures in the nuclear compartment, which increased in number following mechanical stretch application ( and insets). Quantitative analyses revealed an increase of approximately 2.35 and 3.27 folds in the number of puncta-like structures per nucleus of endogenous LC3 (NS vs CMS; 11.00 ± 9.16 vs. 25.93 ± 15.81, p < 0.001, n = 30 vs 29) and tfLC3 (NS vs CMS; 23.15 ± 13.80 vs. 75.79 ± 32.93, p < 0.001, n = 14 vs 13) respectively, with CMS, compared to non-stretched cells (). We additionally evaluated the expression levels of LC3-I and LC3-II by western blot (WB) in purified cytosolic and nuclear fractions of hTM cells subjected to CMS for 1 or 24 h (). As expected, application of mechanical stretch resulted in a quick increase in cytosolic LC3-II in hTM cells. Interestingly, constitutive steady-state LC3-II, but rarely LC3-I, could be observed in the nuclear fraction, the levels of which increased significantly after 24 h of CMS (2.05 ± 0.83 folds, p < 0.05, n = 5, ,C). The absence of cross-contamination between the fractions was confirmed using TUBB/β-tubulin and histone H2B antibodies. To investigate whether this was specific for LC3, we additionally monitored the presence of the autophagy-related proteins ATG5, ATG7 and SQSTM1/p62 (sequestosome 1), as well as that of the lysosomal proteins LAMP1 (lysosomal associated membrane protein 1) and CTSB (cathepsin B), and the late endosomal marker RAB7A in the nuclear fractions. ATG5, ATG7, and SQSTM1 were detected in the nuclear fraction, but their protein levels did not change by CMS. No lysosomal or endosomal proteins were found in the nuclear lysates (Figure S1). Altogether, these results strongly indicate the specific accumulation of LC3-II and LC3 puncta in the nucleus of hTM cells in response to CMS.
Figure 1. Increased nuclear LC3-II levels in hTM cells under CMS. (A) Immunocytochemical analysis of endogenous LC3 (upper panels, red color) or tfLC3 fluorescence (lower panels, RFP and GFP signals) in non-stretched (NS) or stretched (CMS, 8% elongation, 24 h) hTM cells. LC3 puncta in the nucleus are indicated by arrows in each inset. Scale bars: 20 μm. Images were acquired with confocal microscopy from 3 independent experiments with different primary cultured hTM cells, processed and LC3 puncta per nucleus were quantified by using Fiji software. Data are shown as the mean ± S.D. (n = 30 and 29 nuclei number for endogenous LC3, and 14 and 13 for tfLC3 in NS vs CMS, respectively). ***, p < 0.001, (two-tailed unpaired Student’s t-test). (B) Protein expression levels of LC3 in cytosolic and nuclear fractions of hTM cells subjected to CMS for 1 or 24 h, evaluated by WB. Band densities were quantified by Image Lab™ touch software and normalized with TUBB and H2B for cytosolic and nuclear fractions, respectively (C). NS: non-stretch control, CMS: cyclic mechanical stretch. Data are shown as the mean ± S.D. (n = 3). *, p < 0.05, (two-tailed unpaired Student’s t-test).
LC3 accumulates in the nucleus by an XPO1-dependent mechanism in hTM and NIH3T3 cells
Next, we investigated the transport of LC3 into the nucleus. The entry and exit of large molecules from the nucleus is tightly controlled by nuclear pore complexes (NPCs) on the nuclear envelope, which recognize specific nuclear localization and nuclear export signals (NLS and NES, respectively) on the transport proteins [Citation57]. LC3 does not contain any known NLS sequence, although its small size allows it to passively cross through the pores, even when fused to GFP. A putative NES has been identified in the LC3 sequence, but there are conflicting results in the literature regarding its functionality [Citation32,Citation58]. We tested whether the accumulation of LC3 aggregates is regulated by active transport through the NPC. To do this, we first treated hTM cells for 24 h with either leptomycin B (LepB), a specific inhibitor for the XPO1-dependent nuclear export [Citation59,Citation60] or wheat germ agglutinin (WGA), an inhibitor of active nuclear import, and examined the nuclear endogenous LC3 aggregates by using immunostaining. Interestingly, as shown in , LepB treatment resulted in the formation of prominent nuclear LC3 aggregates (herein LC3 dots) greater in size (1.85 ± 0.45 µm in average diameter, n = 50) than the nuclear LC3 puncta observed in CMS-cells (0.53 ± 0.27 µm in average diameter, n = 46; and ). Small nuclear LC3 puncta (0.61 ± 0.20 µm in average diameter, n = 28) were observed in WGA treated cells compared to control cells (, yellow arrow). To confirm that the nuclear LC3 dots in LepB treated-cells were not artifacts from the immunostaining process [Citation61], we monitored LC3 dot formation by live cell imaging. For this, hTM cells were treated with LepB for 24 h after transduction with AdGFP or AdGFP-LC3; GFP fluorescent signals were directly observed under fluorescent microscopy. In agreement with the immunocytochemistry results, LepB treatment led to the accumulation of GFP-LC3 dots in the nuclear compartment. No dots or any form of aggregates were observed in AdGFP-transduced cells in the absence or presence of LepB (, upper panels). We determined the time kinetics for nuclear LC3 dot formation after LepB treatment in AdGFP-LC3-transduced hTM cells using time-lapse imaging, chasing the GFP signal. The nuclear GFP-LC3 dots started to appear after 4.5 h of treatment becoming clearer at 6 h. Dots became larger and crisper as time passed (, lower panels and Video S1).
Figure 2. Nucleocytoplasmic shuttling of LC3 in hTM cells. (A) Representative immunocytochemical analyses of endogenous LC3 in hTM cells subjected to CMS for 24 h in the presence of Lep B (20 nM) or WGA (5 µg/mL). Nuclear LC3 dots resulting from LepB treatment are indicated by white arrows; yellow arrows indicate LC3 puncta formed by CMS. Asterisk indicate perinuclear autophagosome. (B) Time-lapse live cell imaging of AdGFP- or AdGFP-LC3-transduced hTM cells following LepB (20 nM) treatment. Upper panels represent images taken after 24-h treatment. Lower panels showed GFP-LC3 fluorescence chase through the duration of the treatment, using CELENA® S Digital Imaging System. Nucleus is outlined by ellipse with dot line. Each nuclear LC3 dot is indicated by red arrows. (C) Representative image of AdGFP-LC3-transduced cells treated simultaneously with LepB (20 nM) and WGA (5 µg/ml) for 24 h. (D) Time-lapse live cell imaging of GFP-LC3 nuclear dots after LepB removal. GFP-LC3 fluorescent signals were chased for 24 h. Nuclear LC3 dots are indicated by red arrows. (E) Protein levels of LC3-I, LC3-II and SQSTM1 in purified cytosolic and nuclear fractions from hTM cells subjected to CMS (8% elongation, 24 h) in the presence of LepB (20 nM) or WGA (5 µg/mL). Band densities were quantified by Image Lab™ touch software and normalized with H2B for nuclear fractions (F). NS: non-stretch control, CMS: cyclic mechanical stretch. Data are shown as the mean ± S.D. (n = 3). *, p < 0.01; ***, p < 0001, #, p < 0.05 (two-tailed unpaired Student’s t-test). Scale bars: 20 μm. * compares Lep and WGA treatment versus non-treated; # compares CMS versus NS.
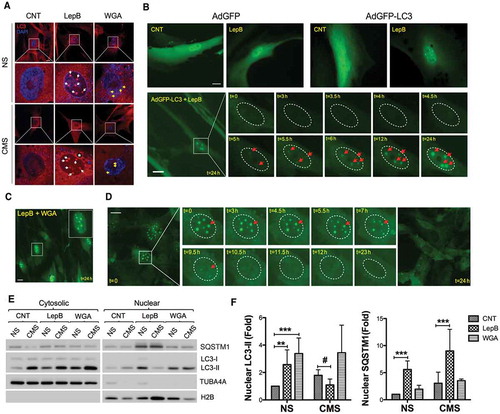
We next tested whether the LepB-induced nuclear LC3 dot formation was affected by WGA treatment. As observed in , formation of GFP-LC3 dots was not prevented by WGA treatment, added simultaneously to LepB, suggesting that the LepB-induced nuclear LC3 dots are independent of WGA-mediated blockage of nuclear import. Finally, we investigated whether nuclear LC3 dot formation in response to LepB was reversible. For this, AdGFP-LC3-transduced hTM cells were treated with LepB to induce nuclear LC3 dots formation. At 72 h, LepB was removed by replacing media with fresh culture medium, and time lapse images were taken to trace the dots. After LepB removal, GFP-LC3 dots were disassembled between 7 ~ 12 h and completely disappeared after 24 h (). Interestingly, GFP-LC3 dots appeared to be exported to the cytosol and fused with cytosolic LC3-positive dots and finally diffused in the cytosol (Video S2 and S3). These results strongly indicate that nuclear LC3 accumulation is regulated by XPO1-dependent nuclear export mechanism in hTM cells. Nuclear accumulation of LC3 with CMS as well as LepB treatment was additionally confirmed in NIH3T3 cells (Figure S2).
Nucleocytoplasmic shuttling of SQSTM1, a cargo receptor for degradation of ubiquitinated targets by autophagy, has been reported to be regulated by NLS and NES. LepB has been shown to induce SQSTM1 accumulation in the nucleus of HeLa cells [Citation62]. To compare the mechanism for nuclear accumulation of both SQSTM1 and LC3, we investigated the SQSTM1 response upon LepB treatment in hTM cells transduced with AdRFP-SQSTM1, carrying SQSTM1 fused with red fluorescent protein (RFP) at the N-terminal (Figure S3). Under control steady-state conditions, SQSTM1 was found to be primarily located in the cytosol. LepB treatment, however, resulted in a quick (within 2 h) redistribution and almost entirely concentration of RFP-SQSTM1 in the nucleus. Moreover, the accumulation pattern of SQSTM1 was different from that of LC3; RFP-SQSTM1 displayed a diffused nuclear distribution without forming any type of aggregates (Figure S3), suggesting that the mechanism by which SQSTM1 is accumulated in the nucleus is different from that of LC3 in hTM cells.
Next, we evaluated the potential effect of CMS in LepB-induced LC3 nuclear accumulation. Interestingly, as seen in and quantified in , CMS prevented LepB-induced nuclear accumulation of endogenous LC3-II, but not that of SQSTM1. Immunofluorescence analysis still revealed formation of LC3 dots in LepB-treated stretched cells; however, we frequently observed redistribution and enrichment of LC3 in the nuclear envelope of these cells, fusing with what seems to appear as autophagosomes in the perinuclear region (, asterisk). Confirming the immunocytochemical studies, blockage of active nuclear import by WGA did not prevent entry of LC3 in the nuclear compartment. Elevated levels of both cytosolic and nuclear LC3-II were observed.
CMS induces autophagosome formation in the cytosol, but not in the nucleus of hTM cells
Lipidation of LC3-I to LC3-II by covalent attachment of a PE moiety triggers the recruitment of LC3-II to the nascent autophagosomal membrane and autophagosome formation [Citation23,Citation26]. Nuclear LC3 puncta have been assumed to be related to autophagosome formation; however, an study by Buckingham et al. argued that the nuclear LC3-positive puncta in stressed cells do not represent autophagosomes, but likely nuclear LC3 aggregates detected by immunofluorescence [Citation61]. The nature of LC3-II was not investigated. To identify whether the CMS-induced nuclear LC3-II accumulation leads to autophagosome formation in the nucleus, we conducted EM analysis. While electron micrographs showed vacuole-like structures, ~500 nm in size in the cytosol of CMS-cells, there was no evidence of autophagic structures in the nucleus of either non-stretched or stretched cells (). These results clearly demonstrate that CMS-induced LC3-II does not lead to autophagosome formation in the nucleus.
Figure 3. Ultrastructural appearance of hTM cells under CMS. Left panels: Representative lower magnification of NS or cells under CMS. Right panel: higher magnification of inset in stretched cells. Note that autophagosomes were not found within nuclei of NS or CMS cells. Nu, nucleus; V, vacuoles; AV, autophagic vacuole; ER, endoplasmic reticulum; M, mitochondria.
Nuclear LC3 localizes in the nucleolus in stretched hTM cells
Next, we investigated whether LC3 is located in the nucleoplasm or, in contrast, associates with a subnuclear organelle. For this, AdGFP-LC3-transduced cells were subjected to either CMS or LepB treatment for 24 h. Colocalization with marker proteins of different subnuclear organelles (COIL/coilin: Cajal bodies; SC35: nuclear speckles; FBL/fibrillarin: nucleolus; PML: promyelocytic leukemia nuclear bodies) was examined by immunocytochemistry. Image analysis showed lack of interaction between CMS-induced LC3 puncta or LepB-induced LC3 dots with either nuclear speckles or Cajal bodies ( and B). Some portion of nuclear GFP-LC3 was found to co-localize with PML bodies under basal conditions mostly due to the diffusion pattern; however, no association between nuclear LC3 puncta induced by CMS and PML bodies was observed (). Interestingly, LepB-induced nuclear LC3 dots were found to interact with PML bodies on their surface area (). Interaction occurred in the initial step of LepB-induced LC3 dot formation, regardless LC3 dot size (Figure S4). Quantitative analysis of fluorescent intensity of each spot revealed that the fluorescent signal overlaps between PML bodies and LepB-induced nuclear LC3 dots, but not in CMS-induced ones ( and E). Most interestingly, a positive localization signal was found between LC3 puncta and the nucleolus marker in the cells subjected to CMS (). Interactive 3D surface plot analysis clearly demonstrates the interaction between FBL and the LC3 aggregates (). No LC3-FBL co-localization was observed in LepB-treated cells (). To confirm that nuclear LC3 interacts with the nucleolus, we performed coimmunoprecipitation (co-IP) analysis using the nuclear fraction of hTM cells expressing GFP or GFP-LC3. As shown in , FBL coimmunoprecipitated with GFP-LC3, but not with GFP control. In addition, the SQSTM1 protein, a well-known interacting partner of LC3, was also detected in the GFP-LC3 immunoprecipitation sample. Taken together, these results strongly indicate the association of nuclear LC3 associates with the nucleolus in response to mechanical stress.
Figure 4. LC3 interacts with PML nuclear bodies in LepB-treated cells, but not with CMS-induced ones. hTM cells were transduced with AdGFP-LC3 (5 pfu/cell) and either exposed to CMS (8% elongation) or LepB (20 nM) treatment for 24 h. Cells were fixed and immunostained with specific antibodies against nuclear speckels (A), Cajal bodies (B) and PML bodies (C). Fluorescent intensity of GFP-LC3 signal (green) and PML (red) in CMS (D) and LepB-treated cells (E) were quantified with Fiji software. DAPI was used to stain nuclei. Scale bars: 20 μm.
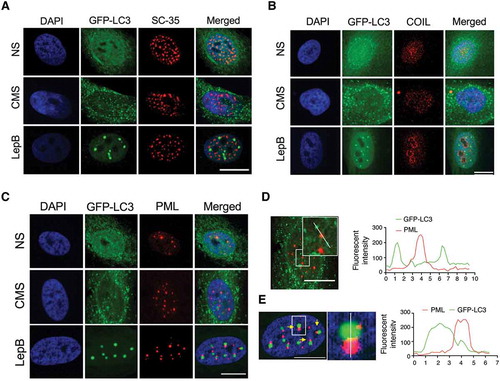
Figure 5. Nuclear LC3 associates with the nucleolus with CMS. (A) Representative immunostaining of the nucleolar marker FBL in AdGFP-LC3-transduced cells exposed for 24 h to CMS (8% elongation) or LepB (20 nM) treatment. DAPI was used to stain nuclei. Scale bars: 20 μm. (B) Interactive 3D surface plot analysis visualizing the interaction between GFP-LC3 and the nucleolus. (C) Co-IP analysis of GFP-LC3 with FBL and SQSTM1 in purified nuclear fractions from hTM cells transduced with AdGFP or AdGFP-LC3. IP was performed using GFP-Trap; co-immunoprecipitated proteins were detected by WB, 5 µg of protein were loaded for input control. (D) Representative EM images depicting nucleolar structure and components in NS and cells under CMS. FC: Fibrillar Center; DFC: dense fibrillar component; GC: granular component. (E) Quantification of nucleolar number in NS and cells under CMS. Nucleoli were detected by immunostaining with FBL antibody (red). Y axis represents percentage of cells containing nucleoi number>4 per nucleus in total cells counted. Data are shown as the mean ± S.D. (n = 375 and 309 in CNT and CMS, respectively), two-tailed unpaired Student’s t-test.
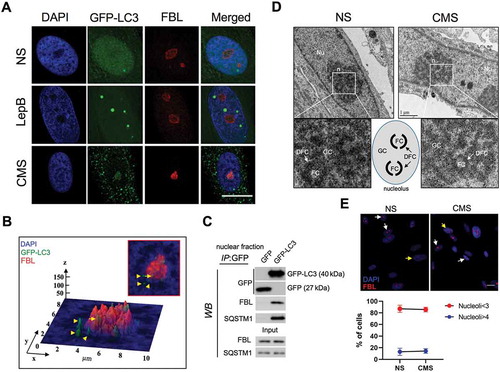
The morphology, size and number of nucleoli are linked to nucleolar activity, which can be affected by cellular stress [Citation42]. We examined whether CMS alters the integrity and/or number of nucleoli. Representative EM images showed three compartments (FC, roundish structures with electron-light fibrillar interior; DFC, electron dense fibrillar stretches, and GC, a large body of granular nature) along with nucleoli ~ 2 µm in diameter in both control and CMS cells, with no apparent changes (). In addition, no significant difference in the percentage of cells harboring an extraordinary number of nucleoli (# of nucleoli > 4 per nucleus) in CMS cells (14.35 ± 3.95%, n = 375) compared to control cells (13.04 ± 6.13%, n = 309) was observed ().
SIRT1 inhibition does not prevent cms-induced autophagy in hTM cells
Deacetylation of nuclear LC3 by SIRT1, a deacetylase found to be enriched in the nucleolus, has been recently reported to drive the initiation of autophagy by enhancing export of nuclear LC3 into cytoplasm under starvation conditions [Citation31]. Therefore, we investigated whether SIRT1 also controls CMS-induced autophagy by regulating the redistribution of LC3 from the nucleus to cytosol. First, we wanted to replicate the studies by Huang et al. in our cell system. In agreement with those studies [Citation31], starvation induced cytosolic redistribution of GFP signal of tfLC3 from nucleus in hTM cells (Video S4). However, treatment with EX527, a SIRT1 specific inhibitor, did not result in the nuclear accumulation of LC3 in hTM cells (, and Video S5). Similarly, we did not observe any effect of EX527 treatment in stretch-induced autophagy ().
Figure 6. SIRT1 inhibition does not prevent CMS-induced autophagy in hTM cells. (A) Live cell imaging of AdtfLC3-transduced cells treated with EX527 (25 µM) for 24 h. Scale bars: 20 μm. (B) Effect of EX527 on CMS-induced autophagy. hTM cells were subjected to CMS for 24 h in the presence or absence of EX527 (25 or 50 µM). The expression levels of LC3 were measured in whole cell lysates by WB. ACTB is used as a loading control. (C) Quantification of LC3 expression in cytosolic and nuclear fractions of hTM cells subjected to CMS for 24 h in the presence or absence of EX527 (50 µM). s.e., short exposure; l.e., long exposure. LC3-I and LC3-II band intensities were normalized by TUBA4A and H2B in cytosolic and nuclear fractions, respectively (D). Data are shown as the mean ± S.D. (n = 3), *, p < 0.05, two-tailed unpaired Student’s t-test. ns: not significant, nd: not detected.
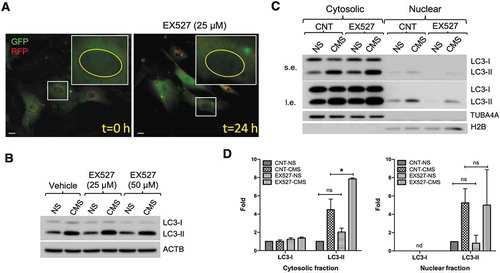
To further analyze SIRT1 effect on the redistribution of LC3 from the nucleus to cytoplasm, we examined the expression levels of LC3 in purified nuclear and cytoplasmic fractions by WB. As shown in , EX527 treatment increased, rather than decreased, LC3-II levels in the cytosol by approximately 2-fold in both non-stretched and stretched cells, compared with their counterpart controls. In addition, LC3-I levels were unchanged. Moreover, no significant changes in nuclear LC3-II were observed with EX527 treatment under any experimental condition (). These results indicate that SIRT1 does not directly control CMS-induced autophagy in hTM cells.
Nuclear LC3 binds to NUFIP1 and triggers nuclear-cytoplasmic shuttling upon CMS
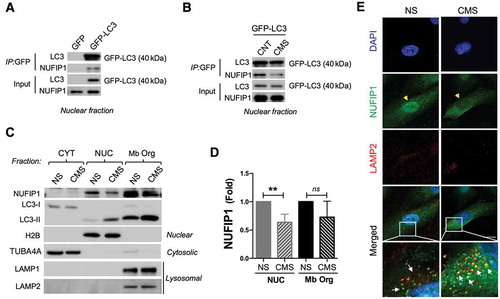
A very recent report by Wyant et al. has identified NUFIP1, a nucleolar nucleocytoplasmic shuttling protein, as a receptor for starvation-induced ribophagy [Citation63], a selective process involving the autophagic degradation of ribosomes [Citation64]. We investigated whether CMS-induced nuclear LC3 puncta is involved in the ribophagy process. First, we tested the interaction of nuclear LC3 with NUFIP1 in non-stretched and stretched hTM cells by WB, using GFP-LC3 immunoprecipitants and GFP immunoprecipitants as controls. As seen in , NUFIP1 specifically coimmunoprecipitated with LC3 in the nuclear fraction. Moreover, the level of co-immunoprecipitated NUFIP1 was significantly reduced in CMS cultures (). We examined by WB the total levels of NUFIP1 in the nuclear, cytosolic, and in the subcellular membrane fraction, which contains autophagosomes and autolysosomes, as confirmed by the presence of LC3-II, LAMP1 and LAMP2, in non-stretched and stretched cultures (). NUFIP1 was localized in the nuclear and in the autophagosomes- and autolysosomes-containing fraction. Interestingly, nuclear NUFP1 content was significantly lower in the stretched cultures compared to non-stretched ones (0.42 ± 0.04 folds, p < 0.05, n = 3; ). We further confirmed by immunocytochemistry the shuttling of NUFP1 from the nucleus to autophagic compartments upon CMS. NUFIP1 immunoreactivity in the nucleus was significantly lower in the stretched cells, as observed in , yellow arrowheads. Moreover, NUFIP1 was found to be co-localizing in the cytosol with the lysosomal marker LAMP2 in these cells (, white arrows).
Figure 7. Nuclear LC3 interacts with the ribophagy receptor NUFIP1 and promotes its nucleocytoplasmic distribution in hTM cells with CMS. Co-IP analysis in nuclear fraction of control cells transduced with (A) AdGFP or AdGFP-LC3 or (B) AdGFP-LC3 expressing cells with or without CMS. IP was performed using GFP-Trap; co-immunoprecipitated proteins were detected by WB, 5 µg of protein were loaded for input control. (C) WB blot analysis of NUFIP1 and LC3 in fractionated cytosolic, nuclear and membrane-bound organelle enriched fractions from NS and hTM cells under CMS. TUBA4A and H2B are used as a loading controls for cytosolic and nuclear fraction, respectively. LAMP1 and LAMP2 were used as markers for membrane-bound organelle enriched fractions containing lysosomes. (D) NUFIP1 band intensity was normalized and fold expression calculated. Data are shown as the mean ± S.D. (n = 3), **, p < 0.01, two-tailed unpaired Student’s t-test. ns: not significant. (E) Representative immunostaining of NUFIP1 (green) and LAMP2 (red) in NS and hTM cells subjected to CMS (8% elongation, 24 h). Yellow arrowheads indicate nuclear NUFIP1 staining; white arrows indicate co-localization of NUFIP1 and LAMP2.
Nuclear-cytoplasmic shuttling of NUFIP1 upon CMS is not associated with ribophagy
Next, we questioned whether nucleo-cytoplasmic translocation and localization of NUFIP1 in the membrane-bound organelle enriched fraction in association with LAMP2 is indicative of stretch-induced ribophagy. For this, we monitored the protein levels of the ribosomal proteins RPL26 and RPS15A in control or autophagy-deficient hTM cells with CMS. Autophagy-deficiency, confirmed by the decrease in LC3-II, was achieved via downregulation of the autophagy genes ATG5 and ATG7 (siATG5,7). Cells cultured for 24 h in Hank’s balanced salt solution (HBSS) served as control for starvation-induced ribophagy. We observed in these cultures lower RPL26 and RPS15A protein levels, as reported in [Citation63] and [Citation64]. In contrast, as seen in , no changes in the protein levels of RPL26 or RPS15A were observed neither in stretched cells nor in autophagy-deficient cells under basal conditions.
Figure 8. CMS does not trigger ribophagy in hTM cells. (A) hTM cells were transfected with siATG5,7 or siNC for 48 h and then subjected to CMS (8% elongation, 24 h). Protein levels of LC3, RPL26 and RPS15A were evaluated by WB. Cells cultured for 24 h in HBSS served as positive control. (B) Band intensities were normalized with ACTB and fold expression calculated. Data are shown as the mean ± S.D. (n = 3), two-tailed unpaired Student’s t-test. ns: not significant.
Discussion
By using biochemical fractionation analysis and imaging techniques, we have demonstrated here for the first time the nuclear accumulation of endogenous and exogenous LC3 in response to CMS and its localization in the nucleolus in association with the ribophagy receptor NUFIP1. We have further demonstrated that NUFIP1 translocates from the nucleus to autolysosomes in the stretched cells in a process independent of ribophagy. This study sums up to the yet small but growing body of literature reporting the presence of the autophagosome marker in the nuclear compartment.
The presence of LC3 in the nucleus was not restricted to stretched cells. Although in lower levels, nuclear LC3 was also detected under steady-state conditions in non-stretch control cells. Treatment with WGA, a blocker of active nuclear transport import, did not affect LC3 nuclear levels, even when conjugated with GFP, suggesting that LC3 enters the nucleus by passive diffusion. This agrees with the lack of any known NLS in LC3 sequence, and its small size. In contrast, WB and time-lapse live imaging very convincingly showed the nuclear accumulation of both endogenous and exogenous LC3 when blocking XPO1-dependent nuclear export via LepB in hTM cultures, which was also confirmed in NIH3T3 cells. LepB-induced LC3 nuclear accumulation was reversible and showed a slower kinetics than that of SQSTM1, another autophagy-related protein whose nucleocytoplasmic shuttling is known to be actively regulated by NLS and NES [Citation62]. LC3 contains a NES putative sequence at amino acid residues 63–73, but mutation of this site or LepB treatment did not cause exclusive nuclear localization in COS-7 cells [Citation32], presumably because the site is hidden in the crystal structure. We are not sure of why there is discrepancy between the studies. Because of the diffuse transport, nucleo-cytoplasmic distribution of LC3 has been proposed to be regulated by protein-protein interactions. In particular, Arg70 seems to play a critical role in association with nuclear complexes [Citation35]. It is plausible these interactions to be cell type-specific and either regulate active transport export through interactions to NES-containing proteins or expose the putative NES in LC3.
Very interestingly, WB analysis showed lower nuclear accumulation of LC3-II with LepB in mechanically stretched cells, although LC3 dots were still detectable by immunofluorescence, likely resulting from the intrinsic non-quantitative nature of immunofluorescence and differences in detergent solubility of the dots, to reliably evaluate LC3 content. The decrease in LC3-II observed by WB did not seem to result from reduced import, since WGA-treatment increased rather than decreased nuclear LC3 with CMS. One potential explanation is that mechanical stress modifies LC3-protein interactions and triggers LC3 nuclear exit. Supporting this, we observed in the stretched cells enrichment of LC3 in defined regions of the nuclear envelope apparently fusing with cytosolic LC3-labeled vacuoles, in a process resembling to nucleophagy. Another explanation is nuclear degradation of LC3 in stretched-LepB-treated cells by proteasomal activity in PML bodies.
LC3-II, which is commonly associated to autophagosomes, was the major form of LC3 found in the nucleus; however, no autophagosomes in the nucleus were observed by EM in the stretched or control cells. LepB caused accumulation of LC3 in larger dots that we identified as PML bodies. PML bodies are dynamic heterogenous protein complexes forming spheres of 0.1–10 μm in diameter found in most cell lines and tissues. PML bodies have been involved in regulating cell stress responses and cell fate decision (apoptosis, senescence, response to DNA damage, gene regulation). Also, PML bodies, in particular a subset of them known as clastosomes, are enriched in components of the ubiquitin proteasome system and have been identified as the center for aberrant protein degradation in the nucleus [Citation65,Citation66]. Interaction of LC3 with PML has been also reported in [Citation67], although in this case, interaction occurs under physiological conditions. Binding of LC3 to PML was dependent of LC3-interacting region motifs in LC3 sequence and seemed to contribute to growth arrest function of PML. It was interesting to note that similar to our findings, nuclear LC3 was mainly in the LC3-II form, which raises the question of whether LC3 enters in its lipidated form or it is lipidated in the nucleus, especially since other autophagy proteins required for LC3 lipidation (ATG5, ATG7) were also detected in the nuclear fractions. Although not investigated here, Martinez-Lopez et al. [Citation68] concluded that LC3 is lipidated de novo in the nucleus. LC3 puncta rather than LC3-II was used as a readout, however. Also, nucleocytoplasmic shuttling of exogenous LC3 was concluded to be independent of its conjugation to PE and of its canonical role of autophagosome formation [Citation31,Citation63].
Regardless of where it is lipidated, one would expect LC3-II to be targeted to and interact with the nuclear lamina. In this regard, Dou et al., have shown that in response to oncogenic stress, nuclear LC3 directly interacts with LMNB1 (lamin B1) and binds to lamin-associated chromatin domains to degrade nuclear lamina by autophagy, thereby inducing cellular senescence [Citation34]. As mentioned earlier, a potential association of nuclear LC3 with the nuclear envelope was observed in the stretched cells in the presence of LepB. However, very intriguingly, nuclear LC3 aggregates induced by CMS were of different nature, smaller in size, and were found to interact with nucleoli and co-immunoprecipitate with the nucleolar protein FBL in hTM cells, suggesting that nuclear LC3 (1) is dynamic, interacting with different subnuclear bodies; and (2) plays a role in different nuclear functions in response to specific types of stress.
Our finding of nucleolar localization of nuclear LC3 is in agreement with a recent study by Kraft et al. also reporting enrichment of exogenously added Venus-LC3 in nucleoli in HeLa cells [Citation35]. Using quantitative fluorescence recovery after photobleaching measurements, the authors determined that under basal conditions, LC3 associates with large slowly diffusing complexes that survey the nucleolus and prevents LC3 for freely diffusing through the nuclear pores. They further identified the triple arginine motif in LC3 sequence essential for nucleolar targeting. The biological significance of this or that of the stretch-induced LC3 nucleolar localization is still to be determined. The nucleolus is a dynamic structure and the site of ribosomal biogenesis. About one third of the nucleolar proteome is involved in rRNA transcription, pre-rRNA processing and ribosome subunit assembly. However, many proteins in the nucleolar proteome have no obvious relationship with this role, consistent with the notion that the nucleolus performs additional roles beyond generating ribosomal subunits, including cell’s response to stress. Mechanical stress has been reported to cause changes in nucleolar redistribution and structure [Citation44–Citation46], including enlargement of the nucleolar structure in retinal ganglion cell’s soma in vivo system [Citation47]. However, we did not observe in the stretched cells any apparent disruption in nucleoli structure and organization, nor in the number of nucleoli per cell. All the three nucleolar subcompartments (FCs, DFCs, and GCs) were distinguishable by EM in stretched and control cells.
In a very elegant work, Huang et al. [Citation31] have proposed nuclear LC3 to act as a reservoir for cytoplasmic LC3. They found that in response to starvation, nuclear LC3 is deacetylated by SIRT1 at Lys49 and Lys51. Deacetylation of LC3 was identified to be crucial for LC3 nuclear export and conjugation/incorporation into the autophagosome membrane. Very interestingly, SIRT1 has been shown to be enriched in the nucleolus. Therefore, although not investigated, it is plausible LC3-SIRT1 interaction and deacetylation to occur in the nucleoli. Our time-lapse imaging analysis corroborated the nucleocytoplasmic shuttling of LC3 coincident with GFP-LC3 puncta formation upon starvation in TM cells. However, inhibition of SIRT1 did not result in the nuclear accumulation of LC3 under basal conditions, nor did it prevent activation of autophagy with CMS, suggesting the existence of alternative mechanisms for stretch-induced autophagy.
A very exciting finding in our study is the interaction of nuclear LC3 with NUFIP1. NUFIP1 is a nucleolar protein very recently identified as a ribophagy receptor for starvation-induced autophagy [Citation63]. Upon MTOR (mechanistic target of rapamycin) inhibition, NUFIP1 translocates from the nucleus to the cytoplasm and, by directly binding to LC3, triggers the transport of ribosomes to autophagic vesicles for autophagic degradation [Citation63]. Our results here clearly indicate that binding of NUFIP1 with LC3 occurs in the nuclear compartment. Indeed, as in the case of LC3-II, we could not detect NUFIP1 in the soluble cytosolic fraction but was exclusively localized either in the nucleus or in the membrane-bound organelle enriched fraction, showing a cytosolic punctate staining by immunofluorescence. Interestingly, both immunofluorescence and immunoblotting techniques showed lower nuclear NUFIP1 levels with CMS. More, NUFIP1 was found in the stretched cells associated with positively stained LAMP2 organelles. Altogether, this data strongly suggests that in response to CMS nuclear LC3 directly targets NUFIP1 from the nucleus to autophagosomes and autolysosomes. Very surprisingly, however, nuclear LC3-NUFIP1 interaction and nucleocytoplasmic shuttling of NUFIP1 in stretched cells was not associated with ribophagy, as quantified by monitoring protein levels of the large and small ribosomal subunit proteins RPL26 and RPS15A, respectively. While a decrease in the amount of these proteins was observed in TM cells under starvation, corroborating the studies by Wyant et al., no significant changes in RPL26 or RPS15A were noted in TM cells under CMS or in TM cells deficient in autophagy. It is possible that NUFIP1-assisted ribophagy might be an exclusive mechanism triggered in response to starvation to promote cell survival, not elicited in other types of stress. In this regard, we shall notice that, in contrast to starvation-induced autophagy, activation of autophagy in response to mechanical stress is thought to be MTOR-independent, and that CMS per se activates MTOR pathway, which might block ribophagy. The fact that NUFIP1 associates with LC3 and translocates from the nucleus to LAMP2-positive organelles with CMS strongly suggests a more general role of NUFIP1 as a selective autophagy receptor for another yet to identify target/s, potentially damaged from mechanical insult (). Supporting this, recent evidences have shown that nuclear LC3 plays a role in surveillance of damaged nuclear components, which subsequently are subjected to degradation by cytosolic autophagic process [Citation31,Citation34,Citation35,Citation69].
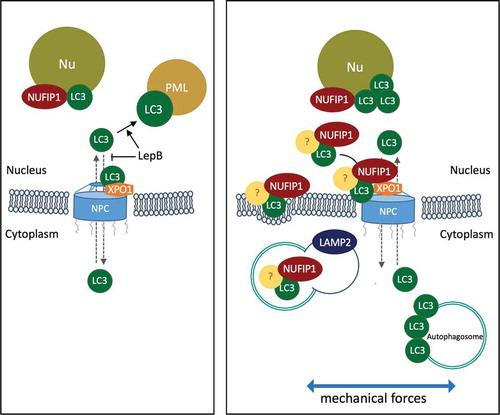
Figure 9. Schematic diagram summarizing the results and working hypothesis. Under non-stretched control conditions, LC3 resides primarily in the cytosol, shuttling in-and-out of the nucleus. LC3 enters the nucleus by passive diffusion and exits in an XPO1-dependent manner. Blockage of active nuclear export by LepB leads to the accumulation of LC3 in the nucleus interacting with PML bodies. Mechanical stress triggers activation of autophagy and nuclear translocation of LC3 to the nucleolus, where it interacts with the autophagy receptor NUFIP1. We propose LC3-NUFIP1 complex to act as a surveillance mechanism that recognizes stretch-induced damaged nuclear proteins and facilitate their export, either via active nuclear transport or nuclear envelope budding, for autophagic degradation in the cytosol.
The physiological significance of our findings within a glaucoma context is currently unknown. Interestingly, several genes linked to glaucoma susceptibility are related to nucleolar activity [Citation70]. The WDR36 (WD-repeat domain 36), a gene encoding 18S rRNA processing protein, found in the IP lysosomal fraction together with NUFIP1 [Citation63], was initially reported as a glaucoma-causing genes [Citation71–Citation73]. Although its role as a causative factor for primary open angle glaucoma is currently controversial [Citation74] since heterozygote WDR36-deficient mice do not develop glaucoma [Citation75], glaucoma patients carrying the WDR36 sequence variant have more severe manifestations of the disease, pointing toward a role of WDR36 as a glaucoma modifier [Citation76]. TMCO1 (transmembrane and coiled-coil domain 1), a nucleolar protein of unknown function with shuttling characteristics between the nucleus and cytoplasm, has also been identified by genome-wide association study to be associated with primary open angle glaucoma [Citation48,Citation77,Citation78]. We propose here NUFIP1-nuclear LC3 interaction to form part of a surveillance response of nucleolus activity to glaucomatous stress, such as CMS. We further propose this surveillance response to be defective in, at least, some types of glaucoma. Future studies will be directed at identifying the specific players and mechanisms associated to this response.
Materials and methods
Reagents
Chemicals and other materials were obtained from the following sources: EX527 (Tocris Bioscience, 2780); leptomycin B (Cell Signaling Technology, 9676S); WGA (L9640) and bovine serum albumin (BSA; L9640) from MilliporeSigma; GFP-Trap®_MA (Chromotek, gtma-20); phosphate-buffered saline (PBS,10X; Corning, 46-013-CM); Dulbecco’s modified eagle medium (11885084), 100 × penicillin–streptomycin (Pen/Strep; 15240062), fetal bovine serum (10082147), non-essential amino acids (11140050), gentamycin (15750060), HBSS (14025092), super signal west femto chemiluminescent substrates (34096), subcellular protein fractionation kit for cultured cells (78840) and protein assay kit (Micro BCA; 23235) from Thermo Fisher Scientific; ECL western blotting detection reagent (GE Healthcare, RPN2106); protein size marker (161–0373), protein assay dye reagent concentrate (5000006) and polyvinylidene fluoride membrane for protein blotting (1620177) from Bio-Rad.
Isolation and maintenance of primary human TM cells culture
Primary human TM cells were isolated from dissected TM tissue from discarded corneal rims after surgical corneal transplantation at Duke University Eye Center and maintained as described earlier [Citation79]. Cells were passaged when confluent at a 1:2 ratio. Cells from passage 4–8 were used in this study. HTM cells were characterized by morphology and by the upregulation of myocilin in response to dexamethasone treatment, in accordance to the consensus recommendations for TM cell isolation, characterization and culture [Citation80] (Figure S4). The protocols involving the use of human tissue were consistent with the tenets of the Declaration of Helsinki.
Cyclic mechanical stretch application
CMS was applied using the computer-controlled and vacuum-operated Flexcell® FX-5000™ Tension System (Flexcell International Corp, Burlington, NC, USA) as described previously [Citation18,Citation81]. Briefly, primary hTM cells were plated on type IV collagen-coated flexible membranes mounted into a 6- or 24-well culture plate (BioFlex culture plates, Flexcell International Corp, Burlington, NC, USA) and grown to confluence under static conditions in growth medium. Once confluency was reached, the media were replaced with fresh growth media and CMS (20% or 8% peak strain, 1Hz, for 6-well or 24-well plates, respectively) was applied for the indicated times in each experiment. Control cells were cultured under the same conditions, but no CMS was applied. When indicated, LepB (20 nM), WGA (5 µg/mL) or EX527 (25 or 50 µM) were added to the culture media 2 h prior to CMS.
Immunocytochemical analyses
Cells were fixed with 4% paraformaldehyde/PBS for 15 min at room temperature followed by permeabilization with 0.1% Triton X-100 in PBS for 10 min on ice. Non-specific sites were blocked by incubation with blocking solution (5% goat serum [MilliporeSigma, G9023], 2% BSA [MilliporeSigma, A7906], 0.1% Triton X-100 [MilliporeSigma, Tx1568-1] in PBS) at room temperature for 30 min. Cells were then incubated overnight at 4°C with primary antibodies diluted in blocking solution, washed several times with PBS, and incubated for 1 h at room temperature with Alexa Fluor 594 dye-conjugated goat anti-mouse or rabbit IgG antibodies (Invitrogen, A-11032 or A-11037) diluted 1:1000 in blocking solution without serum. Cells were subsequently washed with PBS and counterstained with DAPI (1 μg/ml; Thermo Fisher Scientific, 62248). Images were acquired on a Nikon C2si confocal microscope (Nikon Instruments Inc., Melville, NY, USA) and processed with Fiji [Citation82]. The following primary antibodies and dilutions used in this study were: anti-LC3 antibody (1:1,000; MBL, PM036), anti-pSC35 (1:500: Santa Cruz Biotechnology, sc-53518), anti-COIL/Coilin (1:500; Santa Cruz Biotechnology, SC-55594), anti-PML antibody (1:500; Santa Cruz Biotechnology, SC-966), anti-FBL/Fibrillarin antibody (1:500; Abclonal, A1136), anti-NUFIP1 (1:200; Proteintech, 12515-1-AP) and anti-LAMP2 (1:200; Proteintech, 66301-1-Ig).
Live cell time lapse imaging
For live cell imaging, primary hTM cells were transduced with 5 plaque-forming units (pfu)/cell of the replication-deficient adenoviruses AdGFP, AdRFP-SQSTM1 (Vector Biolabs, Malvern, PA, USA), AdtfLC3, or AdGFP-LC3 (kindly provided by Dr. Wen-Xing Ding, University of Kansas Medical Center). At day three after transduction, culture media was changed with fresh cell growth media and further incubated at 37°C, 5% CO2 for the indicated times. When indicated, LepB (20 nM) or EX527 (25 or 50 µM) was added to the culture media. For starvation conditions, starvation medium (1% BSA, 140 mM NaCl, 1 mM CaCl2, 1 mM MgCl2, 5 mM glucose, and 20 mM HEPES pH 7.4) [Citation31] was used instead. Time lapse images were acquired using CELENA® S Digital Imaging System (Logos biosystems, Annandale, VA, USA) equipped with the ibidi stage top incubation system (ibidi USA, Inc., Fitchburg, WI, USA). Fiji was used for image processing.
Transmission electron microscopy
Cells were washed twice in PBS and fixed in 2.5% glutaraldehyde and 2% paraformaldehyde in 0.1 M cacodylate buffer (pH 7.2). Fixed cells were then detached by gentle scraping, pelleted, post-fixed in 1% osmium tetroxide in 0.1 M cacodylate buffer and processed for transmission electron microscopy in the Morphology Facility at Duke Eye Center. Thin sections (65 nm) were examined in a JEM-1200EX electron microscopy (JEOL USA, Peabody, MA).
Preparation of whole cell lysates and subcellular fractions
Cells were washed in cold PBS and harvested as following. Whole cell lysates were prepared by lysing the cells for 30 min on ice with a modified RIPA lysis buffer (Millipore Sigma, R0278) containing 1:100 Halt protease and phosphatase inhibitor cocktail (Thermo Fisher Scientific, 78842). Cytosolic, nuclear, and membrane-bound enriched organelle fractions were obtained using Subcellular Protein Fractionation Kit for Cultured Cells (Thermo Fisher Scientific, 78840), according to the manufacturer’s instructions. Protein amounts were measured by a protein assay kit (Micro BCA; Thermo Scientific, 23235) or Bradford methods using Protein assay Dye Reagent (Bio-Rad, 5000006).
Co-immunoprecipitation
Primary hTM cells were transduced by 20 pfu/cell of the Ad-GFP or Ad-GFP-LC3, nuclei from the hTM cells (0.5 ~ 1x10⁷) for 4 d and fractionated as described above. Nuclei were lysed with co-IP lysis buffer [20 mM Tris, pH 7.5, 137 mM NaCl, 1 mM MgCl2, 1 mM CaCl2, 1% NP-40 (IBI Scientific, 9016-45-9), 10% glycerol] supplemented with 1:100 Halt protease and phosphatase inhibitor cocktail, 50 U/mL benzonase (MilliporeSigma, 70664), and 5 mM MgCl2. Lysates were rotated at 4°C for 2 h and clarified with centrifugation at 16,000x g. Supernatants were then incubated with GFP-Trap®_MA (Chromotek) at 4°C for 16 h
Proteins (2.5–10 μg) were separated by SDS-PAGE (10-15%) and electrotransferred to polyvinylidene fluoride membrane. Non-specific sites were blocked with 5% non-fat dry milk in PBS-T (0.1% Tween-20, Bio-rad #170-6531) for 1 h. Membranes were then incubated with primary antibodies overnight at 4°C, washed in PBS-T, and incubated with peroxidase-conjugated donkey anti-mouse, rabbit or goat IgG (1:5,000; Jackson ImmunoResearch Inc.,715-035-151, 711-035-152 or 705-035-147) for 1 h at room temperature. Signal was developed using enhanced chemiluminescence substrate system. The images were captured and quantified by using ChemiDoc™ Touching Image system with Image Lab™ touch software (Bio-Rad, Hercules, CA, USA). The following primary antibodies and dilutions were used: anti-LC3B antibody (1:3,000; Cell Signaling Technology, 3868S), anti-SQSTM1 antibody (1:5,000; MilliporeSigma, P0067), anti-H2B antibody (1:2,000; Cell Signaling Technology, 8135S), anti-TUBB (1:1,000; Santa Cruz Biotechnology, sc-9935) anti-TUBA4A (1:5,000; MilliporeSigma, T5168), anti-GFP antibody (1:3,000 [Citation83];), anti-FBL/fibrillarin antibody (1:3,000; Abclonal, A1136), anti-NUFIP1 (1:1,000; Proteintech, 12515-1-AP), anti-LAMP1 (1:1,000; Abcam, ab24170), anti-LAMP2 (1:1,000; Santa Cruz Biotechnology, SC8101), anti-RPS15A (1:2,000; Bethyl, A304-990A-M), anti-RPL26 (1:2,000; Bethyl, A300-686A-M) and anti-ACTB antibody (1:1,000; Santa Cruz Biotechnology, sc-69879). Band densities were obtained with ImageJ (NIH) or Image Lab™ software and normalized with that of ACTB for whole cell lysates, TUBB/TUBA4A for cytosolic fractions, and H2B for nuclear fractions.
Sirna transfection
siRNA transfection was performed as described previously with minor modifications [Citation18]. In brief, primary human TM cells were plated on 24-well plate, with 60-80% confluence, in 0.5 mL of the growth media. After 24 h, the cells were transfected with either 5 pmol of siRNA against ATG5 (siATG5, SC-41445) and ATG7 (siATG7, SC-41447) or 5 pmol of non-targeting siRNA (siNC, SC-37007) using Lipofectamine® RNAiMAX Reagent (Thermo Fisher Scientific, 13778075), according to the manufacturer’s instructions. All siRNAs were obtained from Santa Cruz Biotechnology.
Statistical analyses
All experimental procedures were repeated at least three times in independent experiments with different primary cultured hTM cells. Data were presented as the mean ± S.D. Statistical analysis was done in GraphPad Prism software using two-tailed unpaired Student’s t-test with Bonferroni correction. p < 0.05 was considered to be statistically significant.
Supplemental Material
Download Zip (32.9 MB)Acknowledgments
We thank Dr. Xiao-Ming Yin at Indiana University for his permission to use AdGFP LC3; Dr. W. Daniel Stamer at Duke University for generously providing rabbit polyclonal anti-GFP antibody; and Ying Hao at the Duke Eye Center electron microscopy unit for EM samples preparation.
Disclosure statement
No potential conflict of interest was reported by the authors.
Supplementary material
Supplemental data for this article can be accessed here.
Additional information
Funding
Related Research Data
References
- Stamer WD, Clark AF. The many faces of the trabecular meshwork cell. Exp Eye Res. 2017;158:112–123.
- Liton PB, Gonzalez P. Stress response of the trabecular meshwork. J Glaucoma. 2008;17(5):378–385.
- Matsuo T, Uchida H, Matsuo N. Bovine and porcine trabecular cells produce prostaglandin F2 alpha in response to cyclic mechanical stretching. Jpn J Ophthalmol. 1996;40(3):289–296.
- Mitton KP, Tumminia SJ, Arora J, et al. Transient loss of alphaB-crystallin: an early cellular response to mechanical stretch. Biochem Biophys Res Commun. 1997;235(1):69–73.
- Okada Y, Matsuo T, Ohtsuki H. Bovine trabecular cells produce TIMP-1 and MMP-2 in response to mechanical stretching. Jpn J Ophthalmol. 1998;42(2):90–94.
- Tumminia SJ, Mitton KP, Arora J, et al. Mechanical stretch alters the actin cytoskeletal network and signal transduction in human trabecular meshwork cells. Invest Ophthalmol Vis Sci. 1998;39(8):1361–1371.
- WuDunn D. The effect of mechanical strain on matrix metalloproteinase production by bovine trabecular meshwork cells. Curr Eye Res. 2001;22(5):394–397.
- Vittal V, Rose A, Gregory KE, et al. Changes in gene expression by trabecular meshwork cells in response to mechanical stretching. Invest Ophthalmol Vis Sci. 2005;46(8):2857–2868.
- Sato Y, Matsuo T, Ohtsuki H. A novel gene (oculomedin) induced by mechanical stretching in human trabecular cells of the eye. Biochem Biophys Res Commun. 1999;259(2):349–351.
- Luna C, Li G, Qiu J, et al. Extracellular release of ATP mediated by cyclic mechanical stress leads to mobilization of AA in trabecular meshwork cells. Invest Ophthalmol Vis Sci. 2009;50(12):5805–5810.
- Luna C, Li G, Liton PB, et al. Alterations in gene expression induced by cyclic mechanical stress in trabecular meshwork cells. Mol Vis. 2009;15:534–544.
- Liton PB, Luna C, Bodman M, et al. Induction of IL-6 expression by mechanical stress in the trabecular meshwork. Biochem Biophys Res Commun. 2005;337(4):1229–1236.
- Liton PB, Liu X, Challa P, et al. Induction of TGF-beta1 in the trabecular meshwork under cyclic mechanical stress. J Cell Physiol. 2005;205(3):364–371.
- Keller KE, Kelley MJ, Acott TS. Extracellular matrix gene alternative splicing by trabecular meshwork cells in response to mechanical stretching. Invest Ophthalmol Vis Sci. 2007;48(3):1164–1172.
- Chudgar SM, Deng P, Maddala R, et al. Regulation of connective tissue growth factor expression in the aqueous humor outflow pathway. Mol Vis. 2006;12:1117–1126.
- Bradley JM, Kelley MJ, Zhu X, et al. Effects of mechanical stretching on trabecular matrix metalloproteinases. Invest Ophthalmol Vis Sci. 2001;42(7):1505–1513.
- Bradley JM, Kelley MJ, Rose A, et al. Signaling pathways used in trabecular matrix metalloproteinase response to mechanical stretch. Invest Ophthalmol Vis Sci. 2003;44(12):5174–5181.
- Porter KM, Jeyabalan N, Liton PB. MTOR-independent induction of autophagy in trabecular meshwork cells subjected to biaxial stretch. Biochim Biophys Acta. 2014;1843(6):1054–1062.
- Hirt J, Liton PB. Autophagy and mechanotransduction in outflow pathway cells. Exp Eye Res. 2017;158:146–153.
- Klionsky DJ. Autophagy: from phenomenology to molecular understanding in less than a decade. Nat Rev Mol Cell Biol. 2007;8(11):931–937.
- Mizushima N. Autophagy: process and function. Genes Dev. 2007;21(22):2861–2873.
- Mizushima N, Yoshimori T, Levine B. Methods in mammalian autophagy research. Cell. 2010;140(3):313–326.
- Ichimura Y, Kirisako T, Takao T, et al. A ubiquitin-like system mediates protein lipidation. Nature. 2000;408(6811):488–492.
- Nakatogawa H, Ichimura Y, Ohsumi Y. Atg8, a ubiquitin-like protein required for autophagosome formation, mediates membrane tethering and hemifusion. Cell. 2007;130(1):165–178.
- Noda NN, Ohsumi Y, Inagaki F. Atg8-family interacting motif crucial for selective autophagy. FEBS Lett. 2010;584(7):1379–1385.
- Kabeya Y, Mizushima N, Ueno T, et al. LC3, a mammalian homologue of yeast Apg8p, is localized in autophagosome membranes after processing. Embo J. 2000;19(21):5720–5728.
- Kuma A, Matsui M, Mizushima N. LC3, an autophagosome marker, can be incorporated into protein aggregates independent of autophagy: caution in the interpretation of LC3 localization. Autophagy. 2007;3(4):323–328.
- Kimura S, Fujita N, Noda T, et al. Monitoring autophagy in mammalian cultured cells through the dynamics of LC3. Methods Enzymol. 2009;452:1–12.
- Klionsky DJ, Abdelmohsen K, Abe A, et al. Guidelines for the use and interpretation of assays for monitoring autophagy (3rd edition). Autophagy. 2016;12(1):1–222.
- Karim MR, Kanazawa T, Daigaku Y, et al. Cytosolic LC3 ratio as a sensitive index of macroautophagy in isolated rat hepatocytes and H4-II-E cells. Autophagy. 2007;3(6):553–560.
- Huang R, Xu Y, Wan W, et al. Deacetylation of nuclear LC3 drives autophagy initiation under starvation. Mol Cell. 2015;57(3):456–466.
- Drake KR, Kang M, Kenworthy AK. Nucleocytoplasmic distribution and dynamics of the autophagosome marker EGFP-LC3. PLoS One. 2010;5(3):e9806.
- Hailey DW, Rambold AS, Satpute-Krishnan P, et al. Mitochondria supply membranes for autophagosome biogenesis during starvation. Cell. 2010;141(4):656–667.
- Dou Z, Xu C, Donahue G, et al. Autophagy mediates degradation of nuclear lamina. Nature. 2015;527(7576):105–109.
- Kraft LJ, Manral P, Dowler J, et al. Nuclear LC3 associates with slowly diffusing complexes that survey the nucleolus. Traffic. 2016;17(4):369–399.
- Boisvert FM, van Koningsbruggen S, Navascues J, et al. The multifunctional nucleolus. Nat Rev Mol Cell Biol. 2007;8(7):574–585.
- Tiku V, Antebi A. Nucleolar function in lifespan regulation. Trends in cell biology. 2018;28(8):662–672.
- Andersen JS, Lyon CE, Fox AH, et al. Directed proteomic analysis of the human nucleolus. Curr Biol. 2002;12(1):1–11.
- Pederson T. The plurifunctional nucleolus. Nucleic Acids Res. 1998;26(17):3871–3876.
- Olson MO, Dundr M, Szebeni A. The nucleolus: an old factory with unexpected capabilities. Trends Cell Biol. 2000;10(5):189–196.
- Visintin R, Amon A. The nucleolus: the magician’s hat for cell cycle tricks. Curr Opin Cell Biol. 2000;12(3):372–377.
- Boulon S, Westman BJ, Hutten S, et al. The nucleolus under stress. Mol Cell. 2010;40(2):216–227.
- Sirri V, Urcuqui-Inchima S, Roussel P, et al. Nucleolus: the fascinating nuclear body. Histochem Cell Biol. 2008;129(1):13–31.
- Hu S, Chen J, Butler JP, et al. Prestress mediates force propagation into the nucleus. Biochem Biophys Res Commun. 2005;329(2):423–428.
- Hu S, Eberhard L, Chen J, et al. Mechanical anisotropy of adherent cells probed by a three-dimensional magnetic twisting device. Am J Physiol Cell Physiol. 2004;287(5):C1184–91.
- Maniotis AJ, Chen CS, Ingber DE. Demonstration of mechanical connections between integrins, cytoskeletal filaments, and nucleoplasm that stabilize nuclear structure. Proc Natl Acad Sci U S A. 1997;94(3):849–854.
- Maxwell WL, Islam MN, Graham DI, et al. A qualitative and quantitative analysis of the response of the retinal ganglion cell soma after stretch injury to the adult guinea-pig optic nerve. J Neurocytol. 1994;23(6):379–392.
- Sia PI, Wood JP, Chidlow G, et al. Role of the nucleolus in neurodegenerative diseases with particular reference to the retina: a review. Clin Exp Ophthalmol. 2016;44(3):188–195.
- Johnson R, Strehler BL. Loss of genes coding for ribosomal RNA in ageing brain cells. Nature. 1972;240(5381):412–414.
- Parlato R, Liss B. How Parkinson’s disease meets nucleolar stress. Biochim Biophys Acta. 2014;1842(6):791–797.
- Lee J, Hwang YJ, Ryu H, et al. Nucleolar dysfunction in Huntington’s disease. Biochim Biophys Acta. 2014;1842(6):785–790.
- Hetman M. Role of the nucleolus in human diseases. Preface Biochim Biophys Acta. 2014;1842(6):757.
- Nowak J, Archange C, Tardivel-Lacombe J, et al. The TP53INP2 protein is required for autophagy in mammalian cells. Mol Biol Cell. 2009;20(3):870–881.
- Mauvezin C, Orpinell M, Francis VA, et al. The nuclear cofactor DOR regulates autophagy in mammalian and Drosophila cells. EMBO Rep. 2010;11(1):37–44.
- Xu Y, Wan W, Shou X, et al. TP53INP2/DOR, a mediator of cell autophagy, promotes rDNA transcription via facilitating the assembly of the POLR1/RNA polymerase I preinitiation complex at rDNA promoters. Autophagy. 2016;12(7):1118–1128.
- Mauvezin C, Sancho A, Ivanova S, et al. DOR undergoes nucleo-cytoplasmic shuttling, which involves passage through the nucleolus. FEBS Lett. 2012;586(19):3179–3186.
- Terry LJ, Shows EB, Wente SR. Crossing the nuclear envelope: hierarchical regulation of nucleocytoplasmic transport. Science. 2007;318(5855):1412–1416.
- Koukourakis MI, Kalamida D, Giatromanolaki A, et al. Autophagosome proteins LC3A, LC3B and LC3C have distinct subcellular distribution kinetics and expression in cancer cell lines. PLoS One. 2015;10(9):e0137675.
- Stade K, Ford CS, Guthrie C, et al. Exportin 1 (Crm1p) is an essential nuclear export factor. Cell. 1997;90(6):1041–1050.
- Kudo N, Matsumori N, Taoka H, et al. Leptomycin B inactivates CRM1/exportin 1 by covalent modification at a cysteine residue in the central conserved region. Proc Natl Acad Sci U S A. 1999;96(16):9112–9117.
- Buckingham EM, Carpenter JE, Jackson W, et al. Nuclear LC3-positive puncta in stressed cells do not represent autophagosomes. BioTechniques. 2014;57(5):241–244.
- Pankiv S, Lamark T, Bruun JA, et al. Nucleocytoplasmic shuttling of p62/SQSTM1 and its role in recruitment of nuclear polyubiquitinated proteins to promyelocytic leukemia bodies. J Biol Chem. 2010;285(8):5941–5953.
- Wyant GA, Abu-Remaileh M, Frenkel EM, et al. NUFIP1 is a ribosome receptor for starvation-induced ribophagy. Science. 2018;360(6390):751–758.
- Kraft C, Deplazes A, Sohrmann M, et al. Mature ribosomes are selectively degraded upon starvation by an autophagy pathway requiring the Ubp3p/Bre5p ubiquitin protease. Nat Cell Biol. 2008;10(5):602–610.
- Lafarga M, Berciano MT, Pena E, et al. Clastosome: a subtype of nuclear body enriched in 19S and 20S proteasomes, ubiquitin, and protein substrates of proteasome. Mol Biol Cell. 2002;13(8):2771–2782.
- Conlan LA, McNees CJ, Heierhorst J. Proteasome-dependent dispersal of PML nuclear bodies in response to alkylating DNA damage. Oncogene. 2004;23(1):307–310.
- He W, Hu CX, Hou JK, et al. Microtubule-associated protein 1 light chain 3 interacts with and contributes to growth inhibiting effect of PML. PLoS One. 2014;9(11):e113089.
- Martinez-Lopez N, Athonvarangkul D, Mishall P, et al. Autophagy proteins regulate ERK phosphorylation. Nat Commun. 2013;4:2799.
- Luo M, Zhao X, Song Y, et al. Nuclear autophagy: an evolutionarily conserved mechanism of nuclear degradation in the cytoplasm. Autophagy. 2016;12(11):1973–1983.
- Kumar S, Malik MA, Goswami S, et al. Candidate genes involved in the susceptibility of primary open angle glaucoma. Gene. 2016;577(2):119–131.
- Monemi S, Spaeth G, DaSilva A, et al. Identification of a novel adult-onset primary open-angle glaucoma (POAG) gene on 5q22.1. Hum Mol Genet. 2005;14(6):725–733.
- Skarie JM, Link BA. The primary open-angle glaucoma gene WDR36 functions in ribosomal RNA processing and interacts with the p53 stress-response pathway. Hum Mol Genet. 2008;17(16):2474–2485.
- Gallenberger M, Meinel DM, Kroeber M, et al. Lack of WDR36 leads to preimplantation embryonic lethality in mice and delays the formation of small subunit ribosomal RNA in human cells in vitro. Hum Mol Genet. 2011;20(3):422–435.
- Liu K, He W, Zhao J, et al. Association of WDR36 polymorphisms with primary open angle glaucoma: A systematic review and meta-analysis. Medicine (Baltimore). 2017;96(26):e7291.
- Gallenberger M, Kroeber M, Marz L, et al. Heterozygote Wdr36-deficient mice do not develop glaucoma. Exp Eye Res. 2014;128:83–91.
- Hauser MA, Allingham RR, Linkroum K, et al. Distribution of WDR36 DNA sequence variants in patients with primary open-angle glaucoma. Invest Ophthalmol Vis Sci. 2006;47(6):2542–2546.
- Burdon KP, Macgregor S, Hewitt AW, et al. Genome-wide association study identifies susceptibility loci for open angle glaucoma at TMCO1 and CDKN2B-AS1. Nat Genet. 2011;43(6):574–578.
- Sharma S, Burdon KP, Chidlow G, et al. Association of genetic variants in the TMCO1 gene with clinical parameters related to glaucoma and characterization of the protein in the eye. Invest Ophthalmol Vis Sci. 2012;53(8):4917–4925.
- Liton PB, Li G, Luna C, et al. Cross-talk between TGF-beta1 and IL-6 in human trabecular meshwork cells. Mol Vis. 2009;15:326–334.
- Keller KE, Bhattacharya SK, Borras T, et al. Consensus recommendations for trabecular meshwork cell isolation, characterization and culture. Exp Eye Res. 2018;171:164–173.
- Reina-Torres E, Wen JC, Liu KC, et al. VEGF as a paracrine regulator of conventional outflow facility. Invest Ophthalmol Vis Sci. 2017;58(3):1899–1908.
- Schindelin J, Arganda-Carreras I, Frise E, et al. Fiji: an open-source platform for biological-image analysis. Nat Methods. 2012;9(7):676–682.
- Stamer WD, Perkumas KM, Hoffman EA, et al. Coiled-coil targeting of myocilin to intracellular membranes. Exp Eye Res. 2006;83(6):1386–1395.