
ABSTRACT
Macroautophagy (which we will call autophagy hereafter) is a critical intracellular bulk degradation system that is active at basal rates in eukaryotic cells. This process is embedded in the homeostasis of nutrient availability and cellular metabolic demands, degrading primarily long-lived proteins and specific organelles.. Autophagy is perturbed in many pathologies, and its manipulation to enhance or inhibit this pathway therapeutically has received considerable attention. Although better probes are being developed for a more precise readout of autophagic activity in vitro and increasingly in vivo, many questions remain. These center in particular around the accurate measurement of autophagic flux and its translation from the in vitro to the in vivo environment as well as its clinical application. In this review, we highlight key aspects that appear to contribute to stumbling blocks on the road toward clinical translation and discuss points of departure for reaching some of the desired goals. We discuss techniques that are well aligned with achieving desirable spatiotemporal resolution to gather data on autophagic flux in a multi-scale fashion, to better apply the existing tools that are based on single-cell analysis and to use them in the living organism. We assess how current techniques may be used for the establishment of autophagic flux standards or reference points and consider strategies for a conceptual approach on titrating autophagy inducers based on their effect on autophagic flux . Finally, we discuss potential solutions for inherent controls for autophagy analysis, so as to better discern systemic and tissue-specific autophagic flux in future clinical applications.
Abbreviations: GFP: Green fluorescent protein; J: Flux; MAP1LC3/LC3: Microtubule-associated protein 1 light chain 3; nA: Number of autophagosomes; TEM: Transmission electron microscopy; τ: Transition time
Introduction
Autophagy is a critical protein degradation pathway that is active at basal rates in most cells, degrading long-lived proteins and dysfunctional organelles [Citation1]. It is a pathway that is embedded in the homeostasis of nutrient availability [Citation2] and the cellular energetic charge [Citation3,Citation4], thereby playing a major role in enabling metabolite homeostasis [Citation5] and preserving cell viability [Citation6]. However, autophagy is perturbed in many pathological conditions [Citation7]; therefore, the manipulation and control to either enhance or inhibit this pathway for therapeutic benefit has received major attention [Citation8,Citation9]. However, the control of autophagy and in particular the measurement of autophagic flux, i.e. the rate of protein degradation through the entire autophagy pathway in vivo, remains a major challenge, yet is a prerequisite for its successful and safe application in the clinic. Although the autophagy machinery as well as the presence of autophagosomes, autolysosomes and lysosomes have been dissected with great detail [Citation1,Citation10], less information exists for human tissue-derived autophagic flux and its response to a given clinical intervention. Moreover, the ability to accurately indicate whether the cellular system or the tissue under investigation is at steady state, i.e. autophagosome synthesis rate is equal to their degradation rate, or in transition is a further stumbling block on the road to exploiting autophagy control clinically. Many inducers of autophagy exist that may act sequentially or concomitantly on the autophagy pathway, but to what extent each of them contributes to the enhancement of autophagy above basal levels is less clear, and it remains to be understood how manipulation of autophagic flux through therapeutic intervention relates to the degree of clinical side effects. Data on the autophagy activity in relation to pharmacokinetics or a therapeutic window of autophagy modulation are scarce, and robust essays that may direct patient treatment are still required. This scenario is contrasted by the many powerful tools and guidelines [Citation11–Citation14] that exist for the assessment of autophagy, the continuing quest for more sensitive autophagy monitoring and the increasingly promising results to control the autophagy machinery therapeutically [Citation15,Citation16].
Given these observations, we focused our discussion in this review on some of the emerging key aspects that appear to contribute to the stumbling blocks of autophagy measurement and control, scaling from the (best understood) single-cell analytical approach to the whole living organism. We provide insights into why light sheet fluorescence microscopy or Selective Plane Illumination Microscopy (SPIM) may be well aligned with achieving the desired spatiotemporal resolution to gather data on the autophagosome pool size, i.e. the total number of autophagosomes in an entire cell and autophagic flux in a multi-scale fashion, allowing to achieve a similar quantitative outcome as realized in single cell analysis approaches [Citation11–Citation13]. We addressed the relevance of precision autophagy flux control in pathological conditions such as cancer and neurodegeneration and assess how currently employed techniques may be used for the establishment of an autophagic flux database, serving as points of departure for the development of standards and reference values. In addition, we discussed how to control autophagy activity within very small ranges, so as to safely align autophagic flux intervention with a defined protein clearance rate and clinical outcome, avoiding the manifestation of side effects. By providing a conceptual approach for how to titrate autophagy inducers based on their effect on autophagic flux, J, we indicate a strategy that may increase the control over autophagic flux manipulation to achieve and maintain a defined and favorable level of flux. Finally, we propose potential solutions for accessible inherent controls for autophagic flux analysis in the clinic, when discerning systemic and tissue-specific autophagy analysis, and point toward the emerging need to discern between autophagy cargo and machinery/vesicle flux. Some of the methodological approaches discussed may appear less conventional and are, in part, conceptual in nature, yet resting on the currently existing body of knowledge and literature. This review indicates the substantial need for tightly controlling autophagy manipulation and indicates the worthwhile goal of achieving autophagy manipulation in vivo and in the clinic.
Autophagic flux analysis – achieving single-cell resolution at tissue and whole organism level?
The dynamic nature of the autophagy pathway has been first discovered in the mammalian system, by conducting valine chase experiments in mouse liver [Citation17–Citation19]. These pioneering experiments highlighted not only the rapid response of the autophagy system to metabolite deprivation, but also pointed toward its profound metabolic role. Strikingly, the first paper to emphasize the need to monitor autophagy flux in the molecular era of analysis (i.e. since the ATG genes were discovered) was concerned with the commonly used autophagosome marker, MAP1LC3/LC3 (microtubule associated protein 1 light chain 3), a mammalian homolog of yeast Atg8 [Citation20]. Relatively few proteins remain associated with the completed autophagosome, at least at easily detectable levels, with LC3 being the major exception. Thus, this protein serves as a convenient marker to follow autophagosomes [Citation13]. In addition, LC3 (and even more so, Atg8) is upregulated upon autophagy induction, providing another easy method to monitor this process. LC3 is conjugated to phosphatidylethanolamine (PE) to generate LC3-II. This protein is initially localized on both sides of the phagophore, the precursor to the autophagosome. After autophagosome maturation the LC3-II on the vesicle surface is released into the cytosol, whereas the population inside the autophagosome is delivered to the lysosome where it is degraded. Accordingly, LC3-II levels actually represent a balance between synthesis and degradation. In practical terms, the analysis of the total LC3-II levels does not provide an accurate method for evaluating autophagy – an increase in LC3-II could be indicative of increased autophagy (i.e. increased synthesis) or a block in the protein’s degradation due to a defect in fusion of the autophagosome with the lysosome or in lysosome degradative capacity. For this reason, it is necessary to monitor autophagy flux by comparing the amount of LC3-II in the presence and absence of an inhibitor that blocks fusion (e.g. bafilomycin A1) or lysosomal hydrolase activity (e.g. leupeptin plus E-64d). When autophagy is induced in normal conditions (i.e. in a wild-type cell), LC3-II levels will increase compared to the non-induced condition, and they will show a further increase in the presence of the inhibitor due to the block in lysosomal turnover; the absence of such an increase would be an indication that the latter step is already defective. Therefore, when done in this manner monitoring LC3-II by western blot provides a relatively simple method for following autophagic flux. In addition to LC3-II, it is often beneficial to monitor a second component such as SQSTM1/p62, which is also degraded in part by autophagy. Other methods have been developed as an alternative approach to monitor flux, including fluorescence microscopy [Citation11,Citation13].
In yeast, Saccharomyces cerevisiae, it is possible to monitor Atg8 protein levels by western blot similar to the methods used with LC3-II. This approach is particularly feasible in this model organism because the ATG8/Atg8 levels increase at least 40-fold under autophagy-inducing conditions. Rather than using an inhibitor of fusion or pharmacological inhibition of hydrolases it is most common to follow flux through genetic means, deleting the PEP4 gene, which encodes a primary peptidase that is involved in the activation of several other vacuolar (the yeast lysosome analog) hydrolases. One important caveat, however, is that the pep4∆ strain is severely defective in one of the late steps of autophagy – breakdown of the cargo. Thus, macromolecules that would normally be generated by autophagic degradation cannot be released back into the cytosol, resulting in a constitutive starvation phenotype, which can cause some degree of autophagy activation. Accordingly, it may be preferable even in this system to use pharmacological inhibitors such as PMSF.
In addition to monitoring Atg8 and Atg8–PE levels, delivery of Atg8 to the vacuole can be monitored through the GFP-Atg8 processing assay [Citation21]. In this case Atg8 is tagged at the N terminus with the green fluorescent protein, but the chimera behaves similar to the native Atg8 protein; when GFP-Atg8 that is trapped inside the autophagosome is delivered to the vacuole, Atg8 is degraded whereas GFP is relatively stable. The appearance of free GFP is therefore indicative of autophagic flux. Using GFP to tag different proteins makes it possible to modify this assay for the purpose of monitoring selective types of autophagy [Citation22]. The advantage of this assay is that it does not require inhibitors (the cytosolic form of the protein is the full-length chimera, which is easily distinguished from free GFP by western blot). In addition, in contrast to the loss of the substrate (Atg8/LC3), which necessitates monitoring a decreasing signal, this assay measures the appearance of the product, which increases over time. A similar assay utilizing GFP-LC3 can be carried out in some mammalian cell lines.
As with LC3, Atg8–PE (or GFP-Atg8) is not a cargo molecule per se. However, a convenient assay for bulk autophagic activity is available in yeast that monitors the delivery of a bona fide cargo using an enzymatic assay – the Pho8∆60 assay. The cargo/substrate is a modified form of a vacuolar phosphatase that is no longer able to enter the secretory pathway and therefore remains in the cytosol where it can be sequestered via nonselective autophagy. Delivery to the vacuole results in removal of a C-terminal propeptide and maturation of the zymogen, which can be measured enzymatically [Citation23]. This assay has been modified by targeting Pho8∆60 to specific organelles to follow selective organelle degradation such as mitophagy. Using this assay it was possible to demonstrate the dynamic and flexible nature of autophagosome formation. For example, one study specifically manipulated the level of Atg8 that was synthesized in starvation conditions by replacing the endogenous promoter with ones of varying strength, and found that the amount of Atg8 correlates with the autophagy activity (Pho8∆60-dependent phosphatase activity), which in turn correlates with the size of the autophagosome [Citation24]. That is, lower amounts of Atg8 resulted in smaller autophagosomes. Conversely, a similar approach suggests that Atg9 protein levels determine the rate of autophagosome formation [Citation25]. Thus, a balance between these 2 proteins, and likely other factors, can allow the cell to finely regulate the magnitude of the autophagic response. Similarly, it may be possible to directly target the mammalian homologs of these genes, which are highly conserved, to modulate autophagy activity therapeutically.
At present, extensive knowledge exists in the approaches and tools to measure and monitor autophagy in yeast and in the mammalian system [Citation13]. As discussed above, the measurement of LC3 through immunoblotting is one of the key approaches that serve as a functional reporter on autophagy. However, although some techniques are quite powerful and elegant, deriving functional and ultrastructural data at high, even sub-diffraction limit resolution [Citation26], not all techniques are suitable as diagnostic tools and only very few are geared for a quantitative high-throughput analysis approach [Citation27–Citation29]. First, second and third generation fluorescence imaging-based assessment tools have been developed in the past 15 years, with increasing spatiotemporal sensitivity and accuracy, especially in the in vitro environment [Citation11,Citation30]. A high degree of accuracy combined with precision, repeatability and applicability in the clinical environment is, however, largely lacking. In particular, achieving single cell resolution at the tissue or organ level, that allows for precise quantification of autophagy pathway intermediates, remains challenging.
Recently, the assessment of fluorescence signal using a novel GFP-LC3-RFP-LC3ΔG probe has made it possible to visualize autophagic activity in cells and tissues, and to easily discern regions of high or low autophagic activity [Citation11]. Moreover, a framework for defining and measuring autophagosome flux has been described, highlighting a single-cell fluorescence microscopy-based approach to dissect and measure the autophagosome pool and flux quantitatively with high resolution and accuracy [Citation12,Citation31]. This concept is based on principles of metabolic control analysis [Citation32,Citation33] serving as a powerful tool to be applied to the autophagy pathway. In fact, the interplay between metabolic flux and pathway intermediates has been a central theme for decades [Citation34]. However, although a quantitative approach based on live cell imaging has been put forward and applied with success at the single-cell level, delivering data that relate to the rate of protein degradation [Citation12,Citation35,Citation36], their translation into quantitative in vivo autophagic flux analysis has remained limited.
Bridging the gap – knowledge transfer to an in vivo environment
What could be learned from the in vitro-based approach, and applied to the in vivo scenario? A major limitation is the challenge of keeping tissue and organs of interest viable for a dynamic assessment of the autophagy itinerary. This becomes clear, as the majority of literature that claims to measure autophagic flux in vivo, although using methods that are powerful in their own right, is most often concerned with quantifying the pathway intermediates at the tissue level, without measuring their rate of degradation. The first systematic in vivo analysis of autophagy was performed in transgenic LC3 mice, revealing for the first time organ- and tissue-specific differences in autophagy activity, thereby sketching a map as to when and where autophagy occurs in the mammalian system [Citation37]. Subsequent analysis of selected tissues in the presence and absence of the lysosomotropic agents bafilomycin A1, chloroquine or leupeptin further substantiated these findings, indicating tissue-specific variation in autophagic flux in the heart [Citation38,Citation39], skeletal muscle [Citation40] and retina [Citation41] as well as liver, lung and kidney [Citation42].
It is important to note that these techniques usually capture whether autophagic flux is present, and are indicative of a defined basal autophagic flux (i.e. the extent of LC3 increase in the presence of lysosomotropic agents), or whether it is increased or decreased compared to a control sample or intervention (i.e. the extent of LC3 increase or decrease in the presence of lysosomotropic agents, compared to the control sample or other tissue sample containing the lysosomotropic agent). Such an approach makes it possible to determine the presence and magnitude of a change in autophagic flux, and demarcates important milestones in the assessment of autophagy in vivo.
Importantly, the kinetic assessment of liver-, heart-, kidney-, spleen- and lung-derived LC3 accumulation has been attempted [Citation43] and indicates the autophagic flux to be highest in the heart, followed by the liver, and lowest in the spleen. These data, obtained from time-course experiments, allow the assessment of the slope in LC3 accumulation in the given protein fraction over time, thereby describing the rate of protein degradation that was present in the tissue of interest at the time the lysosomotropic agent was added. This approach addresses the requirements of measuring flux [Citation31], and highlights on the one hand the strengths of kinetic analyses, but on the other hand the boundaries of accuracy and applicability of using LC3 protein levels (in arbitrary units) from whole tissue lysates to gain fine discrimination between small ranges of autophagic flux [Citation43]. Elegant transgenic model systems have been developed () that pioneered the in vivo assessment of autophagosomes, autolysosomes and autophagy activity in the brain [Citation44,Citation45], kidney [Citation46] and heart [Citation47], including mitophagy activity [Citation48–Citation50]. Of note, a direct readout of autophagy activity has been achieved, enabling rapid visual identification of regions with distinct autophagy activities [Citation11]. However, the kinetic analysis of such model systems, which would reveal the presence of a steady state autophagy flux on the one hand, and the magnitude of its change in response to treatment on the other, remains limited and requires the maintenance of organ health and cell viability during the image acquisition process.
Table 1. Transgenic mouse model systems for in vivo assessment of autophagy activity.
What if we could keep the whole organ or organism alive in a controlled environment, while continuously measuring pathway intermediates such as LC3, similar to a single-cell analysis approach, in the presence or absence of saturating concentrations of a lysosomotropic agent or lysosomal proteolysis inhibitor? This would require researchers to use the autophagosome pool instead of protein levels, so as to gain a measuring approach that may be more sensitive within small ranges of change. It is important to note that the change in autophagosome pool size, as opposed to the number of autophagosomes per se, is here of critical importance [Citation12]. Current advances in microscopy point toward light sheet or Selective Plane Illumination Microscopy (SPIM) [Citation51] which may make it possible to perform, if executed in this manner, true in vivo autophagy flux analysis, from the whole organism to single cells (). A kinetic analysis of viable tissue, organs or entire organisms becomes indeed thereby possible, and reveals, similarly to successful in vitro approaches [Citation11–Citation13], the presence or absence of a steady state, the autophagy flux and its change in response to autophagy modulation ().
Figure 1. In vivo autophagosome flux imaging. In vivo imaging and acquisition of fluorescent signal using light sheet microscopy enables autophagic flux visualization in the living whole organism, identifying regions of high, intermediate and low flux. Flux may be indicated as ratiometric signal, or, if resolution is sufficient, as autophagy pathway intermediates, upon the complete inhibition of autophagosome lysosome fusion using bafilomycin A1 (Baf).
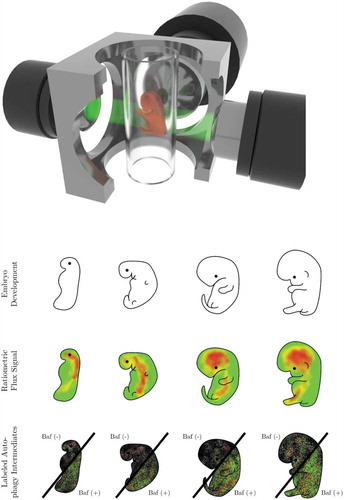
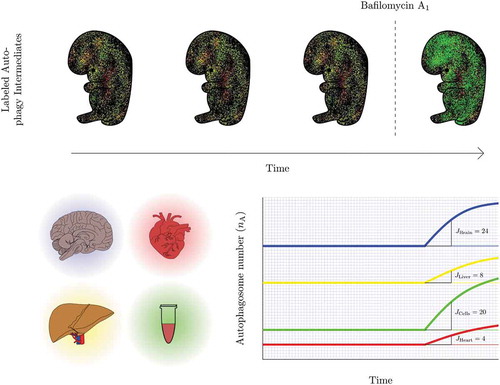
Figure 2. Revealing the presence of a steady state autophagy flux and kinetics of flux changes in vivo. Autophagosome flux measures can be used to quantify and visualize the organ-specific transition time, i.e. the time required for an organ to clear its complete autophagosomal pool (nA). Note, the change in autophagosome number (indicated by the slope) describes the autophagosome flux (J) in autophagosomes/cell/h.
Indeed, light sheet microscopy may be a well-aligned technique to allow the acquisition of autophagy activity and the total autophagosome pool of a whole living organism, paralleling the single-cell approach and may be expanded into not only measuring autophagosome flux, i.e. the rate of flow along the entire autophagy pathway [Citation12,Citation13,Citation31], but also chaperone-mediated autophagic flux [Citation35] in vivo. In fact, this approach inherently provides multiple advantages that are desirable for autophagy flux analysis, overcoming previous limitations (). It achieves a high enough spatiotemporal resolution in intact, larger samples, and importantly, its gentle touch allows biological processes such as autophagy to proceed and respond unhindered [Citation52–Citation55]. It may enable the gathering of ratiometric signal or the total autophagosome pool size and its change in real time in a multi-scale fashion from a single cell to tissue, organ and organism levels (). The plotting of autophagy pathway intermediates in time, upon complete inhibition of fusion between autophagosomes and lysosomes is prerequisite. Hence, steady state autophagy flux and kinetics of flux changes could, in that manner, be revealed (). Such approach, which allows to extract and resolve the autophagy pathway intermediates, as opposed to a fluorescence signal distribution or ratio, enables to express autophagic flux through pool size changes, i.e. autophagosomes/cell/hour, which may enhance quantitative power for the respective tissue of interest. This is of importance, since autophagosome pool size per se, gathered from a single point in time, does not infer autophagy activity [Citation31].
Table 2. Desirable conditions for measuring autophagy flux in vivo and using light sheet microscopy specifically [Citation52–Citation55].
When applied with fluorochromes or transgenic models expressing fluorescent proteins such as LC3 and LAMP2, as well as suitable inhibitors to block the fusion between autophagosomes and lysosomes, the autophagosome flux, J, can be established, revealing areas of low, intermediate and high autophagic flux. With currently existing autophagy flux probes, powerful computational and image analysis tools, a complete picture of autophagy activity distribution can be computed and projected numerically and visually as a color-coded lookup table (LUT), indicating pathway intermediates or ratiometric signal (). Moreover, the relationship between autophagosome pool and autophagic flux in vivo is largely unclear. The transition time describes this relationship, and can be similarly projected numerically and visually color-coded as an LUT, to indicate areas of longest or shortest times to clear the complete autophagosome pool. This may reveal areas with similar transition time, but distinct autophagosome pool size and flux, and thereby bring about clarity on tissue-specific differences in autophagy activity. Finally, the isolation of primary cells from such a model system, combined with a comprehensive screening approach to derive numerically autophagosome pool size, flux () and transition time for each cell type, would allow the establishment of a first online autophagic flux database that contains cell-specific data. Such a database may reveal the ranges of normal autophagy flux distribution across the mammalian cell types, assisting with the establishment of standards. This may be of particular value for the screening of drugs in cellular disease model systems or to complement existing data of in vivo autophagy assessments ().
Taken together, it becomes clear that the techniques and tools to move toward in vivo quantitative autophagy flux measure already exist and may allow us to step into a future that embraces in vivo autophagy flux in a multi-scale fashion, from single cell to organism.
“ … All i need is a 2% increase in flux, for the next 10 years”
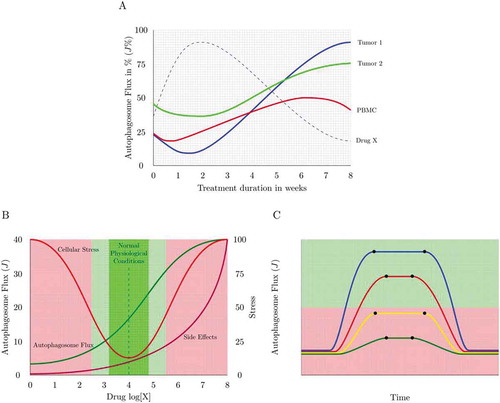
Autophagy is essential and existential in neuronal proteostasis, with loss of autophagy causing the onset of neurodegenerative disease [Citation56–Citation59]. It is becoming increasingly clear that autophagy is not only dysfunctional in a number of neurodegenerative disorders, but that the molecular defects defining autophagy failure are distinct and diverse [Citation60,Citation61]. Lysosomal proteolytic dysfunction, dysregulation in endocytic activity and progressive disruption in autophagy efficiency have all been attributed to differential degrees in the pathogenesis of neurodegeneration [Citation62–Citation64]. This fact necessitates an equally distinct and sensitive molecular assessment to identify the underlying defect in a given scenario and to ascertain the most suitable drug required to modulate autophagy. How good an autophagy inducer is and how its action relates to the manifestation of side effects is, however, largely unknown. Although many drugs have been identified that induce autophagy, it is less clear to what extent they are inducing the full autophagy pathway (). Clear guidelines and categories of autophagy inducers, for example ranked according to their potency and tissue specificity are currently not in existence. Drug concentration-dependent differences () as well as drug target-specific differences, such as MTOR-dependent and -independent modes of action may have a distinct impact on the potency of the drug to induce autophagy. In addition, it is not clear whether a new steady state is being established following treatment () and what drug concentration should be used to achieve, for example, a 25 or 50% increase in autophagic flux () or to manipulate flux with minimal side effects (). This will be critical in diseases where a long-term, potentially a treatment period of years, yet minor to moderate autophagy enhancement is warranted.
Figure 3. Measuring autophagy induction. (A) How high is high enough? Many autophagy inducers exist and may be drug-, diet- or lifestyle-derived, incrementally (Jinduced1 and Jinduced2) inducing autophagy above baseline levels (Jbasal) upon repeated exposure. Plotting this sequential enhancement of autophagosome flux may indicate the maximal achievable autophagosome flux for the cellular system and the flux that is most favorable for a given therapeutic intervention. (B) How good is the inducer? A most sensitive assessment of autophagy inducers is required that allows concentration-dependent titration of autophagosome flux and selection of the most suitable concentration to achieve a desirable flux induction above reduced or pathological autophagy activity. (C) Matching drug concentration with flux response. What drug concentration is required to achieve, for example, a 10% increase in autophagosome flux? The cartoon is depicting 3 distinct autophagy inducers and the concentration that leads to a 25, 50 and 75% increase in autophagosome flux.
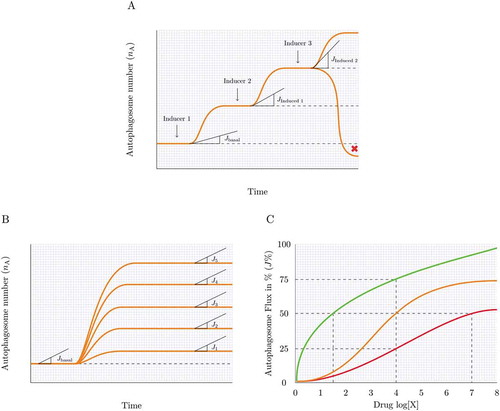
Figure 4. Assessing the steady state. Knowing whether the autophagy system is at steady state (A), reaches a new steady state (B), becomes unstable or in transition (C) or maintains a heightened flux for a given time (D) can be achieved by plotting the autophagosome pool under defined interventions. Likewise, a cellular system may be non-responsive to an autophagy induction, despite having a basal steady state flux or may be responding robustly to an autophagy inducer without establishing a new steady state and steady state flux. Note, the change in autophagosome number (indicated by the slope) describes the autophagosome flux (J) in autophagosomes/cell/h.
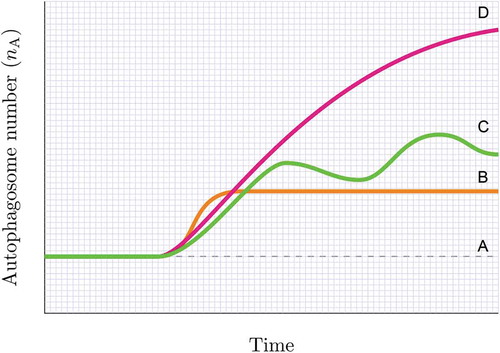
Figure 5. Autophagy response dynamics. (A) Tuning autophagosome flux with minimal side effects. A physiological autophagic activity exists (green) that homeostatically tunes cellular metabolism with autophagic activity. However, autophagic flux can be drug-induced or inherently pathologically altered, leading to the manifestation of side effects (e.g. thrombocytopenia in chloroquine treatment). The percent autophagosome flux plotted against the clinical side effect of interest allows the tuning of autophagic flux with desired parameters of health. (B) Dosing and scheduling. Autophagosome flux is tissue specific. Plotting autophagosome flux in PBMCs together with the flux of the tissue of interest (e.g. tumor biopsies) as well as the plasma concentration of the autophagy-modulating drug present at that time, may reveal the desirable autophagy response that is required in the target tissue of interest. PBMCs may serve as a suitable autophagic flux reference, due to their relative accessibility. (C) Dosing and scheduling. Assessing autophagy response dynamics: The change of the total autophagosome pool in the target organ reveals the time when steady state is reached (t1) and lost, and whether flux is sufficiently (green shaded area) lifted above dysfunctional (red shaded area) levels. Shown here is a single application of 4 different autophagy inducers.
Single-cell longitudinal acquisition and analysis of neurons is in this context a powerful tool that not only assesses the role and nature of protein degradation dysfunction, but also generates data that report on cumulative survival and the risk of cell death onset in the context of autophagy dysfunction [Citation62,Citation65]. Importantly, in the context of Huntington disease, it has recently become clear that individual neurons differ in their autophagic activity and capacity to clear protein aggregates, which affects their ability to survive [Citation36,Citation66]. Cells with higher protein clearance ability, i.e. cells that clear a specific protein faster, live longer. These observations crucially point toward 3 aspects: First, the importance of measuring the kinetic properties of protein degradation; second, the value of distinguishing between particular protein cargo degradation rates (here, mutant HTT [huntingtin] protein) and overall protein degradation machinery function (such as autophagosome flux); and third, the benefit of indicating the time required to clear a given protein cargo or autophagosome pool (transition time, τ). Hence, single-cell analysis not only allows the correlation of overall protein clearance ability with the risk of cell death onset, thereby making it possible to predict cell survival, but also enables the assessment of disease-specific cargo clearance [Citation36].
This type of analysis has crucial practical implications, because, although it is known that autophagy enhancement attenuates neuronal toxicity by clearing the respective aggregate-prone toxic protein species in models of Huntington [Citation67], Alzheimer [Citation68–Citation70] and Parkinson [Citation71] diseases, a clear relationship between the autophagy-inducing drug, the resultant autophagic flux, cargo degradation rate and risk of cellular demise remains to be established. At least one key aspect contributing to this lack of clarity lies in the precision of existing measurement tools and points toward the requirements to finely dissect pool sizes of cargo and the autophagy vesicular itinerary. Here we suggest a conceptual solution that titrates autophagy inducers (- on the basis of their effect on autophagosome flux, J, thereby increasing the fine control over autophagic flux manipulation in the research, pharmacological or clinical environment. This approach may serve as a tool to correlate autophagosome flux measured in an accessible tissue such as peripheral blood mononuclear cells (PBMCs) with clinical parameters of interest (), e.g. amyloid or MAPT/tau protein levels in cerebrospinal fluid (note, that here autophagosome flux does not refer to autophagosome pool size analysis through, for example, transmission electron microscopy, but rather to time-lapse experiments). The quantitative assessment of autophagy with the disease-specific cargo clearance function may accelerate the precision control of autophagy in neurodegeneration.
Which flux is desirable and how can it be sustained?
Autophagy plays a major role in cancer cells, not only in their upkeep of metabolic requirements [Citation72] but also in the progression of malignancy [Citation16]. The concepts of autophagy addiction and autophagy proficiency [Citation16,Citation73] highlight the high reliance of cancer cells on the autophagy pathway, with most cancer cells being characterized by a heightened autophagic flux [Citation74]. However, which flux level is favorable for maintaining cell viability and which favors apoptosis onset? How does autophagic activity in the tumor differ from autophagy in the host [Citation75] ()? In addition, the complexity but also importance of autophagic flux quantification becomes clear when considering that both autophagy inhibition and enhancement as well as coordinate or concomitant autophagy induction and inhibition can sensitize cancer cells to undergo apoptosis in vitro [Citation74,Citation76,Citation77] as well as in phase I trials [Citation78]. In the latter, patients with advanced solid malignancies were treated with 600 mg hydroxychloroquine twice daily in combination with a weekly dose of 25 mg of temsirolimus, leading to significant and improved antitumor activity [Citation78]. Likewise, clinical trials promoting autophagy inhibition in patients with glioblastoma [Citation79] and advanced solid tumors [Citation15] have demonstrated that systemic autophagy inhibition through hydroxychloroquine treatment is safe, tolerable and achievable, but requires lower toxicity and more potent compounds that modulate autophagy.
How can this potency be quantitatively assessed? It becomes clear that these studies not only pioneer the modulation of autophagy in cancer patients but that they call for further research that includes a highly accurate characterization of autophagic flux, so that compounds can be identified and ranked according to their potency to induce or inhibit autophagy, and to maintain or shift a given autophagy steady state flux upwards or downwards. However, confusion exists around the topic of steady state flux and it remains a major challenge to indicate whether the cellular system is at steady state or in transition. Clinically, it is desirable to establish how long a cellular system or tissue remains at a particular steady state flux, such as a pathologically heightened or diminished flux, and when it responds to a given intervention through leaving this flux (–). Moreover, many inducers of autophagy exist, that may act sequentially or concomitantly, such as dietary, pharmacological or exercise-based interventions, but it is less clear to what extent they each act on autophagy and whether they synergistically enhance autophagy above basal levels, potentially to a defined maximal level ().
An understanding and presentation of autophagosome flux in the manner suggested here may make it possible to indicate clearly whether the autophagy system is at steady state, reaches a new steady state, maintains a heightened flux for a given time or is non-responsive to an autophagy induction, despite having a basal steady state flux (). This approach may also allow researchers to answer the question of when a flux is high enough for a favorable outcome () and yet below the level that results in the manifestation of toxic side effects (). Moreover, this would allow increasing autophagic flux by very small values, such as, e.g. 10%, which may be particularly important in diseases, where either enhanced or suppressed autophagy may be required for a prolonged period of treatment intervention that may last months or years ( and ).
Out of the dark into the blood: an inherent autophagy flux reference required
Although human tissue and human-derived cells such as PBMCs have been successfully assessed for LC3 levels and the presence of autophagosomes [Citation15] we have very little evidence for tissue-specific human autophagic flux, neither in healthy nor in diseased tissue. Because tissue-specific variations in the autophagosome pool and flux exist [Citation37], it is likely that no diseased tissue is the same. Likewise, changes in autophagy activity over the course of the treatment intervention above and beyond the changes induced by the disease progression itself are likely, but remain largely unclear. An additional challenge lies in tissue accessibility, in particular neuronal cells [Citation80], where sample can either not be reached for autophagy assessment, or where surgery is not warranted.
The use of patient derived plasma [Citation81] or PBMCs has here demonstrated value, and has provided evidence of autophagy dysfunction in coronary artery and heart disease, at both the genetic [Citation82] and protein expression level [Citation83]. Moreover, PBMCs indicated pharmacodynamic evidence of autophagy inhibition [Citation15,Citation79]. However, this work also points out the weakness of reporting autophagosome pool size through transmission electron microscopy (TEM) analysis, masking the autophagic activity. Here we propose that live PBMCs for the analysis of autophagic flux could be beneficial, serving as a potential inherent control that is readily accessible to be maintained viable at least for the duration of transient fluorescent reporter transfection and subsequent flux analysis (). To what extent however such approach may indeed direct patient treatment, remains to be elucidated, in particular due to inherent and experimentally induced autophagy activation. The response of live PBMCs in terms of autophagic flux in the course of treatment intervention may however provide insights into systemic, host-specific autophagic flux responses that would reach the tissue of interest, and could be particularly valuable when including plasma levels of the autophagy-enhancing drugs in the analysis (). When tissue becomes available, due to biopsy or surgery, additional flux parameters can be gathered and profiled, to discern the relationship between pharmacokinetics of the chemotherapeutic drug, and the systemic and tissue-specific autophagic flux (). When live cell imaging is not possible, tissue biopsies should be maintained viable for a short duration of time to be incubated in the presence and absence of bafilomycin A1, so that the fold change in LC3 and SQSTM1 protein levels can be used to infer autophagic flux at that time point. Nevertheless, the identification of a robust biomarker that could direct patient treatment remains challenging and deserves further attention.
The ability of modeling and prediction may play a powerful role in the execution of autophagy control and modulation in the clinic, to enhance data around pharmacokinetics and pharmacodynamics, predicting treatment-associated changes in autophagic vacuoles or the autophagosomal pool [Citation15]. This may be expanded, to predict autophagic flux, based on the accessible and available molecular parameters. This type of information may be of particular value when establishing autophagy-related gene expression profiles [Citation60,Citation84] in cells and tissues of interest, and to subsequently map disease- and treatment-related functional changes in the autophagy network [Citation85,Citation86] so as to identify the response of the autophagy system. Together with autophagy flux data derived from, for example, PBMCs as accessible readout, as well as disease-specific markers, a more controlled and outcome-oriented autophagy modulation can be imagined. This has particular value when treatment is aimed at cell death control, where it is desirable to favor and maximize (cancer) or prevent and minimize (neurodegeneration) the likelihood and susceptibility for cell death manifestation.
Take these pills after breakfast and after lunch – one for the cargo and one for the machinery
Unlike with many standard drugs and therapeutic interventions, the pharmacokinetics of autophagic flux and the therapeutic window with autophagy-modulating drugs remain unclear. This can, in part, be understood as a result of the limited tools that exist to assess autophagy in such a context. Here we suggest conceptually how, based on the existing tools of live cell imaging and autophagosome flux analysis, the kinetics of autophagic flux could be measured (). This measurement will require the plotting of the onset and loss of the steady state upon single or repeated applications of autophagy inducers, making it possible to reveal not only the time frame within which a given autophagosome flux is maintained but also suggesting the frequency of drug application required to maintain a defined favorable autophagosome flux. It is becoming increasingly clear that one of the mechanisms underlying autophagy malfunction may be driven by an inability of autophagic vacuoles to recognize cytosolic cargo. Indeed, various model systems have demonstrated that autophagic vacuoles may form normally and are degraded through functional lysosomal fusion, but are dysfunctional in effectively recognizing cytosolic cargo [Citation87]. Kymograph analysis revealed dysfunction in autophagosome transport that may additionally contribute to inefficient autophagosome maturation, having a negative impact on mitochondrial cargo degradation [Citation88]. Given these observations together with the high degree of cargo selectivity [Citation89], with SQSTM1 and NBR1 serving as particular cargo receptors for autophagic degradation [Citation90], it emerges that a dissociation in the analysis of cargo flux and autophagy machinery [Citation12,Citation31,Citation91] may be of particular advantage. Hence, additional analysis of protein cargo species together with autophagosome flux may reveal better how cargo and machinery are functionally connected and what impact may be achieved by the treatment intervention.
Summary and future outlook
The control of autophagy manipulation and the measurement of autophagic flux in vivo remains challenging, yet it is a crucial requirement for the safe and finely controlled application of autophagy manipulation in the clinic. The current techniques to measure autophagy accurately may already exist, but have to be aligned to operate on the one hand in a multi-scale fashion and on the other hand to be suitable for high-throughput high-resolution quantitative analysis in a living tissue and organism. Here we have provided examples for how we may address some of the challenges around measuring autophagic flux in vivo, how to discern steady state and the maintenance of a suitable autophagic activity, how to assess autophagy drugs for their potency and to correlate these data with disease-specific markers of cargo or health. Future application of these aspects using living model systems, for example, viable transgenic murine embryos or candidate tissues that express the required autophagy markers, will be of high value to provide answers and the resolution to further build on the pioneering work that targets autophagy assessment in vivo and in the clinic, thereby assembling a picture of a systemic autophagy status (). How autophagy activity inherently reflects a given metabolic profile and impacts on overall circadian rhythm and clock proteins is an example of an additional emerging layer of autophagy dynamics [Citation92] that demonstrates the relationship between autophagy activity, cargo clearance and metabolism. Time-lapse acquisitions of whole organ autophagy activity in the context of circadian rhythm control would allow to map autophagy activity region-specifically with defined physiological parameters. It becomes clear that the role of autophagy in cell metabolism, connecting cell viability [Citation93,Citation94] and tumor suppression [Citation11] as well as the emerging power of autophagy modeling [Citation95–Citation97] and pathway control systems [Citation98] is very well positioned for patient-centered autophagy control and cell death prediction [Citation36,Citation99–Citation101]. Taken together, these observations highlight the crucial role played by the autophagy research community and the hope associated with its prospects. We can look forward to the joy of being a scientist in the autophagy field.
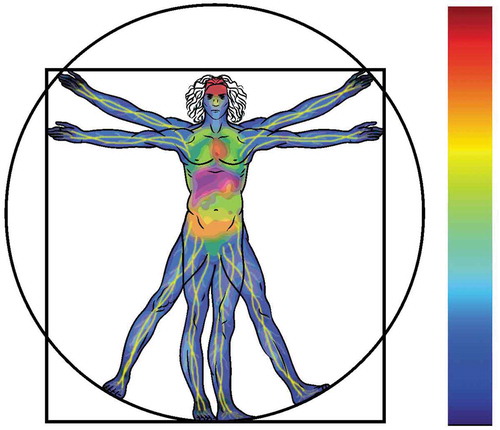
Figure 6. Tissue-specific autophagic activity distribution imagined: a systemic human autophagy flux distribution profile, describing regions of high (red), intermediate (yellow) and low (blue) autophagy flux.
Acknowledgments
The authors wish to acknowledge financial support from the South African National Research Foundation (NRF), the South African Medical Research Council (SAMRC), the Cancer Association of South Africa (CANSA) and the National Institutes of Health (GM053396).
Disclosure statement
No potential conflict of interest was reported by the authors.
Additional information
Funding
References
- Feng Y, He D, Yao Z, et al. The machinery of macroautophagy. Cell Res. 2014;24:24–41.
- Carroll B, Korolchuk VI, Sarkar S. Amino acids and autophagy: cross-talk and co-operation to control cellular homeostasis. Amino Acids. 2015;47:2065–2088.
- Schellens JP, Vreeling-Sindelárová H, Plomp PJ, et al. Hepatic autophagy and intracellular ATP a morphometric study. Exp Cell Res. 1988;177:103–108.
- Kim J, Kundu M, Viollet B, et al. AMPK and mTOR regulate autophagy through direct phosphorylation of Ulk1. Nat Cell Biol. 2011;13:132.
- He C, Bassik MC, Moresi V, et al. Exercise-induced BCL2-regulated autophagy is required for muscle glucose homeostasis. Nature. 2012;481:511.
- Loos B, Engelbrecht AM, Lockshin RA, et al. The variability of autophagy and cell death susceptibility: unanswered questions. Autophagy. 2013;9:1270–1285.
- Jiang P, Mizushima N. Autophagy and human diseases. Cell Res. 2014;24:69.
- Rubinsztein DC, Codogno P, Levine B. Autophagy modulation as a potential therapeutic target for diverse diseases. Nat Rev Drug Discov. 2012;11:709.
- Galluzzi L, Bravo-San Pedro JM, Levine B, et al. Pharmacological modulation of autophagy: therapeutic potential and persisting obstacles. Nat Rev Drug Discov. 2017;16:487.
- Ohsumi Y. Historical landmarks of autophagy research. Cell Res. 2014;24:9.
- Kaizuka T, Morishita H, Hama Y, et al. An autophagic flux probe that releases an internal control. Mol Cell. 2016;17:835–849.
- Du Toit A, Hofmeyr JH, Gniadek TJ, et al. Measuring autophagosome flux. Autophagy. 2018;14:1060–1071.
- Klionsky DJ, Abdelmohsen K, Abe A, et al. Guidelines for the use and interpretation of assays for monitoring autophagy. Autophagy. 2016;12:1–222.
- Galluzzi L, Baehrecke EH, Ballabio A, et al. Molecular definitions of autophagy and related processes. Embo J. 2017;36:1811–1836.
- Rangwala R, Chang YC, Hu J, et al. Combined MTOR and autophagy inhibition: phase I trial of hydroxychloroquine and temsirolimus in patients with advanced solid tumors and melanoma. Autophagy. 2014;10:1391–1402.
- Galluzzi L, Bravo-San Pedro JM, Kroemer G. Autophagy mediates tumor suppression via cellular senescence. Trends Cell Biol. 2016;26:1–3.
- Mortimore GE, Schworer CM. Induction of autophagy by amino-acid deprivation in perfused rat liver. Nature. 1977;270:174.
- Seglen PO, Gordon PB. 3-Methyladenine: specific inhibitor of autophagic/lysosomal protein degradation in isolated rat hepatocytes. Proc Nat Acad Sci. 1982;79:1889–1892.
- Mortimore GE, Pösö AR. Intracellular protein catabolism and its control during nutrient deprivation and supply. Annu Rev Nutr. 1987;7:539–568.
- Tanida I, Minematsu-Ikeguchi N, Ueno T, et al. Lysosomal turnover, but not a cellular level, of endogenous LC3 is a marker for autophagy. Autophagy. 2005;1:84–91.
- Nair U, Thumm M, Klionsky DJ, et al. GFP-Atg8 protease protection as a tool to monitor autophagosome biogenesis. Autophagy. 2011;7:1546–1550.
- Kanki T, Kang D, Klionsky DJ. Monitoring mitophagy in yeast: the Om45-GFP processing assay. Autophagy. 2009;5:1186–1189.
- Noda T, Klionsky DJ. The quantitative Pho8Delta60 assay of nonspecific autophagy. Methods Enzymol. 2008;451:33–42.
- Xie Z, Nair U, Klionsky DJ. Atg8 controls phagophore expansion during autophagosome formation. Mol Biol Cell. 2008;19:3290–3298.
- Jin M, He D, Backues SK, et al. Transcriptional regulation by Pho23 modulates the frequency of autophagosome formation. Curr Biol. 2014;24:1314–1322.
- Ligeon LA, Barois N, Werkmeister E, et al. Structured illumination microscopy and correlative microscopy to study autophagy. Methods. 2015;75:61–68.
- Guo S, Liang Y, Murphy SF, et al. A rapid and high content assay that measures cyto-ID-stained autophagic compartments and estimates autophagy flux with potential clinical applications. Autophagy. 2015;11:560–572.
- Chauhan S, Ahmed Z, Bradfute SB, et al. Pharmaceutical screen identifies novel target processes for activation of autophagy with a broad translational potential. Nat Commun. 2015;6:8620.
- Kuo SY, Castoreno AB, Aldrich LN, et al. Small-molecule enhancers of autophagy modulate cellular disease phenotypes suggested by human genetics. Proc Nat Acad Sci. 2015;112:E4281–7.
- Katayama H, Kogure T, Mizushima N, et al. A sensitive and quantitative technique for detecting autophagic events based on lysosomal delivery. Chem Biol. 2011;18:1042–1052.
- Loos B, Toit AD, Hofmeyr JH. Defining and measuring autophagosome flux—concept and reality. Autophagy. 2014;10:2087–2096.
- Kacser H, Burns JA, Fell DA. The control of flux: 21 years on. Biochem Soc Trans. 1995;23:341–366.
- Hofmeyr JH, Cornish-Bowden A. Regulating the cellular economy of supply and demand. FEBS Lett. 2000;476:47–51.
- Meijer AJ. Autophagy research: lessons from metabolism. Autophagy. 2009;5(1):3–5.
- Koga H, Martinez-Vicente M, Macian F, Verkusha VV, Cuervo AM. A photoconvertible fluorescent reporter to track chaperone-mediated autophagy. Nat Commun. 2011;2:386.
- Tsvetkov AS, Arrasate M, Barmada S, et al. Proteostasis of polyglutamine varies among neurons and predicts neurodegeneration. Nat Chem Biol. 2013;9:586.
- Mizushima N, Yamamoto A, Matsui M, et al. In vivo analysis of autophagy in response to nutrient starvation using transgenic mice expressing a fluorescent autophagosome marker. Mol Biol Cell. 2004;15:1101–1111.
- Iwai-Kanai E, Yuan H, Huang C, et al. A method to measure cardiac autophagic flux in vivo. Autophagy. 2008;4:322–329.
- Perry CN, Kyoi S, Hariharan N, et al. Novel methods for measuring cardiac autophagy in vivo. Methods Enzymol. 2009;453:325–342.
- Ju JS, Varadhachary AS, Miller SE, et al. Quantitation of “Autophagic flux” in mature skeletal muscle. Autophagy. 2010;6:929–935.
- Esteban-Martínez L, Boya P. Autophagic flux determination in vivo and ex vivo. Methods. 2015;75:79–86.
- Zois CE, Giatromanolaki A, Sivridis E, et al. “Autophagic flux” in normal mouse tissues: focus on endogenous LC3A processing. Autophagy. 2011;7:1371–1378.
- Haspel J, Shaik RS, Ifedigbo E, et al. Characterization of macroautophagic flux in vivo using a leupeptin-based assay. Autophagy. 2011;7:629–642.
- Castillo K, Valenzuela V, Matus S, et al. Measurement of autophagy flux in the nervous system in vivo. Cell Death Dis. 2013;4:e917.
- Lee JH, Rao MV, Yang DS, et al. Transgenic expression of a ratiometric autophagy probe specifically in neurons enables the interrogation of brain autophagy in vivo. Autophagy. 2019;15:543–557.
- Li L, Wang ZV, Hill JA, et al. New autophagy reporter mice reveal dynamics of proximal tubular autophagy. J Am Soc Nephrol. 2014;25:305–315.
- castillo N, Zhai P, Sadoshima J. Oxidative stress stimulates autophagic flux during ischemia/reperfusion. Antioxid Redox Signal. 2011;14:2179–2190.
- Sun N, Yun J, Liu J, et al. Measuring in vivo mitophagy. Mol Cell. 2015;60:685–696.
- McWilliams TG, Prescott AR, Allen GF, et al. mito-QC illuminates mitophagy and mitochondrial architecture in vivo. J Cell Biol. 2016;214:333–345.
- McWilliams TG, Prescott AR, Montava-Garriga L, et al. Basal mitophagy occurs independently of PINK1 in mouse tissues of high metabolic demand. Cell Metab. 2018;27:439–449.
- Pampaloni F, Ansari N, Stelzer EH. High-resolution deep imaging of live cellular spheroids with light-sheet-based fluorescence microscopy. Cell Tissue Res. 2013;352:161–177.
- Power RM, Huisken J. A guide to light-sheet fluorescence microscopy for multiscale imaging. Nat Methods. 2017;4:360.
- Stelzer EH. Light sheet microscopy revolutionizes dynamic multi-dimensional light microscopy of three-dimensional specimens (Conference Presentation). In High-Speed Biomedical Imaging and Spectroscopy III: Toward Big Data Instrumentation and Management Vol. 10505; Mar 15; 2018. p. 105050H. San Francisco (CA): International Society for Optics and Photonics.
- Pampaloni F, Mayer B, Kabat Vel-Job K, et al. novel cellular spheroid-based autophagy screen applying live fluorescence microscopy identifies nonactin as a strong inducer of autophagosomal turnover. Slas Discovery: Advancing Life Sci R&D. 2017;5:558–570.
- Ansari N, Hardung S, Hötte K, et al. Quantifying the autophagy-triggering effects of drugs in cell spheroids with live fluorescence microscopy. In Cancer Cell Signaling. 2014;1165:19–29. Humana Press, New York, NY.
- Hara T, Nakamura K, Matsui M, et al. Suppression of basal autophagy in neural cells causes neurodegenerative disease in mice. Nature. 2006;441:885.
- Komatsu M, Waguri S, Chiba T, et al. Loss of autophagy in the central nervous system causes neurodegeneration in mice. Nature. 2006;7095:880.
- Liang CC, Wang C, Peng X, et al. Neural-specific deletion of FIP200 leads to cerebellar degeneration caused by increased neuronal death and axon degeneration. J Biol Chem. 2010;285:3499–3509.
- Joo JH, Wang B, Frankel E, et al. The noncanonical role of ULK/ATG1 in ER-to-Golgi trafficking is essential for cellular homeostasis. Mol Cell. 2016;62:491–506.
- Wong E, Cuervo AM. Autophagy gone awry in neurodegenerative diseases. Nat Neurosci. 2010;13:805.
- Lumkwana D, Du Toit A, Kinnear C, et al. Autophagic flux control in neurodegeneration: progress and precision targeting—where do we stand? Prog Neurobiol. 2017;153:64–85.
- Mitra S, Tsvetkov AS, Finkbeiner S. Single neuron ubiquitin-proteasome dynamics accompanying inclusion body formation in huntington disease. J Biol Chem. 2009;284:4398–4403.
- Barmada SJ, Serio A, Arjun A, et al. Autophagy induction enhances TDP43 turnover and survival in neuronal ALS models. Nat Chem Biol. 2014;10:677.
- Nixon RA, Yang DS. Autophagy failure in Alzheimer’s disease—locating the primary defect. Neurobiol Dis. 2011;43:38–45.
- Loos B, Klionsky DJ, Wong E. Augmenting brain metabolism to increase macro-and chaperone-mediated autophagy for decreasing neuronal proteotoxicity and aging. Prog Neurobiol. 2017;156:90–106.
- Moruno-Manchon JF, Uzor NE, Ambati CR, et al. Sphingosine kinase 1-associated autophagy differs between neurons and astrocytes. Cell Death Dis. 2018;9:521.
- Rose C, Menzies FM, Renna M, et al. Rilmenidine attenuates toxicity of polyglutamine expansions in a mouse model of Huntington’s disease. Hum Mol Gen. 2010;19:2144–2153.
- Ntsapi C, Lumkwana D, Swart C, et al. New insights into autophagy dysfunction related to amyloid beta toxicity and neuropathology in Alzheimer’s disease. Int Rev Cell Mol Biol. 2018;336:321–361.
- Caccamo A, Majumder S, Richardson A, et al. Molecular interplay between mTOR, Aβ and tau: effects on cognitive impairments. J Biol Chem. 2010;285(16):13107–13120.
- Spilman P, Podlutskaya N, Hart MJ, et al. Inhibition of mTOR by rapamycin abolishes cognitive deficits and reduces amyloid-β levels in a mouse model of Alzheimer’s disease. PLoS One. 2010;Apr 5:e9979.
- Lashuel HA, Overk CR, Oueslati A, et al. The many faces of α-synuclein: from structure and toxicity to therapeutic target. Nat Rev Neurosci. 2013;1:38.
- Kimmelman AC, White E. Autophagy and tumor metabolism. Cell Metab. 2017;25:1037–1043.
- Rybstein MD, Bravo-San Pedro JM, Kroemer G, et al. The autophagic network and cancer. Nat Cell Biol. 2018;3:243.
- Xie X, White EP, Mehnert JM. Coordinate autophagy and mTOR pathway inhibition enhances cell death in melanoma. PLoS One. 2013;8:e55096.
- Noguera-Ortega E, Amaravadi RK. Autophagy in the tumor or in the host: which plays a greater supportive role? Cancer Discov. 2018;8:266–268.
- Bhat P, Kriel J, Priya BS, et al. Modulating autophagy in cancer therapy: advancements and challenges for cancer cell death sensitization. Biochem Pharmacol. 2018;147:170–182.
- Kriel J, Müller-Nedebock K, Maarman G, et al. Coordinated autophagy modulation overcomes glioblastoma chemoresistance through disruption of mitochondrial bioenergetics. Sci Rep. 2018;8:10348.
- Rangwala R, Leone R, Chang YC, et al. Phase I trial of hydroxychloroquine with dose-intense temozolomide in patients with advanced solid tumors and melanoma. Autophagy. 2014;10:1369–1379.
- Rosenfeld MR, Ye X, Supko JG, et al. A phase I/II trial of hydroxychloroquine in conjunction with radiation therapy and concurrent and adjuvant temozolomide in patients with newly diagnosed glioblastoma multiforme. Autophagy. 2014;10:1359–1368.
- Alirezaei M, Kiosses WB, Fox HS. Decreased neuronal autophagy in HIV dementia: a mechanism of indirect neurotoxicity. Autophagy. 2008;4:963–966.
- Cho SJ, Lim HJ, Jo C, et al. Plasma ATG5 is increased in Alzheimer’s disease. Sci Rep. 2019;9:4741.
- Wu G, Wei G, Huang J, et al. Decreased gene expression of LC3 in peripheral leucocytes of patients with coronary artery disease. Eur J Clin Invest. 2011;4:958–963.
- Zhao K, Xu XS, Meng X, et al. Autophagy of monocytes attenuates the vulnerability of coronary atherosclerotic plaques. Coron Artery Dis. 2013;24:651–656.
- Bernard A, Jin M, Xu Z, et al. A large-scale analysis of autophagy-related gene expression identifies new regulators of autophagy. Autophagy. 2015;11:2114–2122.
- Kramer MH, Farre JC, Mitra K, et al. Active interaction mapping reveals the hierarchical organization of autophagy. Mol Cell. 2017;65:761–774.
- Behrends C, Sowa ME, Gygi SP, et al. Network organization of the human autophagy system. Nature. 2010;466:68.
- Martinez-Vicente M, Talloczy Z, Wong E, et al. Cargo recognition failure is responsible for inefficient autophagy in Huntington’s disease. Nat Neurosci. 2010;13:567.
- Wong YC, Holzbaur EL. The regulation of autophagosome dynamics by huntingtin and HAP1 is disrupted by expression of mutant huntingtin, leading to defective cargo degradation. J Neurosci. 2014 Jan 22;34(4):1293–1305.
- Weidberg H, Shvets E, Elazar Z. “Biogenesis and cargo selectivity of autophagosomes.”. Annu Rev Biochem. 2011;80:125–156.
- Lamark T, Kirkin V, Dikic I, et al. NBR1 and p62 as cargo receptors for selective autophagy of ubiquitinated targets. Cell Cycle. 2009;8:1986–1990.
- Jiang P, Mizushima N. LC3-and p62-based biochemical methods for the analysis of autophagy progression in mammalian cells. Methods. 2015;75:13–18.
- Toledo M, Batista-Gonzalez A, Merheb E, et al. Autophagy regulates the liver clock and glucose metabolism by degrading CRY1. Cell Metab. 2018;28:268–281.
- Green DR, Galluzzi L, Kroemer G. Metabolic control of cell death. Science. 2014;345:1250256.
- Lockshin RA. Programmed cell death 50 (and beyond). Cell Death Differ. 2016;23:10.
- Han K, Kim J, Choi MY. Quantitative indices of autophagy activity from minimal models. Theor Biol Med Model. 2014;11:31.
- Roth DM, Balch WE. Modeling general proteostasis: proteome balance in health and disease. Curr Opin Cell Biol. 2011;23:126–134.
- Han K, Kim J, Choi M. Autophagy mediates phase transitions from cell death to life. Heliyon. 2015;1:e00027.
- Cornish-Bowden A, Hofmeyr JH. Determination of control coefficients in intact metabolic systems. Biochem J. 1994;298:367–375.
- Jager KJ, Van Dijk PC, Zoccali C, et al. The analysis of survival data: the Kaplan–meier method. Kidney Int. 2008;74:560–565.
- Lopez A, Fleming A, Rubinsztein DC. Seeing is believing: methods to monitor vertebrate autophagy in vivo. Open Biol. 2018;8:180106.
- Siddiqi FH, Menzies FM, Lopez A, et al. Felodipine induces autophagy in mouse brains with pharmacokinetics amenable to repurposing. Nat Commun. 2019;10:1817.