
ABSTRACT
In solid tumors, cancer stem cells (CSCs) or tumor-initiating cells (TICs) are often found in hypoxic niches. Nevertheless, the influence of hypoxia on TICs is poorly understood. Using previously established, TIC-enrichedpatient-derived colorectal cancer (CRC) cultures, we show that hypoxia increases the self-renewal capacity of TICs while inducing proliferation arrest in their more differentiated counterpart cultures. Gene expression data revealed macroautophagy/autophagy as one of the major pathways induced by hypoxia in TICs. Interestingly, hypoxia-induced autophagy was found to induce phosphorylation of EZR (ezrin) at Thr567 residue, which could be reversed by knocking down ATG5, BNIP3, BNIP3L, or BECN1. Furthermore, we identified PRKCA/PKCα as a potential kinase involved in hypoxia-induced autophagy-mediated TIC self-renewal. Genetic targeting of autophagy or pharmacological inhibition of PRKC/PKC and EZR resulted in decreased tumor-initiating potential of TICs. In addition, we observed significantly reduced in vivo tumor initiation and growth after a stable knockdown of ATG5. Analysis of human CRC samples showed that p-EZR is often present in TICs located in the hypoxic and autophagic regions of the tumor. Altogether, our results establish the hypoxia-autophagy-PKC-EZR signaling axis as a novel regulatory mechanism of TIC self-renewal and CRC progression. Autophagy inhibition might thus represent a promising therapeutic strategy for cancer patients.
Abbreviations
ATG: autophagy related; BECN1: beclin 1; BNIP3: BCL2 interacting protein 3; BNIP3L: BCL2 interacting protein 3 like; CQ: chloroquine; CSC: cancer stem cells; CRC: colorectal cancer; HIF1A/HIF-1α: hypoxia inducible factor 1 subunit alpha; MAP1LC3/LC3: microtubule associated protein 1 light chain 3; PRKC/PKC: protein kinase C; SQSTM1/p62: sequestosome 1; TICs: tumor-initiating cells.
Introduction
Colorectal cancer (CRC) is among the most prevalent cancers worldwide, with more than 1.2 million new diagnoses and 600,000 deaths per year [Citation1], and limited therapeutic options available. The identification of cancer cells with tumor-initiating properties, so-called tumor-initiating cells (TICs) or cancer stem cells (CSCs), has greatly contributed to a better understanding of CRC and its initiation [Citation2]. TICs represent a rare subpopulation of cells that not only initiate tumor formation but also lead to the maintenance and dissemination of the disease. Additionally, TICs display increased chemoresistance, demonstrating the necessity of developing TIC-targeted therapies that could prevent disease progression and relapse.
The solid tumor mass is constantly exposed to low oxygen levels due to excessive cellular proliferation. Hypoxia has been associated with a more aggressive cancer phenotype, displaying increased invasion, metastasis formation, resistance to chemo- and radiotherapy, and an increased rate of tumor recurrence [Citation3]. Furthermore, several studies have highlighted a correlation between hypoxic signaling within tumors and poor patient prognosis [Citation3]. Interestingly, hypoxic regions in solid tumors have been shown to overlap with TIC niches [Citation4]. Nevertheless, the mechanisms underlying hypoxia-regulation of TICs still remain relatively poorly understood.
Cancer cells use macroautophagy/autophagy to facilitate their survival by maintaining cellular integrity when under strong environmental stimuli, such as hypoxia [Citation5,Citation6]. BNIP3 (BCL2 interacting protein 3) and BNIP3L (BCL2 interacting protein 3 like) are two HIF1A (hypoxia-inducible factor 1 subunit alpha) target genes that mediate the induction of autophagy under hypoxic conditions, thereby leading to cell survival [Citation5]. The autophagic machinery depends on the formation of autophagosomes, which involves two ubiquitin-like conjugation systems that are formed by the ATG12–ATG5 complex and by MAP1LC3/LC3 (microtubule-associated protein 1 light chain 3). The LC3-I form of the protein is lipidated and inserted into the phagophore (the precursor of the autophagosome) membrane as LC3-II, which results in the engulfment of the cargo protein due to its interaction with specific receptors. The autophagosomes then fuse with lysosomes, where lysosomal acid proteases promote the degradation of the cargo [Citation7]. Essential amino acids, such as nucleotides and fatty acids, as well as other byproducts of degradation, are exported back to the cytoplasm and serve as an energy source during starvation or hypoxia [Citation7].
EZR is a member of the ezrin-radixin-moesin (ERM) family. Upon phosphorylation at Thr567, EZR is localized under the apical membrane, where it connects actin filaments to membrane proteins. EZR has been implicated in tumor growth by inducing CRC cell survival, through the regulation of the expression of inhibitor of apoptosis proteins (IAPs) and BIRC5/survivin [Citation8], and metastasis dissemination in several types of cancer, including CRC (reviewed in [Citation9]). In addition, EZR expression in CRC patients has been shown to be associated with disease progression and poor survival [Citation10–Citation12]. Interestingly, hypoxia has been linked to increased EZR expression in pulmonary myofibroblasts. Increased proliferation and migration of these cells through aberrant dysregulation of cytoskeletal proteins can lead to hypoxia-induced pulmonary arterial hypertension (HPAH), a disease often associated with heart failure and death [Citation13]. Furthermore, we [Citation14] and others [Citation15] have recently shown that TICs are one key driving factor behind the dissemination of metastases. As both TICs and the EZR pathway are known to be essential for metastatic outgrowth, we hypothesized that EZR signaling may be involved in the survival of TICs.
In the current study, we have identified autophagy as one of the major pathways activated in hypoxic TICs. Importantly, we demonstrate that phosphorylation of EZR at Thr567, most likely through PRKCA/PKCα activation, is a vital factor responsible for the increased self-renewal capacity of TICs. Inhibition of autophagy led to a reduction in the level of p-EZR and ultimately to reduced tumor initiation and progression, both in vitro and in vivo. We hereby describe a novel mechanism by which hypoxia-induced autophagy drives tumor initiation and progression, and targeting of this pathway might lead to new therapeutic strategies for CRC.
Results
Hypoxia-induced increase in self-renewal of patient-derived TICs is maintained over several passages
The isolation and identification of TICs remains a challenging problem, partly due to the debatable effectiveness of the surface markers that are typically used for isolating and characterizing TICs [Citation16–Citation18]. To address these discrepancies, we have previously established and characterized different CRC spheroid cultures (SCs), derived both from patient samples and conventional CRC cell lines. By focusing on functional properties instead of surface marker expression, we demonstrated that our established SCs retained many important characteristics of their tumor of origin and show extensive TIC-like features, such as increased self-renewal capacity, tumorigenic potential, and chemoresistance [Citation14,Citation19–Citation21]. These TIC-cultures, as well as their adherent counterparts, have been fully characterized by our group in previous studies [Citation14,Citation19–Citation21].
In the current study, these TIC-enriched spheroid cultures were used (T6 [stage III], T18 [stage II], and T20 [stage IV], hereafter referred to as TICs) in order to investigate the effect of hypoxia in TICs. By exposing TICs and their adherent counterparts to 1% oxygen, we observed that hypoxia led to an arrest in cell division in adherent cells after three days of culture (Fig. S1A). However, in contrast to their adherent counterparts, TICs did not exhibit any cell division arrest and even after seven days we could observe no significant difference in the amount of late apoptotic cells between the normoxic and hypoxic conditions (Fig. S1B and S1C). This suggests that TICs might be capable of adapting to more hypoxic environments, such as those seen in solid tumors.
To further investigate the effect of hypoxia on the growth behavior of TICs, we assessed the self-renewal capacity of patient-derived TICs at 1% oxygen by performing limiting dilution assays. HIF1A protein expression was assessed in TICs exposed to hypoxic conditions (). Elaborating on research that we have previously conducted [Citation20,Citation21], we observed that hypoxia treatment increased the number of spheres in T6, T18, and T20 TIC cultures over the course of several passages (). We could also observe a hypoxia-mediated increase in self-renewal capacity at various cell doses, down to the single cell level (). The extreme limiting dilution analysis (ELDA) software was used to determine the sphere-forming cell (SFC) frequency of TICs under normal oxygen levels and under hypoxia. Hypoxia led to an increase in SFC frequency when compared to normoxia and this effect was observed for all tested TIC cultures over several passages (Table S1). Additionally, sphere size (thought to reflect spheroid proliferation) remained unchanged under hypoxia (Fig. S1D), even over several passages (Fig. S1E), suggesting that hypoxic conditions may not affect the proliferation of TICs but rather increase the self-renewal capacity of these cells.
Figure 1. Hypoxia increases the self-renewal capacity of patient-derived TIC cultures. (A) HIF1A protein expression under normoxic (N) and hypoxic (H) culturing conditions over 3 d (72 h) and 7 d in T6 TICs. TUBA staining was used as a loading control and HepG2 cells exposed to hypoxia for 24 h were used as a positive control (+). (B) Representative image of patient T6-derived TICs, cultured under normoxia (N) and hypoxia (H). Scale: 100 µm. (C-H) Self-renewal capacity as determined by the 1000 cell sphere formation assay (C-E) in T6 (C), T18 (D) and T20 (E) cultures and by the single cell assay (F-G) in T6 (F) and T18 (G) cultures. Sphere formation was observed over several passages (P). (H) Self-renewal capacity was determined by a limiting dilution assay at multiple cell doses under normoxia and hypoxia. Results from one experiment using T6 TICs are shown and ELDA was used to assess significance. C-G; Data are representative of at least three independent experiments. (I-J) Hypoxia induces the expression of stem cell markers. (I) Flow cytometry staining of POU5F1 in T18 TICs under normoxic and hypoxic conditions and quantification of mean fluorescence intensity (MFI) of POU5F1 in two independent experiments (data normalized to normoxia). (J) Flow cytometry staining of ALDH1A1 in T18 TICs under normoxic and hypoxic conditions and quantification of mean fluorescence intensity (MFI) of ALDH1A1 in two independent experiments (data normalized to normoxia). Data are presented as mean ± SD except for F, G, and H, which are presented as a mean with 95% confidence interval, *p < 0.05, **p < 0.01, ***p < 0.001, ns = not significant.
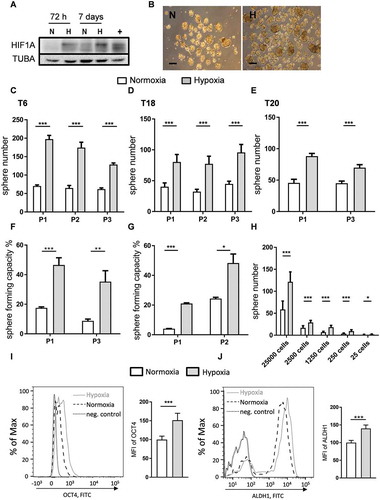
There are indications suggesting that hypoxia is capable of regulating the stem cell phenotype via induction of genes involved in stem cell function, such as POU5F1, NANOG, ALDH1A1, and SOX2 [Citation22]. As the effect of hypoxia on TIC gene expression appeared inconsistent (data not shown), we chose to focus on protein levels and, via the use of a specialized hypoxia chamber capable of maintaining more consistent O2 levels, analyzed two of the above-mentioned stem cell markers, POU5F1 and ALDH1A1, in hypoxic TICs via flow cytometry. We could confirm that hypoxia increased the expression of both POU5F1 () and ALDH1A1 (), further demonstrating that TICs are self-renewing under hypoxic conditions.
Autophagy is enriched in patient-derived TICs under hypoxia
To investigate the mechanism underlying the hypoxia-mediated increase in self-renewal potential of TICs, we performed gene expression profiling of patient-derived TIC cultures that had been maintained under normoxic and hypoxic conditions for seven days. Principal component analysis (PCA) revealed a clear separation between clusters derived from hypoxic and normoxic samples and showed that three principal components (PCs) are responsible for 47.6% of total data variability (Fig. S2A). Furthermore, hypoxia emerged as the primary source of variation in the gene expression profiling data of primary TICs (Fig. S2B).
In silico functional analysis, using the Ingenuity Pathway Analysis (IPA) software, predicted the enrichment and activation of autophagy in TICs derived from patient T18 after 7 d of hypoxic treatment (p-value:5.61E-05; activation z-score = 2.567) (Table S2). Five expression databases of autophagy-related genes were also implemented into the IPA. These were used in order to determine the extent of autophagy enrichment in the primary TICs. Hypoxia-treated T18 and T20 cultures were predicted to be enriched for autophagy-related genes, while T6 TICs were predicted to display a lower degree of enrichment ().
Figure 2. Autophagy is enriched in patient-derived TIC cultures exposed to hypoxia. (A) Bar plots showing the statistical significance (-log[p-value]) of autophagy in TICs derived from patients T6, T18 & T20 after 7 d of hypoxic treatment, as determined by IPA functional analysis using a combination of five different autophagy databases (see Material and Methods). Statistical threshold (red line) is set at -log(p-value) = 1.3. (B) Standardized expression of key autophagy genes in patient T18-derived TICs. Heat map of up- or downregulation of selected key autophagy genes in T18 TICs after 7 d treatment with hypoxia (H) and normoxia (N). Gene expression levels of BNIP3 and BNIP3L, targets of HIF1A, and key genes involved in the initiation of autophagy in hypoxia. Red indicates upregulation and blue downregulation. Significance is based on adjusted p-values (or FDR) of hypoxia-normoxia comparison after 7 d (C) Gene expression levels of BNIP3 and BNIP3L in T6-, T18-, and T20-derived TICs after 72 h of hypoxia (H) and normoxia (N). Representative figure of at least three independent experiments per TIC culture. Data are presented as mean ± SD, ***p < 0.001. (D-E) Immunohistochemical staining of BNIP3 (D) and BNIP3L (E) on paired CRC tissue microarrays. Matched tumor (CRC) and control mucosa (N) samples were scored for the intensity of BNIP3 (n = 62 matched samples) and BNIP3L (n = 63 matched samples) positive cells, ranging from 0 (= no signal) to 2 (= strong signal). Scale bar: 200 μm. Data are presented as mean ± SD, ***p < 0.001. Paired t-tests were used to assess the significance between tumor and normal counterpart tissues in D and E. (F) Relapse-free CRC patient survival, according to BNIP3L expression in the publicly available dataset GSE14333, *p < 0.05.
![Figure 2. Autophagy is enriched in patient-derived TIC cultures exposed to hypoxia. (A) Bar plots showing the statistical significance (-log[p-value]) of autophagy in TICs derived from patients T6, T18 & T20 after 7 d of hypoxic treatment, as determined by IPA functional analysis using a combination of five different autophagy databases (see Material and Methods). Statistical threshold (red line) is set at -log(p-value) = 1.3. (B) Standardized expression of key autophagy genes in patient T18-derived TICs. Heat map of up- or downregulation of selected key autophagy genes in T18 TICs after 7 d treatment with hypoxia (H) and normoxia (N). Gene expression levels of BNIP3 and BNIP3L, targets of HIF1A, and key genes involved in the initiation of autophagy in hypoxia. Red indicates upregulation and blue downregulation. Significance is based on adjusted p-values (or FDR) of hypoxia-normoxia comparison after 7 d (C) Gene expression levels of BNIP3 and BNIP3L in T6-, T18-, and T20-derived TICs after 72 h of hypoxia (H) and normoxia (N). Representative figure of at least three independent experiments per TIC culture. Data are presented as mean ± SD, ***p < 0.001. (D-E) Immunohistochemical staining of BNIP3 (D) and BNIP3L (E) on paired CRC tissue microarrays. Matched tumor (CRC) and control mucosa (N) samples were scored for the intensity of BNIP3 (n = 62 matched samples) and BNIP3L (n = 63 matched samples) positive cells, ranging from 0 (= no signal) to 2 (= strong signal). Scale bar: 200 μm. Data are presented as mean ± SD, ***p < 0.001. Paired t-tests were used to assess the significance between tumor and normal counterpart tissues in D and E. (F) Relapse-free CRC patient survival, according to BNIP3L expression in the publicly available dataset GSE14333, *p < 0.05.](/cms/asset/0c295d8a-7d94-483d-a35f-3c716f4e9ecd/kaup_a_1687213_f0002_c.jpg)
An analysis of the gene expression profiling data demonstrated that several autophagy-related genes, such as HIF1A, BIRC6 (baculoviral IAP repeat containing 6), and UVRAG, a well-known activator of the BECN1-PtdIns3K complex, were upregulated in hypoxia-treated TICs (). Most importantly, we observed a clear upregulation of BNIP3 and BNIP3L, two key genes involved in the initiation of autophagy under hypoxia and target genes of HIF1A [Citation5]. This enrichment of BNIP3 and BNIP3L was validated in our three hypoxia-treated patient-derived TIC cultures (). As expected [Citation5,Citation23], the expression of BNIP3 and BNIP3L decreased in stable HIF1A knockdown cultures under hypoxia, demonstrating that these genes are HIF1A-regulated (Fig. S2C). We next investigated the clinical relevance of BNIP3 and BNIP3L in the context of CRC. Using TMA’s of colorectal tumor tissue and their paired normal counterparts, we were able to demonstrate an increase in BNIP3 and BNIP3L protein levels in tumor samples (,). BNIP3 expression has already previously been shown to be increased in tumor samples derived from other cancer types, such as non-small-cell lung cancer and breast cancer [Citation23–Citation25]. Its expression has also been associated with hypoxia [Citation23,Citation24], an invasive phenotype [Citation25], and poor survival prognosis [Citation24]. Using publicly available datasets, we were able to show that high expression of BNIP3L correlated with shorter disease-free survival time ( and Fig. S2D). Our findings strongly suggest that both BNIP3 and BNIP3L could potentially be clinically relevant in CRC patients, although further validation studies are necessary to reinforce our observations.
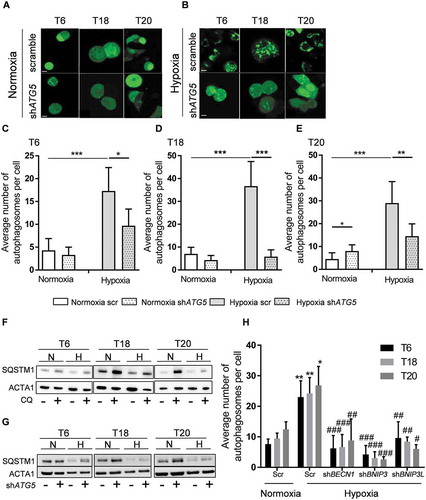
We also examined the presence of LC3A-coated autophagosomes in our samples. An increased level of autophagosomes was observed in hypoxic primary TICs (, upper panels, the scramble [scr] conditions under hypoxia and normoxia, and for quantification). These findings corroborate our gene expression profiling data and confirm the activation of autophagy in TICs under hypoxic conditions.
Figure 3. Hypoxia induces the formation of autophagosomes and autophagy inhibition via ATG5 knockdown decreases the number of autophagosomes in hypoxic TICs. (A-B) Control (scr) and ATG5-defective (shATG5) T6, T18 and T20-derived TICs were transfected with GFP-LC3 and cultivated in (A) normoxic and (B) hypoxic environments (overnight, at 0.1% oxygen level, see Material and Methods). Autophagosomes (green dot-like structures) were visualized by confocal microscopy. Images represent three independent experiments, scale bar: 5 µm. (C-E) Quantification of the number of autophagosomes in control (scr) and ATG5-defective (shATG5) patient-derived (C) T6, (D) T18 and (E) T20 TICs cultured under normoxia or hypoxia. (F) SQSTM1 protein expression in normoxic (N) and hypoxic (H) TICs after the addition of chloroquine. Western blot images are representative of two independent experiments. (G) SQSTM1 protein expression in ATG5-defective (+) and scramble (-) TICs under normoxia (N) or hypoxia (H). Western blot images are representative of two independent experiments. (H) Detection and quantification of autophagosomes in TICs after BECN1, BNIP3, and BNIP3L knockdown. For the quantification of autophagosomes (C-E and H), ten cells were counted for each condition and the average number of autophagosomes was reported. Statistically significant differences are shown as *p < 0.05, **p < 0.01, ***p < 0.001. Figures displayed are representative figure of at least two independent experiments per TIC culture for C-E and H. In H, * represents statistical analysis between normoxia and hypoxia, whereas # represents the statistical analysis between the hypoxic scramble condition and the shBNIP3, shBNIP3L, and shBECN1 conditions.
Blocking key autophagy players reverses hypoxia-mediated effects in patient-derived TICs
BECN1, ATG5, BNIP3, and BNIP3L are key genes involved with the autophagic machinery [Citation7]. To evaluate to what extent autophagy is associated with the hypoxia-mediated phenotype of TICs, we inhibited autophagic flux in our patient-derived TIC cultures by targeting ATG5, a gene required for the maturation of autophagosomes [Citation26] (Fig. S3A and S3B). Interestingly, ATG5 knockdown considerably decreased the number of autophagosomes in hypoxic samples, further highlighting the induction of autophagy in hypoxic TICs (). Furthermore, the expression of autophagy substrate protein SQSTM1/p62 was reduced in all three primary TIC cultures after hypoxic treatment, and reversed by the addition of chloroquine, indicating that hypoxia increases the autophagic flux in primary TICs (). Additionally, ATG5 knockdown led to an accumulation of SQSTM1, demonstrating the inhibition of autophagic flux in ATG5 knockdown TICs (). We also assessed the role of other members of the autophagic cascade and observed reduced formation of autophagosomes () after stable knockdowns of BECN1, BNIP3, and BNIP3L (Fig. S3C-E). Altogether, our results suggest that inhibition of the autophagic flux partially reverses the hypoxia-induced phenotype in TICs.
Hypoxia-induced autophagy phosphorylates EZR through PRKCA in colon TICs
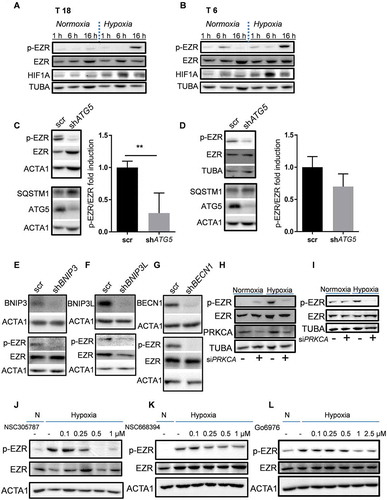
In order to investigate the mechanism underpinning autophagy-mediated regulation of hypoxia-treated TICs, we carried out high-throughput ELISA-based phospho-protein antibody arrays. We found that EZR phosphorylation on Thr567 was significantly upregulated under hypoxia. Conversely, inhibition of autophagy significantly reduced Thr567 phosphorylation (Table S3). First, we aimed to validate this data by evaluating the expression of EZR, as well as its Thr567 phosphorylated form, in primary colon TICs. Hypoxia treatment led to an increase in EZR phosphorylation in T18 () and T6 () TICs. We next assessed the phosphorylation of EZR upon ATG5 silencing. As suggested by the phosphoarray data, we observed a decreased level of phosphorylation in autophagy-inhibited patient-derived TIC cultures (,). Similarly, p-EZR was reduced when other autophagy-related genes were silenced, such as BNIP3 (), BNIP3L (), and BECN1 (). This clearly demonstrates that the autophagic pathway is involved in EZR activation. EZR has been shown to be activated by numerous different kinases, such as EGFR (epidermal growth factor receptor), PRKC, and IGF1R (insulin growth factor 1 receptor) [Citation9]. We first focused on EGFR as our array data suggested it to be highly upregulated in hypoxic T18 TICs and because blockage of the EGFR signaling pathway is already a well-established treatment method in late-stage CRC patients. However, when EGFR expression was reduced via siRNA, we did not observe any change in p-EZR (data not shown). Following this, we assessed the involvement of PRKCA, which has been previously shown to interact with EZR [Citation27] and whose activity in the phosphoarray data seemed to more closely resemble that of EZR (data not shown). In line with our phosphoarrays, we observed the activation of PRKC under hypoxic conditions, which seemed to correlate with EZR phosphorylation (Fig. S4A). In addition, EZR phosphorylation at Thr567 was reduced in hypoxic T6 and T18 TIC cultures after PRKCA knockdown (,, gene expression levels of PRKCA were reduced by 70% after siRNA transfection of TICs). Specific inhibition of PRKC-mediated EZR phosphorylation at Thr567 (NSC668394 and NSC305787), as well as general inhibition of PRKC (Go6976), were also able to reduce hypoxia-driven activation of EZR (-L). Altogether, these results suggest that PRKCA might be the kinase responsible for the phosphorylation of EZR under hypoxia.
Figure 4. Hypoxia induces EZR phosphorylation in an ATG5-dependent manner. (A-B) Phosphorylation of EZR at Thr567 under normoxic (N) and hypoxic (H) culturing conditions in (A) T18 and (B) T6 TICs. Data are representative of at least four independent experiments. (C-D) Activation of EZR after ATG5 knockdown in (C) T18 and (D) T6 TIC cultures after 16 h of hypoxia. Quantification was performed based on four independent experiments (mean ± SD) and is shown on the right side of the respective graph. *p < 0.05. (E-G) Activation of EZR following silencing of (E) BNIP3 (F) BNIP3L and (G) BECN1 after 16 h of hypoxia in T18 TIC cultures. Data are representative of three independent experiments and similar results were obtained for T6 TICs. (H-I) Effect of PRKCA siRNA on EZR phosphorylation under normoxia and hypoxia (16 h) in (H) T6 and (I) T18 TICs. Data are representative of two independent experiments per TIC culture. (J-K) Effect of NSC305787 and NSC668394, two chemical inhibitors of PKC-mediated EZR phosphorylation in hypoxic (16 h) T6 TICs. Data are representative of at least two independent experiments. (L) Effect of Go6976, a chemical inhibitor of PRKC, on the phosphorylation of EZR in hypoxic (16 h) T6 TICs. Data are representative of three independent experiments.
As a follow-up, we looked further into the downstream signaling of EZR, which we hoped might explain our pro-self-renewal TIC phenotype. EZR has been associated with a number of different downstream signaling pathways, including the AKT, MAPK/ERK, and MAPK14/p38 pathways [Citation28–Citation30]. While AKT and MAPK/ERK pathways remained unchanged under hypoxia and after EZR inhibition (Fig. S4B, and data not shown), MAPK14 phosphorylation increased under hypoxia and was reversed after EZR inhibition (Fig. S4C). Interestingly, MAPK14 MAPK pathway activation has already been associated with increased TIC chemoresistance and self-renewal capacity [Citation31]. Nevertheless, as MAPK14 is also a direct target of hypoxia, further experiments are needed to clearly determine the involvement of MAPK14 in the hypoxia-autophagy-PRKC-EZR pathway.
Inhibition of autophagy reverses the hypoxia-mediated self-renewal capacity of patient-derived TICs
To further determine the role of autophagy in the aggressive phenotype of colon TICs, we investigated the effects of autophagic inhibition on the self-renewal capacity of patient-derived TICs under hypoxic conditions. To do this, we carried out single-cell sphere formation and 3D colony formation assays. Inhibition of autophagy by stable knockdown of ATG5 did not seem to have a significant effect on sphere formation capacity under normal oxygen conditions. However, inhibition of autophagy did lead to a significant decrease in sphere formation capacity in hypoxic TICs, thereby reversing the hypoxia-mediated phenotype of TICs on a single cell level (). The sphere size, a well-established measure of the proliferation rate, was not affected, as both knockdown and control conditions produced similarly sized spheres under both normoxia and hypoxia (Fig. S4D). In addition, and in agreement with our previous experiments, 3D colony formation potential of hypoxia-treated primary TIC cultures was decreased after ATG5 inhibition (). We further validated these findings by performing shRNA-mediated silencing of BNIP3, BNIP3L, and BECN1 – all crucial genes involved in the initiation of autophagy. Similar to what we saw with ATG5, silencing BNIP3, BNIP3L, or BECN1 decreased TIC colony formation under hypoxic conditions ( and Fig. S4E-G). Collectively, these results show that a stable inhibition of autophagy allows for the reversal of hypoxia-mediated self-renewal of colon TICs.
Figure 5. Inhibition of autophagy reverses hypoxia-mediated phenotype in patient-derived TICs. (A) Sphere-forming capacity (%) was determined by carrying out single cell assays in ATG5-defective (shATG5) and control (scr) T18 TICs under 10 d of normoxia (N) and hypoxia (H). Representative figure of 4 independent experiments. Data are presented as mean with a confidence interval of 0.95, p-value calculated using a chi-square test. (B) Colony numbers under hypoxia (H) for control (scr) and ATG5-defective (shATG5) TICs derived from patients T6, T18, and T20. Data are presented as a representative figure of at least 2 independent experiments per TIC culture, mean ± SD, ***p < 0.001. (C-E) Colony numbers after 10–14 d under normoxia (N) and hypoxia (H) for control (scr) and BECN1-defective (shBECN1) TICs derived from patients (C) T6, (D) T18 and (E) T20. (F-G) Colony numbers after 10–14 d of hypoxia for small inhibitor of EZR (NSC668394) treated (F) T6 and (G) T18 TICs. (H-I) Colony numbers after 10–14 d of hypoxia and Go6976 treatment for (H) T6 and (I) T18 TICs. For 3D clonogenic assays of C-I, data are representative of at least 3 independent experiments, mean ± SD, *p < 0.05, **p < 0.01, ***p < 0.001.
As mentioned previously, we observed EZR phosphorylation in colon TICs upon hypoxic treatment. This effect was ATG5-dependent and most likely due to PRKC kinase activity. To further understand the role of the PRKC-EZR activation loop in the behavior of TICs, we performed 3D colony formation assays after inhibition of PRKC and EZR. First, we tried to lower the expression of EZR via a number of different gene knockdown techniques such as shRNA, siRNA, and CRISPR-Cas9. Unfortunately, none of these techniques allowed us to achieve a consistent and significant reduction in protein levels of EZR in TICs (Fig. S5A-F). We then switched to small molecule EZR inhibitors [Citation32], which have recently been described to be specific for EZR over the other ERM proteins [Citation32] and that did not induce cell death in our TIC cultures (Fig. S6G). Importantly, we found that most TICs, in comparison to differentiated adherent cells, almost exclusively express EZR, with MSN (moesin) being expressed to a much lesser degree compared to adherent cells and RDX (radixin) expression being completely absent (Fig. S5H-J). Therefore, taken altogether, the observed effect of the small inhibitors described below is very likely to be due to their direct effect on EZR. In both tested cases, inhibition of EZR (,, and Fig. S5K) and PRKC (,) led to a drastic reduction in hypoxia-induced self-renewal capacity of TICs. These results suggest that hypoxia-induced autophagy leads to PRKC-EZR activation, which subsequently drives self-renewal of TICs through the activation of other downstream players.
Inhibition of autophagy impairs tumorigenic properties of TICs in vivo
Chloroquine (CQ) is a broad inhibitor that blocks late autophagic events by preventing the fusion of autophagosomes with lysosomes, preventing their subsequent degradation. We observed reduced tumor growth and weight in immune-deficient CQ-treated mice (,), further suggesting that autophagy inhibition is a potentially promising avenue of CRC treatment.
Figure 6. ATG5 deficiency limits tumor initiation and progression in vivo. (A) In vivo tumor growth after subcutaneous injection of 10,000 T18-derived TIC cells and subsequent intraperitoneal treatment with either CQ or PBS (n = 12 tumors per group). Data are presented as means tumor volumes (mm3) ± SEM. (B) T18 tumor weight after treatment with CQ or PBS, respectively. Data are presented as mean tumor weights (mg) ± SEM. (C) In vivo tumor growth after subcutaneous injection of 10,000 T20-derived TIC cells with/without stable knockdown of ATG5, n = 5 mice/group. (D-E) Tumor (D) growth and (E) weight in immune-deficient mice (NSG mice), 8 weeks after subcutaneous injection of 10,000 cells derived from primary T18 TICs, following a stable knockdown of ATG5 or respective control vector; n = 6/group. A representative ATG5 protein expression of extracted T18-derived xenografts is shown. All data are shown as mean ± SEM. Two-way ANOVA followed by the Tukey post-hoc test was used to test for statistical significance in A, C and D. Paired t-tests were used to assess significance in B, and E. *p < 0.05, ***p < 0.001 (F) p-EZR immunofluorescence staining in extracted xenograft tumors from (D). Scale bar: 100 µm. Representative images are shown (left panel) as well as the quantification of p-EZR-positive area (right panel). Four mice out of the six from (D) were used, as the remaining two were used in (G). Data are presented as mean ± SD, *p < 0.05. (G) Serial in vivo limiting dilution experiment with T18 TICs, following stable knockdown of ATG5 or the corresponding control vector. After an initial round of xenotransplantation, two extracted tumors (from mice appearing in [D]) were dissociated and different cell doses (100, 250 and 500 cells) were subcutaneously injected into secondary recipient NSG mice. Secondary tumor incidence was evaluated after 12 weeks. Statistical significance was assessed with a Chi-square test ** p < 0.01. (H) Potential mechanism of action. Hypoxia within a solid tumor leads to activation of autophagy, especially in TICs. Kinases, such as PRKCA, are activated and further induce phosphorylation of EZR on Thr567 in TICs. EZR, most likely through MAPK14/p38 activation, leads to increased self-renewal capacity of TICs in vitro and in vivo.
![Figure 6. ATG5 deficiency limits tumor initiation and progression in vivo. (A) In vivo tumor growth after subcutaneous injection of 10,000 T18-derived TIC cells and subsequent intraperitoneal treatment with either CQ or PBS (n = 12 tumors per group). Data are presented as means tumor volumes (mm3) ± SEM. (B) T18 tumor weight after treatment with CQ or PBS, respectively. Data are presented as mean tumor weights (mg) ± SEM. (C) In vivo tumor growth after subcutaneous injection of 10,000 T20-derived TIC cells with/without stable knockdown of ATG5, n = 5 mice/group. (D-E) Tumor (D) growth and (E) weight in immune-deficient mice (NSG mice), 8 weeks after subcutaneous injection of 10,000 cells derived from primary T18 TICs, following a stable knockdown of ATG5 or respective control vector; n = 6/group. A representative ATG5 protein expression of extracted T18-derived xenografts is shown. All data are shown as mean ± SEM. Two-way ANOVA followed by the Tukey post-hoc test was used to test for statistical significance in A, C and D. Paired t-tests were used to assess significance in B, and E. *p < 0.05, ***p < 0.001 (F) p-EZR immunofluorescence staining in extracted xenograft tumors from (D). Scale bar: 100 µm. Representative images are shown (left panel) as well as the quantification of p-EZR-positive area (right panel). Four mice out of the six from (D) were used, as the remaining two were used in (G). Data are presented as mean ± SD, *p < 0.05. (G) Serial in vivo limiting dilution experiment with T18 TICs, following stable knockdown of ATG5 or the corresponding control vector. After an initial round of xenotransplantation, two extracted tumors (from mice appearing in [D]) were dissociated and different cell doses (100, 250 and 500 cells) were subcutaneously injected into secondary recipient NSG mice. Secondary tumor incidence was evaluated after 12 weeks. Statistical significance was assessed with a Chi-square test ** p < 0.01. (H) Potential mechanism of action. Hypoxia within a solid tumor leads to activation of autophagy, especially in TICs. Kinases, such as PRKCA, are activated and further induce phosphorylation of EZR on Thr567 in TICs. EZR, most likely through MAPK14/p38 activation, leads to increased self-renewal capacity of TICs in vitro and in vivo.](/cms/asset/ec04e192-1d69-46ac-bec8-f77f985385dc/kaup_a_1687213_f0006_c.jpg)
Nevertheless, as off-target effects of chloroquine may also be responsible for this observed effect, we analyzed the tumorigenicity of patient-derived TICs in immune-deficient mice following shRNA-mediated silencing of ATG5. Silencing of the ATG5 gene in subcutaneously injected immune-deficient mice resulted in tumors of smaller weight and lower volume (, and Fig. S6A). ATG5 levels remained low in extracted xenografts and correlated with an increase in SQSTM1 expression ( and Fig. S6B), suggesting that the suppression of the autophagic pathway was responsible for reduced in vivo tumor growth. Additionally, in line with our in vitro data, p-EZR expression was significantly reduced in extracted xenografts after ATG5 silencing (), indicating that the pathway is also active and relevant as a regulatory mechanism of in vivo tumor initiation. Furthermore, we aimed to determine whether inhibition of autophagy resulted in reduced TIC tumor-forming capacity. Serial transplantation experiments, which are considered to be the gold standard for evaluating TIC capacity, were carried out in order to study the impact of autophagy inhibition on in vivo self-renewal capacity. Cells derived from primary tumors were serially transplanted in secondary xenografts. Strikingly, low dose injections of ATG5-silenced cells into secondary recipient mice led to reduced tumor incidence, thereby demonstrating impaired in vivo self-renewal capacity (). Of note, as with the primary xenograft, we also observed a reduction in tumor weight in ATG5-silenced mice (Fig. S6C).
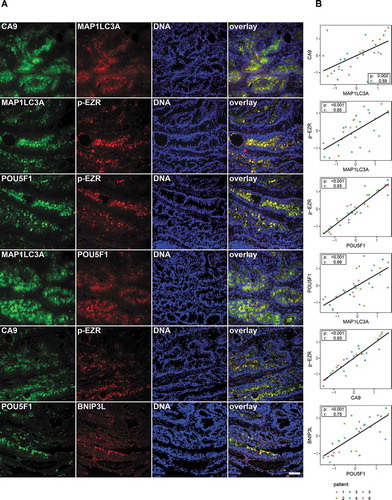
We next wondered whether the identified signaling pathway may also be of relevance in human patients. For this, we used human CRC samples and stained tumor sections for HIF1A, MAP1LC3A, and p-EZR. Our observations showed that hypoxic regions (with high HIF1A expression) are also highly positive for LC3A, a well-known marker of autophagy. In addition, IHC image analysis suggested that p-EZR staining is often located in hypoxic/autophagic regions of the tumor (Fig. S7A for controls and S7B). To further validate this data we carried out immunofluorescence stainings on primary CRC tissues ( and Fig. S7C for patient characteristics including TNM staging as well as the HE staining) and analyzed the co-localization of the different members of the identified signaling pathway in human TICs (herein defined as POU5F1-positive cells). Based on LC3A, BNIP3L, and CA9 stainings we were able to verify their presence in POU5F1-positive cells. Additional experiments also confirmed that p-EZR was present in human TICs and co-localized with LC3A, BNIP3L, and CA9, suggesting that the hypoxia-autophagy-EZR pathway is active in the same population of human TICs (,). Taken together, our results suggest that the hypoxia-autophagy-EZR pathway is activated in human primary CRC tissues and is clinically relevant. By extension, targeting the hypoxia-autophagy-EZR axis may, therefore, lead to new therapeutic interventions.
Figure 7. The relevance of the hypoxia/autophagy/EZR pathway in human TICs. (A) Immunofluorescence staining and colocalization in human tumor tissues (from six patients) for CA9 (a downstream target of HIF1A), BNIP3L, MAP1LC3A, p-EZR, and POU5F1 (refer to Fig. S7 for patient characteristics including TNM staging and HE stainings). The specificity of all used antibodies was carefully validated (please see Material and Methods and Supplementary data). Scale bar: 100 µm. (B) Staining correlation in human CRC tissues. Measures were standardized (z-score) for each patient. Dot colors indicate different patients. A repeated measure correlation test was performed in order to account for the within-individual association of paired measures (using the rmcorr package in R; see Material and Methods). The rmcorr r coefficient and the Holm adjusted p-values are reported on each plot.
Discussion
Over the last couple of years, oxygenation status of the tumor has been reported to be tightly linked to aggressive behavior. This is, in part, explained by the fact that hypoxia is the major driving force behind tumor vascularization and invasion [Citation33,Citation34]. Moreover, hypoxic regions within a tumor have also been found to overlap with cancer stem cell niches [Citation35] and hypoxia itself has been shown to enhance self-renewal in embryonic stem cells [Citation36]. Similarly, hypoxic conditions contribute to increased self-renewal of breast and glioma TICs [Citation35,Citation37,Citation38]. In regards to CRC, Yeung and colleagues used TICs derived from CRC cell lines to demonstrate that TICs form more undifferentiated colonies under hypoxic conditions and more differentiated structures under normal oxygen levels [Citation39]. We were interested in evaluating how hypoxia influences primary patient-derived TIC cultures by taking advantage of our recently established cultures [Citation19]. Our results, reported here, strongly suggest that hypoxia is a promoter of self-renewal in patient-derived TICs. This hypoxia-induced phenotype may help to explain why hypoxia has been linked with increased disease aggression and poorer prognosis [Citation40].
To date, the exact mechanism through which hypoxia, via HIFs and/or other regulators, influences the fate of colon TICs has not yet been fully elucidated. Recently, we have shown that hypoxia enhances the self-renewal capacity of colon TICs through a MIR210 (microRNA 210)-induced glycolytic phenotype that correlates with enhanced tumorigenicity and TIC self-renewal [Citation20,Citation41]. In the current study, we observed the enrichment and increased activation of autophagy in patient-derived TIC cultures after hypoxia treatment. We show that the inhibition of autophagy (achieved by knocking down the major autophagic genes BECN1, ATG5, BNIP3, and BNIP3L) reverses the increased self-renewing capacity of patient-derived TICs under hypoxia. Additionally, we provide evidence that impaired autophagy leads to reduced tumor initiation and growth in vivo. Along these lines, inhibition of the autophagic flux has also been shown to decrease the survival of pancreatic [Citation42] and liver [Citation43] TICs under oxygen-deprived conditions and autophagosomes have been discovered to exist in hypoxic tumor regions [Citation44]. In addition, hypoxia-induced autophagy is also involved in immunoresistance mechanisms, as it has been shown to result in impaired T-lymphocyte-mediated cell lysis of tumor cells and reduced NK-mediated killing efficiency [Citation45,Citation46].
It is becoming more generally accepted that the autophagic machinery contributes to TIC survival in response to changes in the tumor microenvironment. BECN1, involved in the initiation of the autophagic pathway, has been shown to promote the survival of breast CSCs (but not bulk cancer cells) and to contribute to their tumorigenicity in vivo [Citation47]. ATG4A, another key player in the autophagy pathway was shown to be involved in the maintenance of breast TICs and to regulate breast cancer cell tumorigenicity in vivo [Citation48]. Autophagy has been related to therapy resistance in cancer cells in general and more specifically in TICs [Citation49–Citation51]. In colon TICs, autophagy has been shown to promote resistance to paclitaxel by inhibiting apoptosis and upregulating CDX1 (caudal type homeobox 1) [Citation50]. Thus, autophagy inhibitors could potentially be employed to increase the sensitivity of TICs to anti-cancer therapies. In addition, a recent study showed that ATG7 deficiency in intestinal epithelial cells prevents the formation of pre-cancerous lesions in APC± mice by enhancing anti-tumor responses [Citation52]. As such, therapies targeting the autophagy pathway may lead to multiple beneficial effects, such as increased tumor cell death and tumor sensitization to immunotherapies.
We identified EZR, a member of the ERM proteins, as a potential candidate involved in the hypoxia-induced autophagy-mediated phenotype of colon TICs. In line with our data, phosphorylation of EZR at Thr567 by PRKC has been shown to be highly regulated during the osteosarcoma metastasis [Citation53]. However, EZR could also potentially be activated through the activity of other kinases. Thr567 phosphorylation of EZR by Rho kinase has been linked to invasive hepatocellular carcinoma and poor in vivo survival [Citation54]. Similarly, increased phosphorylation of EZR at the Thr567 site has been observed in CRC-derived liver metastasis [Citation8]. Phosphorylation of EZR at Thr567 is known to occur downstream of IGF1R signaling in CRC samples, suggesting that it may play a key role in the regulation of cell survival in IGF1R-dependent CRC cells [Citation8]. We identified a number of other activated proteins in the phospho-array data, which might also play an important role in the hypoxia-induced phenotype of TICs. For example, we could observe phosphorylation of HDAC6 under hypoxia, which was reversed after efficient ATG5 knockdown (data not shown), suggesting that epigenetic modifications might also play a role in the hypoxia-induced phenotype of TICs. Along similar lines, a recent study has highlighted the role of HDAC6 as an important regulator of pluripotency markers and stemness in TICs [Citation55]. Further research, however, is necessary in order to better unravel the mechanisms that underpin hypoxia-induced self-renewal of TICs.
In conclusion, we highlight autophagy as a potential mechanism underlying the hypoxia-mediated increase in self-renewal of patient-derived TIC cultures, an effect that is at least partially driven in a PRKCA-EZR-dependent manner. Taken together, hypoxia can be seen as a potential regulator of both autophagy and TIC behavior. Our findings demonstrate that increasing our understanding of the functional relevance of autophagy within the tumor microenvironment, as well as targeting autophagy within tumors, represents a promising therapeutic avenue that may allow for the evasion of drug resistance, thereby strengthening the effects of other anticancer therapies.
Materials and methods
Patient, tissue microarrays, and staining
Human colon tissue samples were collected by the Laboratoire National de Santé (LNS) and the Integrated Biobank of Luxembourg (IBBL, https://www.ibbl.lu), in accordance with institutional guidelines. All human samples used in the scope of this work were donated freely and written informed consent for the use of the samples in research was obtained from the donors. Ethical approval was obtained from the Comité National d’Ethique de Recherche, Luxembourg (Reference 201009/09) and from the institutional Ethics Review Panel (ERP-16-032). Tissue microarray (TMA) blocks were prepared for 63 primary CRC samples and paired normal colon counterparts, following standard procedures [Citation56]. Immunohistochemical staining was performed on an automated Benchmark XT device (Ventana, Tucson, AZ, USA) using the CC2 antigen retrieval solution (Cell Conditioning 2, pH 8.4,) for 32–36 min. Following primary antibodies were applied on serial sections: anti-HIF1A/HIF-1α rabbit polyclonal antibody (LSBio, LS-B495) at 1:200 dilution, anti-MAP1LC3B/LC3B rabbit polyclonal antibody (Sigma Aldrich, HPA053767) at 1:500 dilution, and anti-p-EZR (Thr567)-p-RDX/Radixin (Thr564)-p-MSN/Moesin (Thr558) (48G2) rabbit monoclonal antibody (Cell Signaling Technology, 3726) at 1:100 dilution with an incubation time of 32 min. The same anti-BNIP3 and anti-BNIP3L antibodies as referred to in the western blot paragraph were also used. For the detection of HIF1A, the primary antibody OptiView DAB IHC detection kit was used, while for p-EZR and LC3A, the UltraView DAB IHC detection kit (Ventana) was used. Appropriate positive and negative controls were included and kidney tissue was used as a positive control for HIF1A staining.
For immunofluorescence staining, the following antibodies were used: anti-MAP1LC3B (Cell Signaling Technology, 2775 and Santa Cruz Biotechnology, sc-271625), anti-BNIP3L (Cell Signaling Technology, 12396), anti-CA9 (Invitrogen, MA5-16318), p-ERM (3726S), and anti-POU5F1/OCT4 (Invitrogen, MA5-31458 and Abcam, ab18976). Fluorescence stainings were carried out on 7 μm cryosections derived from six human CRC samples (tumor stages 1 to 3) which were fixed in acetone and stained with the indicated primary antibodies. A mixture of goat anti-mouse IgG (Invitrogen, AF448, A-10667) and donkey anti-rabbit IgG (Invitrogen, AF568, A10042) was used as a secondary antibody. All antibodies were used at a 1:200 dilution. Nuclei were visualized with DAPI. Sections were mounted using fluorescent mounting media (SouthernBiotech, 0100–20). For each patient, two sections were visualized per staining. Pictures were acquired with the OLYMPUS IX83 microscope. Five regions per patient were further analyzed and the fluorescence intensity of each staining was measured using ImageJ (NIH). Sections stained with only secondary antibodies were used as negative controls. Correlation studies were carried out in order to identify any potential colocalization of staining. To examine co-staining in immunofluorescence sections, background-corrected fluorescence intensities were standardized (z-score) for each patient and antibody. A repeated measure correlation was performed using the R environment (v3.6.0; https://www.R-project.org/) and the R package rmcorr (v0.3.0 [Citation57];). P-values were adjusted for multiple testing using the Holm method.
Cryosections (7 μm) of scramble and ATG5 knockdown xenografts were prepared on a cryotome (Leica CM1850 UV Cryostat). Sections were fixed in acetone and stained for p-ERM (3726S) and donkey anti-rabbit IgG or only the secondary antibody control. Nuclei were visualized using DAPI. Sections were mounted with fluorescent mounting media and the resulting images were acquired with the OLYMPUS IX83 microscope. The positive area of each staining was determined by applying a threshold in ImageJ. Acquired data were normalized to the average value of the scramble group.
Cell culture, hypoxic conditions, and reagents
Primary cultures T6, T18, and T20, which were established from fresh patient material and fully characterized, were maintained in spheroid culture (SC) conditions, as previously described [Citation19]. Adherent counterparts were cultivated in DMEM-F12 (Lonza, BE12-719F), supplemented with 10% fetal bovine serum (Thermo Fisher, 10270–106) and 100 U/mL penicillin and streptomycin (Thermo Fisher, 15140122).
Throughout the study, hypoxia was achieved by maintaining cells in a hypoxic incubator (Hera Cell 150, Thermo Electron Corporation). For long-term cultures, cells were maintained at 1% oxygen levels. For short-term cultures (protein time kinetics, phospho-protein arrays, and autophagosome detection), 0.1% oxygen levels overnight (16 h) were applied in a hypoxia chamber (Invivo2 400, Ruskinn).
Small inhibitors of EZR phosphorylation (BioConnect BV, NSC 305787 and Fisher Scientific, NSC 668394) have been described previously [Citation32]. Blocking PKC was achieved by using the chemical inhibitor Gö6976 (Calbiochem, CAS 136194-77-9).
Viral transductions
Ready-to-use lentiviral particles were used to generate spheroids with stable knockdowns of ATG5 (sc-41445-V), BECN1 (sc-29797-V), BNIP3 (sc-37451-V), BNIP3L (sc-37453-V), HIF1A (sc-35561-V), and EZR (sc-35349-V) via short hairpin RNA or respective control vectors (Santa Cruz Biotechnology). Cells were transduced at a multiplicity of infection (MOI) of 3–5 and selected for using puromycin (Invivogen, ant-pr-1). Transduction efficiency was verified via qPCR and western blot.
CRISPR/Cas9 lentiviral particles from Sigma Aldrich (format: [U6-gRNA/EF1a-puro-2A-Cas9-2A-GFP]) targeting exon5 (HS 0000107120) or exon9 (HS0000107098) were used to knock out EZR in TICs. Single clones were sequenced to assess the genome editing.
Transient siRNA transfections
Dissociated spheroid cultures (SCs) were transfected for 48 h according to the manufacturer’s instructions using the lipofectamine RNAiMAX reagent (Life Technologies,13778150) and a PRKCA-specific pool of four different siRNAs (Qiagen, 1027416) or with a respective negative control siRNA (Qiagen, 1027310). siRNA against EZR (Qiagen, 1027416 and Dharmacon, L-017370 and Acell Technology, E-017370) was used according to the manufacturer’s protocol.
Sphere and 3D colony-formation assays
In vitro self-renewal capacity was tested with sphere formation assays, as described previously [Citation19]. Limiting dilution assays were performed under SC conditions at different cell densities (ranging from 1 to 1,000). The cells were incubated in hypoxic or normoxic conditions for 7 d (sphere formation assays) or 10 d (limiting dilution assays). Afterward, both sphere numbers and sizes were measured under a microscope.
3D colony-formation assays were performed using a serum-free mix of 60% SCM medium and 40% methylcellulose medium, i.e. MethoCult® H4100 (StemCell Technologies, H4100), supplemented with bFGF (Miltenyi Biotec, 130-093-841 20 ng/mL) and EGF (Biomol, 50,349.5; 20 ng/mL). After 14 d, the resulting 3D colonies were counted under a microscope.
In vivo tumor formation assays
NOD scid gamma (NSG) mice were bred in-house and experiments were performed according to all applicable laws and regulations, after receiving approval by the institution’s animal experimentation ethics committee and the veterinarian service of the Ministry of Agriculture (Permit Number: 14-MDM-02). Tumor formation and in vivo self-renewal assays (serial transplantations) were performed as previously described [Citation14]. Cells were taken up in 100 µL of growth factor-reduced Matrigel (BD Biosciences, 356231) and subcutaneously injected in the flank of 8- to 10-week-old mice. To assess the effect of CQ treatment on tumor growth, 10,000 cells were injected subcutaneously and CQ (60 mg/kg/d) or PBS was administered via intra-peritoneal injections when tumors were palpable. Tumor growth was calculated based on the V = (π/6 × L × W × H) formula. The weight of resected tumors was assessed at the endpoint of the experiment.
Autophagosome detection
Spheroids were transfected with an empty plasmid or a GFP-LC3-encoding vector (kindly provided by N. Mizushima, Tokyo Medical and Dental University, Tokyo) using the Neon™ transfection system (Invitrogen) as described in Noman et al. [Citation58]. After 24 h of transfection, spheroids were plated in µ-Slide eight-well chambered coverslips (IBIDI, 80816) and incubated under normoxic or hypoxic conditions for the following 24 h along with CQ (60 µM). Autophagosomes were visualized in transfected normoxic and hypoxic spheroids using an LSM-510-Meta confocal microscope (Carl Zeiss).
Proliferation assay
Cells were dissociated and plated on regular 6-well plates at a density of 80,000 cells in FBS (10%) and penicillin/streptomycin (1%) supplemented DMEM-F12 for both normoxic and hypoxic conditions. Cell confluence was assessed daily using the IncuCyte FLR (Essen Bioscience).
CASP3 activity assay
Cells were plated in black 96-well µclear plates (Greiner, 655090) at a density of 20,000 per well. After 24 h, the cells were lysed in 50 mM HEPES (Sigma-Aldrich, H0887) 1% sucrose (Sigma, S0389), 0.1% CHAPS (Roth, 1479.3), 50 µM Ac-DEVD-AFC (BioVision, 1007), 25 mM DTT, pH 7.5. Fluorescence was then quantified using a microplate reader (400 nm excitation and 505 nm emission, CLARIOstarR [BMG-LABTECH]). As a positive control, cells were treated with Staurosporine (20 µM; Sigma Aldrich, S4400). In addition, a synthetic tetrapeptide inhibitor for CASP3 (DEVD-CHO, Alfa Aesar) was included in the assay as a negative control for apoptosis.
TdT-mediated dUTP nick-end labeling (TUNEL) assay
TUNEL assays, allowing the detection of late apoptotic cells, were performed using the DeadEnd™ Fluorometric TUNEL System (Promega, G3250) according to the manufacturer’s protocol. Spheres were briefly fixed via cytospins (EZ Cytofunnels, Thermo Scientific) in 4% methanol-free formaldehyde diluted in PBS and permeabilized using Triton® X-100 (Sigma, T8787). After a pre-equilibration step, DNA strand breaks were labeled with manufacturer-provided fluorescein-12-dUTP (at 37°C for 1 h. Then, DAPI was added and the localized green fluorescence of apoptotic cells was detected using fluorescence microscopy.
Cell lysis and western blot analysis
Cell lysis and western blot analysis were carried out as previously described [Citation14]. The following antibodies were used: SQSTM1/p62 (8025), EZR/ezrin (3145S), ATG5 (2630S), p-ERM (Thr567) (3726S), BNIP3 (13795S), BECN1/beclin-1 (3738S), p-MAPK14/p38 (4511), MAPK14/p38 (9212), p-AKT (4060), p-MAPK/ERK (4370), p-PRKC/PKC (Ser660; 9371), PRKCA/PKCα (2056), RDX/radixin (2636), and MSN/moesin (3150) were all obtained from from Cell Signaling Technology. AKT (sc-1619), MAPK3/ERK1 (sc-93), MAPK1/ERK2 (sc-154), and tubulin alpha (TUBA/α-tubulin; sc-32293) were purchased from Santa Cruz Biotechnology. HIF1A/HIF-1α (610959) and ACTA1/actin (MAB1501) were obtained from BD Bioscience and Merck Millipore, respectively. All antibodies for WB were used at a dilution of 1:1000. Secondary anti-mouse (7076S) and anti-rabbit (7074S) IgG HRP-linked antibodies from Cell Signaling Technology were used at a dilution of 1:5000. Chloroquine (60 μm; Sigma, C6628) was added to normoxic and hypoxic samples in order to study the autophagic flux.
Flow cytometry
Assessment of POU5F1/OCT4 levels and ALDH1A1 (aldehyde dehydrogenase 1 family member A1) detection was carried out via flow cytometry on a FACSCanto II (BD Biosciences). Cells were cultured at 1% O2 or normoxia for 48 h prior to analysis. POU5F1 expression was determined by intracellular flow cytometry. Samples were fixed in 4% PFA in PBS for 10 min, permeabilized using 0.01% saponin (Sigma, S7900), and stained with an anti-POU5F1/OCT4 antibody (Invitrogen, GT486) and a secondary goat anti-mouse antibody coupled to Alexa Fluor 488 (Invitrogen, A-10,667). Samples stained with only the secondary antibody were utilized as negative controls. All antibodies were used at a 1:100 dilution. ALDH1A1 activity assay was performed according to the protocol provided by the manufacturer (ALDEFLUOR, Stem Cell Technologies, 01700). Cell viability was assessed by staining dead cells with Zombie NIR according to the manufacturer’s protocol (BioLegend).
Real-time qPCR
RNA extractions, reverse transcriptions (RTs), and real-time qPCRs were carried out according to previously reported protocols [Citation14]. Reference genes used for qPCR were: EEF1A1 and YWHAZ. Primer pairs used for RT-qPCR are listed in either Table S4 or described previously [Citation19].
Gene expression profiling by microarrays
Microarray gene expression profiling experiments were performed at the Luxembourg Institute of Health (LIH) and were analyzed as previously described [Citation19]. A false discovery rate (FDR) < 0.05 and a |log2 fold change| > 1 were set as the significance cutoff values for differentially expressed genes (DEGs). Raw gene expression data are available from Array Express under the following accession number: E-MTAB-7354. DEGs were used to determine significantly deregulated canonical pathways with Ingenuity Pathway Analysis (IPA, Qiagen). Genes were mapped against five different autophagy-relevant gene lists in order to verify the predicted enrichment of the autophagic pathway in the different patients. List 1 (autophagy database from [Citation59] and the Human Autophagy Database [HADb, {61}] provided by the Luxembourg Institute of Health), List 2 (Autophagy gene list provided by IPA including the database by Homma and colleagues [Citation59] and the HADb [Citation60]), List 3 (autophagy database by [Citation59]), List 4 (HADb [Citation60]), and List 5 (autophagy gene list provided by IPA). Gene set enrichment analysis (GSEA) was used to identify significantly deregulated pathways.
Public datasets and survival analysis
The GSE14333 and GSE17538 datasets were used to assess the association between BNIP3L expression and relapse-free patient survival. “High” and “low” groups were separated at the median gene expression value. Kaplan-Meier curves were generated using the survival, ggplot2, and ggfortify R packages.
Phosphorylation profiling
Phosphorylation profiling was carried out using the Phospho Explorer Antibody Array, a high-throughput ELISA-based antibody array (Full Moon Biosystems). This array consists of 1318 antibodies (targeting proteins from over 30 signaling pathways) and allows for the examination of tyrosine and serine/threonine phosphorylation at specific sites. We used this array to compare TICs under normoxia and hypoxia (overnight, at 0.1% oxygen level), as well as ATG5-defective TICs and corresponding control TICs cultured under hypoxia. Cell pellets consisting of six million cells were sent to Full Moon Biosystems for automated analysis. Fold change expressions of below 0.5 and above 2 were used for the identification of potential target phospho-proteins and for subsequent validation experiments.
Statistical analysis
GraphPad Prism 5 software was used for statistical analysis. Unpaired Student’s t-tests were used to compare the two conditions and the two-way ANOVA test, along with Tukey posttests, on log-transformed data, were used to compare treatment effects in different groups and over time. All experiments were performed in at least three independent biological replicates and all associated data are reported as mean ± SD, unless otherwise stated. The extreme limiting dilution analysis software ELDA (http://bioinf.wehi.edu.au/software/elda/) was used to determine the estimated stem cell frequency for single-cell assays; the resulting self-renewal capacity is reported as mean with 95% confidence intervals (CI). Statistical analysis of in vivo experiments was done using a 2-way ANOVA followed by post-hoc Tukey’s multiple comparison tests.
Availability of data and materials
The datasets generated during the current study are available in the ArrayExpress database (https://www.ebi.ac.uk/arrayexpress/) under the accession number E-MTAB-7354.
Declarations
Ethical approval was obtained from the Comité National d’Ethique de Recherche, Luxembourg (Reference 201,009/09) and from the institutional Ethics Review Panel (ERP-16-032).
Mouse experiments were performed according to all applicable laws and regulations, after receiving approval by the institution’s animal experimentation ethics committee and the veterinarian service of the Ministry of Agriculture (Permit Number: 14-MDM-02).
Supplemental Material
Download Zip (50.3 MB)Acknowledgments
We would like to thank all the contributing surgeons and nurses from the Centre Hospitalier du Luxembourg, the Centre Hospitalier Emile Mayrisch and the Clinical and Epidemiological Investigation Centre of the Luxembourg Institute of Health (LIH) for their work with the patients. The authors would also like to thank their collaborators at the Integrated Biobank of Luxembourg (IBBL), particularly Dr. Fay Betsou and Dr. Nikolai Goncharenko for the overall set-up of the patient sample collection and RNA extraction. We are also grateful to Dr. Djalil Coowar and Dr. Marthe Schmit for managing the animal facility of the University of Luxembourg. We are thankful to all the members of the Genomics Research Unit of the LIH, especially Nathalie Nicot and Arnaud Muller, as well as Aurélien Ginolhac from the Bioinformatic Core Facility at the University of Luxembourg for performing the microarray experiments and/or for providing bioinformatics support. We would also like to thank Associate Professor Paul Wilmes for access to his microscope facility. Finally, we would like to thank Dr. Christelle Bahlawane from the IBBL for her assistance and invaluable input in critical discussions. MM would like to thank the Luxembourg National Research Fund for the support (FNR Pearl P16/BM/11192868).
Disclosure statement
No potential conflict of interest was reported by the authors.
Supplementary Material
Supplementary data for this article can be accessed here.
Correction Statement
This article has been republished with minor changes. These changes do not impact the academic content of the article.
Additional information
Funding
Related Research Data
References
- Siegel RL, Miller KD, Jemal A. Cancer statistics, 2016. CA Cancer J Clin [Internet]. 2016 [cited 2016 Sep 16]; 66:7–30. Available from: http://www.ncbi.nlm.nih.gov/pubmed/26742998
- Qureshi-Baig K, Ullmann P, Haan S, et al. Tumor-initiating cells: a criTICal review of isolation approaches and new challenges in targeting strategies. Mol Cancer [Internet]. 2017. [cited 2017 Apr 27]; 16:40. Available from: http://molecular-cancer.biomedcentral.com/articles/10.1186/s12943-017-0602–2
- Schito L, Semenza GL. Hypoxia-inducible factors: master regulators of cancer progression. Trends Cancer [Internet]. 2016 [cited 2018 Aug 22]; 2:758–770. Available from: http://www.ncbi.nlm.nih.gov/pubmed/28741521
- Carnero A, Lleonart M. The hypoxic microenvironment: a determinant of cancer stem cell evolution. BioEssays [Internet]. 2016 [cited 2016 Nov 2]; 38:S65–74.
- Bellot G, Garcia-Medina R, Gounon P, et al. Hypoxia-induced autophagy is mediated through hypoxia-inducible factor induction of BNIP3 and BNIP3L via their BH3 domains. Mol Cell Biol. 2009;29:2570–2581.
- Mazure NM, Pouysségur J. Hypoxia-induced autophagy: cell death or cell survival? Curr Opin Cell Biol. 2010;22:177–180.
- Mizushima N, Komatsu M. Autophagy: renovation of cells and tissues. Cell [Internet]. 2011 [cited 2017 Jan 23]; 147:728–741. Available from: http://www.ncbi.nlm.nih.gov/pubmed/22078875
- Leiphrakpam PD, Rajput A, Mathiesen M, et al. Ezrin expression and cell survival regulation in colorectal cancer. Cell Signal [Internet]. 2014 [cited 2016 Nov 7]; 100:130–134. Available from: http://linkinghub.elsevier.com/retrieve/pii/S0898656814000333
- Clucas J, Valderrama F. ERM proteins in cancer progression. J Cell Sci [Internet]. 2014; 127:267–275. Available from: http://www.ncbi.nlm.nih.gov/pubmed/24421310
- Wang H-J, Zhu J-S, Zhang Q, et al. High level of ezrin expression in colorectal cancer tissues is closely related to tumor malignancy. World J Gastroenterol [Internet]. 2009 [cited 2016 Nov 16]; 15:2016–2019. Available from: http://www.ncbi.nlm.nih.gov/pubmed/19399936
- Elzagheid A, Korkeila E, Bendardaf R, et al. Intense cytoplasmic ezrin immunoreactivity predicts poor survival in colorectal cancer. Hum Pathol [Internet]. 2008 [cited 2016 Nov 7]; 39:1737–1743. Available from: http://linkinghub.elsevier.com/retrieve/pii/S0046817708002232
- Korkeila EA, Sundström J, Pyrhönen S, et al. Carbonic anhydrase IX, hypoxia-inducible factor-1α, ezrin and glucose transporter-1 as predictors of disease outcome in rectal cancer: multivariate cox survival models following data reduction by principal component analysis of the clinicopathological pre. Anticancer Res. 2011;31:4529–4535.
- Yi B, Chen L, Zeng J, et al. Ezrin regulating the cytoskeleton remodeling is required for hypoxia-induced myofibroblast proliferation and migration. Front Cardiovasc Med [Internet]. 2015; 2:1–11. Available from: http://journal.frontiersin.org/Article/10.3389/fcvm.2015.00010/abstract
- Ullmann P, Rodriguez F, Schmitz M, et al. The miR-371∼373 Cluster Represses Colon Cancer Initiation and Metastatic Colonization by Inhibiting the TGFBR2/ID1 Signaling Axis. Cancer Res [Internet]. 2018 [cited 2018 Aug 22]; 78:3793–3808. Available from: http://www.ncbi.nlm.nih.gov/pubmed/29748374
- Dieter SM, Ball CR, Hoffmann CM, et al. Distinct types of tumor-initiating cells form human colon cancer tumors and metastases. Cell Stem Cell. 2011;9:357–365.
- Shmelkov SV, Butler JM, Hooper AT, et al. CD133 expression is not restricted to stem cells, and both CD133+ and CD133- metastatic colon cancer cells initiate tumors. J Clin Invest [Internet]. 2008 [cited 2015 Jul 11]; 118:2111–2120. Available from: http://www.pubmedcentral.nih.gov/articlerender.fcgi?artid=2391278&tool=pmcentrez&rendertype=abstract
- Kemper K, Grandela C, Medema JP. Molecular identification and targeting of colorectal cancer stem cells.Oncotarget. 2010;1:387–395. Available from: https://www.ncbi.nlm.nih.gov/pmc/articles/PMC3248116/.
- Dubash TD, Hoffmann CM, Oppel F, et al. Phenotypic differentiation does not affect tumorigenicity of primary human colon cancer initiating cells. Cancer Lett [Internet]. 2016 [cited 2016 Feb 24]; 371:326–333. Available from: http://www.ncbi.nlm.nih.gov/pubmed/26679053
- Qureshi-Baig K, Ullmann P, Rodriguez F, et al. What do we learn from spheroid culture systems? insights from tumorspheres derived from primary colon cancer tissue. PLoS One [Internet]. 2016 [cited 2016 Mar 4]; 11:e0146052. Available from: http://dx.plos.org/10.1371/journal.pone.0146052
- Ullmann P, Qureshi-Baig K, Rodriguez F, et al. Hypoxia-responsive miR-210 promotes self-renewal capacity of colon tumor-initiating cells by repressing ISCU and by inducing lactate production. Oncotarget [Internet]. 2016 [cited 2016 Sep 5]; Available from: http://www.ncbi.nlm.nih.gov/pubmed/27589845
- Ullmann P, Nurmik M, Schmitz M, et al. Tumor suppressor miR-215 counteracts hypoxia-induced colon cancer stem cell activity. Cancer Lett [Internet]. 2019 [cited 2019 Feb 26]; Available from: http://www.ncbi.nlm.nih.gov/pubmed/30790680
- Semenza GL. Dynamic regulation of stem cell specification and maintenance by hypoxia-inducible factors. Mol Aspects Med. 2016;47–48:15–23. Available from: https://doi.org/10.1016/j.mam.2015.09.004.
- Sowter HM, Ratcliffe PJ, Watson P, et al. HIF- 1-dependent regulation of hypoxic induction of the cell death factors BNIP3 and NIX in human tumors. Cancer Res [Internet]. 2001 [cited 2018 Jun 4]; 61:6669–6673. Available from: http://www.ncbi.nlm.nih.gov/pubmed/11559532
- Giatromanolaki A, Koukourakis MI, Sowter HM, et al. BNIP3 expression is linked with hypoxia-regulated protein expression and with poor prognosis in non-small cell lung cancer. Clin Cancer Res [Internet]. 2004 [cited 2018 Jun 5]; 10:5566–5571. Available from: http://www.ncbi.nlm.nih.gov/pubmed/15328198
- Sowter HM, Ferguson M, Pym C, et al. Expression of the cell death genes BNip3 and NIX in ductal carcinoma in situ of the breast; correlation of BNip3 levels with necrosis and grade. J Pathol [Internet]. 2003 [cited 2018 Jun 5]; 201:573–580. Available from: http://doi.wiley.com/10.1002/path.1486
- Glick D, Barth S, Macleod KF. Autophagy: cellular and molecular mechanisms. J Pathol [Internet]. 2010 [cited 2015 Apr 3]; 221:3–12. Available from: /pmc/articles/PMC2990190/?report=abstract
- Ng T, Parsons M, Hughes WE, et al. Ezrin is a downstream effector of trafficking PKC-integrin complexes involved in the control of cell motility. Embo J [Internet]. 2001 [cited 2018 Jun 5]; 20:2723–2741. Available from: http://www.ncbi.nlm.nih.gov/pubmed/11387207
- Khanna C, Wan X, Bose S, et al. The membrane-cytoskeleton linker ezrin is necessary for osteosarcoma metastasis. Nat Med [Internet]. 2004 [cited 2019 Jun 21]; 10:182–186. Available from: http://www.ncbi.nlm.nih.gov/pubmed/14704791
- Gautreau A, Poullet P, Louvard D, et al. Ezrin, a plasma membrane-microfilament linker, signals cell survival through the phosphatidylinositol 3-kinase/Akt pathway. Proc Natl Acad Sci [Internet]. 1999 [cited 2019 Jun 21]; 96:7300–7305. Available from: http://www.pnas.org/cgi/doi/10.1073/pnas.96.13.7300
- Ognibene M, Vanni C, Segalerba D, et al. The tumor suppressor hamartin enhances Dbl protein transforming activity through interaction with Ezrin. J Biol Chem [Internet]. 2011 [cited 2019 Jun 20]; 286:29973–29983. Available from: http://www.ncbi.nlm.nih.gov/pubmed/21712385
- Marengo B, De Ciucis CG, Ricciarelli R, et al. p38MAPK inhibition: a new combined approach to reduce neuroblastoma resistance under etoposide treatment. Cell Death Dis [Internet]. 2013 [cited 2019 Jun 21]; 4:e589. Available from: http://www.nature.com/articles/cddis2013118
- Bulut G, Hong S-H, Chen K, et al. Small molecule inhibitors of ezrin inhibit the invasive phenotype of osteosarcoma cells. Oncogene [Internet]. 2012 [cited 2016 Nov 17]; 31:269–281. Available from: http://www.nature.com/doifinder/10.1038/onc.2011.245
- Carmeliet P, Jain RK. Angiogenesis in cancer and other diseases. Nature [Internet]. 2000 [cited 2015 Feb 26]; 407:249–257. Available from: http://www.ncbi.nlm.nih.gov/pubmed/11001068
- Semenza GL. Targeting HIF-1 for cancer therapy. Nat Rev Cancer [Internet]. 2003 [cited 2015 Jan 5]; 3:721–732. Available from: http://www.ncbi.nlm.nih.gov/pubmed/13130303
- Li Z, Rich JN. Hypoxia and hypoxia inducible factors in cancer stem cell maintenance. Curr Top Microbiol Immunol [Internet]. 2010 [cited 2015 Jul 2]; 345:21–30. Available from: http://link.springer.com/10.1007/82_2010_75
- Chen H-F, Kuo H-C, Lin S-P, et al. Hypoxic culture maintains self-renewal and enhances embryoid body formation of human embryonic stem cells. Tissue Eng Part A [Internet]. 2010 [cited 2015 Jul 2]; 16:2901–2913. Available from: http://www.ncbi.nlm.nih.gov/pubmed/20533883
- Xing F, Okuda H, Watabe M, et al. Hypoxia-induced Jagged2 promotes breast cancer metastasis and self-renewal of cancer stem-like cells. Oncogene [Internet]. 2011 [cited 2015 Jun 22]; 30:4075–4086. Available from: http://www.ncbi.nlm.nih.gov/pubmed/21499308
- Soeda A, Park M, Lee D, et al. Hypoxia promotes expansion of the CD133-positive glioma stem cells through activation of HIF-1α. Oncogene [Internet]. 2009 [cited 2012 Oct 26]; 28:3949–3959. Available from: http://dx.doi.org/10.1038/onc.2009.252
- Yeung TM, Gandhi SC, Bodmer WF. Hypoxia and lineage specification of cell line-derived colorectal cancer stem cells. Proc Natl Acad Sci U S A [Internet]. 2011 [cited 2012 Mar 8]; 108:4382–4387. Available from: http://www.pubmedcentral.nih.gov/articlerender.fcgi?artid=3060223&tool=pmcentrez&rendertype=abstract
- Keith B, Johnson RS, Simon MC. HIF1α and HIF2α: sibling rivalry in hypoxic tumour growth and progression. Nat Rev Cancer [Internet]. 2012 [cited 2012 Mar 12]; 12:9–22. Available from: http://www.ncbi.nlm.nih.gov/pubmed/22169972
- Ullmann P, Nurmik M, Begaj R, et al. Hypoxia- and microrna-Induced metabolic reprogramming of tumor-initiating cells. Cells [Internet]. 2019 [cited 2019 Jun 25]; 8:528. Available from: http://www.ncbi.nlm.nih.gov/pubmed/31159361
- Rausch V, Liu L, Apel A, et al. Autophagy mediates survival of pancreatic tumour-initiating cells in a hypoxic microenvironment. J Pathol [Internet]. 2012 [cited 2015 Jul 30]; 227:325–335. Available from: http://www.ncbi.nlm.nih.gov/pubmed/22262369
- Song Y-J-J, Zhang -S-S-S, Guo X-L-L, et al. Autophagy contributes to the survival of CD133+ liver cancer stem cells in the hypoxic and nutrient-deprived tumor microenvironment. Cancer Lett [Internet]. 2013 [cited 2015 Jul 7]; 339:70–81. Available from: http://www.ncbi.nlm.nih.gov/pubmed/23879969
- Degenhardt K, Mathew R, Beaudoin B, et al. Autophagy promotes tumor cell survival and restricts necrosis, inflammation, and tumorigenesis. Cancer Cell. 2006;10:51.
- Janji B, Berchem G, Chouaib S. Targeting autophagy in the tumor microenvironment: new challenges and opportunities for regulating tumor immunity. Front Immunol [Internet]. 2018 [cited 2018 Nov 19]; 9:887. Available from: http://www.ncbi.nlm.nih.gov/pubmed/29922284
- Mgrditchian T, Arakelian T, Paggetti J, et al. Targeting autophagy inhibits melanoma growth by enhancing NK cells infiltration in a CCL5-dependent manner. Proc Natl Acad Sci [Internet]. 2017 [cited 2018 Nov 19]; 114:E9271–9. Available from: http://www.ncbi.nlm.nih.gov/pubmed/29078276
- Gong C, Bauvy C, Tonelli G, et al. Beclin 1 and autophagy are required for the tumorigenicity of breast cancer stem-like/progenitor cells. Oncogene [Internet]. 2013 [cited 2015 Jul 8]; 32:2261–2272, 2272e.1-11. Available from: http://www.pubmedcentral.nih.gov/articlerender.fcgi?artid=3679409&tool=pmcentrez&rendertype=abstract
- Wolf J, Dewi D, Fredebohm J, et al. A mammosphere formation RNAi screen reveals that ATG4A promotes a breast cancer stem-like phenotype. Breast Cancer Res [Internet]. 2013 [cited 2016 Sep 22]; 15:R109. Available from: http://www.pubmedcentral.nih.gov/articlerender.fcgi?artid=3978845&tool=pmcentrez&rendertype=abstract
- Bellodi C, Lidonnici MR, Hamilton A, et al. Targeting autophagy potentiates tyrosine kinase inhibitor-induced cell death in Philadelphia chromosome-positive cells, including primary CML stem cells. J Clin Invest [Internet]. 2009 [cited 2015 Jul 6]; 119:1109–1123. Available from: http://www.pubmedcentral.nih.gov/articlerender.fcgi?artid=2673867&tool=pmcentrez&rendertype=abstract
- Wu S, Wang X, Chen J, et al. Autophagy of cancer stem cells is involved with chemoresistance of colon cancer cells. Biochem Biophys Res Commun [Internet]. 2013 [cited 2016 Feb 23]; 434:898–903. Available from: http://www.ncbi.nlm.nih.gov/pubmed/23624503
- Vitale I, Manic G, Dandrea V, et al. Role of autophagy in the maintenance and function of cancer stem cells. Int J Dev Biol [Internet]. 2015 [cited 2016 Feb 23]; 59:95–108. Available from: http://www.ncbi.nlm.nih.gov/pubmed/26374531
- Lévy J, Cacheux W, Bara MA, et al. Intestinal inhibition of Atg7 prevents tumour initiation through a microbiome-influenced immune response and suppresses tumour growth. Nat Cell Biol [Internet]. 2015 [cited 2018 Nov 19]; 17:1062–1073. Available from: http://www.ncbi.nlm.nih.gov/pubmed/26214133
- Ren L, Hong SH, Cassavaugh J, et al. The actin-cytoskeleton linker protein ezrin is regulated during osteosarcoma metastasis by PKC. Oncogene [Internet]. 2009 [cited 2016 Nov 16]; 28:792–802. Available from: http://www.nature.com/doifinder/10.1038/onc.2008.437
- Chen Y, Wang D, Guo Z, et al. Rho kinase phosphorylation promotes ezrin-mediated metastasis in hepatocellular carcinoma. Cancer Res [Internet]. 2011 [cited 2016 Nov 16]; 71:1721–1729. Available from: http://cancerres.aacrjournals.org/cgi/doi/10.1158/0008-5472.CAN–09–4683
- Sharif T, Martell E, Dai C, et al. HDAC6 differentially regulates autophagy in stem-like versus differentiated cancer cells. Autophagy [Internet]. 2018 [cited 2018 Dec 14]; 1–21. Available from: http://www.ncbi.nlm.nih.gov/pubmed/30444165
- Letellier E, Schmitz M, Ginolhac A, et al. Loss of myosin Vb in colorectal cancer is a strong prognostic factor for disease recurrence. Br J Cancer. 2017;117:1689–1701.
- Bakdash JZ, Marusich LR. Repeated measures correlation. Front Psychol [Internet]. 2017 [cited 2019 Jun 19]; 8:456. Available from: http://www.ncbi.nlm.nih.gov/pubmed/28439244
- Noman MZ, Janji B, Kaminska B, et al. Blocking hypoxia-induced autophagy in tumors restores cytotoxic T-cell activity and promotes regression. Cancer Res [Internet]. 2011 [cited 2016 Jul 20]; 71:5976–5986. Available from: http://www.ncbi.nlm.nih.gov/pubmed/21810913
- Homma K, Suzuki K, Sugawara H. The Autophagy database: an all-inclusive information resource on autophagy that provides nourishment for research. Nucleic Acids Res [Internet]. 2011 [cited 2016 Sep 21]; 39:D986–90. Available from: http://www.ncbi.nlm.nih.gov/pubmed/20972215
- Moussay E, Kaoma T, Baginska J, et al. The acquisition of resistance to TNFα in breast cancer cells is associated with constitutive activation of autophagy as revealed by a transcriptome analysis using a custom microarray. Autophagy [Internet]. 2011 [cited 2018 Nov 19]; 7:760–770. Available from: http://www.ncbi.nlm.nih.gov/pubmed/21490427