
ABSTRACT
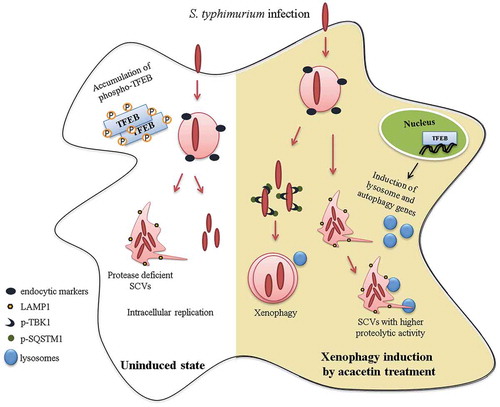
Macroautophagy/autophagy functions as a part of the innate immune system in clearing intracellular pathogens. Although this process is well known, the mechanisms that control antibacterial autophagy are not clear. In this study we show that during intracellular Salmonella typhimurium infection, the activity of TFEB (transcription factor EB), a master regulator of autophagy and lysosome biogenesis, is suppressed by maintaining it in a phosphorylated state on the lysosomes. Furthermore, we have identified a novel, antibacterial small molecule autophagy (xenophagy) modulator, acacetin. The xenophagy effect exerted by acacetin occurs in an MTOR (mechanistic target of rapamycin kinase)-independent, TFEB-dependent manner. Acacetin treatment results in persistently maintaining active TFEB in the nucleus and also in TFEB mediated induction of functional lysosomes that target Salmonella-containing vacuoles (SCVs). The enhanced proteolytic activity due to deployment of lysosomes results in clamping down Salmonella replication in SCVs. Acacetin is effective as a xenophagy compound in an in vivo mouse model of infection and reduces intracellular Salmonella burden.
Abbreviations
3-MA: 3-methyladenine; BafA1: bafilomycin A1; CFU: colony-forming units; DQ-BSA: dye quenched-bovine serum albumin; EEA1: early endosome antigen 1; FITC: fluorescein isothiocyanate; FM 4-64: pyridinium,4-(6-[4-{diethylamino}phenyl]-1,3,5-hexatrienyl)-1-(3[triethylammonio] propyl)-dibromide; GFP: green fluorescent protein; LAMP1: lysosomal associated membrane protein 1; MAPILC3/LC3: microtubule associated protein 1 light chain 3; MOI: multiplicity of infection; MTOR: mechanistic target of rapamycin kinase; RFP: red fluorescent protein; SCVs: Salmonella-containing vacuoles; SD: standard deviation; SDS: sodium dodecyl sulfate; SEM: standard mean error; SQSTM1: sequestosome 1; TBK1: TANK binding kinase 1; TFEB: transcription factor EB.
Graphical Abstract
Introduction
Intracellular pathogenic bacteria invade mammalian host cells in membrane bound vesicles called phagosomes (or endosomes). Among the various anti-microbial strategies, the host exerts its defense against intracellular bacteria by directing the phagosomes to fuse with the lysosomes for degradation. But the pathogens have evolved several survival mechanisms to prevent this fusion event. Prominent ploys include causing phagosome arrest or escaping to the cytoplasm by damaging phagosomes [Citation1]. Both these outcomes allow unrestricted access to the nutrient-rich cytoplasm and provide an ideal environment for the replication of bacteria. As a countermeasure, the host strategies include a selective macroautophagy (hereafter autophagy) process known as xenophagy to capture such intracellular pathogens by encapsulating them within a double-membrane vesicle known as xenophagosome and subject them for lysosomal clearance [Citation2–Citation4]. Several studies employing diverse bacterial species have highlighted the tactical interplay between the pathogen and host with respect to xenophagy [Citation5,Citation6].
Salmonella typhimurium is a well-studied bacterium species in xenophagy. They enter eukaryotic cells in phagosomes (or endosomes) mediated by virulence gene island, SPI-I that codes for type III secretion system. Salmonella can damage the endosomes and enter the nutrient-rich cytosol. Host response in capturing such cytosolic bacteria involves tagging them with ubiquitin [Citation7]. The ubiquitinated bacteria are cargoes that are recognized by a variety of xenophagy receptor proteins such as SQSTM1/p62 (sequestosome 1), CALCOCO2/NDP52 (calcium binding and coiled-coil domain 2/nuclear domain 10 protein 52), OPTN (optineurin), NBR1 (NBR1 autophagy cargo receptor) [Citation8]. These receptor proteins then bind to MAPILC3/LC3 (microtubule associated protein 1 light chain 3), a phagophore and autophagosomal membrane-associated protein [Citation9]. Alternatively, Salmonella containing endosomes-like structures mature into SCVs. These SCVs are spacious vacuoles that get acidified slowly as compared to phagosomes containing dead bacteria [Citation10]. Although SCVs resemble lysosomes due to their membrane composition, they are devoid of hydrolytic enzymes [Citation11].
Various studies have shown that immediately after Salmonella invasion, host cells undergo amino acid starvation and this energy stress leads to the activation of autophagy. However, this activation is reported to be transient and at later time points of infection, Salmonella prevents xenophagy-mediated capture [Citation12,Citation13].
Salmonella invasion in vivo occurs via gastrointestinal tract by infecting the intestinal epithelium followed by dissemination to other epithelial tissues such as liver, kidney, spleen and mesenteric lymph nodes. Recent studies have highlighted the role of xenophagy in restricting Salmonella infection in various organs of mice. However, akin to in cellulo models, elevated levels of xenophagy as seen during early stages of infection, drops to basal levels after 2 to 3 d post infection [Citation14].
Several studies have suggested that restoring the xenophagic potential by intervention through genetic or pharmacological means results in effective subjugation of intracellular pathogen survival [Citation15–Citation18]. Although the capture and degradation mediated processes are well studied, the host mechanisms that recognize the intracellular pathogens to induce xenophagy remain unclear. Moreover, the relevance of xenophagy in vivo, in mammalian immunity is also less explored. Recent studies have shown activation of TFEB ortholog in Caenorhabditis elegans, HLH30 (helix loop helix 30) during Staphylococcus aureus or Salmonella typhimurium infections [Citation19,Citation20]. TFEB is considered as a master regulator of autophagy and lysosomal genes [Citation21,Citation22]. The activity of TFEB is determined by its phosphorylation status. Phosphorylated TFEB remains in the cytoplasm on the lysosomal surface whereas the dephosphorylated TFEB translocate to the nucleus where it can activate its target genes which include lysosomal and autophagy genes [Citation23]. Some of the regulators reported to control TFEB activation include kinases like MTOR, MAPK/ERK (mitogen-activated protein kinase), GSK3B (glycogen synthase kinase 3 beta) and AKT1/PKB (AKT serine/threonine kinase 1) and a phosphatase, PPP3/calcineurin [Citation23–Citation27]. Inhibition of these negative regulator kinases or activation of calcineurin results in dephosphorylation of TFEB.
Thus, modulation of autophagy and lysosomal pathways can curb intracellular infection. We reasoned that a previously identified set of small molecule autophagy inducers from our laboratory may also contain potent xenophagy modulators. In this study we identify and characterize a xenophagy inducer, acacetin, which reduces intracellular infection of S. typhimurium in both in vitro and in vivo models. Acacetin induces TFEB dephosphorylation thereby increasing lysosomal and autolysosomal populations in the cell. This effect, during Salmonella infection, helps in restoring the acidification of SCVs thus restricting the replication of intracellular Salmonella. We also report that TFEB is kept inactivated during later time points of infection and prolonged activation by pharmacological means is beneficial. This compound-mediated restriction of S. typhimurium is also seen in a mouse model of infection by translocating TFEB to the nucleus and inducing xenophagy.
Results
Acacetin induces autophagy in yeast and mammalian cell lines
Acacetin was previously identified in our laboratory as an autophagy inducer in yeast based high throughput screening of ENZO library containing 502 pharmacologically active compounds [Citation28]. Briefly, the rates of degradation of luciferase containing peroxisomes in yeast were tested in the presence of the compounds [Citation29]. Those compounds that decreased the time taken for 50% peroxisome degradation compared to the untreated cells were selected as putative autophagy inducers. Acacetin in a dose-dependent manner increased the autophagic flux (Fig. S1A and B). Because autophagy is an evolutionarily conserved process, we next examined the effect of this compound on mammalian cells. In HeLa cells, as even 100 µM of acacetin did not appear to be toxic after 15 h of treatment (Fig. S1C), we used 50 µM of acacetin in our further experiments. HeLa cells transiently expressing tandem RFP-EGFP-LC3, when treated with the compound for 2 h in growth medium, showed a significant increase in autolysosome population suggesting an increase in fusion flux (,). Immunoblotting also revealed a concomitant increase in LC3-II levels (,). Although LC3-II accumulation is the most common indicator to check autophagy modulation, it could be either due to autophagy induction or a block in degradation. To verify if the compound is a bona fide autophagy inducer, cells were treated with the compound in the presence or absence of fusion inhibitor, bafilomycin A1 (BafA1). As shown in , immunoblotting with LC3 antibody revealed that the combination of BafA1 and the compound resulted in further increase in LC3-II levels over and above that of BafA1 treatment alone, indicating that the compound indeed induced autophagy. Similarly, autophagy receptor protein SQSTM1 was degraded post compound treatment also indicating autophagy induction ().
Figure 1. Acacetin induces autophagy and increases lysosomal population. (A) Representative microscopy images for tandem RFP-GFP-LC3 transfected HeLa cells treated with acacetin (50 µM) for 2 h. Yellow puncta correspond to autophagosomes whereas red puncta correspond to autolysosomes. Scale bar: 10 µm. (B) Fold change in autophagosomes and autolysosomes induced by acacetin were quantified (n = 25, three independent experiments N = 3). (C) Fold change in normalized LC3-II levels between growth condition and acacetin treatment were quantified (N = 3). (D) Representative immunoblot for LC3-I to LC3-II conversion in HeLa cells in the presence of the compound for 2 h. (E) Representative immunoblot for LC3-II accumulation in the presence of acacetin only and acacetin with BafA1 (100 nM). (F) Representative immunoblot for SQSTM1 degradation post acacetin treatment. (G) Representative immunofluorescence microscopy images of HeLa cells stained for LAMP1 and LC3 after 2 h of acacetin treatment (n = 25, N = 3). Scale bar: 10 µm. (H) Fold change in lysosomes and autolysosomes induced by acacetin were quantified (n = 25, N = 3). (I) Representative electron micrographs of acacetin treated HeLa cells. Electron dense structures in the zoomed-in panel represent lysosomes (red arrow). (J) Representative immunoblot indicating the phosphorylation status of MTOR substrates, RPS6KB1/p70S6K and EIF4EBP1 caused by acacetin and Earle’s Balanced Salt Solution (EBSS) treatments. TUBB/β-tubulin was used as a loading control. Quantification of microscopy images was performed on projected images. Statistical analyses were performed using unpaired two-tailed student’s t-test; ns- non-significant, *p < 0.05, **p < 0.01, ***p < 0.001. Error bars represent mean ± SEM.
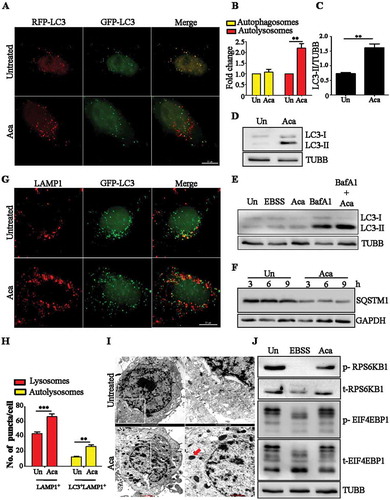
In addition to stimulating basal autophagy, acacetin treatment also resulted in an increase in total lysosomal population as seen by LAMP1 (lysosomal associated membrane protein 1)-positive vesicles by fluorescence microscopy (,). The same observation was also validated by electron microscopy where an increase in electron dense structures indicative of lysosomes was seen ( and S1D). The compound treatment did not inhibit MTOR activity as revealed by the phosphorylation status of its downstream targets such as EIF4EBP1 (eukaryotic translation initiation factor 4E binding protein 1) and RPS6KB1/p70S6K (ribosomal protein S6 kinase B1) (). Additionally, p-MTOR and MTOR localization on lysosomes also did not change upon acacetin treatment, suggesting that MTOR was active in presence of acacetin (Fig. S2A to S2C). Collectively, these results suggest that acacetin acts in an MTOR-independent manner to induce autophagy.
Acacetin induces xenophagy of Salmonella typhimurium
Apart from inducing general autophagy, we tested whether acacetin also induces selective autophagy pathways such as xenophagy. For this approach, we employed an intracellular S. typhimurium infection model. The ability of the compound to clear intracellular bacteria through xenophagy was examined by adding acacetin to HeLa cells. The compound treatment showed a reduction in the replication of intracellular S. typhimurium as quantified by colony forming unit assay and also exhibited a dose-dependent effect (, S3A, and SVideo 1–3). Similarly, we also validated these results in RAW 264.7 macrophages ().
Figure 2. Acacetin induces xenophagy of S. typhimurium. (A) Graph showing CFU indicating intracellular S. typhimurium in HeLa cells and RAW 264.7 after acacetin treatment (N = 3). (B) Graph showing CFU indicating intracellular S. typhimurium in HeLa cells and ATG5−/− HeLa cells after acacetin treatment (N = 3). (C) Graph showing CFU indicating intracellular S. typhimurium in HeLa cells after various treatments like acacetin, wortmannin and 3-MA (N=3). (D) Growth curve of S. typhimurium in cell free Luria Broth containing acacetin. (E) Graph representing the percentage of time course recruitment of SQSTM1 to S. typhimurium induced by acacetin. (F) Graph representing the percentage of time course recruitment of LC3 to S. typhimurium induced by acacetin. (G) Representative microscopy images of HeLa cells infected with mCherry expressing S. typhimurium and immunostained for SQSTM1 at 6 h post infection (n = 25, N = 3). Scale bar: 5 µm. (H) Representative microscopy images of GFP-LC3 transfected HeLa cells and infected with mCherry expressing S. typhimurium at 6 h post infection. Scale bar: 10 µm. (I) Representative microscopy images of HeLa cells infected with mCherry expressing S. typhimurium and immunostained for p-TBK1 and p-SQSTM1 at 6 h post infection (n = 25, N = 3). Scale bar: 10 µm. (J) Graph representing the percentage recruitment of p-TBK1 and p-SQSTM1 to S. typhimurium induced by acacetin. Quantification of microscopy images was performed on individual Z slices. (K-M) Representative electron micrographs of S. typhimurium infected HeLa cells (showing (K) Vacuolar and (L) cytoplasmic Salmonella population) with and without acacetin. Red arrows indicate electron dense lysosomes and yellow arrows indicate host mediated capture of S. typhimurium. Statistical analyses on three independent experiments were performed using unpaired two-tailed student’s t-test; ns- non-significant, *p < 0.05, **p < 0.01, ***p < 0.001. Error bars represent mean ± SEM. The concentrations of 3-MA, wortmannin and acacetin used were 5 mM, 100 nM and 50 µM respectively.
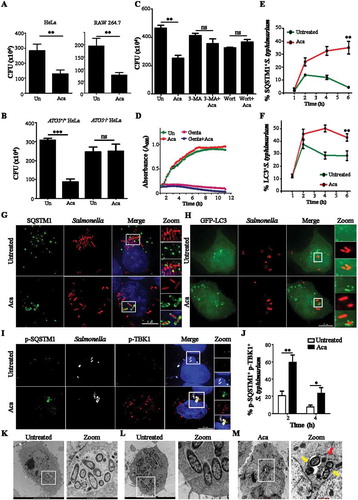
Furthermore, to understand whether the compound works through autophagy, we examined the bacterial burden from autophagy deficient HeLa cells (ATG5−/-) treated with acacetin. The compound was ineffective in lowering the intracellular bacterial burden which was similar to that of untreated samples (). Similar results were obtained when autophagy inhibitors such as 3-methyladenine (3-MA) and wortmannin were used (, S3B and C). These results suggest that autophagy is essential for the compound-mediated xenophagy action. In addition, the decrease in bacterial burden could be due to a potential antibacterial property of the compound along with autophagy, as seen for certain antibiotics such as Isoniazid and Pyrazinamide [Citation30]. We therefore examined the growth of extracellular S. typhimurium in the presence of acacetin. As seen in , there was no apparent lag in the bacterial growth between the untreated and compound-treated samples.
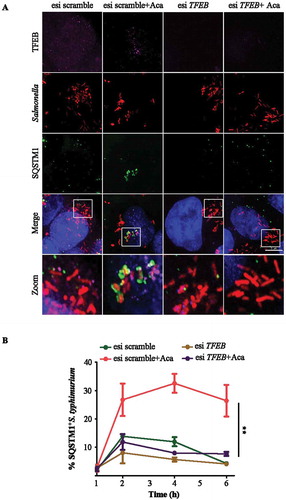
Xenophagy induction involves capture of pathogens by autophagy related receptor proteins (SQSTM1, NDP52, OPTN and NBR1) and xenophagosome membrane proteins (LC3 and its isoforms). To elucidate the xenophagy-dependent action of acacetin, recruitment of SQSTM1 and LC3 to intracellular S. typhimurium was studied post compound treatment. As seen in - acacetin treatment for 6 h resulted in increased recruitment of autophagic proteins to bacteria in a temporal manner. As opposed to untreated infected cells where S. typhimurium is known to evade xenophagy capture, acacetin treatment resulted in increased recruitment of SQSTM1 and LC3. In order to understand the mechanism of SQSTM1 recruitment to S. typhimurium post acacetin treatment, we specifically studied the S403 phosphorylation in the ubiquitin-associated domain (UBA) of SQSTM1 that has been associated with enhanced binding to ubiquitinated cargoes (Fig. S4A). Furthermore, TBK1 (TANK-binding kinase 1) phosphorylates SQSTM1 at S403. Active TBK1 itself is phosphorylated at S172 within its activation loop. Thus, monitoring the levels and recruitment of p-SQSTM1 and p-TBK1 can be used to assess effectiveness of cargo capture [Citation31]. As seen in ,, there was an increased recruitment of p-TBK1 and p-SQSTM1 to Salmonella post acacetin treatment until 6 h tested. Immunoblotting analysis revealed an increase in p-TBK1 levels of HeLa cells post acacetin treatment (Fig. S3D). Furthermore, to differentiate the cytosolic S. typhimurium from those contained in SCVs, we resorted to electron microscopy. Electron micrographs of infected HeLa cells exhibited both vacuolar and cytosolic intracellular S. typhimurium populations (,). Upon compound treatment, host-induced capture of S. typhimurium was observed with reduced bacterial numbers and increased electron dense lysosomal structures 6 h post infection (, S3E). These observations suggest that acacetin increased the xenophagic potential of cells.
Acacetin treatment results in enhanced capture of S. typhimurium in a TFEB-dependent manner
Given the ability of the compound to induce lysosomal biogenesis along with increased autophagy flux, we suspected a potential role for TFEB, which upon dephosphorylation, translocate to the nucleus to transcriptionally upregulate its target genes. Such increased nuclear translocation of TFEB was seen by immunofluorescence staining of HeLa epithelial cells treated with acacetin for 2 h (,). In addition, immunoblotting analysis showed a distinct dephosphorylated TFEB band (,) and increased TFEB in nuclear fraction of acacetin-treated cell lysates (). Similarly, 2 h of acacetin treatment also led to transcriptional induction of TFEB target genes related to autophagy and lysosomal pathways (). Finally, to study the involvement of MTOR in acacetin-mediated TFEB dephosphorylation, MTOR was constitutively activated by over expressing the RHEBN153T (Ras homolog enriched in brain) mutant [Citation32]. Upon expression of this mutant, phosphorylation of RPS6KB1 increased (as shown by both immunoblotting and fluorescence microscopy analysis) suggesting that overexpression of this dominant mutant resulted in constitutive activation of MTOR (Fig. S5C). In addition, cells transfected with this construct (as represented by enhanced p-RPS6KB1 staining) showed translocation of TFEB to the nucleus upon acacetin treatment (Fig. S5A and B). These results suggest that acacetin-mediated TFEB translocation into the nucleus occurs in an MTOR-independent manner.
Figure 3. Acacetin enhances nuclear translocation of TFEB. (A) Representative microscopy images of HeLa cells treated with acacetin for 2 h and immunostained for TFEB. Scale bar: 5 µm. (B) Fold change in nuclear TFEB intensity induced by acacetin were quantified (n = 50, N = 3). Quantification of microscopy images were performed on individual Z slices. (C) The graph represents the fold change in dephosphorylated form of TFEB caused by acacetin (N = 3). (D) Representative immunoblot for HeLa cells treated with acacetin and probed for TFEB. Molecular weight shift in TFEB band corresponds to dephosphorylated TFEB. TUBB/β-tubulin was used as a loading control. (E) Representative immunoblot of cytoplasmic-nuclear fractionation indicating TFEB levels in nucleus and cytoplasm. 2X concentration of nuclear fraction was loaded compared to cytoplasmic fraction. S.E and L.E represents short and long exposure respectively. (F) Fold change in mRNA levels of indicated TFEB target genes related to autophagy and lysosomal pathways post 2 h of acacetin treatment (N = 3). (G) Representative immunoblot indicating the phosphorylation status of TFEB post S. typhimurium infection across different time points and MOI. The lower molecular weight TFEB band corresponds to dephosphorylated TFEB. (H) Representative immunoblot indicating the phosphorylation status of TFEB post S. typhimurium infection and acacetin treatment in a time dependent manner. (I) Graph representing the difference in dephosphorylated TFEB induced by acacetin post S. typhimurium infection (N = 3). TUBB/β-tubulin was used as a loading control. Statistical analyses on three independent experiments were performed using unpaired student’s two-tailed t-test; ns- non-significant, *p < 0.05, **p < 0.01, ***p < 0.001. Error bars represent mean ± SEM.
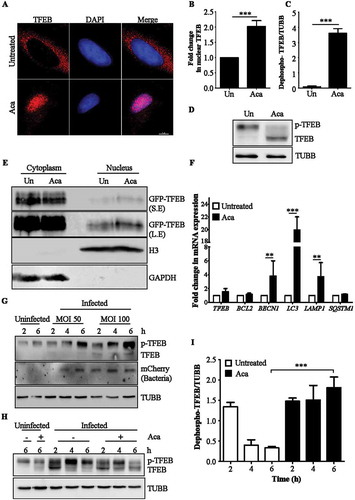
We further investigated the levels and phosphorylation status of TFEB during S. typhimurium infection. We noticed that the overall levels of TFEB increased during infection, especially the higher molecular weight band (). To test if this band was indeed p-TFEB, we treated the lysates with calf intestine phosphatase (CIP). CIP treated samples showed accelerated migrating bands of TFEB (dephosphorylated) suggesting that infection results in maintaining TFEB in a phosphorylated state (Fig. S5D). Contrastingly, acacetin treatment during infection resulted in increase in dephosphorylation status of TFEB (,) thus reversing the Salmonella-mediated block in TFEB dephosphorylation.
In order to access the dependency of acacetin on TFEB, we silenced TFEB in HeLa cells. Acacetin-mediated autophagy induction was significantly decreased upon TFEB silencing as seen by reduced LC3-II puncta in microscopy and absence of LC3-II accumulation by immunoblotting analysis (Fig. S6A to S6C). Additionally, to selectively evaluate if dephosphorylation of TFEB is also important for xenophagy, we tested the bacterial capture upon TFEB silencing. In cells silenced for TFEB, the acacetin-mediated SQSTM1 recruitment was significantly reduced (,) confirming the role of TFEB in acacetin action. Results thus far suggested that acacetin exerts its effect by mediating dephosphorylation of TFEB and subsequent autophagy and xenophagy induction.
Figure 4. Acacetin treatment results in enhanced capture of S. typhimurium in a TFEB-dependent manner. (A) Representative microscopy images of control and TFEB silenced HeLa cells post S. typhimurium infection for 6 h and immunostained for SQSTM1 and TFEB. Scale bar: 5 µm. (B) Graph represents the time course recruitment of SQSTM1 to S. typhimurium induced by acacetin treatment (n = 25, N = 3). Quantification of microscopy images were performed on individual Z slices. Statistical analysis was performed using unpaired student’s two-tailed t-test; ns- non-significant, *p < 0.05, **p < 0.01, ***p < 0.001. Error bars represent mean ± SEM.
Acacetin treatment increases the proteolytic activity of Salmonella-containing vacuoles
To verify if the acacetin induced increase in the number of lysosomes also corresponds to a concomitant increase in the lysosomal activity, cells were treated with dye quenched-bovine serum albumin (DQ-BSA). It is a derivative of bovine serum albumin that is heavily conjugated to BODIPY dye that acts as a protease substrate and gets cleaved by lysosomal cysteine and aspartyl proteases such as CTSB and CTSD. As shown in ,, acacetin treatment resulted in increased fluorescence of DQ-BSA due to lysosomal-mediated processing resulting in brighter mono-conjugates of DQ-BSA. In addition, to study the effect of acacetin on fluid phase endocytosis, we temporally followed reporter cargoes such as fluorescein isothiocyanate (FITC) labeled Dextran beads and pyridinium,4-(6-[4-{diethylamino}phenyl]-1,3,5-hexatrienyl)-1-(3[triethylammonio] propyl)-,dibromide (FM 4–64) dye. Furthermore, FITC-Dextran was colocalized with early endosomal marker EEA1 (early endosome antigen 1) and the acidified late endosomes or lysosomes stain, LysoTracker Deep Red. As seen in Fig. S7, there was neither any significant difference between the rate of uptake (Fig. S7A to S7D) nor in the temporal colocalization between the endocytic and lysosomal markers (Fig. S8A and B). These results suggest that acacetin treatment, for the time assessed, did not perturb the uptake and trafficking of endocytic cargoes. Taken together, acacetin specifically increases the number of functional lysosomes in addition to enhancing autophagy flux.
Figure 5. Acacetin treatment increases the proteolytic activity of Salmonella-containing vacuoles. (A) Representative microscopy images of HeLa cells treated with DQ-BSA for 2 h followed by 4 h incubation of DQ-BSA along with acacetin treatment. Cells were immunostained for LAMP1 (n = 25, N = 3). Scale bar: 5 µm. (B) Representative microscopy images of mCherry S. typhimurium infected HeLa cells treated with DQ-BSA for 2 h followed by 4 h incubation of DQ-BSA along with acacetin treatment. Cells were immunostained for LAMP1. Scale bar: 5 µm. (C and D) The differences in DQ-BSA intensity per cell or SCVs induced by acacetin treatment were quantified (n = 25, N = 3). Quantification of microscopy images were performed on projected images. Statistical analyses on three independent experiments were performed using unpaired student’s two-tailed t-test; ns- non-significant, *p < 0.05, **p < 0.01, ***p < 0.001. Error bars represent mean ± SEM.
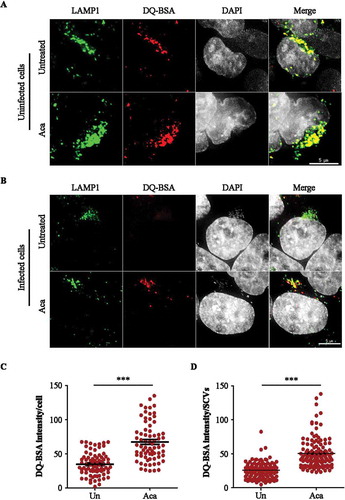
SCVs are modified Salmonella containing endosomes-like structures that resemble lysosomes by membrane composition but do not contain proteases similar to functional lysosomes [Citation11]. These protease-deficient vesicles provide a niche for S. typhimurium to replicate within cells. In addition to increasing the number of active lysosomes in cells, acacetin treatment also increases the proteolytic activity of SCVs preventing bacterial replication, as seen by DQ-BSA processing in the SCVs (,). DQ-BSA processing to monoconjugates is a sign of increased proteolytic activity in the contained vesicles. These results suggest that apart from enhanced acacetin-mediated S. typhimurium capture by xenophagy proteins, there is an increase in functional lysosomal numbers which also target SCVs to enhance their proteolytic activity and thus reduce S. typhimurium replication.
Acacetin induces xenophagy in mouse model of infection
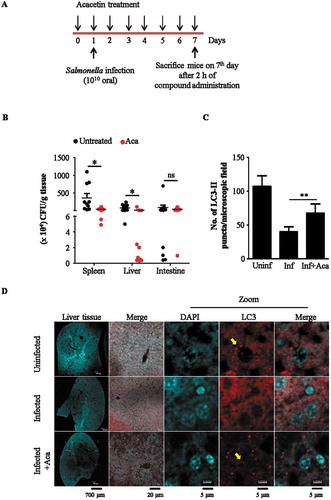
Salmonella invasion via gastrointestinal route establishes infection initially in the intestine followed by dissemination to other organs like liver, kidney, spleen and lymph nodes. It is reported that the xenophagy potential of the organs during Salmonella infection is short lived, returning to basal levels at around 72 h post infection [Citation14]. In order to test the efficacy of acacetin in inducing xenophagy-mediated bacterial clearance, an in vivo mouse model of infection was established. Based on our preliminary studies, we found that administering 1010 bacteria through oral gavage, disseminates bacteria across key organs involved during Salmonella infection like intestine, liver, spleen and kidney at 7 d post infection. Additionally, the concentration of acacetin to be tested was decided based on previously available reports that did not show any change in body weight or mortality. Three groups of mice were tested namely uninfected, infected and infected along with acacetin treatment. In this infection model, acacetin (20 mg/kg body weight) was administered intraperitoneally starting from 1 d prior to Salmonella infection in order to maintain an induced autophagy status in the organs. Acacetin treatment continued until 7 d post infection. At the end of 7 d post infection, mice from all groups were sacrificed and the number of intracellular Salmonella was determined by counting the number of colony-forming units (CFU) and autophagy induction was visualized in liver using immunohistochemistry (). Results obtained are comparable to the study done by Benjamin et al highlighting the role of in vivo xenophagy [Citation14]. As seen in , there is a reduction in the number of intracellular bacteria in various organs of infected mice like liver, spleen, and intestine in the acacetin treated group. In addition, immunohistochemical analysis revealed induction of autophagy as seen by increased LC3-II puncta (,) in the infected group that received acacetin.
Figure 6. Acacetin induces xenophagy in mouse model of infection. (A) Scheme for infection assay. (B) Graph representing the reduction in intracellular S. typhimurium burden in various organs of acacetin treated mice (N = 10). (C) Graph representing the difference in number of LC3-II puncta per microscopy field (1X1 binning and 1024 × 1024 pixel) between different groups of mice (N=3). (D) Representative immunohistochemistry images of liver cryosections stained for autophagosome membrane marker, LC3 (Olympus FV3000 1.25X objective was used for imaging entire DAPI stained liver section, 20X objective was used to choose a region of interest stained for LC3 in red and DAPI. 40X objective was used for observing LC3 puncta, indicated by yellow arrows). Quantification of microscopy images were performed on projected images. Statistical analyses of three independent experiments was performed using unpaired student’s two-tailed t-test; ns- non-significant, *p < 0.05, **p < 0.01, ***p < 0.001. Error bars represent mean ± SEM.
Discussion
In the constant battle between the host and pathogens for one upmanship, both sides employ several strategies and counter strategies. One powerful mechanism the host cells employ is xenophagy that functions in concert with other antimicrobial strategies of the host cell and is implicated in a number of intracellular bacterial infections [Citation33]. However, in order to successfully establish infection, bacteria deploy diverse tactics to down regulate xenophagy. Host capabilities for counteracting this subversion resulting in enhanced clearance of intracellular bacteria and hence mitigate infection pathology has been reported by several studies [Citation34].
Chemical biology approaches to understand xenophagy has two-fold benefits. Characterization of xenophagy “hits” not only provides insights into this process, their specificity can also reveal therapeutic potential. For example, chemical modulators of xenophagy like trifluoperazine, BRD5631 act through distinct but diverse mechanisms suggesting therapeutically novel strategies to induce xenophagy [Citation18]. In this study, we identify and characterize a novel xenophagy modulator acacetin that clears intracellular S. typhimurium infection in an MTOR-independent but TFEB-dependent manner. Although prolonged exposure of high concentration of acacetin has been shown to induce apoptosis in cancer cells recently [Citation35], we show that at the lower concentrations used in our study, acacetin robustly induces autophagy and is effective as a xenophagy inducer in curbing S. typhimurium infection both in cell lines and in an in vivo model.
Acacetin treatment resulted in an overall increase in the number of autolysosomes. Further, increased formation of autolysosomes suggests that acacetin treatment results in enhanced fusion of autophagosomes and lysosomes thus leading to an increased number of autolysosomes. In spite of this increase in autolysosome number, autophagosomes number did not decline upon acacetin treatment, further suggesting that the overall autophagy flux is upregulated in presence of acacetin. When tested for its xenophagy potential, acacetin was able to inhibit intracellular S. typhimurium multiplication. Detailed mechanistic analysis revealed the following: Firstly, the compound treatment induced enhanced recruitment of autophagy receptor proteins such as SQSTM1 to Salmonella. This increased recruitment of SQSTM1 after acacetin treatment is possibly facilitated by phosphorylation of SQSTM1 (S403) in its UBA domain thereby enhancing its binding affinity to ubiquitinated cargoes rather than transcriptional induction of SQSTM1. Additionally, phosphorylation of TBK1 and its recruitment to S. typhimurium both were increased. These observations are in agreement with the published literature where p-TBK1 has been shown to be actively phosphorylating SQSTM1 at S403 in its UBA domain. Such a mechanism has been shown for capturing damaged mitochondria by the selective autophagy process known as mitophagy [Citation31]. Secondly, acacetin functions by activating the transcription factor TFEB, a master regulator of lysosome biogenesis and autophagy pathways [Citation36]. Phosphorylated TFEB is localized on the lysosomes, but upon dephosphorylation, it migrates to the nucleus and activates the expression of several genes involved in lysosomal biogenesis and autophagy related pathways [Citation37]. However, TFEB-mediated mechanisms are complex with multiple phosphorylation sites and co-ordinated regulation of this phosphorylation-dephosphorylation balance by a number of kinases (MTOR, ERK, GSK3B, Akt) and the phosphatase, calcineurin governs the metabolic state of the cell [Citation38]. Apart from increasing autophagy flux in presence of acacetin, TFEB also promoted autolysosome formation. Thirdly, acacetin treatment promoted TFEB translocation into the nucleus. Previous studies have shown that activation and translocation of MiT-TFE family of transcription factors (TFEB, TFE3) that regulate lysosome biogenesis and autophagy, increase the innate immune response of LPS-activated macrophages [Citation39]. In fact, phagocytosis of bacteria and IgG opsonized beads activate TFEB. A study by Gray et al showed that depletion of TFEB lead to a loss in pathogen restriction by downregulating lysosomal degradation during infection [Citation40]. In addition, the TFEB ortholog in C. elegans, HLH30 has been reported to be activated during S. typhimurium and S. aureus infection and provide cytoprotection [Citation20,Citation41]. Our results show that upon Salmonella infection, although TFEB levels increase, it is maintained in a transcriptionally inactive, phosphorylated form. However, acacetin treatment resulted in increased levels of dephosphorylated form of TFEB with a concomitant induction of autolysosome numbers and enhanced xenophagy flux.
A recent study on xenophagy in mice during Salmonella infection highlighted the role of ATG5, an essential autophagy protein needed for autophagosome formation [Citation14]. Intestinal knockdown of Atg5 increased the bacterial load in mice, suggesting the importance of xenophagy-mediated host immune response. Similarly, a previous study by Conway et al reported the requirement of another autophagy protein, ATG16L1 for xenophagy during Salmonella infection [Citation42]. Although the above studies emphasized the role of xenophagy process, the molecular mechanisms that induce xenophagy in vivo are not well known. Here, we show that consistent acacetin treatment in vivo led to increase in LC3B-II levels, with a concomitant restriction of bacterial infection. Together, our data suggests a mechanism to overcome the reported host xenophagy inhibition mediated by intracellular pathogens such as S. typhimurium [Citation14].
Furthermore, some of the well-known potent TFEB inducers like torin1, work by inhibiting MTOR, a critical kinase that regulates cellular growth and survival. It is therefore essential to identify TFEB inducers that function in an MTOR-independent manner such as acacetin. Similar studies exploring the mechanisms of MTOR-independent TFEB activation are reported [Citation24,Citation26] and in particular, a small molecule compound trehalose, activates TFEB by inhibiting Akt and enhances clearance of protein aggregates [Citation27].
Thus, we show that identifying potent xenophagy inducers can strengthen the host response against pathogens. As a potential translational application, such molecules can be envisaged as a host mediated therapy which may be especially effective when dealing with multidrug resistant pathogens.
Materials and methods
Chemicals and antibodies
3-MA (M9281), wortmannin (W1628), acacetin (00017), anti-LC3B antibody (L7543), Atto 663 (41176), trypsin EDTA (59418C), EBSS (E7510) and FITC-Dextran (46945) were purchased from Sigma-Aldrich. Anti-TFEB antibody (4240), anti-RPS6KB1/p70S6K antibody (9208), anti-p-RPS6KB1/p70S6K (9202) antibody, anti-p-EIF4EBP1 antibody (2855), anti-EIF4EBP1 antibody (9452), anti-LAMP1 antibody (9091), anti-TBK1/NAK antibody (3504), anti-p-TBK1/NAK Ser172 antibody (5483), anti-EEA1 antibody (3288), anti-ACTB/β-actin antibody (4970), anti-rabbit IgG antibody conjugated with horseradish peroxidase (HRP; 7074) were purchased from Cell Signaling Technology. Anti-SQSTM1/p62 (ab56416) was purchased from Abcam. Anti-p-SQSTM1/p62 Ser403 (D343-3) was purchased from MBL. Anti-TUBB/β-tubulin antibody (DSHB-C1-377) was purchased from Developmental Studies Hybridoma Bank. Anti H3 was a kind gift from Prof. Tapas Kundu, JNCASR. DQ-BSA Red BSA (D12051), FM 4–64 (F34653), LysoTracker Deep Red (L12492) were purchased from Thermo Fisher Scientific. Bafilomycin A1 (11038) was purchased from Cayman chemical. CIP (M0290S) was purchased from New England Biolabs.
Plasmid constructs, esiRNA and bacterial strains
Plasmids used in mammalian cell culture include ptfLC3 (21074, deposited by Tamotsu Yoshimori), pEGFP-N1-TFEB (38119, deposited by Shawn Ferguson), LAMP1-RFP (1817, deposited by Walther Mothes), RHEBN153T (19997, deposited by Fuyuhiko Tamanoi) were purchased from Addgene. Bacterial strains used for infectious studies include untagged and mCherry expressing S. typhimurium (kind gift from Dr. C.V Srikanth, RCB, India). For silencing experiments, TFEB esiRNA (EHU059261-20UG) and scramble esiRNA (SIC001-10NMOL) were purchased from Sigma-Aldrich.
Cell culture
RAW 264.7 and HeLa cells were grown in Dulbecco’s Modified Eagle’s Medium (DMEM; Sigma-Aldrich, 5648) supplemented with 3.7 g/L sodium bicarbonate (Sigma-Aldrich, S5761), 10% fetal bovine serum (FBS; Gibco, 10270–106) and 100 units/ml of penicillin and streptomycin (Gibco, 15140–122) and maintained in 5% CO2 at 37°C. ATG5−/- HeLa cells was a kind gift from Prof. Richard Youle, NIH.
Immunofluorescence microscopy
Cells were seeded on coverslips and allowed to attach overnight. Cells were transfected with plasmid constructs (ptf-LC3/GFP-LC3) using lipofectamine 2000 (Invitrogen, 11668019) as per the manufacturer’s instructions. After 48 h post transfection, compound treatment was carried out for indicated time points and cells were fixed using 4% paraformaldehyde (Sigma-Aldrich, P6148). For antibody staining, permeabilization with 0.25% Triton X-100 (HiMedia Laboratories, MB031) was followed by primary antibody incubation overnight at 4°C and appropriate secondary antibody incubation for 1 h at room temperature. The cover slips were mounted using Vectashield antifade reagent with or without DAPI (Vector laboratories, H-1000/H-1200).
DQ-BSA processing assay
HeLa cells were seeded on cover slips and allowed to attach overnight. DQ-BSA was added to HeLa cells or HeLa cells post S. typhimurium infection for 2 h. The DQ-BSA processing was allowed for 4 h and fixed using 4% paraformaldehyde.
Immunoblotting
Cells were seeded in 6-well plates and allowed to attach overnight. After 2 h of compound treatment, cells were collected in Laemmli buffer (10% SDS (HiMedia Laboratories, GRM886), 10 mM DTT (ThermoFisher Scientific, R0862), 20% glycerol (Merck, 1.07051.0521), 0.2M Tris-HCl (Merck, 1.93315.0521), 0.05% bromophenol blue (ThermoFisher Scientific, 115-39-9), pH 6.8) and boiled for 10 min at 95◦C. Samples were electrophoresed on SDS-PAGE and transferred onto PVDF membrane (BioRad, 1,620,177). After incubation with primary antibody overnight at 4°C and HRP conjugated secondary antibody for 1 h at room temperature, signals were obtained using enhanced chemiluminescence substrate (Clarity Bio-Rad, 170–5061) and image was acquired using gel documentation system (G-box, Chemi XT 4, Syngene, USA). The bands were quantified using ImageJ software (NIH).
Infection assay
Single colony of S. typhimurium (kind gift from Dr. C.V. Srikanth, RCB, India) was grown for 6 h at 37°C in a shaking incubator. Secondary culture (0.2% inoculum) was grown overnight in micro-aerophilic conditions. HeLa (WT and ATG5−/-) or RAW264.7 cell lines were infected at a multiplicity of infection (MOI) of 200 for 1 h. The cells were treated with media containing 40 µg/ml gentamycin (Abbott, EAI03089) for 1 h to kill the extracellular bacteria. The cells were then treated with the compound and incubated for 4 h. Finally, the mammalian cells were lysed using lysis buffer (0.1% SDS, 1% Triton X-100, 1X PBS (Sigma-Aldrich, D6773)) and the intracellular S. typhimurium was plated and the CFU was counted.
Fluorescence microscopy and analysis
Images were acquired on the widefield Delta Vision microscope (API, GE, USA, 29,065,728) using DAPI, FITC, TRITC, Cy5 filters with Olympus 60X/1.42 NA objective. Post-acquisition, the images were deconvolved using Delta Vision SoftWorx software. For Fig. S3A and , confocal microscopy (Zeiss, LSM880) was used without deconvolution. For analyzes that involved colocalization (,,, , , S2C, S3B, S5B, S8B), individual Z-stacks were analyzed using Colocalization plugin with “colocalization highlighter” option in ImageJ (NIH) and the number of colocalized events were counted using cell counter plugin of ImageJ . Whereas, for images that required counting total puncta inside cells or measuring total intensities of cells (,, ,, , S3B, S6B, S7C, S7D), projected image (collapsed Z-stacks) were used for quantification. Graphs were plotted and significance levels were tested using unpaired two-tailed student’s t-test in GraphPad Prism software. However, all representative images are projected images for better clarity.
Live cell microscopy
GFP-LC3 transfected HeLa cells were infected with mCherry- S. typhimurium for 15 min (MOI 400) and were treated with gentamycin for 15 min. The cells were then washed with 1X PBS and were treated with the compound and imaged on FV10i- Olympus confocal live cell imaging microscope using 60X water immersion lens with confocality aperture set to 1.0. Images were taken at an interval of 15 or 20 min (Five Z sections of 1 micron each). The intensity of the Red channel was analyzed using Image J – Stacks T function- intensity vs. time plot plugin.
RNA extraction and quantitative PCR
Total RNA from samples was isolated using TRIzol (Ambion, 15596–026). Reverse transcription was carried out using Taqman reverse transcription kit (Applied Biosystems, N8080234). Autophagy and lysosomal specific gene primers which were previously reported [Citation21,Citation43,Citation44] were purchased from Sigma-Aldrich. The housekeeping gene ACTB was used as normalizing control to calculate the fold change.
Primers used
Electron microscopy
Sample processing for Transmission Electron Microscopy was carried out in Christian Medical College, Vellore, India. Briefly, HeLa cells were trypsinized and washed with 1X PBS. Cells were fixed using 4% glutaraldehyde in 0.1 M cacodylate buffer (pH 7.3) for 1 h at 4◦C. Fixed cells were dehydrated in ethanol series and embedded in epoxy resin (TAAB laboratory and microscopy, CY212 KIT, E009). Ultra-thin sections were stained and observed using Tecnai, G2 F-30 with a point resolution of 2.2 Å.
Cell viability assay
HeLa cells were seeded on a 384-well plate and treated with different concentrations of acacetin. After 15 h of compound treatment, cell viability was measured using luminescence-based Cell Titer Glo cell viability assay kit (Promega, G7572) using a micro-titer plate reader (Varioskan Flash, Thermo Fisher Scientific, USA).
Immunohistochemistry
Liver cryosections of 40 µm thickness were collected on gelatine coated slides. Every eighth section was used for immunostaining. Equilibration of the sections was done using 0.1 M PBS (pH 7.4) for 10 min. This was followed by blocking using 3% bovine serum albumin (Sigma-Aldrich, A7906) for 4 h. Then, the sections were incubated for 36 h in primary antibody. After washes the sections were incubated in fluorescent secondary antibody for 4 h. The sections were mounted using Vectashield mounting media after required washing. Images were acquired using Olympus FV 3000 (1.25X objective was used for imaging entire liver section, 40X objective was used for observing LC3-II puncta).
Animal studies
All procedures carried out in the study were approved by JNCASR Institutional Animal Ethics Committee. BALB/c mice (6–8 weeks of age) were distributed into three groups namely- uninfected, infected and infected along with acacetin treatment. Acacetin (20 mg/kg) was administered intraperitoneally to the infected with acacetin treatment group. The compound treatment continued for next 7 d with one injection a day. Other two groups were injected with vehicle solvent, dimethyl sulfoxide (Sigma-Aldrich, D8418). Infection (1010) was done through oral gavage for the second and third group on the first day. All animals were sacrificed on the seventh day post infection after 2 h of compound injection and the organs (liver, spleen and intestine) were processed for plating and immunohistochemistry.
Statistical analysis
For all observations made in this study, a minimum of three independent experiments were performed. For fluorescence microscopy based analysis, at least 25 cells per experiment (so across three experiments, a minimum of 75 cells) were considered for quantification. Immunoblotting and microscopy image quantifications were performed using ImageJ software with appropriate plugins (NIH) mentioned elsewhere. The significance levels between the control and test groups were tested using unpaired two-tailed student’s t-test where ns- non-significant, *p < 0.05, **p < 0.01, ***p < 0.001. Error bars represent mean ± SEM. All statistical tests and graphs were plotted using GraphPad prism.
Video 1: HeLa cells infected with S. typhimurium SL1344 at MOI of 400 for 15 min followed by gentamycin treatment (40 µg/ml) for 15 min. Fresh medium was added to the cells and imaged every 20 min for 5 h 40 min. Scale bar: 10 µm.
Videos 2&3: HeLa cells infected with S. typhimurium SL1344 at MOI of 400 for 15 min followed by gentamycin treatment (40 µg/ml) for 15 min. Fresh medium containing 50 µM of acacetin was added to the cells and imaged every 15 min for 5 h 45 min. Scale bar: 10 µm.
Supplemental Material
Download Zip (40.5 MB)Acknowledgments
We thank Dr. C V Srikanth, RCB, for his support, help in Salmonella infection assays and for providing several reagents, Prof. Deepak Saini and his student Vignesh, MRDG, IISc for help with live cell microscopy, Prof. Jonathan Sexton, North Carolina for the kind gift of Enzo library of compounds, Prof. Udaykumar Ranga and Prof. Tapas Kundu, MBGU, JNCASR, for reagents, Prof. Subba Rao MCBL, IISc for reagents, Prof. Richard Youle, NINDS, for WT and ATG5−/- HeLa cells. We thank Mr. Gaurav Barve, Ms. Aparna Hebbar and Dr. Shanmuga Sundari for critical reading of the manuscript. We thank Mr. Ganesh Kadasoor from Olympus for helping in live cell microscopy video processing. This work was supported by Wellcome Trust/DBT India Alliance Intermediate Fellowship (509159-Z-09-Z), LSRB-DRDO grant (LSRB-310/BTB/2017) and JNCASR intramural funds to RM. Use of acacetin in autophagy related therapeutic applications such as xenophagy is patent pending.
Disclosure statement
No potential conflict of interest was reported by the authors.
Supplementary Material
Supplementary data for this article can be accessed here.
Additional information
Funding
Related Research Data
References
- Armstrong JA, Hart PD. Response of cultured macrophages to Mycobacterium tuberculosis, with observations on fusion of lysosomes with phagosomes. J Exp Med. 1971;134:713–740.
- Rich KA, Burkett C, Webster P. Cytoplasmic bacteria can be targets for autophagy. Cell Microbiol. 2003;5:455–468.
- Gutierrez MG, Master SS, Singh SB, et al. Autophagy is a defense mechanism inhibiting BCG and Mycobacterium tuberculosis survival in infected macrophages. Cell. 2004;119:753–766.
- Nakagawa I, Amano A, Mizushima N, et al. Autophagy defends cells against invading group A Streptococcus. Science. 2004;306:1037–1040.
- Deretic V, Levine B. Autophagy, immunity, and microbial adaptations. Cell Host Microbe. 2018;8:527–549.
- Huang J, Brumell JH. Bacteria-autophagy interplay: a battle for survival. Nat Rev Microbiol. 2014;12:101–114.
- Birmingham CL, Smith AC, Bakowski MA, et al. Autophagy controls Salmonella infection in response to damage to the Salmonella-containing vacuole. J Biol Chem. 2006;281:11374–11383.
- Zheng YT, Shahnazari S, Brech A, et al. The adaptor protein p62/SQSTM1 targets invading bacteria to the autophagy pathway. J Immunol. 2009;183:5909–5916.
- Fujita N, Morita E, Itoh T, et al. Recruitment of the autophagic machinery to endosomes during infection is mediated by ubiquitin. J Cell Biol. 2013;203:115–128.
- Alpuche-Aranda CM, Racoosin EL, Swanson JA, et al. Salmonella stimulate macrophage macropinocytosis and persist within spacious phagosomes. J Exp Med. 1994;179:601–608.
- McGourty K, Thurston TL, Matthews SA, et al. Salmonella inhibits retrograde trafficking of mannose-6-phosphate receptors and lysosome function. Science. 2012;338:963–967.
- Tattoli I, Sorbara MT, Vuckovic D, et al. Amino acid starvation induced by invasive bacterial pathogens triggers an innate host defense program. Cell Host Microbe. 2012;11:563–575.
- Ganesan R, Hos NJ, Gutierrez S, et al. Salmonella Typhimurium disrupts Sirt1/AMPK checkpoint control of mTOR to impair autophagy. PLoS Pathog. 2017;13:e1006227.
- Benjamin JL, Sumpter R Jr., Levine B, et al. Intestinal epithelial autophagy is essential for host defense against invasive bacteria. Cell Host Microbe. 2013;13:723–734.
- Travassos LH, Carneiro LA, Ramjeet M, et al. Nod1 and Nod2 direct autophagy by recruiting ATG16L1 to the plasma membrane at the site of bacterial entry. Nat Immunol. 2010;11:55–62.
- Shoji-Kawata S, Sumpter R, Leveno M, et al. Identification of a candidate therapeutic autophagy-inducing peptide. Nature. 2013;494:201–206.
- Chauhan S, Ahmed Z, Bradfute SB, et al. Pharmaceutical screen identifies novel target processes for activation of autophagy with a broad translational potential. Nat Commun. 2015;6:8620.
- Kuo SY, Castoreno AB, Aldrich LN, et al. Small-molecule enhancers of autophagy modulate cellular disease phenotypes suggested by human genetics. Proc Natl Acad Sci U S A. 2015;112:E4281–7.
- Lapierre LR, De Magalhaes Filho CD, McQuary PR, et al. The TFEB orthologue HLH-30 regulates autophagy and modulates longevity in Caenorhabditis elegans. Nat Commun. 2013;4:2267.
- Najibi M, Labed SA, Visvikis O, et al. An evolutionarily conserved PLC-PKD-TFEB pathway for host defense. Cell Rep. 2016;15:1728–1742.
- Sardiello M, Palmieri M, Di Ronza A, et al. A gene network regulating lysosomal biogenesis and function. Science. 2009;325:473–477.
- Settembre C, Di Malta C, Polito VA, et al. TFEB links autophagy to lysosomal biogenesis. Science. 2011;332:1429–1433.
- Roczniak-Ferguson A, Petit CS, Froehlich F, et al. The transcription factor TFEB links mTORC1 signaling to transcriptional control of lysosome homeostasis. Sci Signal. 2012;5:ra42.
- Parr C, Carzaniga R, Gentleman SM, et al. Glycogen synthase kinase 3 inhibition promotes lysosomal biogenesis and autophagic degradation of the amyloid-beta precursor protein. Mol Cell Biol. 2012;32:4410–4418.
- Settembre C, Zoncu R, Medina DL, et al. A lysosome-to-nucleus signalling mechanism senses and regulates the lysosome via mTOR and TFEB. Embo J. 2012;31:1095–1108.
- Medina DL, Di Paola S, Peluso I, et al. Lysosomal calcium signalling regulates autophagy through calcineurin and TFEB. Nat Cell Biol. 2015;17:288–299.
- Palmieri M, Pal R, Nelvagal HR, et al. mTORC1-independent TFEB activation via Akt inhibition promotes cellular clearance in neurodegenerative storage diseases. Nat Commun. 2017;8:14338.
- Mishra P, Dauphinee AN, Ward C, et al. Discovery of pan autophagy inhibitors through a high-throughput screen highlights macroautophagy as an evolutionarily conserved process across 3 eukaryotic kingdoms. Autophagy. 2017;13:1556–1572.
- Mishra P, Rai S, Manjithaya R. A novel dual luciferase based high throughput assay to monitor autophagy in real time in yeast S. cerevisiae. Biochem Biophys Rep. 2017;11:138–146.
- Kim JJ, Lee HM, Shin DM, et al. Host cell autophagy activated by antibiotics is required for their effective antimycobacterial drug action. Cell Host Microbe. 2012;11:457–468.
- Matsumoto G, Shimogori T, Hattori N, et al. TBK1 controls autophagosomal engulfment of polyubiquitinated mitochondria through p62/SQSTM1 phosphorylation. Hum Mol Genet. 2015;24:4429–4442.
- Parmar N, Tamanoi F. Rheb G-proteins and the activation of mTORC1. Enzymes. 2010;27:39–56.
- Casanova JE. Bacterial autophagy: offense and defense at the host-pathogen interface. Cell Mol Gastroenterol Hepatol. 2017;4:237–243.
- Escoll P, Rolando M, Buchrieser C. Modulation of host autophagy during bacterial infection: sabotaging host munitions for pathogen nutrition. Front Immunol. 2016;7:81.
- Zhang HW, Hu JJ, Fu RQ, et al. Flavonoids inhibit cell proliferation and induce apoptosis and autophagy through downregulation of PI3Kgamma mediated PI3K/AKT/mTOR/p70S6K/ULK signaling pathway in human breast cancer cells. Sci Rep. 2018;8:11255.
- Settembre C, Fraldi A, Medina DL, et al. Signals from the lysosome: a control centre for cellular clearance and energy metabolism. Nat Rev Mol Cell Biol. 2013;14:283–296.
- Martina JA, Chen Y, Gucek M, et al. MTORC1 functions as a transcriptional regulator of autophagy by preventing nuclear transport of TFEB. Autophagy. 2012;8:903–914.
- Puertollano R, Ferguson SM, Brugarolas J, et al. The complex relationship between TFEB transcription factor phosphorylation and subcellular localization. Embo J. 2018;37:e98804.
- Pastore N, Brady OA, Diab HI, et al. TFEB and TFE3 cooperate in the regulation of the innate immune response in activated macrophages. Autophagy. 2016;12:1240–1258.
- Gray MA, Choy CH, Dayam RM, et al. Phagocytosis enhances lysosomal and bactericidal properties by activating the transcription factor TFEB. Curr Biol. 2016;26:1955–1964.
- Visvikis O, Ihuegbu N, Labed SA, et al. Innate host defense requires TFEB-mediated transcription of cytoprotective and antimicrobial genes. Immunity. 2014;40:896–909.
- Conway KL, Kuballa P, Song JH, et al. Atg16l1 is required for autophagy in intestinal epithelial cells and protection of mice from Salmonella infection. Gastroenterology. 2013;145:1347–1357.
- Decressac M, Mattsson B, Weikop P, et al. TFEB-mediated autophagy rescues midbrain dopamine neurons from alpha-synuclein toxicity. Proc Natl Acad Sci U S A. 2013;110:E1817–26.
- Cheng B, Xu A, Qiao M, et al. BECN1s, a short splice variant of BECN1, functions in mitophagy. Autophagy. 2015;11:2048–2056.