
ABSTRACT
The AMP-activated protein kinase (AMPK) regulates cellular energy homeostasis by sensing the metabolic status of the cell. AMPK is regulated by phosphorylation and dephosphorylation as a result of changing AMP/ATP levels and by removal of inhibitory ubiquitin residues by USP10. In this context, we identified the GID-complex, an evolutionarily conserved ubiquitin-ligase-complex (E3), as a negative regulator of AMPK activity. Our data show that the GID-complex targets AMPK for ubiquitination thereby altering its activity. Cells depleted of GID-subunits mimic a state of starvation as shown by increased AMPK activity and macroautophagic/autophagic flux as well as reduced MTOR activation. Consistently, gid-genes knockdown in C. elegans results in increased organismal lifespan. This study may contribute to understand metabolic disorders such as type 2 diabetes mellitus and morbid obesity and implements alternative therapeutic approaches to alter AMPK activity.
Abbreviations
ACTB: actin, beta; ADP: adenosine diphosphate; AMP: adenosine monophosphate; AMPK: AMP-activated protein kinase; ARMC8: armadillo repeat containing 8; ATP: adenosine triphosphate; BafA1: bafilomycin A1; BCAA: branched chain amino acid; BICC1: BicC family RNA binding protein 1; BSA: bovine serum albumin; CAMKK2 kinase: calcium/calmodulin dependent protein kinase kinase 2, beta; CHX: cycloheximide; DMEM: Dulbecco’s modified Eagle’s medium; E1: ubiquitin-activating enzyme; E2: ubiquitin-conjugating enzyme; E3: ubiquitin ligase; ECAR: extracellular acidification rate; FACS: fluorescent associated cell sorter; FBP1: fructose-bisphosphatase 1; FCCP: carbonyl cyanide-4 (trifluoromethoxy) phenylhydrazone; G6P: glucose-6-phosphate; GDP: guanosine diphosphate; GFP: green fluorescent protein; GID: glucose induced degradation deficient; GMP: guanosine monophosphate; GTP: guanosine triphosphate; HBP1: high mobility group box transcription factor 1; HPRT: hypoxanthine guanine phosphoribosyl transferase; KO: knock out; LE: long exposure; MAEA: macrophage erythroblast attacher; MAP1LC3B/LC3B: microtubule-associated protein 1 light chain 3 beta; MKLN1: muskelin 1; mRNA: messenger RNA; MTOR: mechanistic target of rapamycin; NES: normalized enrichment score; OCR: oxygen consumption rate; PBS: phosphate buffered saline; PCK1: phosphoenolpyruvate carboxykinase 1, cytosolic; PCR: polymerase chain reaction; PFA: paraformaldehyde; RANBP9: RAN binding protein 9; RING: really interesting new gene; RMND5: required for meiotic nuclear division5 homolog; RPS6: ribosomal protein S6; RPTOR: regulatory associated protein of MTOR, complex 1; SE: short exposure; SEM: standard error of the mean; SQSTM1/p62: sequestosome 1; TSC2: tuberous sclerosis complex 2; TUBA4A: tubulin; TUBE: tandem ubiquitin binding entities; Ub: ubiquitin; UPS: ubiquitin proteasome system; WDR26: WD repeat domain 26; WT: wild type.
Introduction
The AMP-activated protein kinase (AMPK) is the key regulator of cellular energy homeostasis. AMPK is composed of a catalytic α-subunit, a regulatory β- and an adenosyl nucleotide-binding γ-subunit [Citation1]. It is activated under energy-deprived conditions, when ATP is depleted and AMP levels are increased [Citation2]. Among many AMPK-substrates, phosphorylation of RPTOR (regulatory associated protein of MTOR, complex 1) and TSC2 (TSC complex subunit 2) inhibit MTOR signaling and regulate many processes including macroautophagy/autophagy.
Posttranslational modification of proteins with ubiquitin orchestrates a vast number of biological processes, including targeted protein degradation by the ubiquitin-proteasome system (UPS), lysosomal/vacuolar protein degradation, endocytosis, intracellular trafficking, regulation of the secretory pathway and transcriptional regulation [Citation3]. Ubiquitination requires a sequential and hierarchical reaction of three enzyme classes, the ubiquitin-activating enzyme (E1), the ubiquitin-conjugating enzyme (E2) and the substrate specific ubiquitin ligase (E3) [Citation4]. The glucose-induced degradation deficient (GID)-protein complex is an evolutionarily highly conserved ubiquitin-ligase complex that regulates the metabolic switch from gluconeogenesis to glycolysis in Saccharomyces cerevisiae by targeting key enzymes of gluconeogenesis for 26S proteasomal degradation [Citation5–Citation8]. Individual subunits of the yeast GID-complex are conserved throughout the eukaryotic kingdom and Vid30/Gid1, Rmd5/Gid2, Vid24/Gid4, Vid28/Gid5, Gid7, Gid8 and Fyv10/Gid9 have their closest human orthologs in RANBP9 (RAN binding protein 9)-RANBP10, RMND5A (required for meiotic nuclear division 5 homolog A)-RMND5B, GID4 (GID complex subunit 4 homolog), ARMC8 (armadillo repeat containing 8), MKLN1 (muskelin 1) or WDR26 (WD repeat domain 26), GID8 (GID complex subunit 8 homolog) and MAEA (macrophage erythroblast attacher), respectively. These subunits are also part of the human GID-complex [Citation9,Citation10]. RMND5A protein of different species carries a non-canonical RING domain and is critical for ubiquitin ligase activity of the GID-complex in vivo and in vitro [Citation8,Citation11]. A recent publication describes the transcription factor HBP1 (HMG-box transcription factor 1) as a potential substrate of the murine GID-complex, suggesting a function in cell cycle control [Citation12]. Additionally, the vertebrate GID-complex regulates renal gluconeogenesis via interaction with the protein BICC1 (BicC family RNA binding protein 1), suggesting a function in the regulation of cellular metabolism also in vertebrates [Citation13].
In this context, we describe an ATP/AMP-independent regulation of AMPK activity, which depends on the ubiquitin-ligase function of the murine GID-complex. We found a decreased AMPK ubiquitination in rmnd5a knockout cells. These cells display a state of low energy with increased AMPK activity and autophagic flux but decreased MTOR activity. Concluding, we demonstrate that the murine GID-complex negatively regulates AMPK activity by ubiquitination. Consistently, knockdown of gid-genes extends both median and total lifespan in Caenorhabditis elegans.
Results
The GID-complex regulates autophagic flux and MTOR signaling
We decided to focus on RMND5A, because it is required for the ligase function of the vertebrate GID-complex [Citation8,Citation11]. In S. cerevisiae, the GID-complex regulates the metabolic switch from gluconeogenesis to glycolysis [Citation6]. Since the MTOR signaling pathway controls such adaptation [Citation14], we investigated whether the GID-complex affects MTOR signaling in vertebrates. To investigate a potential function of the GID-complex associated with MTOR signaling, we generated a NIH-3T3 rmnd5a knockout cell line using a CRISPR/CAS9-approach (rmnd5a-KO, hereinafter referred to as KO, and NIH-3T3 as WT). As depicted in , three sgRNA encoding plasmids were simultaneously transfected into WT cells (sense sequence: CATAGCAGTGTTTCTCGAGT; CATAGCCCAAAACAGTTCCT; CTACATCCAGCATTCCTTGT) and FACS sorted to obtain monoclonal cell lines. The collected KO cells have a 343 bp deletion positioned between 243 bp and 587 bp (,) leading to a nonsense frame shift mutation and a reduction in mRNA levels (Figure S1A,B). Expression of the Rmnd5b paralog was not affected by rmnd5a knockout (Figure S1C).
Figure 1. The GID-complex regulates autophagic flux and MTOR signaling. (A) Schematic representation of CRISPR-CAS9 generated rmnd5a (NCBI Reference Sequence: NM_024288.2) knockout mutant (rmnd5a-KO, hereinafter referred to as KO) in NIH-3T3 cells (hereinafter referred to as WT). Three sgRNA-targeting sites (blue) and a pair of genotyping primers (gray) are depicted. Oligonucleotide sequences are listed in . (B) genotyping PCR of KO. (C and D) Western blot of MTOR signaling and autophagy markers. Cells were grown on starvation medium (DMEM without glucose and serum; +) or DMEM (-) for 24 h. ACTB/β-actin as loading control. Quantification showing relative protein level of p-RPS6 compared with RPS6 (pink) and LC3-II compared with ACTB (blue). Unpaired t-test n = 3. **, P < 0.01. Abbreviations: p-, phosphorylated; SE, short exposure; LE, long exposure. (E and F) Representative confocal microscope images with autophagosomes (green). Cells were treated with Bafilomycin A1 (BafA1, 100 nM) for 4 h to block autophagosomes fusion with lysosomes. Autophagosomes were stained with anti-LC3B antibody. Scale bars, 10 μm. Quantification showing relative amount of autophagosomes (relative fluorescence area, left). Average values of WT are set to 1. Unpaired t-test n = 15. **, P < 0.01. (G and H) Western blot of SQSTM1 turnover. Cells were treated with cycloheximide (CHX, 100 μg/ml, protein synthesis inhibitor) for 24 h. ACTB/β-actin as loading control. Quantification showing relative protein level of SQSTM1 compared with ACTB. The half-life of SQSTM1 in WT cells (black), KO cells (red), KO cells treated with BafA1 (yellow) and KO cells treated with MG132 (blue) shown by dotted line (supplementary western blot shown in Figure S1D). WT cells at 0 h are set to 1.
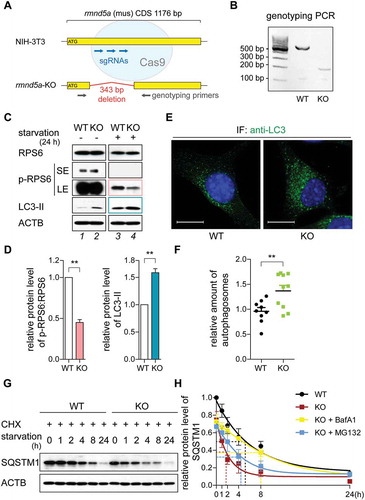
As a functional readout to assess MTOR signaling, we first measured the phosphorylation level of RPS6 (ribosomal protein S6; hereafter p-RPS6). Under nutrient-rich condition (high-glucose DMEM with 10% serum), p-RPS6 protein levels of WT and KO cells were similar (, compare lanes 1 and 2). However, after starvation for 24 h (starvation condition: DMEM without glucose and serum) KO cells had a significantly decreased p-RPS6 protein level compared to the WT (, compare lanes 3 and 4; , pink). These data show that a loss in GID-complex activity results in further reduction of MTOR activity when cells are deprived of glucose and serum. Decreased MTOR activity is associated with increased catabolic activity, such as autophagy, which is commonly assessed through detection of phosphatidylethanolamine modified MAP1LC3B (microtubule associated protein 1 light chain 3 beta; hereafter referred to as LC3; the phosphatidylethanolamine modified as LC3-II; the unmodified as LC3-I) level compared to the loading control [Citation15]. Similar to a reduction in MTOR activity we observed higher levels of LC3-II in KO cells when cells were deprived of glucose and serum (,, blue). In line with this notion, immunostaining of endogenous LC3 illustrated that KO cells contained more autophagosomes than WT cells (,). As described previously, intracellular distribution of MTOR changes from a lysosome-associated to a cytosolic distribution upon e.g. amino acid starvation [Citation16]. In KO cells, MTOR was mostly cytosolic and also resembled starvation conditions (Figure S4A). SQSTM1 (sequestosome 1) is an autophagic flux marker, which is specifically degraded by autophagy. revealed a lower basal level of SQSTM1 and a significantly faster SQSTM1 turnover in KO cells. The half-life of SQSTM1 in KO cells was reduced from 5.3 h to 1.8 h compared to the WT under starvation conditions (; compare black with red), revealing an enhanced autophagy-dependent degradation in KO cells. This faster turnover of SQSTM1 measured in KO cells was independent of proteasomal degradation but dependent on lysosomal degradation (; blue [MG132] and yellow [BafA1]).
The GID-complex regulates AMPK activity
To identify the trigger for the increased autophagic flux caused by rmnd5a knockout, we analyzed the activity of regulatory components in the AMPK-MTOR signaling axis by western blot analysis. Under nutrient-rich and more severe under starvation conditions, the protein levels of phosphorylated PRKAA/AMPKα at Thr172 (hereafter referred to as p-PRKAA) and 2 AMPK-substrates (p-RPTOR and p-TSC2 [Ser1387]; hereafter referred to as p-RPTOR and p-TSC2) were significantly increased in KO cells (; compare lane 2 and 4), suggesting an enhanced AMPK activity caused by RMND5A deficiency (,), especially under starvation conditions. In contrast, neither PRKAA protein () nor Prkaa mRNA level were severely affected by rmnd5a knockout (Figure S2B), indicating that the increase in AMPK activity was not due to an overall increase of PRKAA subunits, but due to a possible GID-dependent modification of PRKAA that regulates its activity. RMND5A contains a catalytically active RING domain, which possesses ubiquitin-ligase activity. To test whether RMND5A is a subunit of a bona fide ubiquitin ligase catalyzing PRKAA deactivation, we transfected the KO cells with plasmids encoding functional RMND5A (, green) or a functionally inactive RMND5A RING mutant (, purple). While functional RMND5A fully rescued the change in p-PRKAA and p-RPTOR levels (compare gray with green; not significant), the RING mutant failed to do so (compare gray with purple; P < 0.05), suggesting that the RING domain of RMND5A is important for AMPK activity regulation especially under starvation conditions. Specificity was further tested with nonspecific control siRNA (ns-siRNA) or siRNA to target Rmnd5a (siRmnd5a) and similar to the KO cells, Rmnd5a knockdown resulted in increased p-PRKAA and p-RPTOR levels especially after nutrient starvation (, compare black with red; P < 0.05). Together, these results suggest that enhanced AMPK activity is regulated by RMND5A ubiquitin ligase function especially at times of nutrient starvation.
Figure 2. The GID-complex regulates AMPK activity. (A and B) Western blot of AMPK activity markers. Cells were grown on starvation medium (DMEM without glucose and serum; +) or DMEM (-) for 24 h. ACTB as loading control. Long exposure blot shown in Figure S2A. Quantification showing relative protein level of p-PRKAA compared with PRKAA (B). Unpaired t-test n = 3. *, P < 0.05; **, P < 0.01. (C) Western blot of AMPK activity markers. WT cells were transfected with siRNA against Rmnd5a. KO cells were transfected with plasmid encoding mouse Rmnd5a (NCBI Reference Sequence: NM_024288.2) or Rmnd5a RING domain C354S mutant (Rmnd5aC354S). After 24 h (plasmid) or 48 h (siRNA) of transfection, cells were subsequently starved for additional 24 h (+). ACTB as loading control. Quantification showing relative protein level of p-PRKAA compared with PRKAA. Unpaired t-test n = 3. *, P < 0.05. (D) Western blot of p-PRKAA. Cells were starved for 24 h and samples taken at indicated time points. ACTB as loading control. Quantification shown in (H). (E-G) Western blot of AMPK-MTOR signaling axis markers. Cells were starved for 6 h. ACTB as loading control. Quantification showing relative protein level of p-PRKAA compared with PRKAA (F), and p-RPTOR compared with RPTOR (G). WT cells at 0 h set to 1. Unpaired t-test n = 3. **, P < 0.01. (H) Quantification of (D) showing relative protein level of p-PRKAA compared to ACTB. WT cells at 0 h set to 1. Unpaired t-test n = 3. *, P < 0.05.
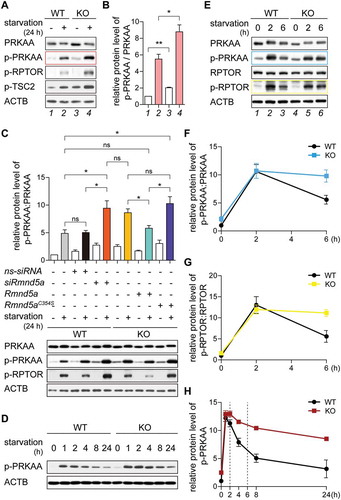
To further experimentally address this time dependent deactivation of AMPK after nutrient starvation, we grew cells under nutrient-rich condition, shifted them to starvation medium and took samples at the indicated time points. In both WT and KO cells, PRKAA was rapidly phosphorylated within 1 h (, between 0 h and 1 h). In WT cells, phosphorylation of PRKAA decreased during further starvation (, WT between 1 h and 24 h), while the level of p-PRKAA was less reduced in KO cells (, KO between 1 h and 24 h). Differences in p-PRKAA levels were subtle in the first 2 h of starvation (; 2 h) but were significantly increased after 6 h of starvation (; compare WT and KO at 6 h). This suggests that the GID-complex plays a major AMPK regulatory function when cells are adapting to starvation conditions to decrease p-PRKAA during long-term starvation. To measure PRKAA activity at these times we focused our western blot analysis on these particular time points and calculated the PRKAA:p-PRKAA ratio (). Especially at the 6 h time point the activity of AMPK was significantly increased (, compare blue [KO] with black [WT] at 6 h), suggesting that AMPK activity is reduced especially at times of longer starvation most probably because of faster p-PRKAA turnover between 2 h and 6 h of starvation. This time-dependent change in p-PRKAA also affected its substrates, e.g. p-RPTOR (). We thus conclude that GID-activity is required to negatively regulate AMPK activity, especially after a longer period of nutrient starvation. GID-activity was dispensable for rapid deactivation of AMPK by dephosphorylation as a quick response to glucose supplementation (Figure S2D) further supporting a direct GID-dependent regulation of AMPK.
The GID-complex regulates the metabolic adaptation to cellular starvation independent of intracellular ATP levels
The activation of AMPK in response to ATP depletion activates fatty acid oxidation and inhibits biosynthetic pathways such as protein translation to conserve intracellular ATP levels [Citation17]. In order to test whether the rmnd5a knockout would be sufficient to induce a similar adaptation, we compared the proteome of WT and KO cells by label-free quantitative mass spectrometry. Hierarchical clustering based on the correlation between proteome profiles obtained from 3 biological replicates for each cell line revealed a distinct signature induced by the rmnd5a knockout (). We thus performed differential protein expression analysis and identified 254 protein groups affected in KO vs. WT cells (adj. P < 0.01) (). Consistent with a response to AMPK activation, gene set enrichment analysis revealed increased levels of proteins involved in fatty acid degradation and peroxisomal proteins, and decreased level of the protein synthesis machinery in KO cells (). These phenotypic changes were already measurable under nutrient-rich conditions but seem more pronounced at times of starvation.
Figure 3. The GID-complex regulates the metabolic adaptation to cellular starvation independent of intracellular ATP levels. (A) Hierarchical clustering based on the correlation between proteome profiles based on 1207 protein groups quantified across the two cell lines. Three biological replicates were analyzed for each cell line. (B) Volcano plot depicting proteins differentially expressed between KO and WT cells. Significantly affected proteins (adj. P < 0.01) are displayed in red or blue according to whether they have higher or lower abundance in KO cells, respectively. Gene names of 40 most affected proteins (sorted by p value) are shown. (C) Gene set enrichment analysis was performed on proteomic data using KEGG pathways. Gene sets are plotted according to the Normalized Enrichment Score (NES) values. Positive and negative values are used for gene sets showing higher and lower abundance in KO cells, respectively. Only pathways significantly enriched (FDR < 0.1) are shown. (D) ATP concentration in WT and KO cells. Unpaired t-test n = 3. P = 0.1761. (E) Seahorse XF Cell Mito Stress Test. Mitochondrial respiration was assessed via oxygen consumption rate (OCR). Abbreviations: resp., respiration; prod., production. (F) Quantification of ATP production (orange area) showing no significant difference between WT and KO cells. Unpaired t-test n = 3. P = 0.3513. (G) Seahorse Glycolysis Stress Test. Glycolytic function was assessed via extracellular acidification rate (ECAR). (H) Quantification of glycolysis (the blue area) showing no significant difference between WT and KO cells. Unpaired t-test n = 3. P = 0.2533.
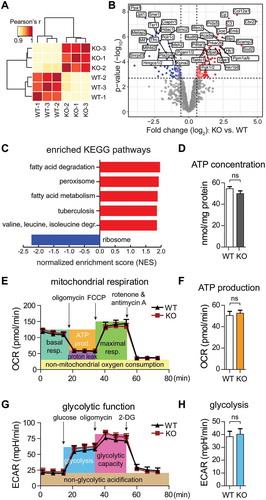
AMPK activity is normally regulated by the AMP:ATP ratio in the cell, which depends on the efficiency of respiratory-chain or substrate level phosphorylation. Thus, we investigated whether RMND5A deficiency affected the production of ATP, e.g. by defects in glucose uptake. We assessed mitochondrial respiration and ATP production by measuring the oxygen consumption rate (OCR) (,) and glycolytic function by measuring extracellular acidification rate (ECAR) (,). The efficiency of these two major ATP generating pathways was not affected by GID-complex deficiency. Consistently, WT and KO cells contained similar ATP concentrations (). Quantitative metabolomics analysis for a subset of different metabolites further revealed that ATP, GTP and NADH levels were not altered in KO cells. Paradoxically, we also measured reduced AMP/ADP and GMP/GDP levels in KO cells reflecting a high cellular energy status (see ). Concentrations of glucose 6-phosphate, fructose 6-phosphate and other glycolytic metabolites including the previously described allosteric AMPK regulator fructose 1,6-bisphosphate [Citation18] were not significantly changed. Consistent with enhanced branched chain amino acid (BCAA) degradation in KO cells we measured significantly reduced concentrations of different amino acids like leucine, isoleucine and valine (see ).
Table 3. Plasmids used in this study.
Table 4. Antibodies used in this study.
Table 5. Statistics for RNAi knockdown of Gid orthologs in C. elegans.
Table 6. Peptides and protein IDs of GID-complex subunits identified after PRKAA/AMPK immunoprecipitation in KO cells.
Table 7. Absolute concentration of metabolic compounds in WT and KO cells.
Together, we show that RMND5A deficiency results in the activation of metabolic pathways normally activated under nutrient deprived conditions. These include the increase of fatty acid and branched chain amino acid degradation, as well as a strong decrease in translational activity. Despite being consistent with increased AMPK activity, AMPK activation is independent of glycolysis and/or mitochondrial respiration, ATP:AMP ratio and fructose 1,6-bisphosphate levels in the cell. Our data strongly support that AMPK activity is directly regulated by the GID-complex independent of the ATP:AMP ratio and previously described allosteric AMPK regulators.
The GID-complex regulates AMPK activity via ubiquitination and proteasomal degradation
Since the RING domain of RMND5A was required for normal AMPK activation (, compare green and purple), we reasoned that p-PRKAA or PRKAA is regulated by GID-dependent ubiquitination and subsequent proteasomal degradation to adjust AMPK activity especially at times of nutrient starvation. To test this, we treated cells with the proteasome inhibitor MG132 and subsequently measured PRKAA and p-PRKAA protein level (). The untreated WT control cells showed decreased p-PRKAA and PRKAA protein levels after 6 h starvation (, DMSO between 2 h and 6 h). However, the inhibition of proteasome prevented this PRKAA:p-PRKAA decline (, MG132 between 2 h and 6 h). In contrast, this effect was not apparent in WT cells treated with the autophagy inhibitor bafilomycin A1 (BafA1) (Figure S2E). This shows that PRKAA degradation after longer starvation is dependent on proteasomal but not lysosomal degradation, revealing that AMPK deactivation is not only regulated by dephosphorylation, but additionally by proteasomal degradation. It further implies that the degradation of PRKAA is particularly important to adjust AMPK activity at times of prolonged starvation, likely as an adaptation mechanism to reduce energy production via alternative sources e.g. amino acid degradation. Consistent with this hypothesis, both PRKAA and p-PRKAA turnover was significantly slowed down in KO cells compared to WT (,). The specific reduction of p-PRKAA will affect PRKAA levels and the other way around. To critically test whether PRKAA or p-PRKAA is degraded by the proteasome we first measured PRKAA stability without prior phosphorylation under conventional nutrient rich growth conditions. Under these conditions PRKAA was a stable protein, suggesting that it is not degraded rapidly (Figure S3B). Additionally, we showed that a non-phosphorylatable T183A mutation (corresponds to Thr172 in humans) was stabilized upon longer starvation (Figure S3C). We thus reason that it is indeed p-PRKAA that is targeted by the GID-complex for proteasomal degradation.
Figure 4. The GID-complex regulates K48-dependent polyubiquitination of AMPK. (A and B) Western blot of p-PRKAA. Cells were starved for 6 h with (+) or without (-) MG132 treatment (10 μM, proteasome inhibitor). ACTB as loading control. Quantification showing relative protein level of p-PRKAA compared to ACTB in WT cells. (C) Western blot of PRKAA ubiquitination. Cells were starved for 2 h, then treated with starvation medium containing MG132 for additional 4 h. Cell lysates were immunoprecipitated by anti-PRKAA antibody and immunoblotted with TUBE (high affinity ubiquitin binding peptide). (D and E) Western blot of p-PRKAA. WT cells transfected with different ubiquitin mutants for 24 h, then starved for 6 h. ACTB as loading control. Quantification showing relative protein level of p-PRKAA compared to ACTB. Abbreviations: Ub, wild-type ubiquitin; Ub[K48], ubiquitin with one lysine residue left at position 48; UbK48R, ubiquitin with K48R mutation. Plasmids shown in . (F and G) Western blot of PRKAA and p-PRKAA turnover. Cells were starved for 24 h and simultaneously treated with CHX. ACTB as loading control. Quantification showing relative protein level compared to ACTB. WT cells starved for 1 h are set to 1.
![Figure 4. The GID-complex regulates K48-dependent polyubiquitination of AMPK. (A and B) Western blot of p-PRKAA. Cells were starved for 6 h with (+) or without (-) MG132 treatment (10 μM, proteasome inhibitor). ACTB as loading control. Quantification showing relative protein level of p-PRKAA compared to ACTB in WT cells. (C) Western blot of PRKAA ubiquitination. Cells were starved for 2 h, then treated with starvation medium containing MG132 for additional 4 h. Cell lysates were immunoprecipitated by anti-PRKAA antibody and immunoblotted with TUBE (high affinity ubiquitin binding peptide). (D and E) Western blot of p-PRKAA. WT cells transfected with different ubiquitin mutants for 24 h, then starved for 6 h. ACTB as loading control. Quantification showing relative protein level of p-PRKAA compared to ACTB. Abbreviations: Ub, wild-type ubiquitin; Ub[K48], ubiquitin with one lysine residue left at position 48; UbK48R, ubiquitin with K48R mutation. Plasmids shown in Table 3. (F and G) Western blot of PRKAA and p-PRKAA turnover. Cells were starved for 24 h and simultaneously treated with CHX. ACTB as loading control. Quantification showing relative protein level compared to ACTB. WT cells starved for 1 h are set to 1.](/cms/asset/eabeb152-79fa-40a0-abfe-6bd58f2325cd/kaup_a_1695399_f0004_c.jpg)
To directly test for PRKAA ubiquitination, we immunoprecipitated endogenous PRKAA and subsequently measured ubiquitin modified PRKAA in WT and KO cells starved for 6 h (). Cell lysates (input) showed similar ubiquitination pattern (IB: TUBE) and similar PRKAA levels (IB: PRKAA) in both WT and KO cells. Ubiquitination of immunoprecipitated PRKAA (IP: PRKAA, IB: TUBE) revealed an ubiquitin specific band at around 75 kDa with the typical ubiquitin signal above in WT cells, indicating that PRKAA is indeed ubiquitinated. Interestingly, the ubiquitin pattern was strongly impaired in KO cells, suggesting that ubiquitination of PRKAA is dependent on GID-activity. Similar results were observed when cells were transiently transfected with plasmids encoding HIS-tagged ubiquitin and subsequently used for PRKAA immunoprecipitation (Figure S3A). Moreover, the immunoprecipitation of endogenous PRKAA from WT and KO cells after 6 h starvation resulted in the co-precipitation of at least 2 known subunits of the GID-complex, MKLN1 and RANBP10, specifically in KO cells (see ) suggesting that p-PRKAA is directly ubiquitinated by the GID-complex.
Substrate polyubiquitination via the internal ubiquitin residue K48 is the most common modification that regulates UPS dependent degradation of substrates. To test this for p-PRKAA, we overexpressed different ubiquitin variants in WT cells and followed p-PRKAA protein levels like in previous experiments (). Transfection of wild-type ubiquitin (Ub) and ubiquitin with only one lysine residue located at position 48 (Ub[K48]) did not affect p-PRKAA protein levels at prolonged starvation (, Ub and Ub[K48] between 2 h and 6 h). In contrast, transfection of ubiquitin with a K48R mutation (UbK48R) led to stabilization of p-PRKAA at the 6 h time point (, UbK48R), indicating that p-PRKAA turnover requires K48-dependent polyubiquitination. This treatment clearly phenocopies WT cells treated with MG132 () and KO cells, suggesting that p-PRKAA turnover is regulated by GID-complex dependent K48 linked polyubiquitination and subsequent proteasomal degradation.
The GID-complex alters primary cilia length by regulating AMPK activity
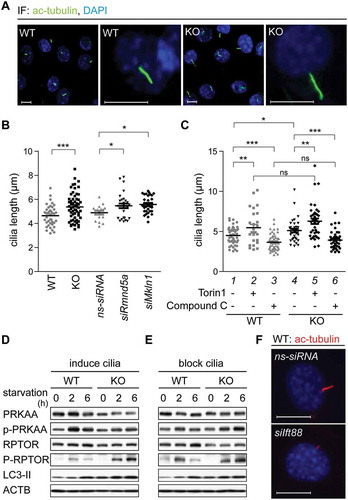
Several publications describe a functional interplay between the AMPK-MTOR signaling axis and primary cilia length, e.g. cells treated with the MTOR inhibitor Rapamycin have elongated primary cilia [Citation22]. Measuring primary cilia length can thus be used to assess AMPK-MTOR signaling activity. We started out to measure primary cilia length in WT cells, KO cells and WT cells transfected with ns-siRNA, siRNA against Rmnd5a (siRmnd5a) or siRNA against Mkln1 (homologous gene of yeast GID7) (siMkln1). After treating the cells with cilia-inducing medium (high-glucose DMEM with 0.5% serum) for 24 h, we measured an average primary cilium length of 4.6 μm in WT cells and of 4.9 μm in WT cells transfected with ns-siRNA (). Consistent with increased AMPK activity, KO cells and WT cells with a Gid knockdown had significantly elongated primary cilia (,) (KO, 5.4 μm; siRmnd5a, 5.5 μm; siMkln1, 5.6 μm). These data show that the depletion of different GID-subunits results in a significant elongation of primary cilia. To test whether this is dependent on AMPK activity, we mimicked cellular starvation by treating cells with Torin1 (MTOR signaling inhibitor) or vice versa mimicked a high energy status with Compound C (AMPK inhibitor) to subsequently measure primary cilia length. Inhibition of MTOR signaling in WT cells led to a significant elongation of primary cilia (, compare lanes 1 and 2). On the other hand, inhibition of AMPK with Compound C led to shortened primary cilia (, compare lanes 1 and 3). This data indicates that AMPK and MTOR activity can influence primary cilium length. Similarly, cilia length was also altered in KO cells and treatment with Compound C led to a significant reduction of cilium length, clearly demonstrating that elongated cilia measured in KO cells are due to increased AMPK activity (, compare lanes 4 and 6). Neither the induction () nor the blockade of ciliogenesis with Ift88 specific siRNA () affected AMPK activity, further supporting that AMPK activity is directly regulated by the GID-complex and not by upstream primary cilia dependent sensing and signaling processes.
Figure 5. The GID-complex alters primary cilia length by regulating AMPK activity. (A) Representative microscope images of primary cilia. Cells were treated with cilia-inducing medium (high-glucose DMEM with 0.5% serum) for 24 h. Ciliary axoneme were stained with anti-acetylated TUBA4A (ac-tubulin) antibody (green). Scale bars, 10 μm. (B) Quantification of primary cilia length. Cells were transfected with Rmnd5a or Mkln1 siRNA for 24 h, then treated with cilia-inducing medium for 24 h. Knockdown efficiency is shown in Figure S3D. Mean ± SEM of column: WT, 4.643 ± 0.1355 μm (n = 40); KO, 5.375 ± 0.1485 μm (n = 59); ns-siRNA, 4.894 ± 0.1559 μm (n = 17); siRmnd5a, 5.464 ± 0.1920 μm (n = 29); siMkln1, 5.574 ± 0.1325 μm (n = 30). Unpaired t-test, *, P < 0.05; ***, P < 0.001. Oligonucleotide sequences shown in . (C) Quantification of primary cilia length. Cells were treated with cilia-inducing medium containing Torin1 (1 μM, MTOR signaling inhibitor) or Compound C (10 μM, AMPK inhibitor) for 24 h. Mean ± SEM: WT with DMSO (control) 4.491 ± 0.1566 μm (n = 48); WT with Torin1, 5.472 ± 0.3986 μm (n = 27); WT with Compound C, 3.655 ± 0.1396 μm (n = 51); KO with DMSO 5.133 ± 0.2301 μm (n = 37); KO with Torin1, 6.275 ± 0.3337 μm (n = 40); KO with Compound C, 3.914 ± 0.1652 μm (n = 43). Unpaired t-test, *, P < 0.05; **, P < 0.01; ***, P < 0.001. (D) Western blot of AMPK markers. Cells were treated with cilia-inducing medium for 24 h to induce ciliogenesis, afterward shifted to starvation medium for 6 h. ACTB as loading control. (E) Like (D), with previous transfection of siRNA against Ift88 (Mus musculus, NM_009376.2) for 24 h to block cilia formation. (F) Representative microscope images of primary cilia. WT cells were transfected with siRNA against Ift88. Ciliary axoneme was stained by anti-ac-tubulin antibody (red). Scale bars, 10 μm.
Gid-complex proteins regulate organismal lifespan
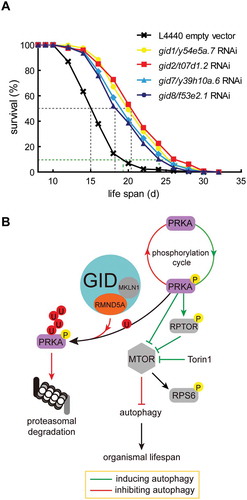
Rapamycin is a specific inhibitor of MTOR activity and is known to alter organismal lifespan [Citation25,Citation26]. Our results show that depletion of GID-complex subunits similarly result in reduced MTOR activity and increased AMPK activity. Therefore, we planned to investigate an influence of reduced GID-complex activity on organismal lifespan. A classical model organism to investigate organismal lifespan is the nematode C. elegans. Since the members of the GID-complex are even conserved in C. elegans (), we knocked down t07d1.2 (homologous gene of Gid2/Rmnd5a) and measured lifespan of C. elegans. Strikingly, the knockdown of t07d1.2 led to a significant extension of both the median (50% survival) and maximum (10% survival) lifespan when compared to the empty vector control (, compare red and black curves). The maximum lifespan in the knockdown group was elongated to 24.8 d compared to the control (18.4 d) with an extension of 6.4 d (for statistical details see and Table 5 footnote “a,b,c”). Similarly, the individual knockdown of all other conserved GID-subunits in this organism led to a significant extension of both median and maximum lifespan ( and ). The knockdown quality was assessed by qPCR and is shown in Figure S3E. Our data strongly suggest that GID-complex deficiency also causes AMPK activation in C. elegans, thereby resulting in lifespan extension.
Figure 6. GID-complex proteins regulate organismal lifespan. (A) Survival rates of C. elegans depleted of Gid orthologs (gid1/y54e5a.7, gid2/t07d1.2, gid7/y39h10a.6, gid8/f53e2.1) through RNAi. Experiments were conducted in quintuplicates and were performed two independent times (details in ). One representative experiment is shown. Log-rank test, p < 0.0001. Knockdown efficiency shown in Figure S3E. (B) Model of GID-complex dependent regulation of AMPK activity. The GID-complex as a negative regulator of AMPK activity to adjust AMPK activity at times of prolonged starvation. p-AMPK activity is adjusted by K48-dependent polyubiquitination and subsequent proteasomal degradation. This process is disturbed when cells are lacking GID-complex activity, resulting in increased AMPK activity, reduced MTOR activity and increased autophagic flux.
Discussion
In S. cerevisiae the GID-complex regulates the metabolic switch from gluconeogenesis to glycolysis by directly targeting key enzymes of gluconeogenesis for polyubiquitination and subsequent proteasomal degradation. Yeast GID-complex substrates include fructose-1,6-bisphosphatase (Fbp1), malate-dehydrogenase (Mdh2) and phosphoenolpyruvat-carboxykinase (Pck1) [Citation8,Citation9]. Recent publications also describe the human GID-complex in the context of regulating renal gluconeogenesis [Citation13]. However, human FBP1 (fructose-bisphosphatase 1) and PCK1 (phosphoenolpyruvate carboxykinase 1) are not direct substrates of the GID-complex in vertebrate cell systems and in vitro [Citation12]. This suggests a more complex function of the vertebrate GID-complex in the regulation of metabolism, which may be mediated by other well-known regulators. For instance, AMPK is known to control gluconeogenesis by regulating the transcription of PCK1 and G6PC (glucose-6-phosphatase) in the liver [Citation27].
In this manuscript we show that lack of GID-complex activity results in distinct phenotypic changes consistent with a response to AMPK activation. This includes an increase in autophagic flux, branched chain amino acid (BCAA) and fatty acid degradation, a reduction in MTOR activity, longer primary cilia and significant life span extension. We provide strong evidence that these changes are due to direct ubiquitination of PRKAA in a GID-complex dependent manner. We show that the GID-complex binds PRKAA only in KO cells (see ) and depletion of GID-subunits results in lack of PRKAA ubiquitination and stabilization of p-PRKAA (, S3A and 4F). In S. cerevisiae the deletion of Rmd5p allows the association of other Gid-subunits but prevents substrate polyubiquitination and subsequent degradation [Citation28]. Given the high degree of topological conservation [Citation12] we predict that deletion of RMND5A similarly results in an intact GID-complex that binds AMPK but cannot ubiquitinate it for subsequent degradation ultimately resulting in increased AMPK activity (p-PRKAA levels). This phenomenon was mostly dependent on glucose starvation (Figure S2H and S2F).
Several publications describe AMPK regulation by ubiquitin modification with at least two different functional outcomes. On the one hand, there is evidence that ubiquitination of PRKAA has a negative regulatory function independent of its degradation. The deubiquitinating enzymes USP10 and USP9X are involved in this process [Citation29,Citation30]. On the other hand the MAGEA3/A6-TRIM28 ubiquitin ligase complex downregulates AMPK through ubiquitination and degradation, however only in the context of cancer [Citation31]. Taken together, the existence of several types of ubiquitin modifications on AMPK subunits differing both in linkage type and/or modified AMPK subunits are likely to exist. Our data is consistent with GID-complex catalyzed PRKAA ubiquitination that specifically induced the degradation of p-PRKAA after prolonged glucose starvation. Interestingly, downregulation of p-PRKAA was previously described in rat muscles incubated with glucose or leucine [Citation32]. Together, we like to predict that this process is a response to a shift in energy balance to prevent ongoing autophagy at times of prolonged starvation. We further speculate that similar to MTOR regulation [Citation33] this process constitutes a response to e.g. free amino acids generated by autophagy.
It is difficult to distinguish between GID-complex dependent p-PRKAA and PRKAA turnover. However, our data support that specifically p-PRKAA levels are temporally controlled by glucose starvation. Firstly, the most distinct phenotypes were measured when p-PRKAA levels are high (after 2 h of starvation). Furthermore, non-phosphorylated PRKAA was stable when cells were not starved (Figure S3B). Finally, a T183A mutation of the phosphorylation site (corresponding to T172 in human) resulted in stabilization of PRKAA upon starvation (Figure S3C). Together our results suggest that the GID-complex specifically ubiquitinates p-PRKAA but not unphosphorylated PRKAA for subsequent proteasomal degradation upon long-term starvation.
Several AMPK upstream activators have been described in the literature, e.g. phosphorylation of Thr172 in the activation loop of PRKAA can be mediated by STK11 directly, or in response to calcium flux via CAMKK2 kinase (calcium/calmodulin dependent protein kinase kinase 2) [Citation34]. This phosphorylation step requires high levels of AMP that binds to the γ-subunit of AMPK and subsequently induces a structural change that leads to the exposure of the phosphorylation site. We measured induction of Thr172 phosphorylation upon glucose/serum starvation in both WT and KO cells (, between 0 h and 2 h), suggesting that GID-activity neither affects phosphorylation of PRKAA nor the induction of the active conformational change. Further, we measured similar ATP and decreased AMP levels in KO cells suggesting that AMPK activity is deregulated by different mechanisms (see and ). Similarly, we can exclude defects in PRKAA dephosphorylation as an explanation for AMPK hyperactivation, because glucose/serum supplementation in both WT and KO cells led to rapid PRKAA dephosphorylation (Figure S2D). These observations suggest that upstream glucose sensing and signaling of AMPK regulating pathways are still functional in KO cells and further support that the GID-complex directly modifies AMPK activity.
Changes in the AMPK-MTOR signaling axis, like we measured in GID-subunit-depleted cells, are known to alter lifespan in various organisms. Consistently, our results showed that individual depletion of all tested GID-subunits resulted in an extended lifespan of C. elegans. This observation additionally supports that the GID-complex integrates intracellular signals to regulate AMPK activity in order to adjust cell metabolism to energy expenditure.
Ubiquitin ligases are promising drug targets to treat different pathologies. Thus we like to suggest that inhibition of the GID-complex is a promising strategy for pharmacological manipulation of the AMPK-MTOR signaling axis to treat chronic conditions like polycystic kidney diseases, type 2 diabetes.
Materials and methods
Organisms and maintenance
NIH-3T3 cells (ATCC, CRL-6442, RRID:CVCL_0594) were maintained in Dulbecco’s modified Eagle’s medium with 4500 mg/L glucose (high concentration) (Sigma-Aldrich, D6546) or without glucose (no glucose) (Gibco, 11966–025) supplemented with 10% (v:v) fetal calf serum (FCS) (Gibco, 10270–106) if not mentioned otherwise. A rmnd5a knockout cell line was constructed as depicted in . Briefly, CRISPR/CAS9 plasmids were ordered from Santa Cruz Biotechnology (sc-427065), transfected with Lipofectamine 2000 (Thermo Fisher Scientific, 11668019) and individual GFP-positive clones sorted into 96-well plates. Positive rmnd5a knockout clones were selected by genotyping PCR with primers listed in . The C. elegans strain wild-type Bristol N2 was provided by the Caenorhabditis Genetics Center that is supported by the National Institutes of Health-Office of Research Infrastructure Programs. For RNAi knockdown experiments E.coli HT115 f53e2.1 and y39h10a.6 clones were derived from an Ahringer RNAi library (Source BioScience [Citation43],). t07d1.2 and y54e5a.7 were derived from Vidal ORFeome RNAi libraries (Source BioScience) [Citation44].
Table 1. Proteins of the Gid-complex with accession numbers and protein domains.
Table 2. Oligonucleotides used in this study.
Plasmids and oligonucleotides
cDNA of Rmnd5a variants (NCBI Reference Sequence: NM_024288.2) were synthesized by BioCat. Transfections were performed using Lipofectamine 2000 for plasmids and Lipofectamine RNAiMAX (Thermo Fisher Scientific, 13778–075) for siRNAs. Site directed mutagenesis was performed as described previously [Citation45]. All other plasmids and oligonucleotides are listed in and .
Western blotting and immunoprecipitation
Western blotting was performed as described previously [Citation8]. Cells were lysed with 50 mM Tris-HCl, pH 7.4, 2 mM EDTA, 1 mM EGTA, 50 mM NaF, 1 mM DTT, 10 mM Na4P2O7, 1 mM Na3VO4, 1% Triton X-100 (Serva, 37238), 0.1% SDS, 0.5 mM PMSF (Roche, 837091), 1× protease inhibitor cocktail (Roche, 11836153001). Protein was determined with the BCA assay (Thermo Fisher Scientific, 23227) and loaded 6 ~ 20 μg per lane. Antibodies are listed in . For signal quantification, X-ray films were scanned in the transparency mode and saved as 600 dpi tiff images. Densitometry was performed with the ImageJ software (NIH) of short exposure signals (SE) using the rectangular area selection tool. Background signals were subtracted and relative protein levels were compared with the loading control (ACTB/β-actin). For IP experiments, we used μMACS Protein A MicroBeads (Miltenyi Biotec, 130-071-001). For each IP setup, 3 μl of anti-PRKAA/AMPK antibody (Cell Signaling Technologies, 2532) was incubated with 1 ml of cell lysate (1.5 mg/mL) at 4°C overnight then incubated for additional 1 h and eluted according to the protocol provided by the manufacturer.
cDNA synthesis and quantitative PCR (qPCR)
RNA was extracted by using the RNeasy Kit (Qiagen, 74104). 1 µg RNA were reverse transcribed into cDNA in a 10 µl reaction set by using HiScript II Q RT Supermix for qPCR (Vazyme Biotech, R222). A 20 µl qPCR reaction set contained 20 ng cDNA, 1× Maxima SYBR Green/ROX qPCR Master Mix (Thermo Fisher Scientific, K0221), 0.3 μM forward primer, and 0.3 μM reverse primer. A qPCR run on Roche LightCycler 480 II consisted of an UDG pre-treatment for 2 min at 50°C, an initial hot start for 10 min at 95°C, followed by 40 cycles with a denaturation step of 15 s at 95°C and an annealing/extension step of 60 s at 60°C. Afterward, a melt curve was recorded. Each measurement was repeated three times, and each sample was analyzed in triplicate with Hprt (hypoxanthine guanine phosphoribosyl transferase) as an internal control. qPCR primers are listed in . Relative expression was determined using the Abs Quant/2nd Derivative Max analysis method, given as mean ± SEM, statistic analyzed by t-test and measured by two-tailed P value.
Immunofluorescence
Cells were grown on Millicell EZ slide (Merck Millipore, PEZGS0416) pre-treated with 0.1% gelatin solution for 30 min at 37°C, subsequently cells were fixed with 4% paraformaldehyde (PFA) for 10 min at 4°C (or pre-cool methanol for 10 min at −20°C for anti-MAP1LC3B antibody), permeabilized, and blocked with 0.3% Triton X-100, 3% BSA, 1× PBS for 30 min at room temperature. Antibodies are listed in . We used ImageJ software to quantify the fluorescence intensity.
Seahorse measurements
The oxygen consumption rate (OCR) and extracellular acidification rate (ECAR) in WT and KO cells were measured with a Seahorse XF96 Extracellular Flux Analyzer (Agilent). Cells were seeded in XF96 cell culture microplates (Seahorse Bioscience, 101085–004) at 15,000 cells per well in 80 µl of DMEM medium and incubated at 37°C in 5% CO2 for 24 h. Afterward, DMEM was replaced with 180 µl assay medium containing 11 mM glucose, 2 mM pyruvate and 2 mM glutamine to measure OCR or 2 mM glutamine to measure ECAR with the Seahorse XF Glycolysis Stress Test Kit (Agilent, 103020–100). Cells were incubated at 37°C for 60 min to allow temperature and pH equilibration. For OCR measurement with the Mito Stress Test Kit (Agilent, 103015–100), 2 µM oligomycin, 2 µM carbonyl cyanide-4 (trifluoromethoxy) phenylhydrazone (FCCP) and 0.5 µM rotenone & antimycin included in the kit were added respectively to measure the minimum oxygen consumption, the maximal respiration rate and the non-mitochondrial oxygen consumption. For ECAR measurement, 10 mM glucose, 2 µM oligomycin and 50 mM 2-didesoxy-glucose (2DG) also included in the kit were added respectively to measure glycolysis, glycolytic capacity and non-glycolytic acidification.
ATP measurement
Cellular concentration of intracellular ATP was measured with the BioThema ATP Kit SL (BioThema, 144–041). Cells were seeded in 24-well plates and grown to confluency and were fixed by adding 0.5 ml ethanol. Ethanol was evaporated and cells were subsequently resuspended in 250 μl of Tris-EDTA (pH 7.5) (BioThema, 21–103), frozen, scraped off and transferred to a 1.5 ml reaction tube. After centrifugation (1 min at 13 000 rpm), the lysate was used for ATP measurement in a microplate luminometer (CLARIOstar). To do so, 8 μl of sample was further diluted (1:20) in 152 μl of Tris buffer (BioThema, 21–103), mixed with 40 μl ATP reagent SL and light emission was measured before (Ismp) and after (Ismp+std) adding10 μl of ATP standard diluted (1:5) in Tris-EDTA buffer. The ATP concentration was determined with the following calculation: ATPsmp = 10−7× Ismp/(Ismp+std – Ismp).
C. elegans maintenance and lifespan assays
Nematodes were grown and maintained at 20°C; ambient temperatures during handling (transfer) of worms were between 20 and 25°C. Maintenance was on nematode growth medium (NGM) agar plates spotted with E. coli OP50 as food source, as described elsewhere [Citation46]. Synchronization was performed by washing, followed by centrifugation to separate the eggs from the nematodes. Eggs were transferred to fresh NGM agar plates (Carl Roth, 6494) and allowed to hatch and grow for 64 h. Lifespan assays with C. elegans-specific RNA interference were conducted as previously described [Citation47]. Briefly, young adult worms, 64 h after synchronization, were transferred to NGM agar plates containing 1 mM IPTG (Thermo Fisher, R0392), 100 µg/ml ampicillin (Carl Roth, K029) and, if necessary, 12.5 μg/ml tetracycline (AppliChem, A2228). Plates were spotted with E. coli HT115 (DE3) containing L4440 empty vector (Addgene, 1654) or L4440 containing a f53e2.1, y39h10a.6, t07d1.2 or y54e5a.7 DNA fragment. For the first 10 d, nematodes were transferred to fresh plates daily; thereafter, they were transferred every other day. Experiments were performed in quintuplicates and two independent times. Worms showing no movement, no reaction to gentle stimulation and no pharyngeal pumping were scored as dead. Worms lost or disintegrated due to internal hatchings were censored.
Proteomics data acquisition
Following cell lysis, samples were spun down at 10,000 g for 10 min at 4°C. Protein concentration was assessed using the Biodrop µLite (Serva, 80-3006-51.01) as per manufacturers instructions (using BSA as standard) and 20 µg of protein from each sample was pipetted into a fresh Protein LoBind microcentrifuge tube (Eppendorf, 0030108116). Samples were further centrifuged at 16 000 g for 10 min at 4°C to remove excess DNA and supernatant removed to a fresh tube. Each sample underwent acetone precipitation to remove salts and residual nucleic acids (briefly with the addition of 6 volumes of ice-cold acetone and left at −20°C overnight, samples spun at 16,000 g for 10 min at 4°C, and carefully remove supernatant, and allowing pellet to air-dry). The pellet was subsequently resuspended in 40 µl of 25 mM ammonium bicarbonate (UCB, 1137). Each sample was reduced and alkylated (10 mM DTT (Neofroxx, 1114) for 30 min at 60°C and 55 mM IAA (Sigma, A3221) for 20 min at room temperature in the dark) before being digested with trypsin (Promega, V511A) at 37°C overnight in an air circulated incubator. Finally, peptides were cleaned and concentrated using Pierce Peptide Desalting spin columns (Thermo Fisher, 89,851) as per manufacturers instructions, dried down in a vacuum concentrator and resuspended in 20 µl of 0.1% formic acid (FA) (Biosolve, 069141). Approximately 1 µg of desalted peptides were separated using the nanoAcquity UPLC system (Waters, 176,016,000) fitted with a trapping (nanoAcquity Symmetry C18, 5µm, 180 µm x 20 mm) and an analytical column (nanoAcquity BEH C18, 1.7µm, 75µm x 250mm). The outlet of the analytical column was coupled directly to an Orbitrap Fusion Lumos (Thermo Fisher Scientific, IQLAAEGAAPFADBMBHQ) using the Proxeon nanospray source. Solvent A was water, 0.1% (v:v) formic acid (Roth, 4724.3) and solvent B was acetonitrile (Biosolve, 0001204102BS), 0.1% (v:v) formic acid. The samples were loaded with a constant flow of solvent A at 5 µL/min onto the trapping column. Trapping time was 6 min. Peptides were eluted via the analytical column with a constant flow of 0.3 µL/min. During the elution step, the percentage of solvent B increased in a linear fashion from 3% to 25% in 30 min, then increased to 32% in 5 more min and finally to 50% in a further 0.1 min. Total runtime was 60 min. The peptides were introduced into the mass spectrometer via a Pico-Tip Emitter 360 µm OD x 20 µm ID; 10 µm tip (New Objective) and a spray voltage of 2.2 kV was applied. The capillary temperature was set at 300°C. The RF lens was set to 30%. Full scan MS spectra with mass range 375–1500 m/z were acquired in profile mode in the Orbitrap with resolution of 120,000 FWHM. The filling time was set at maximum of 50 ms with limitation of 2 × 10⁵ions. The “Top Speed” method was employed to take the maximum number of precursor ions (with an intensity threshold of 5 × 10³) from the full scan MS for fragmentation (using HCD collision energy, 30%) and quadrupole isolation (1.4 Da window) and measurement in the ion trap, with a cycle time of 3 s. The MIPS (monoisotopic precursor selection) peptide algorithm was employed but with relaxed restrictions when too few precursors meeting the criteria were found. The fragmentation was performed after accumulation of 2 × 10³ions or after filling time of 300 ms for each precursor ion (whichever occurred first). MS/MS data were acquired in centroid mode, with the Rapid scan rate and a fixed first mass of 120 m/z. Only multiply charged (2+ – 7+) precursor ions were selected for MS/MS. Dynamic exclusion was employed with maximum retention period of 60 s and relative mass window of 10 ppm. Isotopes were excluded. Additionally only 1 data dependent scan was performed per precursor (only the most intense charge state selected). Ions were injected for all available parallelizable time. In order to improve the mass accuracy, a lock mass correction using a background ion (m/z 445.12003) was applied. For data acquisition and processing of the raw data, Xcalibur 4.0 (Thermo Scientific) and Tune version 2.1 were employed.
Proteomics data analysis
Raw data were searched using the Andromeda search engine [Citation48] build into MaxQuant (version 1.5.3.28) [Citation49]. The data were searched against the mouse Uniprot database (Swissprot entry only, release 2016_01) together with a list of common contaminants appended. The data were searched with the following modifications: Carbamidomethyl (C) (fixed) and Oxidation (M) and Acetyl (Protein N-term) (variable). The mass error tolerance for the full scan MS spectra was set at 20 ppm and for the MS/MS spectra at 0.5 Da. The reversed sequences of the target database were used as decoy database. Peptide and protein hits were filtered at a false discovery rate of 1% using a target-decoy strategy [Citation50]. Additionally, only proteins identified by at least 2 unique peptides were retained.
Differential protein expression analysis was performed as described in [Citation51]. Briefly, the LFQ intensity values per protein (from the proteinGroups.txt output of MaxQuant) were used for quantitative analysis. The R package MSnbase [Citation52] was used to process proteomics data and perform data imputation using imputeLCMD. Missing values were imputed using a mixed strategy based on the definition of Missing At Random (MAR) and Missing Not At Random (MNAR) values. MNAR were defined for each pairwise comparison as values that were (i) missing in 3 out of 3, or 2 out of 3 biological replicates in one sample group, and (ii) present in all the 3 biological replicates in the second sample group. Because of their nonrandom distribution across samples, these values were considered as underlying biological difference between sample groups. MNAR values were computed using the method “MinDet” by replacing values with minimal values observed in the sample. MAR were consequently defined for each pairwise comparison as values that were missing in 1 out of 3 biological replicates per sample group. MAR values were imputed based on the method “knn” (k-nearest neighbors) [Citation52]. All the other cases (e.g., protein groups that had less than 2 values in both sample groups) were filtered out because of the lack of sufficient information to perform robust statistical analysis. Data were quantile normalized to reduce technical variations. Differential protein abundance was evaluated using the limma package [Citation53]. The mass spectrometry proteomics data have been deposited to the ProteomeXchange Consortium via the PRIDE [Citation54] partner repository with the dataset identifier PXD015170.
Metabolomics analysis
Targeted quantitative analysis was performed as described in manual E-170,602 supplied by “Human Metabolome Technologies (HMG)”. Briefly, 5 million cells per sample were washed with 10 mL of 5% mannitol solution in triplicates. Thereafter metabolites were extracted with 800 μL methanol and 550 μL of internal standard supplied by HMG. To remove macromolecules, cell extracts were subjected to an ultrafiltration step using centrifugal filter units supplied by HMG. Metabolites were measured and quantified using capillary electrophoresis mass spectrometry (CE-TOFMS and CE-QqQMS). Details of the setup are provided upon request.
Statistical analysis
Statistic values were calculated using t-test analysis with the GraphPad Prism 5 software as described. Data include values from at least three replicate experiments. For C. elegans lifespan analyzes, statistical calculations were performed using JMP software version 9.0 (SAS Institute Inc.), applying the log-rank test.
Supplemental Material
Download Zip (5.8 MB)Acknowledgments
We thank J. Herfurth and D. Arlt for excellent technical help and Dr. M. Fuszard for MS sample preparations. This work was supported by the Wilhelm-Roux program of the Martin-Luther University under Grant FKZ31/06; and Deutsche Forschungsgemeinschaft under Grant GRK 2155 (ProMoAge). PW was supported by the German Research Foundation (DFG) under the Emmy Noether Programme (grant WA3365/2-1) and under Germany’s Excellence Strategy (CIBSS – EXC-2189 – Project ID 390939984) as well as by an NHLBI Pathway to Independence Award (K99HL127275). The FLI is a member of the Leibniz Association and is financially supported by the Federal Government of Germany and the State of Thuringia. The authors gratefully acknowledge support from the FLI Core Facility Proteomics.
Disclosure statement
No potential conflict of interest was reported by the authors.
Supplementary material
Supplemental data for this article can be accessed here.
Additional information
Funding
Related Research Data
References
- Hardie DG, Ross FA, Hawley SA. AMPK: a nutrient and energy sensor that maintains energy homeostasis. Nat Rev Mol Cell Biol. 2012;13(4):251–262. [Cited 2012 March 23]. PubMed PMID: 22436748.
- Jansen M, Ten Klooster JP, Offerhaus GJ, et al. LKB1 and AMPK family signaling: the intimate link between cell polarity and energy metabolism. Physiol Rev. 2009;89(3):777–798. [Cited 2009 July 09]. PubMed PMID: 19584313.
- Pickart CM, Eddins MJ. Ubiquitin: structures, functions, mechanisms. Biochim Biophys Acta. 2004;1695(1–3):55–72. [Cited 2004 December 02]. PubMed PMID: 15571809.
- Sadowski M, Suryadinata R, Tan AR, et al. Protein monoubiquitination and polyubiquitination generate structural diversity to control distinct biological processes. IUBMB Life. 2012;64(2):136–142. [Cited 2011 December 02]. PubMed PMID: 22131221.
- Hämmerle M, Bauer J, Rose M, et al. Proteins of newly isolated mutants and the amino-terminal proline are essential for ubiquitin-proteasome-catalyzed catabolite degradation of fructose-1,6-bisphosphatase of Saccharomyces cerevisiae. J Biol Chem. 1998;273(39):25000–25005. [Cited 1998 September 17]. PubMed PMID: 9737955.
- Chen SJ, Wu X, Wadas B, et al. An N-end rule pathway that recognizes proline and destroys gluconeogenic enzymes. Science. 2017;355(6323):eaal3655. PubMed PMID: 28126757.
- Francis O, Han F, Adams JC. Molecular phylogeny of a RING E3 ubiquitin ligase, conserved in eukaryotic cells and dominated by homologous components, the muskelin/RanBPM/CTLH complex. PLoS One. 2013;8(10):e75217. PubMed PMID: 24143168; PubMed Central PMCID: PMCPMC3797097.
- Santt O, Pfirrmann T, Braun B, et al. The yeast GID complex, a novel ubiquitin ligase (E3) involved in the regulation of carbohydrate metabolism. Mol Biol Cell. 2008;19(8):3323–3333. [Cited 2008 May 30]. PubMed PMID: 18508925; PubMed Central PMCID: PMC2488282.
- Liu H, Pfirrmann T. The Gid-complex: an emerging player in the ubiquitin ligase league. Biol Chem. 2019. [Cited 2019 March 21]. PubMed PMID: 30893051. DOI:10.1515/hsz-2019-0139
- Texier Y, Toedt G, Gorza M, et al. Elution profile analysis of SDS-induced subcomplexes by quantitative mass spectrometry. Mol Cell Proteomics. 2014;13(5):1382–1391. PubMed PMID: 24563533; PubMed Central PMCID: PMC4014293.
- Pfirrmann T, Villavicencio-Lorini P, Subudhi AK, et al. RMND5 from xenopus laevis is an E3 ubiquitin-ligase and functions in early embryonic forebrain development. PLoS One. 2015;10(3):e0120342. [Cited 2015 March 21]. PubMed PMID: 25793641; PubMed Central PMCID: PMC4368662.
- Lampert F, Stafa D, Goga A, et al. The multi-subunit GID/CTLH E3 ubiquitin ligase promotes cell proliferation and targets the transcription factor Hbp1 for degradation. Elife. 2018;7. [Cited 2018 June 19]. PubMed PMID: 29911972; PubMed Central PMCID: PMCPMC6037477. DOI:10.7554/eLife.35528
- Leal-Esteban LC, Rothe B, Fortier S, et al. Role of bicaudal C1 in renal gluconeogenesis and its novel interaction with the CTLH complex. PLoS Genet. 2018;14(7):e1007487. [Cited 2018 July 12]. PubMed PMID: 29995892; PubMed Central PMCID: PMCPMC6056059.
- Snowdon C, Hlynialuk C, van der Merwe G. Components of the Vid30c are needed for the rapamycin-induced degradation of the high-affinity hexose transporter Hxt7p in saccharomyces cerevisiae. FEMS Yeast Res. 2008;8(2):204–216. [Cited 2007 November 08]. PubMed PMID: 17986252.
- Klionsky DJ, Abdelmohsen K, Abe A, Abedin MJ, Abeliovich H, Acevedo Arozena A, et al. Guidelines for the use and interpretation of assays for monitoring autophagy (3rd edition). Autophagy. 2016;12(1):1–222. Epub 2016/01/23. doi:10.1080/15548627.2015.1100356. PubMed PMID: 26799652; PubMed Central PMCID: PMCPMC4835977
- Betz C, Hall MN. Where is mTOR and what is it doing there? J Cell Biol. 2013;203(4):563–574. [Cited 2014 January 05]. PubMed PMID: 24385483; PubMed Central PMCID: PMCPMC3840941.
- Hardie DG, Corton J, Ching YP, et al. Regulation of lipid metabolism by the AMP-activated protein kinase. Biochem Soc Trans. 1997;25(4):1229–1231. [Cited 1998 February 05]. PubMed PMID: 9449981.
- Zhang CS, Hawley SA, Zong Y, et al. Fructose-1,6-bisphosphate and aldolase mediate glucose sensing by AMPK. Nature. 2017;548(7665):112–116. [Cited 2017 July 21]. PubMed PMID: 28723898; PubMed Central PMCID: PMCPMC5544942. DOI
- Pampliega O, Cuervo AM, Autophagy and primary cilia: dual interplay. Curr Opin Cell Biol. 2016;39:1–7. [Cited 2016 January 31]. PubMed PMID: 26826446; PubMed Central PMCID: PMCPMC4733852.
- Pampliega O, Orhon I, Patel B, et al. Functional interaction between autophagy and ciliogenesis. Nature. 2013;502(7470):194–200. [Cited 2013 October 04]. PubMed PMID: 24089209; PubMed Central PMCID: PMCPMC3896125. DOI
- Tang Z, Lin MG, Stowe TR, et al. Autophagy promotes primary ciliogenesis by removing OFD1 from centriolar satellites. Nature. 2013;502(7470):254–257. [Cited 2013 October 04]. PubMed PMID: 24089205; PubMed Central PMCID: PMCPMC4075283.
- Sherpa RT, Atkinson KF, Ferreira VP, et al. Rapamycin increases length and mechanosensory function of primary cilia in renal epithelial and vascular endothelial cells. Int Educ Res J. 2016;2(12):91–97. [Cited 2017 May 23]. PubMed PMID: 28529994; PubMed Central PMCID: PMCPMC5436805.
- Thoreen CC, Kang SA, Chang JW, et al. An ATP-competitive mammalian target of rapamycin inhibitor reveals rapamycin-resistant functions of mTORC1. J Biol Chem. 2009;284(12):8023–8032. [Cited 2009 January 20]. PubMed PMID: 19150980; PubMed Central PMCID: PMCPMC2658096.
- Corton JM, Gillespie JG, Hawley SA, et al. 5-aminoimidazole-4-carboxamide ribonucleoside. A specific method for activating AMP-activated protein kinase in intact cells? Eur J Biochem. 1995;229(2):558–565. [Cited 1995 April 15]. PubMed PMID: 7744080.
- Gonzalez A, Hall MN. Nutrient sensing and TOR signaling in yeast and mammals. Embo J. 2017;36(4):397–408. [Cited 2017 January 18]. PubMed PMID: 28096180.
- Uno M, Nishida E, Lifespan-regulating genes in C. elegans. NPJ Aging Mech Dis. 2016;2:16010. [Cited 2017 July 20]. PubMed PMID: 28721266; PubMed Central PMCID: PMCPMC5514992.
- Lochhead PA, Salt IP, Walker KS, et al. 5-aminoimidazole-4-carboxamide riboside mimics the effects of insulin on the expression of the 2 key gluconeogenic genes PEPCK and glucose-6-phosphatase. Diabetes. 2000;49(6):896–903. [Cited 2000 June 24]. PubMed PMID: 10866040.
- Menssen R, Schweiggert J, Schreiner J, et al. Exploring the topology of the gid complex, the E3 ubiquitin ligase involved in catabolite-induced degradation of gluconeogenic enzymes. J Biol Chem. 2012;287(30):25602–25614. [Cited 2012 May 31]. PubMed PMID: 22645139; PubMed Central PMCID: PMC3408164.
- Deng M, Yang X, Qin B, et al. Deubiquitination and Activation of AMPK by USP10. Mol Cell. 2016;61(4):614–624. [Cited 2016 February 16]. PubMed PMID: 26876938; PubMed Central PMCID: PMCPMC4836875.
- Al-Hakim AK, Zagorska A, Chapman L, et al. Control of AMPK-related kinases by USP9X and atypical Lys(29)/Lys(33)-linked polyubiquitin chains. Biochem J. 2008;411(2):249–260. [Cited 2008 February 08]. PubMed PMID: 18254724.
- Pineda CT, Ramanathan S, Fon Tacer K, et al. Degradation of AMPK by a cancer-specific ubiquitin ligase. Cell. 2015;160(4):715–728. [Cited 2015 February 14]. PubMed PMID: 25679763.
- Coughlan KA, Balon TW, Valentine RJ, et al. Nutrient excess and AMPK downregulation in incubated skeletal muscle and muscle of glucose infused rats. PLoS One. 2015;10(5):e0127388. [Cited 2015 May 23]. PubMed PMID: 25996822; PubMed Central PMCID: PMCPMC4440828.
- Yu L, McPhee CK, Zheng L, et al. Termination of autophagy and reformation of lysosomes regulated by mTOR. Nature. 2010;465(7300):942–946. [Cited 2010 June 08]. PubMed PMID: 20526321; PubMed Central PMCID: PMCPMC2920749.
- Mihaylova MM, Shaw RJ. The AMPK signalling pathway coordinates cell growth, autophagy and metabolism. Nat Cell Biol. 2011;13(9):1016–1023. [Cited 2011 September 06]. PubMed PMID: 21892142; PubMed Central PMCID: PMCPMC3249400.
- Greer EL, Dowlatshahi D, Banko MR, et al. An AMPK-FOXO pathway mediates longevity induced by a novel method of dietary restriction in C. elegans. Curr Biol. 2007;17(19):1646–1656. [Cited 2007 September 29]. PubMed PMID: 17900900; PubMed Central PMCID: PMCPMC2185793.
- Ehninger D, Neff F, Xie K. Longevity, aging and rapamycin. Cell Mol Life Sci. 2014;71(22):4325–4346. [Cited 2014 July 13]. PubMed PMID: 25015322; PubMed Central PMCID: PMCPMC4207939.
- Bitto A, Ito TK, Pineda VV, et al. Transient rapamycin treatment can increase lifespan and healthspan in middle-aged mice. Elife. 2016;5. [Cited 2016 August 24]. PubMed PMID: 27549339; PubMed Central PMCID: PMCPMC4996648. DOI:10.7554/eLife.16351
- Huang X, Dixit VM. Drugging the undruggables: exploring the ubiquitin system for drug development. Cell Res. 2016;26(4):484–498. [Cited 2016 March 24]. PubMed PMID: 27002218; PubMed Central PMCID: PMCPMC4822129.
- Fantus D, Rogers NM, Grahammer F, et al., Roles of mTOR complexes in the kidney: implications for renal disease and transplantation. Nat Rev Nephrol. 2016;12(10):587–609. [Cited 2016 August 02]. PubMed PMID: 27477490.
- Coughlan KA, Valentine RJ, Ruderman NB, et al., AMPK activation: a therapeutic target for type 2 diabetes? Diabetes Metab Syndr Obes. 2014;7:241–253. [Cited 2014 July 16]. PubMed PMID: 25018645; PubMed Central PMCID: PMCPMC4075959.
- Zhou G, Myers R, Li Y, et al. Role of AMP-activated protein kinase in mechanism of metformin action. J Clin Invest. 2001;108(8):1167–1174. [Cited 2001 October 17]. PubMed PMID: 11602624; PubMed Central PMCID: PMCPMC209533.
- Johnson SC, Rabinovitch PS, Kaeberlein M. mTOR is a key modulator of ageing and age-related disease. Nature. 2013;493(7432):338–345. [Cited 2013 January 18]. PubMed PMID: 23325216; PubMed Central PMCID: PMCPMC3687363.
- Fraser AG, Kamath RS, Zipperlen P, et al. Functional genomic analysis of C. elegans chromosome I by systematic RNA interference. Nature. 2000;408(6810):325–330. [Cited 2000 December 01]. PubMed PMID: 11099033.
- Rual JF, Ceron J, Koreth J, et al. Toward improving caenorhabditis elegans phenome mapping with an ORFeome-based RNAi library. Genome Res. 2004;14(10B):2162–2168. [Cited 2004 October 19]. PubMed PMID: 15489339; PubMed Central PMCID: PMCPMC528933.
- Pfirrmann T, Lokapally A, Andreasson C, et al. SOMA: a single oligonucleotide mutagenesis and cloning approach. PLoS One. 2013;8(6):e64870. PubMed PMID: 23750217; PubMed Central PMCID: PMC3672168.
- Brenner S. The genetics of caenorhabditis elegans. Genetics. 1974;77(1):71–94. [Cited 1974 May 01]. PubMed PMID: 4366476; PubMed Central PMCID: PMCPMC1213120.
- Urban N, Tsitsipatis D, Hausig F, et al. Non-linear impact of glutathione depletion on C. elegans life span and stress resistance. Redox Biol. 2017;11:502–515. [Cited 2017 January 14]. PubMed PMID: 28086197; PubMed Central PMCID: PMCPMC5228094.
- Cox J, Neuhauser N, Michalski A, et al. Andromeda: a peptide search engine integrated into the MaxQuant environment. J Proteome Res. 2011;10(4):1794–1805. [Cited 2011 January 25]. PubMed PMID: 21254760.
- Cox J, Mann M. MaxQuant enables high peptide identification rates, individualized p.p.b.-range mass accuracies and proteome-wide protein quantification. Nat Biotechnol. 2008;26(12):1367–1372. [Cited 2008 November 26]. PubMed PMID: 19029910.
- Elias JE, Gygi SP. Target-decoy search strategy for increased confidence in large-scale protein identifications by mass spectrometry. Nat Methods. 2007;4(3):207–214. [Cited 2007 March 01]. PubMed PMID: 17327847.
- Mackmull MT, Klaus B, Heinze I, et al. Landscape of nuclear transport receptor cargo specificity. Mol Syst Biol. 2017;13(12):962. [Cited 2017 December 20]. PubMed PMID: 29254951; PubMed Central PMCID: PMCPMC5740495.
- Gatto L, Lilley KS. MSnbase-an R/Bioconductor package for isobaric tagged mass spectrometry data visualization, processing and quantitation. Bioinformatics. 2012;28(2):288–289. [Cited 2011 November 25]. PubMed PMID: 22113085.
- Ritchie ME, Phipson B, Wu D, et al. limma powers differential expression analyses for RNA-sequencing and microarray studies. Nucleic Acids Res. 2015;43(7):e47. [Cited 2015 January 22]. PubMed PMID: 25605792; PubMed Central PMCID: PMCPMC4402510. DOI
- Perez-Riverol Y, Csordas A, Bai J, et al. The PRIDE database and related tools and resources in 2019: improving support for quantification data. Nucleic Acids Res. 2019;47(D1):D442–D50. [Cited 2018 November 06]. PubMed PMID: 30395289; PubMed Central PMCID: PMCPMC6323896.