
ABSTRACT
The endolysosomal system is critical for protein homeostasis in cells. A common way of studying protein transport and degradation (e.g. via autophagy) is by labeling vesicular structures such as endosomes, autophagosomes, lysosomes, or model substrates with fluorescent tags or by fluorescent antibody staining. Detailed analyses require quantification of hundreds of structures under various conditions. Typically, the images are analyzed individually with software such as the widely available Fiji/ImageJ (https://imagej.net/Fiji/Downloads), adjusting and thresholding each image and channel independently, which is a very labor intensive and fastidious task. To streamline the process, we developed a plug-in that, integrated into Fiji, enables the automated quantification of vesicular (i.e. punctate) structures. Importantly, the process still allows the operator to evaluate and have control over all the phases of quantification process.
Abbreviations
CMA: chaperone-mediated autophagy; CSV: comma separated values; eMI: endosomal microautophagy; Fiji: Fiji is just ImageJ; MA: macroautophagy; SParQ: Streamlined Particle Quantification
Introduction
Autophagy is a catabolic pathway that occurs in all eukaryotic organisms analyzed to date and is critical for the maintenance of cellular homeostasis. This is reflected by its association with a large array of pathologies and dysfunctions, including cardiovascular, neurodegenerative, cancer as well as aging associated diseases [Citation1–Citation3]. Methods to measure autophagy or vesicular transport in general are very sought after and are frequently based on the analysis of punctate structures in fluorescent micrographs [Citation4,Citation5].
Three types of autophagy have been identified in mammalian cells: Macroautophagy (MA), chaperone-mediated autophagy (CMA), and endosomal microautophagy (eMI). MA can selectively degrade organelles or aggregated proteins, but selective degradation of single proteins has mostly been described for CMA and eMI [Citation6–Citation8]. CMA and eMI can specifically degrade proteins containing KFERQ-related targeting motifs [Citation8,Citation9].
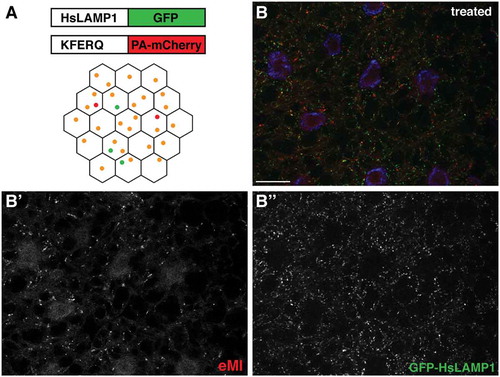
To date, quantification of punctate structures such as autophagosomes, endosomes, or lysosomes using Fiji/ImageJ [Citation10] requires repetitive tedious manual step by step processing of images of genotypes or samples of interest treated by different means, which makes the analyses of a high number of cells very time consuming. For example, using a KFERQ-tagged fluorescent biosensor, we have identified an eMI-like pathway in Drosophila. Upon eMI activation, this biosensor localizes to late endosomes/lysosomes in an ESCRT machinery-dependent manner [Citation11]. More specifically, the sensor consists of a KFERQ targeting motif of RNAseA fused to a photoactivatable mCherry and is expressed tissue-specifically under the control of Gal4-UAS system [Citation11,Citation12] which allows us to visualize the formation of sensor puncta (i.e. its localization to endo/lysosomes) under various experimental conditions and tissues in pulse-chase type of experiments. Typically, we simultaneously express UAS-GFP-HsLAMP1 to mark (endo)lysosomes in the larval fat body (). Using these two markers we are able to visualize by fluorescent microscopy how both the lysosomal and the endosomal pathway are responding to different experimental conditions and to assess sensor puncta formation in various genetic backgrounds.
Figure 1. eMI in Drosophila fat body. (A) eMI is typically analyzed using a biosensor consisting of a KFERQ-targeting motif fused to a photoactivatable mCherry that is co-expressed with an (endo)lysosomal marker consisting of a fragment of human LAMP1 fused to GFP. Upon expression in the larval fat body and prolonged starvation, the sensor forms puncta that partially colocalize with lysosomes (schematized as orange puncta in the fat body lattice). (B) Typical image showing the eMI sensor in red, (endo)lysosomes in green, and nuclei in blue. (B’ and B’’) show monochrome panels of the indicated channels. Scale bars: 20 µm.
With the tools currently available for quantification, individual images are manually opened, separately thresholded for the both red and green channels, followed by analyses of particles for these channels. This workflow is tedious, and we thus decided to automate the process developing the Streamlined Particle Quantification (SParQ) software. First of all, this plug-in enables researchers to open and process many images sequentially, surpassing the need to open each image individually. Second, the program automatically opens the channel of interest of the original window for reference side by side with a duplicate image and a small convenient thresholding window. This strategy has the advantage that the researcher can proof the process. Lastly the software automatically counts the particles on the image without the need to go through the menus of ImageJ. Once the analysis of all images is complete, the program conveniently exports the data as a CSV/Excel file. The user is thus able to analyze images much faster and with confidence. The code works not only for Drosophila fat body, but also for e.g. cultured mammalian cells and labeled neutrophils in zebrafish, and works with the most commonly used image formats. The plug-in written in Kotlin can be downloaded from GitHub.
Results and discussion
Streamlined Particle Quantification (SParQ) is a software that enables the user to quantify fluorescent particles in an image in an automated, but supervised, way. Cells contain a large number of vesicles with autophagosomes, lysosomes and endosomes probably being the most widely studied. Marking these vesicles with fluorescent markers is an easy way to address how the autophagosomal or endosomal pathways are regulated; in fact, this strategy is widely used in the autophagy field by most laboratories [Citation4,Citation13]. Typical images of autophagosomes and endosomes fluorescently marked are shown in .
The source code of the plug-in can be found at: https://github.com/sparq-plugin/sparq
Inside the code there are annotations for each of the functionalities processed by the software. In order to install SParQ simply drag the .jar file from the GitHub link above into the Fiji window. Alternatively, choose the command “Install Plugin … ” from the “Plugins” menu of Fiji and follow the prompts. Fiji will then have to be quit and restarted.
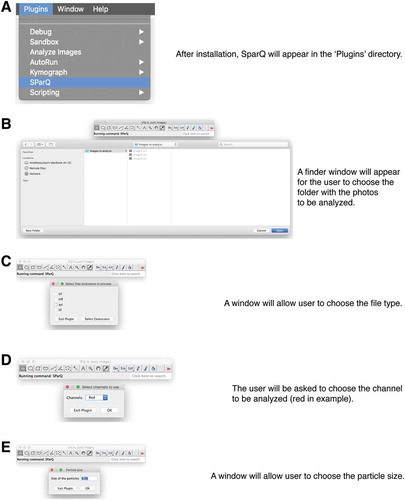
To run the plug-in, the user selects “SParQ” in the “Plugins” pull-down menu, and when prompted, will navigate to the folder containing the images (). The user then selects the file type and channel to be analyzed (), followed by a choice of particle size (; the default value is 0.50 appropriate for many punctate structures).
Figure 2. Flow chart part 1. Upon launching the SParQ plug-in (A), the user is prompted to navigate to the image folder (B), to select the file format (C), the channel (D) and the particle size (E) to be analyzed.
The image processing flow then is:
Open the image and split into channels. SParQ is built to work with tiff, tif, lif, and zvi files, the most common file formats used by the scientific community.
Show the original image channel the user asked for (green or red; ).
Display the threshold dialog to the user to adjust the threshold ().
Analyze the particles using the Fiji-built in plug-in Particle Analyzer.
Display the nuclei channel to help user count the nuclei in the case this information is needed ().
Display dialog for user to decide if the results are satisfactory ().
If results are not passing the scrutiny of the investigator, the program restarts the processing of the image and allows the user to re-adjust the threshold (). Note that once the excel file is exported in the end, the software will only save the last quantification for each image.
Bad (e.g. bleached) images can be skipped.
Once the results are fine, the program will move on to the next image.
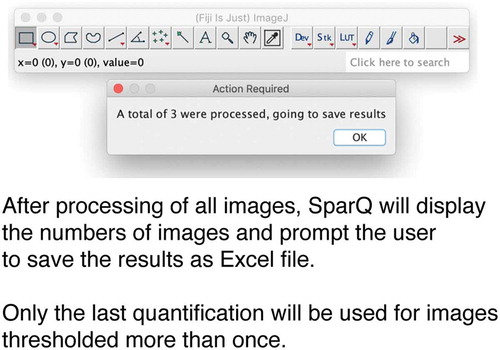
Software closes all open images and exports results to an Excel file (). The final file will include the name of the images quantified and the respective puncta count, total area occupied by puncta structures as well as average size and percentage of area occupied by fluorescence.
Figure 3. Flow chart part 2. SParQ then opens the original image next to a greyscale image of the selected channel (A) for thresholding (B). (C) A mask of the thresholded image will be shown allowing the user to accept or to repeat thresholding. Nuclei will be shown in case they need to be counted.
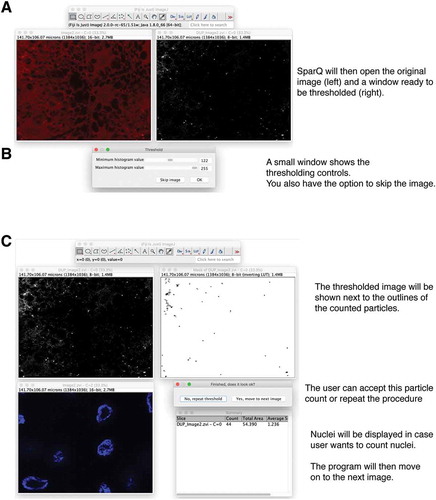
Figure 4. Flow chart part 3. After all images are processed, SParQ will summarize the process and export the data into an Excel file.
The SParQ plug-in is ideal for any application where the user has to quantify fluorescent microscopy images with punctate particles. It is especially useful for labs studying the endosomal and autophagy pathways where usually tens or even hundreds of fluorescent vesicles have to be counted.
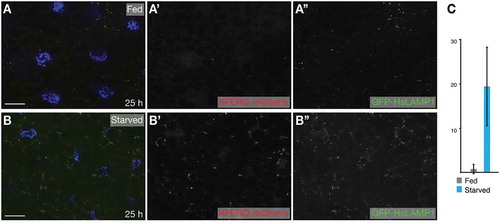
Most importantly and preferable over a full automatization, the plug-in is particularly useful for researchers, as the image analysis is streamlined without the investigator losing control. Furthermore, the batch mode makes it easy to transition between samples and to analyze all the pictures present in a folder. It is up to the user to divide the pictures in the way he/she sees best fit. In addition, the way in which the workflow is built guarantees both the accuracy and control by the user. Aside from setting the desired threshold for each picture, the user has the ability to skip images that don’t fit the standards such as bleached or overexposed cells, and more importantly, to go back and re-analyze the same image in case the first round was not satisfactory. In our experience, we find that this step should not be totally automated because each sample is distinct and users need to be able to “proof” the result. To make this as quick as possible, the plug-in displays the original picture window next to the thresholded picture for comparison with the option to discard or reprocess the image. Once all the images in the chosen folder have been processed, SParQ will ask the user where he wants to save the results file and export it automatically. To test the plug-in, we have analyzed images obtained of fed and starved Drosophila fat body expressing a novel eMI sensor based on regular cherry and thus does not require photoactivation. Similar to the previous photoactivatable sensor [Citation11], this more straight forward to use sensor robustly forms puncta when eMI is induced by prolonged starvation (compare with 5B; quantified in 5C).
Figure 5. eMI sensor based on regular cherry form puncta upon prolonged starvation. Compared to fed control (A), 25 h starvation induced robust sensor puncta (B). (C) Quantification of eMI response. Scale bar: 20 µm.
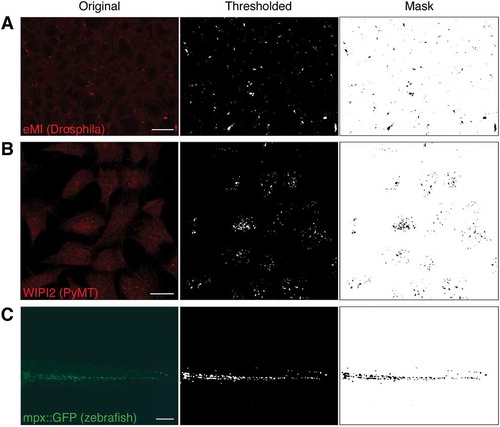
Importantly, SParQ is not only useful for analyses in the larval fly fat body, but more broadly for applications where the researcher looks for particle numbers, area occupied by particles, or average particle size. In addition to routinely quantifying late endosomes and lysosomes using the KFERQ biosensor and GFP-HsLAMP1 ( and ), the plug-in was tested on cultured mammalian cells and zebrafish. Thresholding using SParQ allowed accurate identification of WIPI2-labeled autophagosomes in mouse PyMT cells () and of GFP-labeled neutrophils in transgenic zebrafish ().
Figure 6. Examples of original sample images (left column), thresholded channel (middle column), and mask used to quantify (right column). (A) Typical eMI analysis. (B) Mouse PyMT cells stained for the autophagy protein WIPI2. (C) Tail section of a 4 d post fertilization zebrafish embryo expressing GFP in neutrophils under the control of the myeloperoxidase (mpx) promoter. Scale bars: 20 µm (A, B) and 100 µm (C).
Other frequently used programs to analyze particles are MATLAB and Velocity. While MATLAB requires coding knowledge by the user, installation the SParQ plug-in is straight forward and its use is simple. Although Velocity, in contrast to Fiji/ImageJ is able to quantify particles in 3D, it does not provide straight forward batch processing of files. Most importantly though, compared with these other software packages, Fiji/ImageJ is freely available, and its use does not require access to expensive licenses, making the SParQ plug-in accessible for a wide range of researchers.
Materials and methods
Fly work
Flies were reared and eMI assays were performed as described [Citation11]. pUAST-KFERQ-mCherry was generated by replacing photoactivatable cherry in pUAST-KFERQ-PAmCherry [Citation11] with regular cherry from pmCherry-N1 (a kind gift of Dr. E. Snapp, Albert Einstein College of Medicine, Bronx, NY, USA) as AgeI/NotI fragment. Transgene injections were done by Rainbow Transgenic Flies (CA).
Images
Images were obtained by fluorescent microscopy and analyzed using ImageJ/Fiji [Citation10]. Drosophila fat bodies expressing KFERQ biosensor and UAS-GFP-hsLAMP1 were imaged using a 63 × 1.4 NA oil objective on an ApoTome.2 system (Carl-Zeiss, Oberkochen, Germany). MMTV-PyMT mouse cells expressing GFP-WIPI-2 [Citation14] were imaged using a confocal microscope spectral LSM710 (Zeiss). Zebrafish expressing mpx::GFP [Citation15] were imaged on a Zeiss Axio Observer A1 Inverted microscope and captured with an AxioCam HRC Zeiss camera (5x objective) using Zeiss Zen 2.5 software.
Supplemental Material
Download Zip (6.5 MB)Acknowledgments
We are grateful to B. Ulloa (Einstein) and Drs. T. Bowman (Einstein) and Dr. J.L. Guan (U. of Cincinnati) for providing the zebrafish and PyMT images. We thank the Einstein Analytical Imaging Facility (Grant # P30CA013330). This work was supported by AHA postdoctoral fellowship 18POST34030231 (to A.M.) and NIH/NIGMS grant GM119160 (to A.J.).
Disclosure statement
No potential conflict of interest was reported by the authors.
Supplementary material
Supplemental data for this article can be accessed here.
Additional information
Funding
Related Research Data
References
- Abeliovich H. Regulation of autophagy by amino acid availability in S. cerevisiae and mammalian cells. Amino Acids. 2015 Oct;47(10):2165–2175.
- Kroemer G, Marino G, Levine B. Autophagy and the integrated stress response. Mol Cell. 2010 Oct 22;40(2):280–293.
- Rubinsztein DC, Marino G, Kroemer G. Autophagy and aging [Research Support, Non-U.S. Gov’t Review]. Cell. 2011 Sep 2;146(5):682–695.
- Klionsky DJ, Abdelmohsen K, Abe A, et al. Guidelines for the use and interpretation of assays for monitoring autophagy (3rd edition). Autophagy. 2016;12(1):1–222.
- Mesquita A, Calvo-Garrido J, Carilla-Latorre S, et al. Monitoring autophagy in Dictyostelium. Methods Mol Biol. 2013;983:461–470.
- Feng Y, He D, Yao Z, et al. The machinery of macroautophagy. Cell Res. 2014 Jan;24(1):24–41.
- Mesquita A, Cardenal-Munoz E, Dominguez E, et al. Autophagy in dictyostelium: mechanisms, regulation and disease in a simple biomedical model. Autophagy. 2017 Jan 2;13(1):24–40.
- Tekirdag K, Cuervo AM. Chaperone-mediated autophagy and endosomal microautophagy: joint by a chaperone. J Biol Chem. 2018 Apr 13;293(15):5414–5424.
- Massey AC, Zhang C, Cuervo AM. Chaperone-mediated autophagy in aging and disease [Research Support, N.I.H., Extramural Research Support, Non-U.S. Gov’t Review]. Curr Top Dev Biol. 2006;73:205–235.
- Schindelin J, Arganda-Carreras I, Frise E, et al. Fiji: an open-source platform for biological-image analysis. Nat Methods. 2012 Jun 28;9(7):676–682.
- Mukherjee A, Patel B, Koga H, et al. Selective endosomal microautophagy is starvation-inducible in Drosophila. Autophagy. 2016 Aug;1984–1999.
- Brand AH, Perrimon N. Targeted gene expression as a means of altering cell fates and generating dominant phenotypes [Research Support, Non-U.S. Gov’tResearch Support, U.S. Gov’t, P.H.S.]. Development. 1993 Jun;118(2):401–415.
- Pircs K, Nagy P, Varga A, et al. Advantages and limitations of different p62-based assays for estimating autophagic activity in Drosophila. PLoS One. 2012;7(8):e44214.
- Wei H, Wei S, Gan B, et al. Suppression of autophagy by FIP200 deletion inhibits mammary tumorigenesis. Genes Dev. 2011 Jul 15;25(14):1510–1527.
- Renshaw SA, Loynes CA, Trushell DM, et al. A transgenic zebrafish model of neutrophilic inflammation. Blood. 2006 Dec 15;108(13):3976–3978.