
ABSTRACT
How lysosome and MTORC1 signaling interact remains elusive in terminally differentiated cells. A G4C2 repeat expansion in C9orf72 is the most common cause of familial amyotrophic lateral sclerosis (ALS) and frontotemporal dementia (FTD) (C9ALS-FTD). We previously identified a C9orf72-SMCR8-containing complex. Here we found that c9orf72 and smcr8 double-knockout (dKO) mice exhibit similar but more severe immune defects than the individual knockouts. In c9orf72 or smcr8 mutant macrophages, lysosomal degradation and exocytosis were impaired due to the disruption of autolysosome acidification. As a result of impaired lysosomal degradation, MTOR protein was aberrantly increased, resulting in MTORC1 signaling overactivation. Inhibition of hyperactive MTORC1 partially rescued macrophage dysfunction, splenomegaly and lymphadenopathy in c9orf72 or smcr8 mutant mice. Pharmacological inhibition of lysosomal degradation upregulated MTOR protein and MTORC1 signaling in differentiated wild-type macrophages, which resemble phenotypes in KO mice. In contrast, C9orf72 or Smcr8 depletion in proliferating macrophages decreased MTORC1 signaling. Our studies causatively link C9orf72-SMCR8’s cellular functions in lysosomal degradation, exocytosis, and MTORC1 signaling with their organism-level immune regulation, suggesting cell state (proliferation vs. differentiation)-dependent regulation of MTOR signaling via lysosomes.Abbreviations: ALS: amyotrophic lateral sclerosis; ATG13: autophagy related 13; BMDMs: bone marrow-derived macrophages; BafA1: bafilomycin A1; C9orf72: C9orf72, member of C9orf72-SMCR8 complex; CD68: CD68 antigen; ConA: concanamycin A; dKO: double knockout; DENN: differentially expressed in normal and neoplastic cells; FTD: frontotemporal dementia; GEF: guanine nucleotide exchange factor; IFNB1: interferon beta 1, fibroblast; IFNG: interferon gamma; IL1B/IL-1β: interleukin 1 beta; IL6: interleukin 6; iPSCs: induced pluripotent stem cells; LAMP1: lysosomal-associated membrane protein 1; LPOs: LAMP1-positive organelles; MAP1LC3/LC3: microtubule-associated protein 1 light chain 3; LPS: lipopolysaccharide; MTORC1: mechanistic target of rapamycin kinase complex 1; MEFs: mouse embryonic fibroblasts; MNs: motor neurons; NOS2/iNOS: nitric oxide synthase 2, inducible; RAN: repeat-associated non-AUG; RB1CC1/FIP200: RB1-inducible coiled-coil 1; RPS6/S6: ribosomal protein S6; RPS6KB1/S6K1: ribosomal protein S6 kinase, polypeptide 1; SMCR8: Smith-Magenis syndrome chromosome region, candidate 8; SQSTM1/p62: sequestosome 1; TFEB: transcription factor EB; TNF: tumor necrosis factor; TSC1: TSC complex subunit 1; ULK1: unc-51 like kinase 1; v-ATPase: vacuolar-type H⁺-translocating ATPase
Hexanucleotide (G4C2) repeat expansion in the C9orf72 (member of C9orf72-SMCR8 complex) intron one causes the most common forms of familial amyotrophic lateral sclerosis (ALS) and frontotemporal dementia (FTD) (C9ALS-FTD) [Citation1,Citation2]. Proposed pathological mechanisms include C9orf72 haploinsufficiency (loss-of-function) and gain of toxicity due to toxic RNAs and dipeptide repeats from repeat-associated non-AUG (RAN) translation [Citation3,Citation4]. C9orf72 expression is reduced in C9ALS-FTD patient tissues [Citation2,Citation5–Citation7]. Haploinsufficiency of C9orf72 leads to the degeneration of motor neurons (MNs) induced from patient pluripotent stem cells (iPSCs) in the presence of elevated glutamate levels [Citation8]. Although its deletion alone does not result in neurodegeneration [Citation9], C9orf72 deficiency promotes motor deficits in C9-BAC (bacterial artificial chromosome) gain-of-function mouse models [Citation10]. Multiple studies have shown that loss of C9orf72 function in mice leads to autoimmune and inflammatory disorders with variable severity [Citation11–Citation13]. Increased prevalence of autoimmune disease in patients with C9ALS-FTD has been reported [Citation14], and neuroinflammation was suggested to affect the penetration and progression of the C9orf72 expansion [Citation15]. Therefore, these results highlight the importance of cell type-specific C9orf72 functions.
We and other groups have previously found that C9orf72 forms a protein complex with SMCR8 (Smith-Magenis syndrome chromosomal region candidate gene 8) [Citation16–Citation22]. Both C9orf72 and SMCR8 contain differentially expressed in normal and neoplastic cell (DENN) domains [Citation23,Citation24], and this protein complex exhibits guanine nucleotide exchange factor (GEF) activities toward RAB39B (RAB39B, member RAS oncogene family) and RAB8A (RAB8A, member RAS oncogene family) [Citation16,Citation22]. The C9orf72-SMCR8 complex is associated with ULK1 (unc-51 like kinase 1)-ATG13 (autophagy related 13)-RB1CC1/FIP200 (RB1-inducible coiled-coil 1), a macroautophagy/autophagy initiation complex, which is consistent with its function in promoting autophagy initiation [Citation22]. Distinct roles of C9orf72 in the late stages of autophagy have been reported, including promotion or inhibition of autophagic flux and degradation [Citation16,Citation20,Citation22]. Overall, cellular functions of C9orf72 and SMCR8 remain to be established. How C9orf72-SMCR8’s cellular functions are linked with organism-level immune regulation remains largely unknown.
Autophagy is a lysosome-dependent degradation process. Recent C. elegans work found that a C9orf72 ortholog promotes endolysosomal degradation to prevent abnormal release of endocytosed yolk into the extra embryonic space [Citation25]. Lysosomes play critical regulatory roles in mechanistic target of rapamycin complex 1 (MTORC1) signaling; lysosomal degradation generates an internal pool of amino acids for MTORC1 activation [Citation26–Citation29]. It is believed that lysosomal function is required for MTORC1 signaling activation in proliferating cells. Therefore, these data raise the possibility that C9orf72 deficiency disrupts lysosomal degradation, which leads to the inhibition of MTORC1 signaling [Citation20,Citation25]. On the other hand, recent studies showed that inhibition of lysosomal activity activates, rather than inhibits, MTORC1 signaling in differentiated cells, including osteoclasts, chondrocytes, and hippocampal neurons [Citation30–Citation32].
Here we performed a side-by-side comparison of c9orf72 and smcr8 single- and double-knockout (dKO) mice. c9orf72 and smcr8 single KO mice exhibited similar immune dysregulation including macrophage dysfunction, splenomegaly and lymphadenopathy, which were more severe in dKO. C9orf72 or Smcr8 deletion disrupted lysosomal degradation and exocytosis due to impaired autolysosome acidification in macrophages. As a result of defective lysosomal degradation, MTOR protein and MTORC1 signaling were increased in c9orf72 and smcr8 mutant macrophages. Importantly, inactivation of hyperactive MTORC1 signaling partially rescued the immune dysfunctions in c9orf72 or smcr8 mutant mice, providing a causal link between their cellular functions and in vivo phenotypes at organism levels.
Results
c9orf72 and smcr8 dKO mice have more severe splenomegaly and lymphadenopathy than single KOs
To define the in vivo functions of Smcr8, we generated smcr8 null mice in which a LacZ cassette was inserted in the first exon of the Smcr8 gene (Fig. S1A) [Citation22]. Western blot analysis confirmed the complete absence of SMCR8 protein in mutant cells (Fig. S1B); therefore, we refer to this mouse as smcr8−/-. smcr8−/- mice developed enlarged lymph nodes and spleens (), which were visible around 2 months of age and became more severe in an age-dependent manner (–). SMCR8 forms a protein complex with C9orf72 [Citation16–Citation22]. The progressive splenomegaly and lymphadenopathy observed in our smcr8 mutant mice were similar to those in c9orf72 null mice [Citation11,Citation12]. Therefore, SMCR8 and C9orf72 not only physically interact but may have similar immune functions.
Figure 1. c9orf72 and smcr8 dKO mice exhibit more severe splenomegaly and lymphadenopathy than individual KOs. (A) Gross images of cervical lymphadenopathy (arrow) in 7-month-old smcr8−/- mice compared to wild type littermate controls. White arrows indicate the enlarged lymph nodes in mutant mice. Scale bar: 0.5 cm. (B and D) Gross images of lymph nodes (B) and spleens (D) dissected from 7-month-old mice. Scale bar = 5 mm. (C and E) Statistical analysis of lymph node and spleen weights. Error bars represent SEM of 3 independent experiments; *p < 0.05, ***p < 0.001 (Student’s t test). Two-way ANOVA detected a significant difference between 2.5 and 7 months of age. (F-H) Western blot analysis of C9orf72 and SMCR8 protein expression in macrophages derived from mutant mice. (I and K) Gross images of lymph nodes (I) and spleens (K) dissected from 3-month-old mice. Scale bars: 1.5 mm (I), and 1 mm (K). (J and L) Statistical analysis of lymph node and spleen weights. Error bars represent SEM of 3 independent experiments followed by one-way ANOVA with Bonferroni correction (*p < 0.05, **p < 0.01). n.s represents not significant.
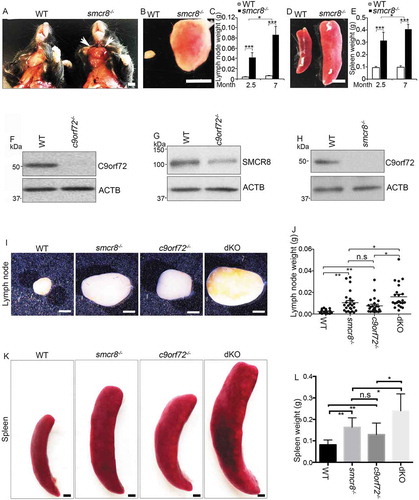
SMCR8 protein was substantially reduced in c9orf72−/- macrophages (,), whereas C9orf72 protein was nearly absent in smcr8−/- macrophages (). Consistent with previous studies [Citation17,Citation20,Citation33], these results suggested that C9orf72 and SMCR8 may stabilize each other and raised the question of whether absence of C9orf72 accounts for the enlarged lymph nodes and spleens in smcr8−/- mice. To address this question, we crossed C9orf72+/- and Smcr8+/- mice to obtain dKO mice. Statistical analyses revealed that lymph nodes from dKO mice were significantly larger and weighed more than those from single KOs (,). Similarly, the spleens were larger in dKO mice than in single KOs (,). Together, these results suggest that C9orf72 and SMCR8 are unlikely to act in a linear pathway, and that both of them are required for immune functions.
Inflammation and macrophage dysfunction in mutant mice
Because c9orf72 and smcr8 mutant mice showed autoimmune and inflammatory phenotypes [Citation12,Citation13,Citation33], we examined inflammation in dKO mice. First, we confirmed an increase in CD68 (CD68 antigen) positive macrophages in the red pulp of c9orf72 and smcr8 mutant spleens (–). Second, the plasma concentration of the major pro-inflammatory cytokine IL6 (interleukin 6) was increased in individual KO mice, and its increase was more pronounced in dKO compared to c9orf72 single KO (). In addition, mutant spleens exhibited an increase in the mRNA expression of inflammatory cytokines, including Il1b/Il-1β (interleukin 1 beta) and Nos2/Inos (nitric oxide synthase 2, inducible), which were also more robustly increased in dKO spleens (). These results indicate that inflammation is present in single and dKO mice.
Figure 2. Inflammation and macrophage dysfunction in mutant mice. (A and B) Representative CD68 immunohistochemistry in red pulp of spleens showing increased macrophage infiltration in mutant mice. Scale bars: 20 μm. (C) Quantification of CD68+ cells per mm2 area. (D) ELISA analysis of IL6 levels in blood plasma from 3-month-old mice. (E) qRT-PCR analysis of mRNA expression of pro-inflammatory cytokines (Nos2 and Il1b) in spleens from 3-month-old single and double KO mice. (F) ELISA analysis of IL1B levels in macrophage supernatant. (G and I) Western blot analysis of the protein levels of NOS2 and ARG1 in macrophages with or without LPS and IFNG treatment or IL4 treatment. ACTB serves as the loading control. (H and J) Quantification of NOS2 and ARG1 protein expression. For quantification in C-F, error bars represent SEM of 3 independent experiments followed by one-way ANOVA with Bonferroni correction (*p < 0.05, **p < 0.01, ***p < 0.001). n.s represents not significant. For H and J, error bars represent SEM of 3 independent experiments followed by two-way ANOVA with Bonferroni correction (*p < 0.05, **p < 0.01, ***p < 0.001).
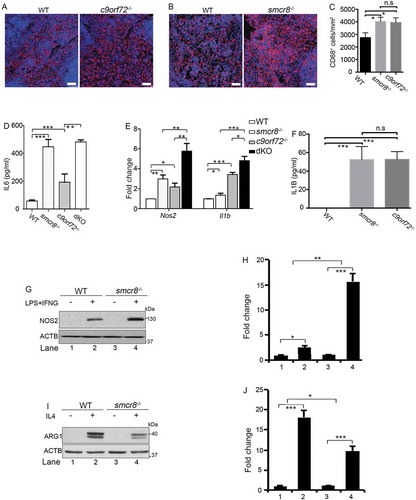
To investigate cellular functions, we turned our attention to macrophages because of C9orf72’s high expression levels in these cells [Citation12]. Whereas they were barely detected in monocytes, C9orf72 and SMCR8 were enriched in regular and polarized macrophages (Fig. S1C, 1D). Because peritoneal macrophages are more mature than bone marrow-derived macrophages (BMDMs) and have an activated lysosome compartment [Citation34,Citation35], we used peritoneal macrophages for our functional studies. RT-PCR analysis revealed that smcr8−/- mutant macrophages were responsive to lipopolysaccharide (LPS) stimulation. There was a significant increase in the baseline expression of inflammatory cytokines in the mutant peritoneal macrophages (Fig. S1E-1H); NOS2 levels in smcr8−/- mutant macrophages were more sensitive to the LPS and IFNG (interferon gamma) stimulation (Fig. S1F). ELISA revealed a significant increase of IL1B in the supernatant of single KO macrophages (). These results suggest that C9orf72 or Smcr8 deletion results in macrophage dysfunction.
Two types of macrophages can be distinguished: classically activated macrophages (M1) and alternatively activated macrophages (M2) [Citation36]. IL4 (interleukin 4) treatment yields an M2 macrophage profile, whereas LPS and IFNG can polarize macrophages into the M1 subtype, which is associated with the production of pro-inflammatory cytokines and tissue inflammation [Citation36]. As shown in (,), smcr8−/- macrophages displayed an increase in the expression of NOS2, the hallmark of M1 macrophages. Meanwhile, there was decreased expression of ARG1 (arginase 1), the hallmark of M2 macrophages, in mutant cells (,). Therefore, Smcr8 depletion disrupted macrophage polarization and led to a pro-inflammatory state with inflammatory cytokine overproduction. Taken together, our results suggested that C9orf72 and Smcr8 deletion disrupted macrophage function and led to increased inflammatory cytokines and inflammation.
Lysosomal morphology and autophagy disruption in mutant macrophages
We previously found that C9orf72-SMCR8-containing complex regulates autophagy, which is a lysosome-dependent process [Citation22]. Therefore, we examined lysosomes using antibodies against LAMP1 (lysosomal associated membrane protein 1). LAMP1-positive organelles (LPOs) were enlarged in c9orf72−/- and smcr8−/- mutant macrophages (,). Prolonged starvation can typically resolve the enlargement of LPOs, resulting in lysosomal tubule-like structures [Citation29]. In contrast to the elongated lysosomal tubules in WT cells, mutant macrophages continued to contain clustered and enlarged LPOs without thin tubule structures under starvation (). The percentage of cells with > 5 lysosomal tubules was significantly reduced in individual KO macrophages (). Thus, C9orf72 or Smcr8 deletion disrupted lysosomal morphology, as reflected by enlarged LAMP1-positive organelle diameters.
Figure 3. Lysosomal morphology and autophagy are disrupted in mutant macrophages. (A and C) Confocal microscope images of macrophages stained with antibodies against LAMP1 (red) under nutrient conditions (A) or 12 h amino acid starvation (C). Hoechst stains nuclei (blue). Scale bars: 2 μm (A, left panels in C), 0.5 μm (right panels in C). (B and D) Quantification of LAMP1-positive lysosomal organelle diameters (B) and the numbers of cells with > 5 lysosomal tubules (D). (E) Representative imaging of macrophages stained with antibodies against LC3 (green) and LAMP1 (red). Hoechst stains the nuclei (blue). Scale bars: 2 μm. (F) Quantification of cells with >5 LAMP1+LC3+ autolysosomes. (G and I) Western blot analysis of protein levels of SQSTM1 and TFEB in mutant macrophages. (H and J) Quantification of protein expression levels. (K) Confocal microscope images of macrophages stained with antibodies against LC3 (green) after 0, 1, and 24 h amino acid starvation. Hoechst stains the nuclei (blue). Scale bars: 2 μm. (L) Quantification of cells with >5 LC3-positive autophagosomes. Error bars represent SEM of 3 independent experiments followed by one-way ANOVA with Bonferroni correction in B, D, F, or Student’s t-test in H, J and L (*p < 0.05, **p < 0.01, ***p < 0.001). n.s represents not significant.
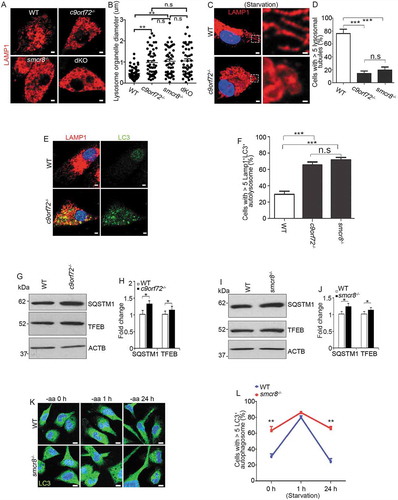
Next, we used MAP1LC3/LC3 (microtubule-associated protein 1 light chain 3) to label autophagosomes and autolysosomes [Citation37]. Similar LC3-positive autophagosome numbers were detected in WT and smcr8−/- macrophages after starvation (Fig. S2A, 2B). However, under normal conditions, there were more autophagosomes in c9orf72−/- and smcr8−/- macrophages. Furthermore, these LC3-positive organelles contained LAMP1, which suggests that the fusion of autophagosomes with lysosomes was normal. The numbers of cells containing LAMP1- and LC3-double positive autolysosomes were significantly increased in individual KO macrophages (,). Increased LC3 could be due to enhanced autophagy, impaired autophagic flux, or their combinations. Therefore, we examined SQSTM1/p62 (sequestosome 1) and found a significant increase in the expression levels of SQSTM1 in individual KO macrophages (–). TFEB (transcription factor EB) is a key regulator of lysosomal biogenesis. In response to stress or nutrition depletion, TFEB is translocated from the cytoplasm to the nucleus and promotes lysosome biogenesis and function through gene expression [Citation38–Citation41]. We found that TFEB’s subcellular localization appeared to be normal in c9orf72−/- and smcr8−/- macrophages (data not shown), but its protein level was slightly increased (). Lastly, we monitored autophagosome clearance during prolonged starvation in smcr8−/- macrophages. Short-term starvation induced autophagosome formation initially, but mutant cells failed to disassemble autophagosomes during long-term starvation, which contrasts with normal autophagosome clearance in wild type macrophages (,). These results suggested that lysosomal morphology and autophagy degradation were impaired in individual KO macrophages.
Impaired lysosomal degradation and exocytosis in mutant macrophages
To investigate the basis of impaired autophagy degradation, we examined CTSD (cathepsin D) and CTSB (cathepsin B), 2 major aspartyl and cysteine proteases that can serve as molecular reporters for lysosomal functions. c9orf72−/- and smcr8−/- macrophages exhibited diffuse and fairly weak CTSD and CTSB signals, in contrast to the bright puncta in WT cells (–). To probe this further, CTSD activity was monitored using BODIPY FL-pepstatin A, a fluorescently labeled pepstatin A that specifically binds to active CTSD in acidic lysosomes [Citation42]. The signal intensity of BODIPY FL-pepstatin A correlates with lysosomal degradation capacity, indicated by reduced signal intensity upon concanamycin A (ConA)-mediated inhibition of lysosomal activities (Fig. S3A, 3B). C9orf72 or Smcr8 deletion significantly reduced the BODIPY FL-pepstatin A staining, which was confirmed by normalized mean intensity analysis (–). Mature forms of CTSD and CTSB are generated from cathepsin precursors through proteolytic cleavage in acidic lysosomes. Any changes in the levels of their mature forms indicate altered maturation and/or degradation capacity of lysosomes [Citation43,Citation44]. Western blot analyses showed that mature forms of CTSD were barely detected in individual and dKO macrophage cells (,); mature forms of CTSB were substantially reduced in individual KO macrophage cells (,); there was no more severe reduction of mature CTSB in dKO compared to single KO cells (,). In sum, C9orf72 or Smcr8 deletion impaired lysosomal degradation in macrophage cells.
Figure 4. Impaired lysosomal degradation and secretion in mutant macrophages. (A and C) Confocal microscope images of macrophages stained with antibodies against CTSD and CTSB, or stained with BODIPY FL-pepstatin A from c9orf72−/- (A) or smcr8−/- (C) mutant mice. Hoechst stains the nuclei (blue). Scale bars: 1 μm. (B and D) Quantification of relative intensity of CTSD, CTSB, and BODIPY FL-pepstatin A, respectively. Error bars represent SEM of 3 independent experiments; wild type (n = 20) and mutant (n = 20) macrophages were counted in each experiment; *p < 0.05, **p < 0.01 (Student’s t test). (E and G) Western blot analyses of protein levels of CTSD (E) and CTSB (G) from macrophage cells or supernatant. The equal loading was shown by amido black staining of the membrane (right panels). (F and H) Quantification of mature forms of CTSD or CTSB. Error bars represent SEM of 3 independent experiments followed by one-way ANOVA with Bonferroni correction (**p < 0.01, ***p < 0.001). n.s represents not significant.
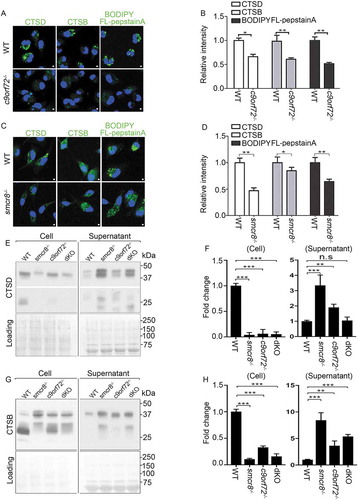
To determine the cause of the reduction in mature forms of CTSD and CTSB, we examined lysosomal exocytosis, which was recently reported to be disrupted in smcr8−/- macrophages [Citation33]. Monocyte-derived cells such as macrophages use an extracellular and acidic compartment (a lysosomal synapse) for initial degradation of large objects, during which lysosomal enzymes are delivered to these specialized compartments by secretion [Citation45,Citation46]. The supernatant medium with secreted proteins was collected and concentrated from cultured macrophages; protein loading was monitored by amido black staining of the membrane. Whereas few secreted lysosomal protein was detected in WT cells, the mature forms of CTSD and CTSB were substantially elevated in c9orf72−/- and smcr8−/- macrophage supernatants (–), revealing that C9orf72 or Smcr8 deletion disrupted lysosomal exocytosis in macrophages.
Defective lysosomal acidification in mutant macrophages
The acidic luminal environment of lysosomes is critical for their cathepsin processing and activities. Lysosomal exocytosis can be triggered by any agent that causes a rise in lysosomal pH [Citation47,Citation48]. To investigate the underlying cause of impaired lysosomal degradation and exocytosis in mutant macrophages, we measured lysosomal pH. Macrophages were stained with LysoSensor green, a pH indicator that shows a pH-dependent increase in fluorescence intensity upon acidification in lysosomes and was validated by ConA-mediated disruption of lysosomal pH values (Fig. S3C, 3D). Whereas WT cells exhibited bright green puncta, relatively weak and diffused puncta appeared in c9orf72−/- and smcr8−/- macrophages (). Statistical analyses confirmed reduced LysoSensor signal intensity in mutant macrophages compared to controls, which cannot be rescued by MTOR inhibitor torin (–). These results suggest that pH was aberrantly increased in mutant macrophages.
Figure 5. Lysosomal pH is aberrantly increased in mutant macrophages. (A) Confocal microscope images of macrophages stained with LysoSensor (green). Hoechst stains nuclei. Scale bars: 2 μm. (B and C) Quantification of LysoSensor intensity in c9orf72−/- or smcr8−/- macrophages with or without torin treatment. Error bars represent SEM of 3 independent experiments followed by one-way ANOVA with Bonferroni correction (**p < 0.01), n.s represents not significant. Wild type (n = 40) and mutant (n = 40) macrophages were counted in each experiment. (D-F) Representative images from time-lapse movie analyses of macrophages with pHrodo Red Dextran (red, pH-sensitive dye) and Alexa Fluro 488 green dextran (green, pH-insensitive dye). Macrophages were isolated from WT (D), c9orf72−/- (E), and smcr8−/- (F) mice and were treated with 2 mM v-ATPase inhibitor ConA before imaging. (G) Quantification of pHrodo Red Dextran fluorescence intensity from 0 min to 12 min after ConA treatment. Error bars represent SEM of 3 independent experiments; wild type (n = 50) and mutant (n = 47) macrophages were counted in each experiment; **p < 0.01 (Student’s t test).
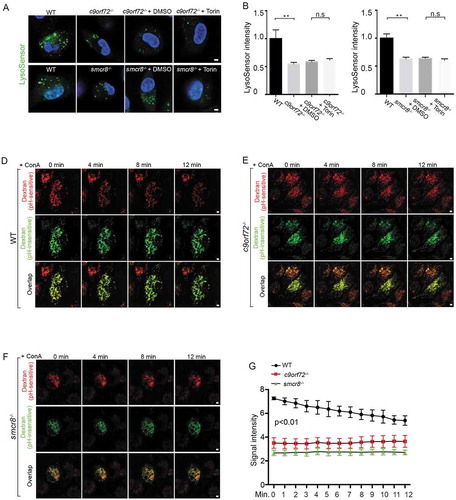
To independently monitor lysosomal pH dynamics, we performed time-lapse imaging analysis of lysosomal pH upon inhibition of the vacuolar-type H⁺-translocating ATPase (v-ATPase) proton pump. Macrophages were incubated overnight with the pH-insensitive Alexa Fluro 488 and pH-sensitive pHrodo red dextrans, which was validated by abolished red signal after ConA-mediated impairment of lysosomal pH values (Fig. S3E, 3F). After washing, macrophages were incubated with regular culture medium to allow dextran to localize to the lysosomes. As expected, the red signal was initially reduced in mutant cells compared to controls (–), which is consistent with elevated lysosomal pH values. Upon the addition of ConA, red signal was gradually reduced as a result of increased pH values in lysosomes of WT macrophages. In contrast, there was no significant changes observed in c9orf72−/- or smcr8−/- mutant macrophages (–, Fig. S3G), suggesting a high basal pH value and/or v-ATPase pump dysfunction. These data suggest that C9orf72 and Smcr8 deletion disrupted lysosomal acidification.
Disrupted MTOR protein and MTORC1 signaling in macrophages with disrupted lysosomal activity
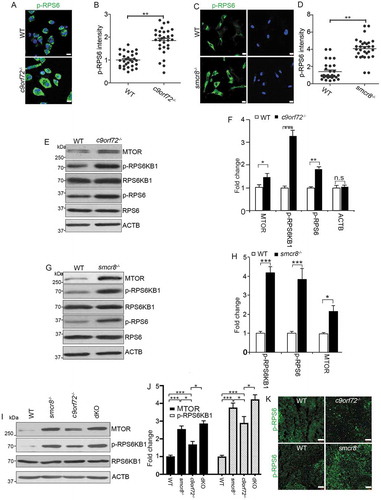
Pharmacological inhibition of lysosomal activity increases MTORC1 signaling in chondrocytes [Citation30], and elevated pH in lysosomes results in increased MTOR protein in osteoclasts [Citation32]. Therefore, we examined MTORC1 signaling in mutant macrophages. Compared to WT cells, c9orf72−/- and smcr8−/- macrophages exhibited increased MTORC1 signaling, as indicated by the upregulation of phosphorylated-RPS6/S6 (ribosomal protein S6) (ser235/236) (–). Western blot further confirmed the upregulation of MTORC1 signaling, reflected by increased expression of phosphorylated RPS6KB1/S6K1 (ribosomal protein S6 kinase, polypeptide 1) and RPS6 in mutant macrophages (–). In addition, MTORC1 signaling was increased more in dKO than single KO macrophages (,). To assess MTORC1 signaling in vivo, we examined the red pulp of mutant spleens and found a higher signal intensity of phosphorylated RPS6 in c9orf72−/- and smcr8−/- mutant mice (). The MTOR protein undergoes both lysosomal and proteasomal degradation, and an increase in lysosomal pH due to lysosomal inhibitors can lead to elevated MTOR protein levels in osteoclasts [Citation32]. Therefore, we tested whether increased MTORC1 signaling in mutant macrophages was due to elevated MTOR proteins. This was in fact the case: MTOR protein was significantly increased in c9orf72−/-, smcr8−/- and dKO macrophages (–). Therefore, C9orf72 or Smcr8 deletion led to upregulation of MTOR protein and MTORC1 signaling in macrophages. These results are consistent with the idea that impaired lysosomal degradation in mutant macrophages resulted in upregulation of MTOR proteins and MTORC1 signaling.
Figure 6. Upregulation of MTOR protein and MTORC1 signaling in mutant macrophages. (A and C) Confocal microscope images of macrophages stained with antibodies against phospho-RPS6/S6 (S235/S236) (green) from mutant mice. Hoechst stains the nuclei (blue). Scale bars: 10 μm. (B and D) Quantification of relative intensity of phospho-RPS6/S6 (235/236). Error bars represent SEM of 3 independent experiments; wild type (n = 30) and mutant (n = 30) cells were measured in each experiment; **p < 0.01 (Student’s t test). (E, G, and I) Western blot analyses of proteins as indicated in mutant macrophages. ACTB serves as the loading control. (F, H, and J) Quantification of protein levels normalized to ACTB. Error bars represent SEM of 3 independent experiments; *p < 0.05, **p < 0.01 and ***p < 0.001; n.s represents no significant difference (Student’s t test). (K) Representative phospho-RPS6/S6 immunohistochemistry in red pulps of spleens showing increased MTORC1 signaling in mutant spleens. Scale bars: 50 μm.
To further determine the causal relationship between lysosomal inhibition and MTORC1 activation, we used pharmacological approaches to inhibit lysosomal functions. In WT macrophages, blockage of lysosomal functions using bafilomycin A1 (BafA1), an inhibitor of v-ATPase [Citation49], led to elevated SQSTM1, MTOR protein, and MTORC1 signaling (,). To verify these findings independently, we performed similar studies using ConA and found similar results (Fig. S4A, 4B). To complement these loss-of-function results, we performed gain-of-function studies by promoting lysosomal degradation using trehalose. Western blot analyses showed a reduction in the expression of SQSTM1, MTOR protein, and MTORC1 signaling (,). Together, these results indicate that inhibition of lysosomal activity results in upregulation of MTOR protein and MTORC1 signaling in differentiated macrophages from mice.
Figure 7. MTORC1 signaling in mouse macrophages with pharmacological inhibition of lysosomal degradation or macrophage cell line with C9orf72 depletion. (A) Western blot analysis of protein levels in macrophages treated with DMSO or 8 nM BafA1 for 24 or 48 h before sample collection. ACTB serves as the loading control. (B) Quantification of relative protein expression normalized to ACTB. (C) Western blot analysis of protein levels in macrophages with or without trehalose (1 mM) for 24 h. ACTB serves as the loading control. (D) Quantification of relative protein expression normalized to ACTB. (E) Representative confocal images of RAW264.7 macrophage cells stained with antibodies against LAMP1 (red) after C9orf72 shRNA knockdown. Hoechst stains nuclei. Scale bars: 5 μm. (F) Quantification of LAMP1-positive lysosomal organelle diameter. (G) Western blot analyses of protein levels in C9orf72 shRNA knockdown RAW264.7 macrophage cell line. (H) Quantification of protein levels in G. (I and K) Western blot analyses of protein levels in C9orf72 or Smcr8 shRNA knockdown U937 macrophage cell line. (J and L) Quantification of protein levels from experiments I and K. For all the experiments, error bars represent SEM of 3 independent experiments; *p < 0.05, **p < 0.01, ***p < 0.001; n.s represents no significant difference (Student’s t test).
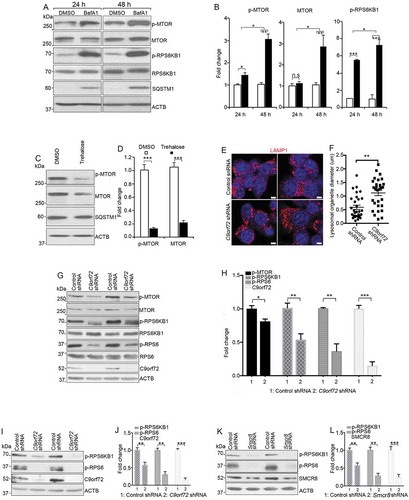
Next, we used shRNA to knockdown C9orf72 or Smcr8 in RAW264.7 cells, which is a proliferating macrophage cell line. We found an increase in lysosomal organelle diameter in knockdown cells (,). The MTOR protein and signaling activity were reduced in C9orf72 knockdown cells (,), whereas MTOR signaling was increased in Smcr8 knockdown cells (Fig. S4C, 4D). Next, we used an independent monocytic cell line U937 and found that C9orf72 or Smcr8 knockdown led to downregulation of MTORC1 signaling activity (–), which was consistent with the effects of C9orf72 knockdown in RAW264.7 macrophage cells. Together, these results suggest that MTORC1 activation via lysosomes is dependent on cell state (proliferating vs. differentiating).
MTORC1 inhibition mitigates macrophage dysfunction in mutant mice
Constitutive MTORC1 activation due to myeloid lineage-specific deletion of TSC1 (TSC complex subunit 1) results in impaired macrophage polarization, splenomegaly, and lymphadenopathy [Citation50,Citation51], which mimic c9orf72−/- and smcr8−/- mouse phenotypes. Therefore, we hypothesized that hyperactive MTORC1 signaling mediates the immune dysfunctions observed in c9orf72 and smcr8 mutant mice. To test this hypothesis, we performed rescue studies using 2 MTOR inhibitors, rapamycin and torin. WT and c9orf72−/- mice were injected intraperitoneally with inhibitors or vehicle every other day for 6 weeks before analyses. Spleens and lymph nodes were dissected and weighed. Statistical analyses revealed that rapamycin treatment significantly rescued the enlarged spleen and lymph node sizes of c9orf72−/- or smcr8−/- mice (–), whereas WT mice appeared normal after the treatment. In addition, torin treatment yielded rescue effects on the enlarged spleen and lymph node sizes in c9orf72−/- mice (Fig. S5A-5D). Similarly, torin treatment also mitigated the enlarged spleens and lymph nodes of smcr8−/- mice (Fig. S5E-5G). Next, we tested whether promoting lysosomal function using trehalose could rescue the immune dysregulation in mutant mice. Statistical analysis revealed that trehalose failed to rescue the enlarged spleen and lymph node sizes in c9orf72 KO mice (Fig. S5H-5J), suggesting a potential intrinsic impairment of lysosomal functions by C9orf72 depletion.
Figure 8. MTORC1 inhibition mitigates macrophage dysfunction in mutant mice. (A) Gross images of spleen (upper panels) and lymph nodes (lower panels) dissected from wild type (WT) and c9orf72−/- mutant mice with or without Rapamycin treatment. Scale bars: 1 mm (upper panels), and 0.5 mm (lower panels). (B and C) Statistical analyses of weights of spleens and lymph nodes. (D) Gross images of spleen (upper panels) and lymph nodes (lower panels) dissected from wild type (WT) and smcr8−/- mutant mice with or without torin treatment. Scale bars: 2 mm (upper panels), and 1 mm (lower panels). (E and F) Statistical analyses of weights of spleens and lymph nodes. (G) Representative CD68 immunohistochemistry in red pulps of WT and c9orf72−/- mutant mice with or without Rapamycin treatment. Scale bars: 50 μm. (H and I) qRT-PCR analysis of mRNA expression of pro-inflammatory cytokines in spleens of c9orf72−/- mutant mice with or without Rapamycin treatment. In all the quantification, error bars represent SEM of 3 independent experiments followed by one-way ANOVA with Bonferroni correction (*p < 0.05, **p < 0.01). n.s represents not significant. (J) A diagram showing that C9orf72 or Smcr8 deletion disrupted lysosomal exocytosis and degradation and resulted in upregulation of MTOR proteins and MTORC1 signaling, leading to macrophage dysfunction and inflammation in mice.
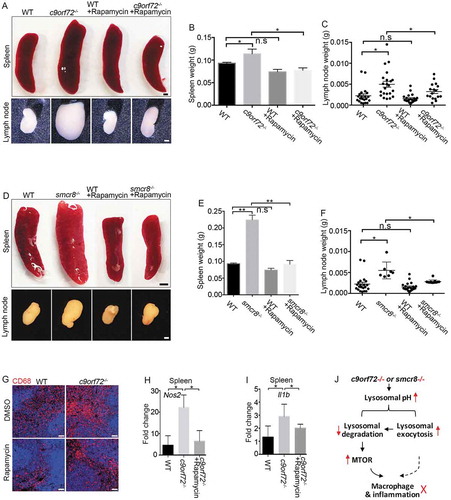
To investigate whether MTORC1 inhibitors could rescue the cellular deficits in mutant mice, we examined macrophages in the red pulp of spleens from c9orf72−/- or smcr8−/- mice with or without rapamycin treatment. Compared to WT controls, mutant spleens exhibited an increase in CD68- and CD3-positive cells, which was ameliorated by treatment (, Fig. S6A, 6B). We found that cytokine overproduction was rescued in vivo, as evidenced by reduced expression of Nos2 and Il1b in c9orf72−/- or smcr8−/- spleens after rapamycin treatment (,, Fig. S6C, 6D). To determine whether pro-inflammatory cytokine production was also rescued in vitro, we isolated and cultured macrophages from mutant mice followed by the administration of rapamycin to the cells. RT-PCR analyses revealed that rapamycin was sufficient to significantly reduce the mRNA expression levels of pro-inflammatory cytokines, including Nos2, Il6, and Tnf (Tumor necrosis factor), in c9orf72−/- macrophages (Fig. S6E-6G). Together, these results suggest that inhibition of hyperactive MTORC1 signaling can rescue the immune dysfunction of c9orf72 or smcr8 mutant mice.
Discussion
Here we discovered that C9orf72 and SMCR8 have similar functions in regulating lysosomal degradation, exocytosis, and MTORC1 signaling. C9orf72 or Smcr8 deletion-mediated disruption of lysosomal degradation results in upregulation of MTOR protein and MTORC1 signaling in macrophages that drives inflammation and immune dysfunction (), providing the causative link between C9orf72-SMCR8’s cellular functions and their immune regulation at the organism level. Our genetic and pharmacological studies in macrophages suggest that lysosome-mediated activation or inhibition of MTORC1 signaling depends on whether the cells are in a proliferative or differentiating state.
C9orf72 and SMCR8 have similar functions in lysosomal degradation, exocytosis, and MTORC1 signaling
Our mouse genetic studies in macrophages revealed that C9orf72 and SMCR8 promote lysosomal degradation and homeostasis, a finding which is consistent with recent studies in C. elegans [Citation25]. These evolutionarily conserved roles across different species are the consistent cellular functions described for C9orf72-SMCR8. We further identified mechanisms underlying lysosomal dysfunction, including aberrantly increased lysosomal pH and impaired lysosomal enzyme processing and activities. Inhibition of lysosomal proteases led to accumulation of enlarged and LC3-positive autolysosomes [Citation29]. Consistent with previous studies [Citation12,Citation17], mutant macrophages exhibited enlarged lysosomal organelles, which could be due to impaired lysosomal degradation resulting in subsequent failure of autophagosome clearance and lysosome reformation.
Consistent with a recent publication [Citation33], C9orf72 and Smcr8 deletion led to an increase in lysosomal exocytosis. Decreased levels of the mature forms of CTSD and CTSB enzymes in macrophages were coupled with elevated expression of these proteins in extracellular cell culture supernatants, suggesting that aberrantly increased lysosomal exocytosis causes a reduction in CTSD and CTSB and impaired lysosomal degradation in macrophages. Alternatively, elevated lysosomal pH could independently disrupt both lysosomal degradation and lysosomal exocytosis. It has been reported that lysosomal exocytosis in macrophages can be triggered by any agent that causes a rise in lysosomal pH [Citation47,Citation48]. Inflammatory cytokines can be generated via lysosomal exocytosis [Citation52,Citation53]. Future studies can determine whether blocking lysosomal exocytosis can rescue the immune dysfunction in c9orf72 and smcr8 mutant mice. Together with recently published results [Citation25,Citation33], our data demonstrate that C9orf72 and SMCR8 promote lysosomal degradation and prevent abnormal lysosomal exocytosis in macrophages.
c9orf72 and smcr8 single KO mice exhibited splenomegaly and lymphadenopathy, which were more severe in dKO mice. C9orf72 and SMCR8 have similar cellular functions in macrophages, including the regulation of lysosomal morphology, degradation, exocytosis, MTOR protein & MTORC1 signaling, inflammatory response and cytokine production. Certain defects are stronger in dKO mice than single KOs, including lymph node and spleen enlargement, inflammatory cytokine generation, MTOR protein and MTORC1 signaling. On the other hand, some defects in dKO mice are not substantially more severe than in single KOs, including macrophage lysosomal morphology and IL6 levels. Perhaps in these cases, individual gene deletion already causes “saturation” of these phenotypes and dKO does not appear to result in stronger effects. Interestingly, the level of the mature form of CTSB in dKO macrophage cells is in between that of c9orf72 and smcr8 single KOs, and similar patterns were observed for secreted CTSD and CTSB. These observations echo recent reports that these 2 proteins may have distinct and even opposite cellular functions [Citation17,Citation20,Citation22]. At the present, it is unclear why some dKO phenotypes are less severe than single KOs. Taken together, our studies revealed that individual or combined deletion of C9orf72 and Smcr8 result in similar cellular defects in macrophages.
Cell state-dependent regulation of MTORC1 via lysosomes
We found that impaired lysosomal degradation resulted in upregulation of MTOR protein and MTORC1 signaling in macrophages from single and dKO mice. This finding was supported by the disruption of lysosomal degradation using both genetic (c9orf72−/- and smcr8−/- mice) and pharmacological BafA1 and ConA approaches. It is generally believed that lysosomal function is required for MTORC1 signaling; lysosomal inhibition is therefore expected to result in MTORC1 inactivation [Citation26,Citation54,Citation55]. Why do the macrophages in this study behave differently from previously reported cells with respect to their lysosome-dependent MTORC1 signaling regulation? We speculate that this could be a cell state-dependent phenomenon, with proliferating and differentiated cells behaving differently in this regard. Although extensive research about MTORC1 signaling and lysosomes has been conducted in proliferating cells [Citation55,Citation56], relatively little has been performed in differentiated cells. C9orf72 depletion has been reported to reduce, rather than enhance, basal MTORC1 signaling in mouse embryonic fibroblast (MEFs), which are proliferating cells [Citation17,Citation20]. Consistent with studies in MEFs, we found a similar decrease in MTORC1 signaling in c9orf72 knockdown proliferating macrophage cell lines, which is in contrast to MTORC1 upregulation in differentiated macrophages from mutant mice. Accumulating evidence suggests that MTOR undergoes lysosome- and proteasome-dependent degradation in differentiated cells [Citation32]; inhibition of lysosomal functions results in MTORC1 activation in several types of differentiated cells, including osteoblasts, chondrocytes, and hippocampal neurons [Citation30–Citation32]. Therefore, C9orf72 or Smcr8 deletion-mediated lysosomal degradation may activate, rather than inhibit, MTORC1 signaling in differentiated macrophages, suggesting cell state-dependent regulation of MTORC1 signaling via lysosomes.
What is the biological significance of hyperactive MTORC1 in macrophages? Our studies suggest that constitutive MTORC1 activation disrupts macrophage polarization and leads to a pro-inflammatory state with inflammatory cytokine overproduction, which resembles phenotypes of c9orf72 and smcr8 mutant macrophages. We found that pharmacological inhibition of MTORC1 signaling was sufficient to partially rescue the macrophage dysfunction, splenomegaly, and lymphadenopathy in c9orf72 and smcr8 mutant mice. Meanwhile, MTORC1 inhibition failed to rescue other cellular defects in mutant macrophages, including elevated lysosomal pH, enlarged autolysosomes, and impaired lysosomal degradation, suggesting that MTOR upregulation is a result of impaired lysosomal degradation, rather than vice versa. Therefore, inhibition of hyperactive MTORC1 signaling due to impaired lysosomal degradation is sufficient to mitigate immune dysregulation in c9orf72 or smcr8 mutant mice. Our studies provided a causative link between C9orf72-SMCR8’s cellular functions and immune regulation at organism levels, suggesting a cell state-dependent regulation of MTOCR1 signaling via lysosome.
Materials and methods
c9orf72−/- and smcr8−/- mutant mice
c9orf72−/- mice were ordered from Jackson laboratory (027068) and have been described previously [Citation12]. To generate smcr8−/- mice, Smcr8tm1(KOMP)vlcg embryonic stem (ES) cells were obtained from the knockout mouse project (KOMP) repository at the University of California, Davis. The majority of Smcr8 exon 1 was replaced by a cassette containing lacZ-polyA followed by a loxP-flanked hUbCpro-neo-polyA sequence. The Mouse Genetics Core Facility at National Jewish Health in Denver, CO, performed the ES cell injections into C57BK/6N blastocysts. The chimeric offspring were mated to 129S1/SvImJ mice for germline transmission. Germline-transmitted heterozygous females were crossed with CMV-cre males to remove the neo cassette. All animal studies were conducted under protocols approved by the Institutional Animal Care and Use Committee at the University of Georgia or University of Southern California.
Mutant characterization and immunofluorescence staining
Histological processing and immunohistochemical labeling of sections were performed as described previously [Citation57]. Spleens were fixed in 4% paraformaldehyde followed by standard OCT (Sakura, 4583) embedding and coronal sectioning.
Peritoneal macrophage cells were cultured on coverslips, washed with PBS (Corning, 21040CV), and then fixed with 4% paraformaldehyde for 15 min, followed by permeabilization with cold methanol at −20°C for 5 min. Cells were then washed 3 times with PBS and blocked with 2% goat serum (Genetex, gtx73206) in PBS with 0.1% Triton X-100 (Sigma-Aldrich, T9234) for 1 h. Next, cells were incubated with primary antibodies in blocking buffer overnight, then washed with PBS 3 times, and incubated with Alexa Fluor-conjugated secondary antibodies and Hoechst for 1 h. Coverslips were then mounted on a glass slide with mounting medium. Images were obtained with a Zeiss LSM 710 inverted confocal microscope.
The following primary antibodies were used: anti-CD68 (BIO-RAD, MCA195T), anti-NOS2/iNOS (Novus Biologicals, NB300-605SS), anti-ARG1 (Cell Signaling Technology, 9819), anti-SMCR8 (Abcam, AB121682), anti-LAMP1 (Developmental studies hybridoma bank, 1D4B), anti-MAP1LC3/LC3 (Novus Biologicals, NB600-1384SS), anti-ACTB/β-actin (Cell Signaling Technology, 4970), anti-SQSTM1/p62 (BD Biosciences, 610832), anti-CTSD (R&D System, AF1029), anti-CTSB (R&D Systems, MAB965), anti-phospho-RPS6KB1/S6K1 (T389; Cell Signaling Technology, 9234), anti-RPS6KB1/S6K1 (Cell Signaling Technology, 2708), anti-phopho-RPS6/S6 (S235/236; Cell Signaling Technology, 4858), anti-MTOR (Cell Signaling Technology, 2983), and anti-phospho-MTOR (Ser2448; Cell Signaling Technology, 2971). The secondary antibodies included goat anti-rat IgG (H + L) cross-adsorbed secondary antibody, Alexa Fluor 647 (Invitrogen, A-21247), goat anti-rabbit IgG (H + L) highly cross-adsorbed secondary antibody, Alexa Fluor plus 488 (Invitrogen, A-32731), donkey anti-goat IgG (H + L) highly cross-adsorbed secondary antibody, Alexa Fluor plus 488 (Invitrogen, A32814), goat anti-mouse IgG1 highly cross-adsorbed secondary antibody, Alexa Fluor plus 488 (Invitrogen, A-21121), and goat anti-mouse IgG1 highly cross-adsorbed secondary antibody, Alexa Fluor plus 647 (Invitrogen, A-21240).
Chemical reagents
The following chemicals were used in the study: LysoSensor Green DND-189 (Molecular Probes, L-7535); BODIPY FL-conjugate pepstain A (Molecular Probes, p12271), BafA1 (Calbiochem, 196,000); DMSO (Sigma-Aldrich, D8418); torin (Selleckchem, S2827); trehalose dehydrate (Sigma-Aldrich, T9531); and ConA (Sigma-Aldrich, C9705).
Peritoneal macrophage isolation and polarization
3 ml of PBS was injected into the peritoneal cavities of WT and smcr8−/- mice followed by 5 min of gentle massage. Resident macrophages were harvested using a syringe and were centrifuged at 500 x g for 5 min. Cell pellet was suspended in Dulbecco’s modified eagle media (DMEM)/F12 with 10% FBS and 1% penicillin/streptomycin. After 2 h of culture in a 37°C CO2 incubator, unattached macrophage cells were removed by aspirating the culture medium. The cells were used for various assays as described in the figure legends after 24 h of culture. For M1 macrophage polarization, peritoneal macrophages were treated with 10 ng/ml LPS and 20 ng/ml IFNG for 30 min for NOS2 measurement. For the other cytokines, 100 ng/ml LPS and 20 ng/ml IFNG was added to macrophages for 24 h before sample collection. For M2 macrophage polarization, cells were treated with 20 ng/ml IL4 for 24 h before sample collection.
Western blot and qRT-PCR analysis
Peritoneal macrophages, MEFs, or spleen tissue were lysed with radio immunoprecipitation assay (RIPA) buffer. Protein lysate was separated utilizing sodium dodecyl sulfate polyacrylamide gel electrophoresis (SDS-PAGE), and were incubated with antibodies indicated in the figures followed by horseradish peroxidase (HRP)-labeled secondary antibodies (Bio-Rad, 5196–2504). To detect secreted cathepsin proteins, an equal number of peritoneal cells from WT and mutant mice were plated on 12-well plate. One h later, the unattached cells were washed away, and the attached macrophages were cultured in DMEM/F12 medium. After 16 h, the supernatant medium with secreted protein was collected and concentrated with centrifugal filters (Millipore, UFC801008). The supernatant concentration was measured by Bradford assay. Ten μg of whole protein was used for western blot. The equal loading was shown by amido black (Sigma-Aldrich, A8181) staining of the membrane. All band detection is within the linear range.
Total RNA was extracted with TRIzol (Invitrogen, 15596026) from different samples as indicated in the figures. One μg RNA was reverse-transcribed into cDNA utilizing Superscript III first-strand synthesis for PCR (Thermo Fisher Scientific, 18080051) in a 20-μl reaction system. The cDNA was analyzed utilizing qRT-PCR with Master mix (ThermoFisher Scientific, 4366072). The probes and primers specific for Gapdh, Il6, Il1b, Ifnb1 (interferon b, fibroblast), Tnf, and Nos2 were purchased from Taqman. The qRT-PCR was conducted under the following cycling conditions: 95°C for 10 min for predenaturation, 40 cycles of 95°C for 15 s and 60°C for 1 min for extension. The relative mRNA abundance was analyzed utilizing the 2−ΔΔCt method with GAPDH as a reference and plotted as fold changes compared to the mock-treated samples.
Rapamycin, torin, and trehalose rescue experiments
At 1 month of age, WT and c9orf72−/- or smcr8−/-mice were injected intraperitoneally with 4 mg/kg body weight rapamycin (Selleckchem, S1039), torin, 2% trehalose, or vehicle (for rapamycin: 2% DMSO, 30% PEG300, 5% Tween 80, and 63% ddH2O; for torin: DMSO) every other day, and then sacrificed after 6 weeks of treatment. Spleens, lymph nodes, and peritoneal macrophages were collected for images and qRT-PCR analysis.
Imaging of macrophages after pH-sensitive or -insensitive dye treatment
Peritoneal macrophages were isolated from WT, c9orf72−/-, and smcr8−/- mice at 3 months of age. The cells were seeded on glass bottom culture dishes (MatTek, P35G-0-14-C) and incubated overnight with 8 mg/ml of pH-sensitive pHrodo Red dextran (Life Technologies, P10361) and 20 mg/ml of pH-insensitive Alexa Fluor 488 green dextran (Life Technologies, D22910). Then the medium was replaced with macrophage culture medium (DMEM/F12 with 10% FBS and 1% penicillin/streptomycin) followed by chasing for 8 h to allow dextran delivery to lysosomes. The H+ pump was inhibited by incubating cells in isotonic Na+ buffer (140 mM NaCl, 5 mM KCl, 1 mM CaCl2, 1 mM MgCl2, 5 mM glucose, 20 mM HEPES, pH 7.4) containing 2 mM v-ATPase inhibitor ConA. Live cell images were obtained using a Leica SP8 confocal microscope at 1-min intervals for 12 min. Red fluorescence intensity, indicative of lysosome pH, was quantified with ImageJ at each time point.
ELISA of IL6 and IL1B
For IL6, 200 μl blood was collected from WT, c9orf72−/-, smcr8−/-, and dkO mice at 3 months of age. Plasma was isolated from blood mixed with citrate buffer by centrifugation at 2000 x g for 5 min. Fifty μl plasma was used for IL6 ELISA (Invitrogen, KMC0061) according to the manufacturer’s instructions. For IL1B, WT, smcr8−/-, and c9orf72−/- peritoneal macrophages were plated in 24-well plate with density of 5 × 10⁵ per well for 24 h. Supernatant was collected and analyzed with the Mouse IL1B ELISA kit (Invitrogen, BMS6002) according to the manufacturer’s instructions.
Statistical analysis
All results were expressed as means ± SEM of at least 3 independent experiments followed by one-way or two-way ANOVA with Bonferroni correction. Values of *P < 0.05 was considered as being significant.
Financial Statement
The authors declare that there are no competing financial interests that might be perceived as affecting the objectivity of these studies.
Supplemental Material
Download Zip (29.4 MB)Acknowledgments
We thank Chen laboratory colleagues for stimulating discussions. We are grateful for Bridget Samuels’s critical reading of the manuscript. Chen laboratory is supported by funds from the Associate Dean of Research Fund from the Center for Craniofacial Molecular Biology, Herman Ostrow School of Dentistry at the University of Southern California, and grants R01NS097231 (J.C.) and R01NS096176 (J.C.) from the National Institute of Health.
Disclosure statement
No potential conflict of interest was reported by the authors.
Supplementary material
Supplemental data for this article can be accessed here.
Additional information
Funding
Related Research Data
References
- Renton AE, Majounie E, Waite A, et al. A hexanucleotide repeat expansion in C9ORF72 is the cause of chromosome 9p21-linked ALS-FTD. Neuron. 2011;72:257–268.
- DeJesus-Hernandez M, Mackenzie IR, Boeve BF, et al. Expanded GGGGCC hexanucleotide repeat in noncoding region of C9ORF72 causes chromosome 9p-linked FTD and ALS. Neuron. 2011;72:245–256.
- Gao F-B, Almeida S, Lopez-Gonzalez R. Dysregulated molecular pathways in amyotrophic lateral sclerosis-frontotemporal dementia spectrum disorder. Embo J. 2017;36:2931–2950.
- Ling S-C, Polymenidou M, Cleveland DW. Converging mechanisms in ALS and FTD: disrupted RNA and protein homeostasis. Neuron. 2013;79:416–438.
- Gijselinck I, Van Langenhove T, van der Zee J, et al. A C9orf72 promoter repeat expansion in a flanders-Belgian cohort with disorders of the frontotemporal lobar degeneration-amyotrophic lateral sclerosis spectrum: a gene identification study. Lancet Neurol. 2012;11:54–65.
- Waite AJ, Bäumer D, East S, et al. Reduced C9orf72 protein levels in frontal cortex of amyotrophic lateral sclerosis and frontotemporal degeneration brain with the C9ORF72 hexanucleotide repeat expansion. Neurobiol Aging. 2014;35(1779):e5–1779.e13.
- Mizielinska S, Lashley T, Norona FE, et al. C9orf72 frontotemporal lobar degeneration is characterised by frequent neuronal sense and antisense RNA foci. Acta Neuropathol. 2013;126:845–857.
- Shi Y, Lin S, Staats KA, et al. Haploinsufficiency leads to neurodegeneration in C9ORF72 ALS/FTD human induced motor neurons. Nat Med. 2018;24:313–325.
- Koppers M, Blokhuis AM, Westeneng H-J, et al. C9orf72 ablation in mice does not cause motor neuron degeneration or motor deficits. Ann Neurol. 2015;78:426–438.
- Shao Q, Liang C, Chang Q, et al. C9orf72 deficiency promotes motor deficits of a C9ALS/FTD mouse model in a dose-dependent manner. Acta Neuropathol Commun. 2019;7:32.
- Atanasio A, Decman V, White D, et al. C9orf72 ablation causes immune dysregulation characterized by leukocyte expansion, autoantibody production, and glomerulonephropathy in mice. Sci Rep. 2016;6:23204.
- O’Rourke JG, Bogdanik L, Yáñez A, et al. C9orf72 is required for proper macrophage and microglial function in mice. Science. 2016;351:1324–1329.
- Burberry A, Suzuki N, Wang J-Y, et al. Loss-of-function mutations in the C9ORF72 mouse ortholog cause fatal autoimmune disease. Sci Transl Med. 2016;8:347ra93.
- Miller ZA, Sturm VE, Camsari GB, et al. Increased prevalence of autoimmune disease within C9 and FTD/MND cohorts: completing the picture. Neurol Neuroimmunol Neuroinflamm. 2016;3:e301.
- Ismail A, Cooper-Knock J, Highley JR, et al. Concurrence of multiple sclerosis and amyotrophic lateral sclerosis in patients with hexanucleotide repeat expansions of C9ORF72. J Neurol Neurosurg Psychiatr. 2013;84:79–87.
- Sellier C, Campanari M-L, Julie Corbier C, et al. Loss of C9ORF72 impairs autophagy and synergizes with polyQ Ataxin-2 to induce motor neuron dysfunction and cell death. Embo J. 2016;35:1276–1297.
- Amick J, Roczniak-Ferguson A, Ferguson SM. C9orf72 binds SMCR8, localizes to lysosomes, and regulates MTORC1 signaling. Mol Biol Cell. 2016;27:3040–3051.
- Jung J, Nayak A, Schaeffer V, et al. Multiplex image-based autophagy RNAi screening identifies SMCR8 as ULK1 kinase activity and gene expression regulator. Elife. 2017;6:2.
- Sullivan PM, Zhou X, Robins AM, et al. The ALS/FTLD associated protein C9orf72 associates with SMCR8 and WDR41 to regulate the autophagy-lysosome pathway. Acta Neuropathol Commun. 2016;4:51.
- Ugolino J, Ji YJ, Conchina K, et al. Loss of C9orf72 enhances autophagic activity via deregulated MTOR and TFEB signaling. PLoS Genet. 2016;12:e1006443.
- Webster CP, Smith EF, Bauer CS, et al. The C9orf72 protein interacts with Rab1a and the ULK1 complex to regulate initiation of autophagy. Embo J. 2016;35:1656–1676.
- Yang M, Liang C, Swaminathan K, et al. A C9ORF72/SMCR8-containing complex regulates ULK1 and plays a dual role in autophagy. Sci Adv. 2016;2:e1601167.
- Marat AL, Dokainish H, McPherson PS. DENN domain proteins: regulators of Rab GTPases. J Biol Chem. 2011;286:13791–13800.
- Zhang D, Iyer LM, He F, et al. Discovery of novel DENN proteins: implications for the evolution of eukaryotic intracellular membrane structures and human disease. Front Genet. 2012;3:283.
- Corrionero A, Horvitz HR. A C9orf72 ALS/FTD ortholog acts in endolysosomal degradation and lysosomal homeostasis. Curr Biol. 2018;28:1522–1525.
- Zoncu R, Bar-Peled L, Efeyan A, et al. MTORC1 senses lysosomal amino acids through an inside-out mechanism that requires the vacuolar H(+)-ATPase. Science. 2011;334:678–683.
- Li M, Khambu B, Zhang H, et al. Suppression of lysosome function induces autophagy via a feedback down-regulation of MTOR complex 1 (MTORC1) activity. J Biol Chem. 2013;288:35769–35780.
- Palm W, Park Y, Wright K, et al. The utilization of extracellular proteins as nutrients is suppressed by MTORC1. Cell. 2015;162:259–270.
- Yu L, McPhee CK, Zheng L, et al. Termination of autophagy and reformation of lysosomes regulated by MTOR. Nature. 2010;465:942–946.
- Newton PT, Vuppalapati KK, Bouderlique T, et al. Pharmacological inhibition of lysosomes activates the MTORC1 signaling pathway in chondrocytes in an autophagy-independent manner. Autophagy. 2015;11:1594–1607.
- Hwang J-Y, Gertner M, Pontarelli F, et al. Global ischemia induces lysosomal-mediated degradation of MTOR and activation of autophagy in hippocampal neurons destined to die. Cell Death Differ. 2017;24:317–329.
- Hu Y, Carraro-Lacroix LR, Wang A, et al. Lysosomal pH plays a key role in regulation of MTOR activity in osteoclasts. J Cell Biochem. 2016;117:413–425.
- Zhang Y, Burberry A, Wang J-Y, et al. The C9orf72-interacting protein Smcr8 is a negative regulator of autoimmunity and lysosomal exocytosis. Genes Dev. 2018;32:929–943.
- Weber K, Schilling JD. Distinct lysosome phenotypes influence inflammatory function in peritoneal and bone marrow-derived macrophages. Int J Inflam. 2014;2014:154936–154939.
- Wang C, Yu X, Cao Q, et al. Characterization of murine macrophages from bone marrow, spleen and peritoneum. BMC Immunol. 2013;14:6.
- Mantovani A, Sica A, Sozzani S, et al. The chemokine system in diverse forms of macrophage activation and polarization. Trends Immunol. 2004;25:677–686.
- Klionsky DJ, Abdelmohsen K, Abe A, et al. Guidelines for the use and interpretation of assays for monitoring autophagy (3rd edition). Autophagy. 2016;12:1–222.
- Sardiello M, Palmieri M, Di Ronza A, et al. A gene network regulating lysosomal biogenesis and function. Science. 2009;325:473–477.
- Settembre C, Zoncu R, Medina DL, et al. A lysosome-to-nucleus signalling mechanism senses and regulates the lysosome via MTOR and TFEB. Embo J. 2012;31:1095–1108.
- Martina JA, Chen Y, Gucek M, et al. MTORC1 functions as a transcriptional regulator of autophagy by preventing nuclear transport of TFEB. Autophagy. 2012;8:903–914.
- Roczniak-Ferguson A, Petit CS, Froehlich F, et al. The transcription factor TFEB links MTORC1 signaling to transcriptional control of lysosome homeostasis. Sci Signal. 2012;5:ra42.
- Chen CS, Chen WN, Zhou M, et al. Probing the cathepsin D using a BODIPY FL-pepstatin A: applications in fluorescence polarization and microscopy. J Biochem Biophys Methods. 2000;42:137–151.
- Progida C, Cogli L, Piro F, et al. Rab7b controls trafficking from endosomes to the TGN. J Cell Sci. 2010;123:1480–1491.
- McIntyre GF, Erickson AH, Procathepsins L. D are membrane-bound in acidic microsomal vesicles. J Biol Chem. 1991;266:15438–15445.
- Haka AS, Grosheva I, Chiang E, et al. Macrophages create an acidic extracellular hydrolytic compartment to digest aggregated lipoproteins. Mol Biol Cell. 2009;20:4932–4940.
- Singh RK, Barbosa-Lorenzi VC, Lund FW, et al. Degradation of aggregated LDL occurs in complex extracellular sub-compartments of the lysosomal synapse. J Cell Sci. 2016;129:1072–1082.
- Tapper H, Sundler R. Role of lysosomal and cytosolic pH in the regulation of macrophage lysosomal enzyme secretion. Biochem J. 1990;272:407–414.
- Sundler R. Lysosomal and cytosolic pH as regulators of exocytosis in mouse macrophages. Acta Physiol Scand. 1997;161:553–556.
- Saftig P, Klumperman J. Lysosome biogenesis and lysosomal membrane proteins: trafficking meets function. Nat Rev Mol Cell Biol. 2009;10:623–635.
- Zhu L, Yang T, Li L, et al. TSC1 controls macrophage polarization to prevent inflammatory disease. Nat Commun. 2014;5:4696.
- Byles V, Covarrubias AJ, Ben-Sahra I, et al. The TSC-MTOR pathway regulates macrophage polarization. Nat Commun. 2013;4:2834.
- Murray RZ, Stow JL. Cytokine secretion in macrophages: sNAREs, rabs, and membrane trafficking. Front Immunol. 2014;5:538.
- Andrei C, Dazzi C, Lotti L, et al. The secretory route of the leaderless protein interleukin 1beta involves exocytosis of endolysosome-related vesicles. Mol Biol Cell. 1999;10:1463–1475.
- Bar-Peled L, Schweitzer LD, Zoncu R, et al. Ragulator is a GEF for the rag GTPases that signal amino acid levels to MTORC1. Cell. 2012;150:1196–1208.
- Efeyan A, Zoncu R, Sabatini DM. Amino acids and MTORC1: from lysosomes to disease. Trends Mol Med. 2012;18:524–533.
- Lim C-Y, Zoncu R. The lysosome as a command-and-control center for cellular metabolism. J Cell Biol. 2016;214:653–664.
- Chen J-F, Zhang Y, Wilde J, et al. Microcephaly disease gene Wdr62 regulates mitotic progression of embryonic neural stem cells and brain size. Nat Commun. 2014;5:3885.