
ABSTRACT
Macroautophagy/autophagy is a key homeostatic process that targets cytoplasmic components to the lysosome for breakdown and recycling. Autophagy plays critical roles in glia and neurons that affect development, functionality, and viability of the nervous system. The mechanisms that regulate autophagy in glia and neurons, however, are poorly understood. Here, we define the molecular underpinnings of autophagy in primary cortical astrocytes in response to metabolic stress, and perform a comparative study in primary hippocampal neurons. We find that inducing metabolic stress by nutrient deprivation or pharmacological inhibition of MTOR (mechanistic target of rapamycin kinase) robustly activates autophagy in astrocytes. While both paradigms of metabolic stress dampen MTOR signaling, they affect the autophagy pathway differently. Further, we find that starvation-induced autophagic flux is dependent on the buffering system of the starvation solution. Lastly, starvation conditions that strongly activate autophagy in astrocytes have less pronounced effects on autophagy in neurons. Combined, our study reveals the complexity of regulating autophagy in different paradigms of metabolic stress, as well as in different cell types of the brain. Our findings raise important implications for how neurons and glia may collaborate to maintain homeostasis in the brain.
Abbreviations
ACSF: artificial cerebrospinal fluid; baf A1: bafilomycin A1; EBSS: earle’s balanced salt solution; GFAP: glial fibrillary acidic protein; Glc: glucose; GM: glial media; MAP1LC3/LC3: microtubule-associated protein 1 light chain 3; MTOR: mechanistic target of rapamycin kinase; p-RPS6: phospho-RPS6; p-ULK1: phospho-ULK1; RPS6: ribosomal protein S6; SQSTM1/p62: sequestosome 1; ULK1: unc-51-like kinase 1.
Introduction
Autophagy is an evolutionarily conserved process of self-digestion that is critical to maintaining cellular homeostasis . Autophagy targets cytoplasmic components such as proteins and organelles to lysosomes for destruction and recycling. Cargoes are packaged into autophagosomes that fuse with lysosomes to enable degradation by resident lysosomal hydrolases. In this way, autophagy can tune the balance between biosynthesis and degradation, thereby regulating the composition and quality of the proteome and organelles. Autophagy serves physiological roles in development, immunity, and adaptive responses to stress (e.g. proteotoxic, metabolic, and oxidative). In fact, dysfunctional autophagy is associated with various pathological states including cancer and neurodegenerative disease.
Autophagy is particularly critical in cells of the nervous system that must maintain viability and functionality for up to a century of time. Neurons and glia must establish and maintain a complex network of trillions of intercellular connections in the brain. Further, neurons are extremely active and fire action potentials at rates up to ~50 impulses per second. As a consequence, neuronal proteins and organelles are exceptionally vulnerable to overuse and damage. Given that neurons are post-mitotic, they cannot simply dilute out proteotoxins by cell division, making them reliant on quality control pathways to maintain homeostasis throughout their extended lifetime.
In fact, loss of autophagy in neurons and glia can lead to defects in neurodevelopment, affecting processes such as axon outgrowth and guidance, astrocyte differentiation, synaptogenesis, and developmental-based synaptic pruning. Therefore, autophagy plays a critical role in establishing proper connectivity of the nervous system. Autophagy is also important in maintaining the viability and functionality of established neuronal networks. Central nervous system-specific and neuron-specific knockout of core autophagy genes causes neuronal dysfunction and death in mice. Furthermore, neuron-specific alterations in autophagy can lead to synaptic dysfunction. Autophagy in surrounding glia also has a profound influence on neuronal health. Autophagy in Schwann cells, the myelinating glia of the peripheral nervous system, degrades myelin in response to axonal injury to promote neurite regeneration . Additionally, autophagy in microglia, the phagocytic macrophages of the central nervous system, facilitates degradation of extracellular Aβ, linking glial autophagy with the clearance of proteotoxins associated with Alzheimer disease . In total, autophagy serves key roles in neurons and glia during neurodevelopment and neuroprotection.
The mechanistic basis for how autophagy is regulated in each cell type, however, is largely unknown. We previously established a vectorial pathway for autophagy in the axon that delivers cargo from the distal axon to the soma for degradation in neurons [Citation32,Citation33]. Unexpectedly, neuronal autophagy was largely unaffected by canonical autophagy inducers such as nutrient deprivation and pharmacological inhibition of MTOR [Citation34]. These results raise the question of whether these properties are specific to neurons or whether they are shared by other cell types in the brain, such as glia.
Here, we examine the regulation of autophagy in response to metabolic stress in primary astrocytes, as compared with primary hippocampal neurons. We find that autophagy is robustly activated in astrocytes in response to two paradigms of metabolic stress: (1) nutrient deprivation and (2) pharmacological inhibition of MTOR. While both paradigms inhibit MTOR, they impact the mechanisms underlying autophagy differently. Further, activation of autophagy in response to starvation is dependent on the buffering system of the salt solution. Lastly, we find that autophagy is more robustly activated in primary astrocytes as compared with primary neurons in response to starvation, revealing striking differences in how autophagy is managed between different cell types in the brain.
Results
MTOR inhibition activates selective autophagy in primary astrocytes
We previously demonstrated that canonical autophagy inducers such as nutrient deprivation and MTOR inhibition do not robustly activate autophagy in primary neurons [Citation34]. These unexpected results led us to examine whether these properties are unique to neurons or are shared by other cell types in the brain such as astrocytes. Here, we define how autophagy is regulated in response to metabolic stress in primary cortical astrocytes. To measure autophagy, we isolated cortical glia from transgenic mice expressing GFP-LC3, a well-characterized marker for autophagosomes [Citation35,Citation36]. Glial cultures were enriched for astrocytes, and consisted of ~84% GFAP-positive astrocytes, ~5% IBA1-positive microglia, and ~0.06% GALC-positive oligodendrocytes ( and S1). The vast majority of the remaining cells were morphologically indistinguishable from GFAP-positive astrocytes. Since GFAP expression varies with astrocyte reactivity [Citation37], this population likely represents non-reactive astrocytes.
Figure 1. Inhibition of MTOR activates SQSTM1-mediated selective autophagy in primary astrocytes. (A) Immunostaining analysis and phase image of primary mouse cortical glia enriched for astrocytes (GFAP; astrocyte-specific marker). Bar: 20 µm. (B) Maximum projections of z-stacks of GFP-LC3 transgenic astrocytes treated with the MTOR inhibitor torin1 for 4 h and immunostained for GFP and SQSTM1. Arrowheads denote puncta co-positive for GFP-LC3 and SQSTM1. Outlines define cell boundaries. Bar: 10 µm. Inset bar: 1 µm. (C) Quantification of total GFP-LC3 puncta area normalized to cell area of astrocytes treated with torin1 for 4 h (mean ± SEM; one-way ANOVA with Tukey’s post hoc test; n = 54–96 cells from 3 independent experiments, 5–7 DIV). (D) Quantification of total SQSTM1 puncta area normalized to cell area of astrocytes treated with torin1 for 4 h (mean ± SEM; one-way ANOVA with Tukey’s post hoc test; n = 64–94 cells from 3 independent experiments, 5–7 DIV). (E) Quantification of the percentage of SQSTM1 puncta area that overlaps with GFP-LC3 puncta area in astrocytes treated with torin1 for 4 h (mean ± SEM; one-way ANOVA with Tukey’s post hoc test; n = 53–82 cells from 3 independent experiments, 5–7 DIV cells). (F and G) Immunoblot analysis and corresponding quantification of lysates generated from glia treated for 4 h with torin1. (F) GAPDH and TUBA1A/α-tubulin serve as loading controls; horizontal lines designate individual blots. (G) LC3-II levels were normalized to GAPDH (mean ± SEM; one-way ANOVA with Dunnett’s post hoc test; n = 3 independent experiments, each experiment was performed with technical replicates, 3–6 DIV). (H and I) Immunoblot analysis and quantification of SQSTM1 levels in glia treated with torin1. SQSTM1 levels were normalized to GAPDH (mean ± SEM; one-way ANOVA with Dunnett’s post hoc test; n = 4 independent experiments, 6–8 DIV). Baf A1, bafilomycin A1.
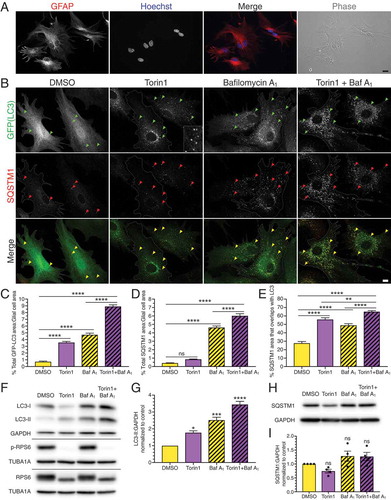
In this model, autophagosomes are represented by GFP-LC3-positive puncta distributed throughout the cytoplasm (). At steady state, the number of autophagosomes measured is a balance between the antagonistic activities of autophagosome formation and degradation. Therefore, to measure autophagic flux, we inhibited lysosome-mediated degradation with bafilomycin A1. In this way, we can measure changes in autophagosome formation without losing autophagosomes due to degradation. For each treatment condition, levels of autophagy were quantified by measuring the total area occupied by GFP-LC3-positive puncta per astrocyte, normalized to the respective astrocyte area.
To determine whether autophagy in astrocytes is regulated by MTOR, we suppressed MTOR function with torin1, a specific ATP-competitive inhibitor [Citation38]. GFP-LC3 transgenic astrocytes were treated with 250 nM torin1 for 4 h and analyzed by immunofluorescence for GFP (LC3). For immunofluorescence analysis, only cells that exhibited the characteristic morphology of cultured GFAP-positive astrocytes, defined as polygonal cells often with finger-like projections ( and S1A), were analyzed. Thus, the immunofluorescence analysis represents a highly pure population of astrocytes. We found that treatment with torin1 dramatically increased the total area of GFP-LC3 puncta per astrocyte ~5-fold relative to the DMSO control (), suggesting an induction of autophagy with MTOR inhibition. As expected, bafilomycin A1 increased GFP-LC3 area ~6.5-fold as compared with the DMSO control () due to an accumulation of autophagosomes in the absence of lysosome-mediated degradation. Co-treatment of bafilomycin A1 with torin1 further increased GFP-LC3 area ~12.4-fold relative to the DMSO control. Most strikingly, torin1 increased GFP-LC3 area ~2-fold beyond what is accumulated due to bafilomycin A1 alone (), indicating that inhibition of MTOR induces autophagic flux. Combined, these results demonstrate that MTOR inhibition activates autophagy in primary astrocytes.
We also analyzed these samples for levels of selective autophagy by co-staining for SQSTM1/p62. SQSTM1 is a receptor that binds to ubiquitin and LC3 to facilitate engulfment of specific cargoes into the autophagosome [Citation39]. During the process of selective autophagy, SQSTM1 will also be engulfed by the autophagosome and degraded. Treatment of astrocytes with torin1 resulted in a 2.1-fold increase in total area of SQSTM1-positive puncta, although this effect was not statistically significant (). Treatment with bafilomycin A1 to block lysosome-mediated degradation increased the total area of SQSTM1-positive puncta ~11.2-fold relative to the DMSO control (). Co-treatment with bafilomycin A1 and torin1 resulted in a significant increase in SQSTM1 puncta area ~1.3-fold relative to bafilomycin A1 alone (), suggesting that MTOR inhibition increases the flux of SQSTM1 through lysosome-mediated degradative pathways.
We observed a population of SQSTM1-positive puncta in torin1-treated cells that were co-positive for GFP-LC3 (), suggesting that MTOR inhibition may induce selective autophagy. To examine this possibility, we measured the degree of colocalization between SQSTM1-positive puncta and GFP-LC3-positive autophagosomes. First, we measured the percentage of SQSTM1 puncta area that overlaps with GFP-LC3-positive autophagosomes. Treatment with torin1 increased overlap of SQSTM1 with LC3 by ~2-fold relative to the DMSO control (). Blocking autophagosome clearance with bafilomycin A1 increased overlap of SQSTM1 with LC3 by ~1.8-fold as compared with DMSO (). Co-treatment of bafilomycin A1 with torin1 further increased this overlap ~2.3-fold relative to DMSO, and ~1.3-fold relative to bafilomycin A1 alone (). Thus, a population of autophagosomes that is generated during MTOR inhibition are engulfing SQSTM1, consistent with an induction of selective autophagy. We also performed the converse analysis and measured the percentage of GFP-LC3-positive area that is positive for SQSTM1 puncta. With this analysis, we find that the percentage of GFP-LC3 area that overlaps with SQSTM1-positive puncta remains largely the same in torin1-treated samples relative to controls (Fig. S2A). Combined, these findings suggest that while more SQSTM1-positive autophagosomes are formed during MTOR inhibition, the percentage of autophagosomes dedicated to SQSTM1-mediated degradation out of the total population remains relatively constant. Thus, SQSTM1-mediated selective autophagy is induced, but not enriched, during MTOR inhibition.
As a complementary approach, we determined levels of autophagy during MTOR inhibition by immunoblot analysis of lysates from primary cortical glia. Treatment with torin1 decreased levels of p-RPS6 (S240/244), a downstream target in the MTOR signaling pathway [Citation40], relative to total RPS6 levels, indicating that MTOR activity was effectively reduced in our treatment conditions (). To determine the effects of MTOR inhibition on autophagy, we immunoblotted for endogenous LC3. During autophagosome formation, cytosolic LC3 (LC3-I) is converted to LC3-II by addition of a lipid tag that facilitates association with the autophagosome membrane [Citation36]. Thus, the density of LC3-II can serve as an indicator for autophagy levels. Treatment with torin1 increased LC3-II levels relative to the DMSO control (), suggesting an induction of autophagy with MTOR inhibition. Treatment with bafilomycin A1 to block autophagosome clearance increased LC3-II levels relative to the DMSO control (). Co-treatment with bafilomycin A1 and torin1 increased LC3-II levels relative to bafilomycin A1 alone ), indicating an increase in autophagic flux with torin1 treatment. Consistent with the immunofluorescence data, the immunoblotting results also support that MTOR inhibition activates autophagy in astrocytes.
To determine whether torin1-induced autophagy results in the degradation of autophagic cargo, we immunoblotted for total levels of SQSTM1. While immunofluorescence measures punctate, autophagosome-associated SQSTM1, immunoblot analysis measures total levels of SQSTM1 including punctate forms as well as soluble, cytosolic forms of SQSTM1. Treatment with torin1 consistently displayed a trend of decreased total SQSTM1 levels across multiple trials, although the decrease was not statistically significant, raising the possibility that SQSTM1 is degraded through selective autophagy during MTOR inhibition (). Combined with the immunofluorescence results that show an increased population of SQSTM1 puncta that colocalize with GFP-LC3 and are targeted for lysosomal degradation with torin1 treatment (), these results suggest that inhibition of MTOR activates selective autophagy in primary astrocytes.
Different starvation treatments elicit varying effects on autophagy in astrocytes
Next, we examined whether autophagy is upregulated in astrocytes in response to nutrient deprivation. For this experiment, we incubated astrocytes in artificial cerebrospinal fluid (ACSF), a buffered salt solution with 10 mM glucose, to starve them of amino acids. We also incubated astrocytes in ACSF lacking glucose for added energy deprivation. Surprisingly, starvation in ACSF without glucose for 4 h dampened autophagic flux in astrocytes (). While treatment with bafilomycin A1 to block autophagosome clearance increased GFP-LC3 area ~8.6-fold relative to the DMSO control, co-treatment of bafilomycin A1 with ACSF lacking glucose decreased the area of GFP-LC3-positive autophagosomes ~2.6-fold relative to the fed (normal growth media) bafilomycin A1 condition (). Co-treatment with bafilomycin A1 with ACSF lacking glucose also reduced the degradative flux of SQSTM1 ~ 2.1-fold relative to the fed bafilomycin A1 condition (). Combined, these results suggest that starvation in ACSF lacking glucose dampens autophagic flux in primary astrocytes.
Figure 2. Starvation in ACSF dampens autophagy in primary astrocytes and induces a switch to SQSTM1-independent autophagy. (A) Maximum projections of Z-stacks of GFP-LC3 transgenic astrocytes starved in ACSF without glucose for 4 h and immunostained for GFP and SQSTM1. Closed arrowheads denote puncta co-positive for GFP-LC3 and SQSTM1. Open arrowheads denote SQSTM1-positive puncta that are not co-positive for GFP-LC3. Outlines define cell boundaries. Bar: 10µm. (B) Quantification of total GFP-LC3 puncta area normalized to cell area of astrocytes starved in ACSF without glucose for 4 h (mean ± SEM; one-way ANOVA with Tukey’s post hoc test; n = 58–68 cells from 4 independent experiments, 3–6 DIV). (C) Quantification of total SQSTM1 puncta area normalized to cell area of astrocytes starved in ACSF without glucose for 4 h (mean ± SEM; one-way ANOVA with Tukey’s post hoc test; n = 58–91 from 4 independent experiments, 3–6 DIV). (D) Quantification of the percentage of SQSTM1 puncta area that overlaps with GFP-LC3 puncta area in astrocytes starved in ACSF without glucose for 4 h (mean ± SEM; one-way ANOVA with Tukey’s post hoc test; n = 38–53 cells from 3 independent experiments, 5–6 DIV cells). (E and F) Immunoblot analysis and quantification of lysates generated from glia starved in ACSF ± glucose for 4 h. (E) GAPDH and TUBA1A/α-tubulin serve as loading controls; horizontal lines designate individual blots. (F) LC3-II levels were normalized to GAPDH (mean ± SEM; one-way ANOVA with Dunnett’s post hoc test; n = 3 independent experiments, 3–6 DIV). (G and H) Immunoblot analysis and quantification of SQSTM1 levels in glia starved in ACSF ± glucose for 4 h. SQSTM1 levels were normalized to GAPDH (mean ± SEM; one-way ANOVA with Dunnett’s post hoc test; n = 3 independent experiments, 3–6 DIV). Baf A1, bafilomycin A1; Glc, glucose; GM, glial media.
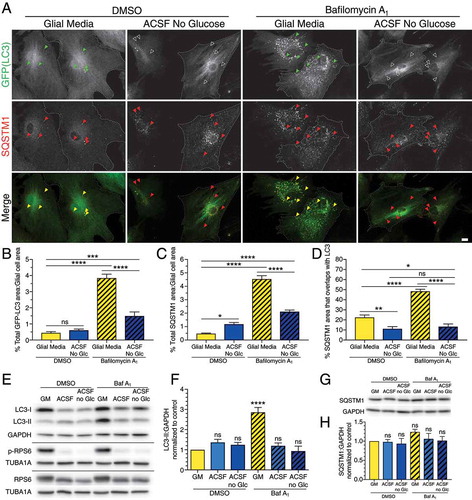
We also observed a ~ 2-fold reduction in the overlap between SQSTM1-positive puncta and GFP-LC3-positive autophagosomes with ACSF lacking glucose as compared with the fed DMSO control (). Consistent across our experiments, blocking autophagosome clearance with bafilomycin A1 predictably increased the area of SQSTM1-positive puncta that overlaps with GFP-LC3-puncta ~2.1-fold (). However, co-treatment of bafilomycin A1 with ACSF lacking glucose decreased overlap of SQSTM1 puncta with GFP-LC3-positive puncta ~1.7-fold relative to the fed DMSO control and ~3.6-fold relative to the fed bafilomycin A1 condition (). We also observed a decrease in the percentage of GFP-LC3-positive area that overlaps with SQSTM1-positive puncta in astrocytes treated with ACSF lacking glucose relative to controls (Fig. S2B). Together, these data indicate that the decrease in SQSTM1 puncta that are positive for LC3 is not due to just an overall dampening of autophagy levels, but is also a selective reduction in the amount of autophagosomes that are involved in SQSTM1-mediated autophagy relative to the total population. Therefore, starvation in ACSF lacking glucose not only dampens selective autophagy levels, but also de-enriches SQSTM1-mediated selective autophagy in primary astrocytes.
We also directly compared autophagy levels in glia incubated for 4 h in ACSF with and without 10 mM glucose by immunoblotting. In low nutrient conditions, MTOR signaling has been previously established to be dampened [Citation41]. To determine whether astrocytes sense starvation in our experimental paradigm, we immunoblotted for p-RPS6 as a measure of MTOR activity. Starvation in ACSF ± glucose decreased p-RPS6 levels relative to total RPS6, indicating a decrease in MTOR signaling in response to nutrient deprivation (). Thus, the astrocytes are sensing starvation in our experimental conditions. Treatment in ACSF ± glucose did not alter steady state levels of LC3-II (). However, ACSF ± glucose decreased the accumulation of LC3-II during bafilomycin A1 treatment (). Treatment with ACSF ± glucose also began to dampen the accumulation of SQSTM1 during bafilomycin A1 treatment although this effect was not significant until 8 h of treatment ( and ). Combined, the immunoblotting results corroborate the immunofluorescence findings that starvation in ACSF with or without glucose dampens autophagic flux in primary astrocytes.
Next, we assessed whether autophagy might be induced at earlier times in response to starvation in ACSF, or whether autophagy induction may require longer time periods of starvation than 4 h. To address these possibilities, we performed a time course to track the temporal response of autophagy to starvation in ACSF without glucose from 30 min up to 8 h. Within 30 min, starvation in ACSF lacking glucose decreased LC3-II levels relative to fed DMSO and fed bafilomycin A1 samples, suggesting an initial dampening of autophagic flux (Fig. S3A, C and D). Autophagic flux increased with time in ACSF no glucose, however, it remained consistently lower as compared to cognate fed controls (Fig. S3A, C and D). Curiously, at early time points when LC3-II and autophagy levels were low, SQSTM1 levels and SQSTM1 degradative flux were high in ACSF without glucose relative to fed controls (Fig. S3B, E and F). With further incubation in ACSF no glucose, SQSTM1 levels and SQSTM1 degradative flux decreased (Fig. S3B, E and F). By 8 h, SQSTM1 was elevated in only the fed bafilomycin A1-treated sample due to impaired SQSTM1 degradation (Fig. S3B, E and F). At this time point, SQSTM1 flux was dampened in ACSF no glucose relative to the fed bafilomycin A1 condition (Fig. S3B, E and, F), providing further evidence for decreased autophagic flux with starvation in ACSF. Collectively, these findings suggest that starvation in ACSF without glucose unexpectedly dampens autophagy in primary astrocytes during acute and long-term treatments.
This unanticipated dampening of autophagic flux with starvation in ACSF without glucose was corroborated with immunofluorescence analysis. Bafilomycin A1 added to normal growth media resulted in a steady increase in GFP-LC3 and SQSTM1 puncta area over time due to impaired lysosome-mediated degradation (Fig. S3G and H). By contrast, co-treatment of bafilomycin A1 with ACSF lacking glucose decreased GFP-LC3 and SQSTM1 puncta area relative to the fed bafilomycin A1 control (Fig. S3G and H). This effect is detected as early as 30 min of starvation and persists for up to 8 h (Fig. S3G and H). In total, based on our immunofluorescence and immunoblotting results, we find that starvation in ACSF ± glucose decreases autophagic flux in primary astrocytes.
Our observations that ACSF dampens autophagic flux in astrocytes was unexpected, given that nutrient deprivation has been previously established to activate autophagy in various other cell types [Citation42,Citation43]. Therefore, we considered whether some feature of these precise starvation conditions was preventing induction of autophagy. For this experiment, we starved astrocytes in a different type of buffered salt solution, Earle’s Balanced Salt Solution (EBSS), that contains 5.6 mM glucose. In contrast to starvation in ACSF, starvation in EBSS increased the percent area occupied by GFP-LC3 puncta per cell by ~4.8-fold relative to the fed DMSO control (). Interestingly, we noted that the autophagosomes generated in EBSS were often larger, ring-like structures, compared to the smaller, punctate structures observed with torin1-induced autophagy ( and , insets). Consistent across our experiments, bafilomycin A1 added to the normal growth media increased GFP-LC3 puncta area by ~5.4-fold relative to DMSO alone (). Co-treatment of bafilomycin A1 with EBSS resulted in a dramatic increase in GFP-LC3 puncta area per cell, ~14.4-fold above the fed DMSO control, and ~2.7-fold above the fed bafilomycin A1 control (). Thus, starvation in EBSS dramatically induces autophagy in primary astrocytes.
Figure 3. Starvation in EBSS activates autophagy in primary astrocytes. (A) Maximum projections of Z-stacks of GFP-LC3 transgenic astrocytes starved in EBSS for 4 h and immunostained for GFP and SQSTM1. Arrowheads denote puncta co-positive for GFP-LC3 and SQSTM1. Outlines define cell boundaries. Bar: 10 µm. Inset bar: 1 µm. (B) Quantification of total GFP-LC3 puncta area normalized to cell area of astrocytes starved in EBSS for 4 h (mean ± SEM; one-way ANOVA with Tukey’s post hoc test; n = 65–91 cells from 3 independent experiments, 4–5 DIV). (C) Quantification of total SQSTM1 puncta area normalized to cell area of astrocytes starved in EBSS for 4 h (mean ± SEM; one-way ANOVA with Tukey’s post hoc test; n = 48–61 cells from 3 independent experiments, 4–5 DIV). (D) Quantification of the percentage of SQSTM1 puncta area that overlaps with GFP-LC3 puncta area in astrocytes starved in EBSS for 4 h (mean ± SEM; one-way ANOVA with Tukey’s post hoc test; n = 25–39 cells from 3 independent experiments, 4–5 DIV).
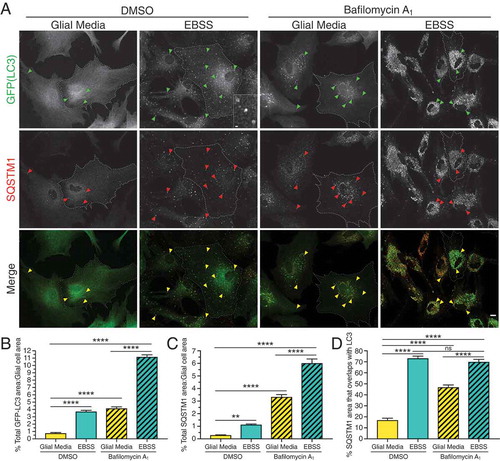
We also found that starvation in EBSS increased selective forms of autophagy. EBSS increased SQSTM1 puncta area ~3.8-fold relative to fed DMSO (). Consistently, bafilomycin A1 added to normal growth media increased SQSTM1 puncta area ~11-fold relative to the fed DMSO control (). Treatment with EBSS plus bafilomycin A1 increased SQSTM1 puncta area ~20-fold relative to the fed DMSO, and ~1.8-fold relative to the fed bafilomycin A1 (). Thus, starvation in EBSS increases the appearance of SQSTM1-positive puncta and flux of SQSTM1 through lysosomal-mediated degradative pathways.
Starvation in EBSS also increased the percent area of SQSTM1-positive puncta that colocalize with GFP-LC3-positive autophagosomes by ~4.2-fold relative to the fed DMSO control (). While blocking degradation with bafilomycin A1 increased colocalization between SQSTM1 and GFP-LC3 by 2.7-fold relative to the fed DMSO control, EBSS plus bafilomycin A1 increased colocalization by ~4-fold relative to the fed DMSO control and ~1.5-fold above the bafilomycin A1 alone (). Using the converse analysis, the percent area of GFP-LC3-positive autophagosomes that colocalized with SQSTM1 puncta in EBSS was similar to that in fed media controls (Fig. S2C). Thus, like MTOR inhibition, starvation in EBSS activates, but does not enrich, SQSTM1-mediated selective autophagy in primary astrocytes. These effects are in stark contrast to those in ACSF where selective autophagy is dampened.
To compare the starvation paradigms directly, we determined levels of autophagy after 30 min and 4 h in ACSF or EBSS (both containing glucose) by immunoblotting lysates from primary cortical glia. Starvation in either ACSF or EBSS progressively decreased p-RPS6 relative to total RPS6, from 30 min to 4 h (), indicating decreased MTOR activity in response to starvation in both salt solutions. Thus, the cells are sensing nutrient deprivation in either starvation paradigm. At 30 min, treatment with ACSF (containing glucose) dampened autophagic flux in astrocytes (, Ai). By 4 h, levels of LC3-II were equivalent between fed and ACSF conditions, suggesting that autophagosome levels may be increasing with time of starvation treatment, however, autophagic flux remained lower in ACSF (with glucose) + bafilomycin A1 relative to the fed + bafilomycin A1 condition (, Ai). These time-dependent effects are similar to our results with starvation in ACSF lacking glucose (Fig. S3A, C and D), indicating that the dampening of autophagic flux in ACSF is not dependent on glucose. By contrast, we did not observe a dampening of autophagic flux with EBSS treatment, but rather an activation of autophagic flux in EBSS (, Ai). Thus, while astrocytes sense nutrient deprivation in either ACSF or EBSS, they regulate autophagy differently in response to each starvation paradigm; ACSF dampens autophagic flux and EBSS activates autophagic flux.
Figure 4. Starvation in EBSS activates autophagy in a buffer-dependent manner. (A-Aii) Immunoblot analysis and corresponding quantification of glia starved in ACSF versus EBSS for 30 min or 4 h. LC3-II and SQSTM1 levels were normalized to GAPDH (mean ± SEM; one-way ANOVA with Dunnett’s post hoc test; statistical tests were performed independently for each time point; n = 3–5 independent experiments, 5–7 DIV). (B-Bii) Immunoblot analysis and corresponding quantification of glia starved for 4 h in ACSF vs EBSS with either 5.6 mM or 10 mM glucose. LC3-II and SQSTM1 levels were normalized to GAPDH (mean ± SEM; one-way ANOVA with Dunnett’s post hoc test; n = 4 independent experiments, 4–5 DIV). (C-Cii) Immunoblot analysis and corresponding quantification of glia starved for 4 h in ACSF versus EBSS with either HEPES or bicarbonate/phosphate buffering systems. LC3-II and SQSTM1 levels were normalized to GAPDH (mean ± SEM; one-way ANOVA with Dunnett’s post hoc test; n = 3 independent experiments, 4–8 DIV). (D and Di) Immunoblot analysis and corresponding quantification of glia starved for 4 h in the indicated salt solutions. p-ULK1:TUBA1A was normalized to total ULK1:TUBA1A (mean ± SEM; starvation data are analyzed by a one-way ANOVA with Dunnett’s post hoc test; torin1 data are analyzed by a t-test; n = 3 independent experiments, 3–6 DIV). (A-D) GAPDH and TUBA1A/α-tubulin serve as loading controls; horizontal lines designate individual blots. Baf A1, bafilomycin A1; GM, glial media.
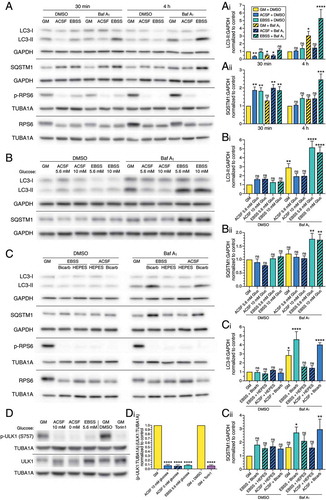
In addition to opposing effects on autophagy, the two salt solutions also elicited different effects on SQSTM1 levels. At 30 min, ACSF and EBSS increased SQSTM1 levels and flux of SQSTM1 through lysosome-mediated degradative pathways relative to fed controls (, Aii). These results are similar to our previous results with 30 min in ACSF without glucose (Fig. S3B, E and F). Thus, while ACSF dampens autophagic flux and EBSS activates autophagic flux, SQSTM1 levels increase after 30 min in either starvation treatment. At 4 h, however, SQSTM1 degradative flux was significantly increased in only EBSS and not in ACSF with glucose (or ACSF without glucose; , Aii and Fig. S3B, E, F). These results, combined with our colocalization analysis ( and ), are consistent with the induction of selective autophagy in EBSS and not in ACSF.
To determine whether the increase in SQSTM1 after 30 min of treatment in EBSS and ACSF was due to changes in autophagic flux or contributions from new protein synthesis, we starved astrocytes in the presence of cycloheximide to inhibit protein synthesis. Treatment with cycloheximide dampened, but did not completely abolish, the starvation-induced increase in SQSTM1 (Fig. S4A and B). Therefore, elevated SQSTM1 during acute starvation is partially attributed to new protein synthesis. Interestingly, 30 min in ACSF, but not EBSS, decreased levels of ubiquitination (Fig. S4A and C), providing further evidence that these salt solutions elicit differential effects on degradative pathways.
Our striking observations that the two salt solutions, which both effectively starve cells, elicit opposing effects on autophagic flux were puzzling. These differential effects were not due to increased cytotoxicity (Fig. S5). Indeed, there was no toxicity in either buffer (Fig. S5). Thus, we next sought to define the factors in EBSS and ACSF that could account for such differences. While the salt composition of ACSF and EBSS is largely similar (), the glucose concentration is 10 mM in ACSF and 5.6 mM in EBSS. To determine whether this difference in glucose concentration could account for the opposing effects of these salt solutions on autophagic flux, we starved glia for 4 h in ACSF or EBSS with either 5.6 mM or 10 mM glucose. Interestingly, treatment in ACSF with 5.6 mM or 10 mM glucose dampened autophagic flux to the same degree, and treatment in EBSS with 5.6 mM or 10 mM glucose induced autophagic flux to the same degree (, Bi). Further, different glucose concentrations had no effect on SQSTM1 levels within a given salt solution (, Bii). Thus, the differential effects of ACSF and EBSS on autophagic flux are not dependent on glucose concentration.
Table 1. Solutions used for starvation experiments.
Another key difference between these salt solutions is in the buffering systems; EBSS is buffered with bicarbonate and phosphate and ACSF is buffered with HEPES. Therefore, we examined the contributions of the buffering systems on modulating autophagy levels during starvation. For this experiment, we swapped the buffering systems and generated EBSS containing HEPES, and ACSF containing bicarbonate and phosphate buffers (). As expected, all generated salt solutions effectively starved the astrocytes, as indicated by decreased p-RPS6 relative to total RPS6 (). Consistent with our previous results, treatment with EBSS buffered with bicarbonate and phosphate induced autophagy (, Ci). Remarkably, starvation in EBSS buffered with HEPES, and not bicarbonate and phosphate, reduced autophagic flux, similar to ACSF buffered with HEPES (, Ci). Furthermore, when we performed the converse experiment and substituted bicarbonate and phosphate for HEPES, ACSF did not dampen autophagy, but activated autophagy to levels induced by EBSS buffered with bicarbonate and phosphate buffers (, Ci). Combined, we find that starvation in salt solutions buffered with HEPES dampen autophagic flux, and salt solutions buffered with bicarbonate and phosphate induce autophagic flux. Consistent with these results, SQSTM1 degradative flux increased in only bicarbonate/phosphate-buffered salt solutions (, Cii), further supporting an activation of selective autophagy. To our surprise, these findings indicate that the buffering system dramatically impacts the ability of the cell to activate autophagy in response to nutrient deprivation.
We next examined the cellular mechanism by which ACSF or EBSS differentially impact the autophagy pathway. Starvation in either salt solution effectively reduces the specific MTOR activity that promotes protein synthesis, as measured by decreased p-RPS6:RPS6 ( and C). Next, we investigated whether these salt solutions differentially impact the specific MTOR activity that regulates ULK1 (unc-51-like kinase 1), a kinase involved in autophagosome biogenesis [Citation1,Citation44]. MTOR phosphorylation of ULK1 at residue S757 inhibits ULK1; glucose starvation leads to removal of ULK1 phosphorylation at S757, and autophagy induction [Citation45]. We found that starving glia for 4 h in ACSF with 10 mM glucose, ACSF with no glucose, or EBSS with 5.6 mM glucose reduces p-ULK1 (S757) relative to total ULK1 to similar levels (, Di). Further, reductions in p-ULK1 (S757) relative to total ULK1 during starvation are comparable to levels achieved with pharmacological inhibition of MTOR using torin1 (, Di). Thus, our conditions of nutrient deprivation effectively inhibit MTOR activity, and the differential effects of the salt solutions on autophagic regulation are not due to differences in ULK1 regulation.
Starvation is a more potent activator of glial autophagy as compared with neuronal autophagy
We previously reported that starvation in ACSF (buffered with HEPES) did not robustly activate autophagy in primary hippocampal neurons [Citation34]. In our present study, we find that activation of autophagy in response to starvation is critically dependent on the buffering system of the starvation solution, with HEPES buffer leading to an inhibition of autophagic flux. These results led us to wonder whether the buffer accounted for the lack of autophagy induction during starvation of neurons in ACSF. To address this possibility, we evaluated the ability of neurons to activate autophagy in response to starvation in EBSS buffered with bicarbonate and phosphate. For this experiment, we isolated hippocampal neurons from GFP-LC3 transgenic mice and measured the percent area occupied by GFP-LC3-positive autophagosomes in the soma by live-cell imaging. Our preparations of primary hippocampal neurons are highly pure. Immunostaining analysis indicated that ~96% of Hoechst-positive cells were positive for the neuron-specific marker TUBB3/β3 tubulin; GFAP-positive astrocytes were rarely detected (Fig. S6).
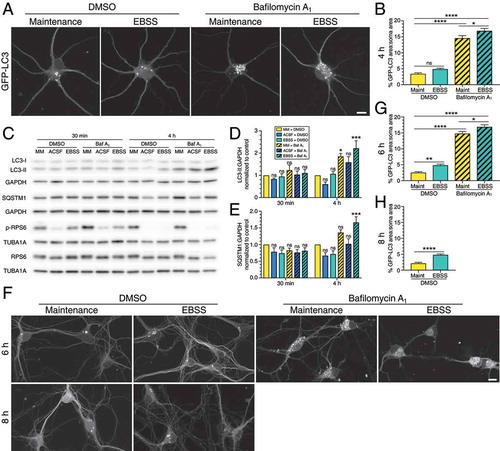
In contrast to astrocytes, treatment of neurons with EBSS for 4 h had no significant effect on autophagosome area in the soma relative to the fed control at steady state (). As expected, treatment with bafilomycin A1 to block autophagosome clearance dramatically increased GFP-LC3 puncta area in fed conditions by ~3.9-fold relative to the fed DMSO control. Co-treatment of bafilomycin A1 with EBSS, however, resulted in only a modest increase in autophagosome area relative to the fed bafilomycin A1 alone (). These results demonstrate that while there is a slight stimulation of autophagy in neurons during starvation, this induction is not as pronounced in neurons as it is in astrocytes. Therefore, neurons respond differently than astrocytes when challenged with metabolic stress.
Figure 5. Starvation in EBSS does not robustly activate autophagy in primary neurons. (A) Maximum projections of z-stacks in the soma of GFP-LC3 transgenic hippocampal neurons starved in EBSS for 4 h. Bar: 10 µm. (B) Corresponding quantification of GFP-LC3 puncta area normalized to the soma area of neurons starved in EBSS for 4 h (mean ± SEM; one-way ANOVA with Tukey’s post hoc test; n = 49–71 neurons from 4 independent experiments, 8–10 DIV). (C-E) Immunoblot analysis and corresponding quantification of wild type hippocampal neurons starved in ACSF versus EBSS for 4 h. GAPDH and TUBA1A/α-tubulin serve as loading controls; horizontal lines designate individual blots. LC3-II and SQSTM1 levels were normalized to GAPDH (mean ± SEM; one-way ANOVA with Dunnett’s post hoc test; statistical tests were performed independently for each time point; n = 6 independent experiments, 8–10 DIV). (F) Maximum projections of z-stacks in the soma of GFP-LC3 transgenic hippocampal neurons starved in EBSS for 6 h and 8 h. Bar: 10 µm. (G) Quantification of GFP-LC3 puncta area normalized to the soma area of hippocampal neurons starved in EBSS for 6 h (mean ± SEM; one-way ANOVA with Tukey’s post hoc test; n = 34–64 neurons from 4 independent experiments, 8–9 DIV). (H) Quantification of GFP-LC3 puncta area normalized to the soma area of hippocampal neurons starved in EBSS for 8 h (mean ± SEM; student’s t-test; n = 46–68 neurons from 4 independent experiments, 8–9 DIV). Baf A1, bafilomycin A1; MM, maintenance media.
We also measured autophagy levels by immunoblotting lysates from hippocampal neurons starved for 30 min or 4 h in ACSF (buffered with HEPES) or EBSS (buffered with bicarbonate and phosphate). Similar to astrocytes, hippocampal neurons detect nutrient deprivation in both salt solutions and downregulate MTOR signaling, as indicated by decreased p-RPS6 levels relative to total RPS6 (). Unlike in astrocytes, dampening of autophagic flux in ACSF was not as robust in primary neurons (). Treatment with EBSS resulted in only a slight activation of autophagy in neurons (). Unlike astrocytes, neurons did not accumulate SQSTM1 during short-term treatments in either ACSF or EBSS (). Thus, combined with the fluorescence data, these results indicate that autophagy is differentially regulated in neurons and astrocytes in response to stress, with starvation being a more potent activator of autophagy in astrocytes as compared with neurons.
Since autophagy is only mildly induced in primary neurons after 4 h of starvation, we next assessed whether robust activation of autophagy in neurons may require longer time periods of starvation. To address this possibility, we incubated GFP-LC3 transgenic hippocampal neurons in EBSS for 6 h and 8 h, and measured the percent area of GFP-LC3-positive puncta in the soma, normalized for soma area. Treatment with EBSS increased autophagosome area in the soma as a function of time, indicating that autophagy can be induced in neurons with longer periods of starvation (). Consistent with this result, autophagic flux was induced after 6 h of starvation in EBSS (). We were unable to assess autophagic flux at 8 h due to increasing toxicity associated with extended bafilomycin A1 treatment. Thus, we find that neurons can activate autophagy with longer periods of starvation (), however, the effects are less pronounced as compared to astrocytes that are starved for less time (4 h; ).
Discussion
Whether glia and neurons regulate autophagy in a similar manner in response to stress is poorly understood. Here, we address this issue and investigate the mechanistic basis for regulating autophagy during metabolic stress in primary astrocytes, and perform a comparative analysis with primary hippocampal neurons. We find that autophagy in astrocytes is strongly activated by pharmacological inhibition of MTOR (). We also find that nutrient deprivation activates autophagy in astrocytes and this induction is critically dependent on the buffering system of the starvation solution (,). Starvation in salt solutions buffered with HEPES dampens autophagy while starvation in salt solutions buffered with bicarbonate and phosphate activates autophagy (–). By contrast, starvation conditions that robustly activate autophagy in astrocytes have less pronounced effects in neurons, suggesting that nutrient deprivation is not as potent an activator of autophagy in neurons as compared to astrocytes ().
Our findings help to define the molecular basis for autophagy in response to various paradigms of metabolic stress and emphasize that different methods of MTOR inhibition, either by pharmacological inactivation or nutrient deprivation, impact the autophagy pathway differently. Results from immunofluorescence and immunoblotting analyses were corroborative, but immunofluorescence analysis allowed more sensitive detection of differences. While both treatments of MTOR inhibition can induce autophagy, the morphology of the autophagosomes generated in each treatment are different. Starvation leads to the formation of larger, more ring-like autophagosomes as compared with the smaller, more punctate autophagosomes formed during MTOR inhibition with torin1 ( and ). Additionally, while both treatments induce SQSTM1-positive, selective forms of autophagy, the effect on total SQSTM1 levels differs between each paradigm. During a 4 h treatment with torin1, increased autophagy levels result in a consistent trend of decreased total SQSTM1 levels ( and I). By contrast, starvation (in either ACSF or EBSS) elicits an early increase in steady state levels of SQSTM1, which then return to baseline by 4 h of starvation (, , Aii, S3B, E and F). We find that this initial increase in SQSTM1 during acute starvation is in part due to new protein synthesis (Fig. S4A and B). Interestingly, while MTOR signaling was dampened in all starvation paradigms tested, autophagy was not consistently activated (, , S3A and C). In fact, starvation in ACSF dampened autophagic flux in astrocytes (, -C and S3). Thus, not all conditions of MTOR inhibition are sufficient to stimulate autophagy. Our findings underscore the mechanistic diversity of different paradigms of autophagy activation. Further, our results raise important considerations when interpreting SQSTM1 as a readout for autophagic flux, as total SQSTM1 levels are differentially impacted depending on the type of metabolic stress.
One of our most striking observations is that not all starvation conditions result in the activation of autophagy (– and S3). These differential effects are not due to differences in glucose concentration (, Bi) or an increase in cytotoxicity (Fig. S5). Rather, these differential effects are attributed to the buffering system of the salt solution. We starved astrocytes in two salt solutions, ACSF versus EBSS, that differed primarily in the type of buffering system, HEPES versus bicarbonate-phosphate, respectively. We also performed experiments to swap the buffering system and generated ACSF buffered by bicarbonate-phosphate and EBSS buffered with HEPES. All combinations of salt solutions effectively decreased p-RPS6 levels (, and S3A), indicating a decrease in MTOR signaling, consistent with cells sensing nutrient deprivation in all paradigms tested. However, most strikingly, autophagy was activated in only salt solutions buffered with bicarbonate and phosphate, and not HEPES (– and S3). Salt solutions buffered with HEPES had an inhibitory effect and dampened autophagic flux. Differences between these salt solutions was further evident by measuring levels of SQSTM1-mediated selective autophagy. Indeed, EBSS elicited SQSTM1-mediated selective autophagy whereas ACSF muted the process. We also observed a decrease in cellular ubiquitination levels in ACSF (HEPES-buffered) as compared with EBSS (bicarbonate/phosphate-buffered) (Fig. S4). Thus, the buffering system dramatically impacts the ability of the cell to modulate autophagy in response to metabolic stress. These findings provide an important distinction for the autophagy field in considering how buffer components impact starvation-induced autophagy.
Notably, buffering systems can affect cellular function in other contexts. For example, incubating neurons in HEPES-buffered solutions, but not bicarbonate-based solutions, can alter neuron membrane potential and dampens firing rates [Citation46]. The mechanisms underlying this effect are unclear. One possibility is that bicarbonate, which is a more physiological, cell-permeant buffer than HEPES, may enable tighter regulation of extracellular and hence intracellular pH over extended time periods. One recent report links acidic intracellular pH with alterations in lysosome distribution and function [Citation47], which could have profound effects on the autophagy pathway. Likewise, acidic intracellular environments can decrease autophagic flux [Citation48]. We found that starvation in either buffering system effectively downregulates p-RPS6:RPS6 and p-ULK1:ULK1 (). Thus, these buffer-dependent effects are not explained by differential activities of MTOR signaling that regulate new protein synthesis and autophagy, respectively. Future studies will need to identify the cellular mechanisms underlying these buffer-dependent effects.
Our results also highlight differences in the regulation of stress-induced autophagy between astrocytes and neurons. We find that starvation is a more potent activator of autophagy in astrocytes as compared with neurons. After 4 h of starvation, autophagy is activated more robustly in astrocytes as compared with neurons (, and ). While longer periods of starvation (6 h and 8 h) can activate autophagy in neurons (), the effects are less pronounced as compared to astrocytes that are starved for less time (4 h; ). Further, during acute starvation in either ACSF or EBSS, SQSTM1 levels and SQSTM1 degradative flux are initially elevated in astrocytes, but are unaltered in neurons (, Aii, 5C, E, and S3B, E). Since ACSF and EBSS have opposing effects on autophagy, this increase in SQSTM1 degradative flux in astrocytes is uncoupled from LC3-II-dependent macroautophagy at early time points of starvation. We show that a component of this starvation-induced increase in SQSTM1 in astrocytes is attributed to new synthesis of SQSTM1 (Fig. S4). The remaining increase in SQSTM1 degradative flux may be attributed to microautophagy, a process where cargoes are engulfed directly into endolysosomal organelles without an autophagosome intermediate. A recent study demonstrated that during acute starvation, selective autophagy receptors, such as SQSTM1, are efficiently degraded through endosomal microautophagy, independent of macroautophagy [Citation49]. Interestingly, we see this starvation-induced increase in SQSTM1 degradative flux only in astrocytes and not in neurons, suggesting that not only macroautophagy, but also microautophagy, may be differentially regulated in astrocytes versus neurons. Lastly, we show that MTOR inhibition activates autophagy more robustly in astrocytes as compared to our previous results in neurons [Citation34] (). Thus, we find that astrocytes exhibit a more pronounced activation of autophagy during metabolic stress as compared with neurons. These results may point to a major dichotomy in autophagic regulation between the main cell types of the brain.
Given that neurons are post-mitotic and must survive for nearly a century, they are particularly dependent on robust quality control pathways to maintain health and functionality throughout their extended lifetime. Thus, our findings that metabolic stressors are more potent activators of autophagy in astrocytes as compared with neurons are particularly intriguing. These data may point to a metabolic division of labor in the brain. The extensive specialization of neurons may render them more dependent on glia for metabolic support. In fact, Zheng et al. have shown that neural progenitor cells switch from aerobic glycolysis to oxidative phosphorylation as they differentiate into neurons, linking different metabolic programs with proliferative versus post-mitotic differentiation states [Citation50]. Concomitant with this transition to oxidative phosphorylation, mitochondrial mass increases in neurons [Citation50]. As a consequence, neurons may then rely on glia to provide fuel, in the form of lactate, for mitochondrial ATP production [Citation51,Citation52]. This intercellular transfer of lactate represents a point of vulnerability for neurons as mutations in the oligodendroglial-enriched lactate transporter lead to neurodegenerative disease in humans [Citation53]. Interestingly, a recent study examined changes in the neuronal proteome when neurons were grown in isolation or in combination with glia [Citation54]. Lack of glia greatly enhanced the turnover of neuronal glycolytic proteins, suggesting that in the absence of metabolic support from glia, neurons must rely on their own glycolytic machinery [Citation54]. Complexity is further added when considering region-specific functions for neurons in the brain. A recent study demonstrates that starvation upregulates autophagy in only hypothalamic neurons and not cortical, hippocampal, or cerebellar neurons in vivo [Citation55], suggesting neuron-specific functions for autophagy in the brain. In total, emerging data support a collaboration between neurons and surrounding glia to regulate metabolic function in the brain. In this role, we find that glia are more responsive to metabolic stress, in terms of activating autophagy, as compared with neurons.
Other studies have indicated that autophagy and other branches of the quality control network might be regulated differently in neurons versus astrocytes in response to other modalities of stress. Pamenter et al. show that ischemic stress induces extensive vacuolization in astrocytes as compared with neurons [Citation56]. Pla et al. suggest that ethanol stress might elicit autophagy in astrocytes but not in neurons [Citation57]. Post-mortem samples from Alzheimer disease patients exhibit elevated levels of TFEB, a transcription factor that regulates autophagosome and lysosome biogenesis, in astrocytes as compared with neurons [Citation58]. Mice deficient in PI(3,5)P2 accumulate SQSTM1 preferentially in astrocytes as compared with neurons [Citation59]. Moruno-Manchon et al. also demonstrate cell-type specific differences in SPHK1 (sphingosine kinase 1)-associated autophagy in neurons versus astrocytes [Citation60]. Tydlaka et al. demonstrate that glia exhibit higher proteasomal activity with aging as compared with neurons [Citation61]. Thus, accumulating evidence suggests that glia may be more sensitive to different modalities of stress and respond with different alterations in autophagy as compared with neurons.
Recent reports also raise an intriguing hypothesis of whether glia may supplement neuronal degradation systems. Indeed, work has shown intercellular transfer of organelles from neuronal axons to neighboring astrocytes for degradation by lysosomes [Citation62]. Further, microglia may have key neuroprotective roles in models of neurodegenerative disease by degrading aggregated proteins originating from neurons [Citation63]. An interesting implication for our results is that MTOR inhibitors, such as rapamycin, may have neuroprotective effects in vivo by stimulating autophagy preferentially in glia as compared with neurons. These treatments, in combination with small molecules to further target autophagy in neurons, could be used to strengthen therapeutic strategies to mitigate neurodegenerative disease [Citation64].
Materials and methods
Reagents
GFP-LC3 transgenic mice, strain name B6.Cg-Tg(CAG-EGFP/LC3)53Nmi/NmiRbrc were obtained from the RIKEN BioResource Center in Japan [Citation35] and maintained as heterozygotes. All animal protocols were approved by the Institutional Animal Care and Use Committee at the University of Pennsylvania. Primary antibodies for immunofluorescence include chicken anti-GFP (Aves Labs, Inc., GFP-1020), mouse anti-SQSTM1/p62 (Abcam, Ab56416), rabbit anti-GFAP (Millipore, AB5804), rabbit anti-IBA1 (Wako, 019–19741), anti-GALC (galactosylceramidase; H8H9) mouse hybridoma supernatant (gift from Judith Grinspan, University of Pennsylvania, Philadelphia, PA), and mouse anti-TUBB3/β3 tubulin (Novus Biologicals, MAB1195-SP). Secondary antibodies for immunofluorescence include goat anti-chicken Cy2 (Jackson ImmunoResearch Laboratories, 103-225-155), goat anti-mouse Alexa Fluor 594 (Invitrogen, A11032), goat anti-mouse Alexa Fluor 488 (Thermo Fisher Scientific/Invitrogen, A11029), goat anti-rabbit Alexa Fluor 488 (Thermo Fisher Scientific/Invitrogen, A11034), and goat anti-rabbit Alexa Fluor 594 (Thermo Fisher Scientific/Invitrogen, A11037). Hoechst 33342 was purchased from Thermo Fisher Scientific/Molecular Probes (H3570). Draq7 was purchased from Abcam (ab109202). Antibodies for immunoblot analysis include rabbit anti-LC3 (Abcam, ab48394), rabbit anti-LC3 (Cell Signaling Technology, 2775S), mouse anti-GAPDH (Advanced Immunochemicals, 2-RGM2 clone 6C5), mouse anti-GAPDH (Abcam, ab9484), mouse anti-TUBA1A/α-tubulin (Sigma, T9026 clone DM1A), rabbit anti-p-RPS6/S6 (Cell Signaling Technology, 2215), rabbit anti-RPS6/S6 (Cell Signaling Technology, 2217S), mouse anti-SQSTM1/p62 (Abcam, ab56416), mouse anti-ubiquitin (Cell Signaling Technology, 3936T, clone P4D1), rabbit anti-p-ULK1 (Ser757; Cell Signaling Technology, 6888), rabbit anti-ULK1 (Cell Signaling Technology, 8054, clone D8H5), donkey anti-mouse peroxidase conjugated secondary antibody (Jackson ImmunoResearch Laboratories, 715-035-151), and donkey anti-rabbit peroxidase-conjugated secondary antibody (Jackson ImmunoResearch Laboratories, 711-035-152). Small molecules include bafilomycin A1 (Sigma, B1793), torin1 (Calbiochem, 475991), and cycloheximide (Sigma, C7698).
Primary cortical astrocyte culture
Cerebral cortices were dissected from brains of GFP-LC3 transgenic or non-transgenic neonatal mice of either sex at P0-P1, and carefully stripped of their meninges. Tissue was digested with 0.25% trypsin (Thermo Fisher Scientific/Gibco, 15090–046) for 10 min at 37°C, then triturated with a 5 mL pipette to break up large pieces of tissue, and then triturated with a P1000 pipet until a homogeneous cell suspension is achieved. Cells were passed through a strainer with 40 µm pores (Falcon, 352340) and plated at a density of 2,000,000–3,000,000 astrocytes per 10 cm dish. Astrocytes were grown in glial media (DMEM [Thermo Fisher Scientific/Gibco, 11965–084] supplemented with 10% heat inactivated fetal bovine serum [Hyclone, SH30071.03], 2 mM Glutamax [Thermo Fisher Scientific/Gibco, 35050–061], 100 U/ml penicillin and 100 µg/ml streptomycin [Thermo Fisher Scientific/Gibco, 15140–122]) at 37°C in a 5% CO2 incubator. The next day after plating, and every 3–5 d following, glia were fed by replacing glial media. When glia reached 80–90% confluence (~8–10 d after plating), astrocytes were trypsinized and plated for experiments. 200,000–500,000 astrocytes were plated per 35 mm fluorodish (World Precision Instruments, FD35-100) coated with 500 µg/ml poly-L-lysine (Sigma, P2636) for immunofluorescence, or per 6-well for immunoblotting. Astrocytes were grown in glial media for 3–8 DIV at 37°C in a 5% CO2 incubator. All immunoblot analyses utilized GFP-LC3 transgenic glia except those shown in ( and S4) which were from non-transgenic glia. We noted no differences in the cellular response to starvation between GFP-LC3 transgenic and non-transgenic astrocytes.
Primary hippocampal neuron culture
Hippocampi were dissected from brains of GFP-LC3 transgenic mouse embryos of either sex at day 15.5; detailed methods are found in Dong et al., 2019 [Citation65]. In brief, the tissue was digested with 0.25% trypsin for 10 min at 37°C, and then triturated through a small-bore glass Pasteur pipette to achieve a homogeneous cell suspension. For live-cell imaging, we plated 750,000–1,500,000 GFP-LC3 transgenic hippocampal neurons in a 10 cm dish containing eight 25 mm acid-washed glass coverslips coated with 500 µg/ml poly-L-lysine. For the immunofluorescence in Fig. S6, ,500,000 non-transgenic hippocampal neurons were plated in a 10 cm dish containing eight 25 mm acid-washed glass coverslips coated with 500 µg/ml poly-L-lysine. For immunoblotting analysis in (), we obtained wild-type mouse hippocampal neurons from the Neurons R Us core facility at the University of Pennsylvania. These neurons were prepared from C57BL/6 mouse embryos at day 18 and plated at 240,000 cells per 6-well coated with 50 µg/ml poly-L-lysine. Neurons were grown for 8–10 DIV in maintenance media (Neurobasal medium [Thermo Fisher Scientific/Gibco, 21103–049] supplemented with 2% B-27 [Thermo Fisher Scientific/Gibco, 17504–044], 37.5 mM NaCl, 33 mM glucose [Sigma, G8769], 2 mM glutaMAX, and 100 U/ml penicillin and 100 µg/ml streptomycin) at 37°C in a 5% CO2 incubator. Every 3–4 d, 20–30% media was replaced; 1 µM AraC (anti-mitotic drug; Sigma, C6645) was added to the first feed.
Torin1 and starvation treatments
For the torin1 treatment, glia were incubated in glial media supplemented with 250 nM torin1, 100 nM bafilomycin A1, 250 nM torin1 and 100 nM bafilomycin A1, or an equivalent volume of DMSO as a solvent control, for 4 h at 37°C in a 5% CO2 incubator. For starvation experiments, the following solutions were used (; the pH for all solutions was confirmed to be within physiological range):
For starvation experiments, cells were washed once in either regular growth media or the indicated salt solution, and then incubated in each solution supplemented with 100 nM bafilomycin A1, or DMSO as a solvent control, for the designated time at 37°C in a 5% CO2 incubator. In Fig. S4, glial media or the salt solutions were supplemented with 20 µg/ml cycloheximide or an equivalent volume of water as a solvent control and incubated for 30 min at 37°C in a 5% CO2 incubator.
Immunostaining
Neurons or glia were fixed for 10 min in 4% PFA/4% sucrose in PBS (150 mM NaCl, 50 mM NaPO4, pH 7.4) previously warmed to 37°C. Cells were washed two times in PBS, permeabilized for 5 min in 0.1% Triton X-100 (Thermo Fisher Scientific, BP151-100) in PBS, washed two times in PBS, and then blocked for 1 h in PBS supplemented with 5% goat serum (Sigma, G9023) and 1% bovine serum albumin (Thermo Fisher Scientific, BP1605-100). Cells were then incubated in primary antibody diluted in block solution for 1 h at room temperature, washed 3 times for 5 min each in PBS, and then incubated in secondary antibody diluted in block solution for 1 h at room temperature. For experiments requiring nuclear stain, Hoechst dye was included in the incubation with secondary antibody at a final concentration of 0.5 µg/ml. Following incubation in secondary antibody, samples were washed 3 times for 5 min each in PBS and kept in PBS for imaging. Samples in Fig. S6 were mounted in ProLong Gold (Thermo Fisher Scientific/Molecular Probes, P36930).
For immunolabeling oligodendrocytes in Fig. S1, live cells were washed once in PBS and then labeled with anti-GALC antibody for 30 min at room temperature. Cells were then washed 5 times in PBS and then labeled with secondary antibody and Hoechst dye for 30 min at room temperature. Samples were washed 5 times in PBS, fixed in 4% PFA/4% sucrose for 10 min, and then washed 2 times in PBS and kept in PBS for imaging.
Images in (, , and ) were acquired on a BioVision spinning disk confocal microscope system consisting of a Yokagawa W1 spinning disk confocal, a Leica DMi8 inverted widefield microscope, and Photometrics Prime 95B sCMOS camera. Images were acquired with VisiView software using a 63X/1.4 NA Plan-Apochromat oil-immersion objective and solid-state 488 and 561 nm lasers for excitation. Z-stacks were obtained of the entire astrocyte at 0.2 µm sections. For images that would be quantitatively compared directly to each other, the same acquisition parameters were used across treatment conditions. Images in (, S1, and S6) were acquired on a Leica DMi8 inverted widefield microscope with a Hamamatsu Orca Flash 4.0 V2+ sCMOS camera, with DAPI, GFP, and Texas Red filter cubes, and Leica software. () used a 40X/1.30 NA Plan-Apochromat oil-immersion PH3 objective. Fig. S1 and S6 used a 20X/0.80 NA Plan-Apochromat dry PH2 objective and Z-stacks were obtained that spanned the entire depth of the field of glia or neurons at 0.4 µm sections.
Live-cell labeling of glia with Draq7
Following the starvation treatment described above, glia were incubated in 3 µM Draq7 and 0.5 µg/ml Hoechst dyes in either live-cell imaging media (Hibernate E [Brain Bits, HE-Lf] supplemented with 2% B-27 and 2 mM GlutaMAX) for the fed samples, or the indicated salt solution for the starved samples, for 10 min at 37°C in a 5% CO2 incubator. Glia were imaged on the spinning disk confocal microscope using a 40X/1.30 Plan-Apochromat oil-immersion objective and 405 and 640 nm solid state lasers with the temperature maintained at 37°C with an environmental chamber. Z-stacks were generated that spanned the entire depth of the field of glia at 0.5 µm sections. As a positive control for each condition, 0.1% Triton X-100 was added to the samples and the samples were incubated for 5 min at 37°C in the environmental chamber before acquiring Z-stacks. Cytotoxicity was measured as the percentage of Hoechst-positive cells that were co-positive for Draq7.
Live-cell imaging of neurons
For the starvation of neurons, neurons were washed once in either maintenance media or EBSS, and then incubated in each solution supplemented with 100 nM bafilomycin A1, or DMSO as a solvent control, for 4, 6, or 8 h at 37°C in a 5% CO2 incubator. For live-cell imaging, fed samples were imaged in Hibernate E supplemented with 2% B-27 and 2 mM GlutaMAX, and either 100 nM bafilomycin A1 or DMSO. Starved samples were imaged in fresh EBSS solution with either 100 nM bafilomycin A1 or DMSO. Neurons were imaged using a Chamlide CMB magnetic imaging chamber (BioVision Technologies) for a maximum of 30 min on the spinning disk confocal microscope in an environmental chamber at 37°C. Z-stacks spanning the entire depth of the soma were acquired at 0.2 µm sections using a 40X/1.30 NA objective and 488 nm laser for excitation.
Immunoblotting
Following torin1 or starvation treatments, cells were washed in PBS (150 mm NaCl, 50 mm NaPO4, pH 7.4) and lysed in RIPA buffer (150 mM NaCl, 1% Triton X-100, 0.5% deoxycholate [Thermo Fisher Scientific, BP349-100], 0.1% SDS [Thermo Fisher Scientific/Invitrogen, 15-553-027], 1X complete protease inhibitor mixture [Sigma, 11697498001], 50 mM Tris-HCl, pH 7.4) for 30 min on ice. For samples measuring p-RPS6/S6 or p-ULK1 levels, Halt Protease and Phosphatase inhibitor mixture (Thermo Fisher Scientific, 78442) along with 5 mM EDTA were substituted for the Roche complete protease inhibitor mixture. Following lysis, samples were centrifuged at 17,000 x g for 15 min at 4°C. Supernatants were analyzed by SDS-PAGE and transferred onto an Immobilon-P PVDF membrane. Membranes were blocked in 5% milk in TBS-Igepal (2.7 mM KCl, 137 mM NaCl, 0.05% Igepal [Sigma, I3021], 24.8 mM Tris-HCl, pH 7.4) for 30 min at room temperature, followed by incubation in primary antibody diluted in block solution for overnight at 4°C, rocking. The following day, membranes were washed 3 times for 20 min each in HRP wash buffer (150 mm NaCl, 0.1% BSA, 0.05% Igepal, 50 mm Tris-HCl, pH 8.0) and incubated in peroxidase-conjugated secondary antibody diluted in HRP wash buffer for 45 min at room temperature, rocking. Following incubation in secondary antibody, membranes were washed 3 times for 20 min each in HRP wash buffer and developed using the SuperSignal West Pico Chemiluminescent Substrate (Thermo Fisher Scientific, PI34580).
Image analysis
GFP-LC3 and SQSTM1 area
Maximum projections of Z-stacks were generated in Fiji, and the entire astrocyte or neuron soma was outlined and measured for total area. Using Ilastik, GFP-LC3-positive and SQSTM1-positive puncta were identified and segmented. Ilastik segmentations were imported into FIJI and the area of identified objects was measured using the “analyze particles” function. Total area occupied by GFP-LC3-positive and SQSTM1-positive puncta per cell or soma was normalized to the corresponding cell or soma area.
Colocalization between SQSTM1 puncta and GFP-LC3 puncta
Using the binary segmentations of GFP-LC3 and SQSTM1 puncta for each cell, the GFP-LC3 image was subtracted from the SQSTM1 image. The remaining area which represents SQSTM1-positive puncta that do not overlap with GFP-LC3-positive puncta was measured in FIJI using “analyzed particles”. This area was subtracted from the original total area of SQSTM1 puncta to express the percent area of SQSTM1-positive puncta that overlaps with GFP-LC3-positive puncta. To determine the percent area of GFP-LC3-positive puncta that overlaps with SQSTM1-positive puncta, the SQSTM1 image was subtracted from the GFP-LC3 image and processed as above.
Quantification of western blotting
Bands were quantified using the gel analyzer tool in Fiji. To control for sample loading differences between lanes, values for LC3-II, SQSTM1, p-ULK1, or ULK1 were divided by values for GAPDH or TUBA1A/α-tubulin loading controls from each corresponding lane. Values were then normalized relative to the control sample (glial media or maintenance media + DMSO) and expressed as a fold difference above the control.
Statistical analysis and figure preparation
All image measurements were obtained from the raw data. GraphPad Prism was used to plot graphs and perform statistical analyses; statistical tests are denoted within each figure legend (ns, not significant; *p ≤ 0.05; **p ≤ 0.01; ***p ≤ 0.001; ****p ≤ 0.0001). For presentation of images, maximum and minimum gray values were adjusted linearly in FIJI and images were assembled in Adobe Illustrator.
Supplemental Material
Download Zip (24.3 MB)Acknowledgments
This work was supported by NIH grant NS082619, the McCabe Fund Fellow Award, the University of Pennsylvania Alzheimer’s Disease Core Center, the Intellectual and Developmental Disabilities Research Center at the Children’s Hospital of Philadelphia and the University of Pennsylvania, and the Philadelphia Foundation to SM. We thank Judith Grinspan for reagents and protocols for immunolabeling oligodendrocytes. We also thank members of the Maday lab for advice with experiments and preparation of the manuscript.
Disclosure statement
No potential conflict of interest was reported by the authors.
Supplementary material
Supplemental data for this article can be accessed here.
Additional information
Funding
References
- Yin Z, Pascual C, Klionsky DJ. Autophagy: machinery and regulation. Microb Cell. 2016;3:588–596.
- Dikic I, Elazar Z. Mechanism and medical implications of mammalian autophagy. Nat Rev Mol Cell Biol. 2018;19:349–364.
- Schneider JL, Cuervo AM. Autophagy and human disease: emerging themes. Curr Opin Genet Dev. 2014;26:16–23.
- Yamamoto A, Yue Z. Autophagy and its normal and pathogenic states in the brain. Annu Rev Neurosci. 2014;37:55–78.
- Maday S. Mechanisms of neuronal homeostasis: autophagy in the axon. Brain Res. 2016;1649:143–150.
- Jiang P, Mizushima N. Autophagy and human diseases. Cell Res. 2014;24:69–79.
- Kulkarni VV, Maday S. Compartment-specific dynamics and functions of autophagy in neurons. Dev Neurobiol. 2018;78:298–310.
- Kulkarni A, Chen J, Maday S. Neuronal autophagy and intercellular regulation of homeostasis in the brain. Curr Opin Neurobiol. 2018;51:29–36.
- Ariosa AR, Klionsky DJ. Autophagy core machinery: overcoming spatial barriers in neurons. J Mol Med (Berl). 2016;94:1217–1227.
- Fuger P, Hefendehl JK, Veeraraghavalu K, et al. Microglia turnover with aging and in an Alzheimer’s model via long-term in vivo single-cell imaging. Nat Neurosci. 2017;20:1371–1376.
- Harris JJ, Attwell D. The energetics of CNS white matter. J Neurosci. 2012;32:356–371.
- Cajigas IJ, Will T, Schuman EM. Protein homeostasis and synaptic plasticity. Embo J. 2010;29:2746–2752.
- Vijayan V, Verstreken P. Autophagy in the presynaptic compartment in health and disease. J Cell Biol. 2017;216:1895–1906.
- Stavoe AK, Hill SE, Hall DH, et al. KIF1A/UNC-104 transports ATG-9 to regulate neurodevelopment and autophagy at synapses. Dev Cell. 2016;38:171–185.
- Dragich JM, Kuwajima T, Hirose-Ikeda M, et al. Autophagy linked FYVE (Alfy/WDFY3) is required for establishing neuronal connectivity in the mammalian brain. ELife. 2016;5: e14810.
- Shen W, Ganetzky B. Autophagy promotes synapse development in Drosophila. J Cell Biol. 2009;187:71–79.
- Tang G, Gudsnuk K, Kuo SH, et al. Loss of mTOR-dependent macroautophagy causes autistic-like synaptic pruning deficits. Neuron. 2014;83:1131–1143.
- Wang S, Li B, Qiao H, et al. Autophagy-related gene Atg5 is essential for astrocyte differentiation in the developing mouse cortex. EMBO Rep. 2014;15:1053–1061.
- Kim HJ, Cho MH, Shim WH, et al. Deficient autophagy in microglia impairs synaptic pruning and causes social behavioral defects. Mol Psychiatry. 2017;22:1576–1584.
- Komatsu M, Waguri S, Chiba T, et al. Loss of autophagy in the central nervous system causes neurodegeneration in mice. Nature. 2006;441:880–884.
- Hara T, Nakamura K, Matsui M, et al. Suppression of basal autophagy in neural cells causes neurodegenerative disease in mice. Nature. 2006;441:885–889.
- Komatsu M, Wang QJ, Holstein GR, et al. Essential role for autophagy protein Atg7 in the maintenance of axonal homeostasis and the prevention of axonal degeneration. Proc Natl Acad Sci U S A. 2007;104:14489–14494.
- Nishiyama J, Miura E, Mizushima N, et al. Aberrant membranes and double-membrane structures accumulate in the axons of Atg5-null Purkinje cells before neuronal death. Autophagy. 2007;3:591–596.
- Rudnick ND, Griffey CJ, Guarnieri P, et al. Distinct roles for motor neuron autophagy early and late in the SOD1G93A mouse model of ALS. Proc Natl Acad Sci U S A. 2017;114:E8294–E303.
- Hernandez D, Torres CA, Setlik W, et al. Regulation of presynaptic neurotransmission by macroautophagy. Neuron. 2012;74:277–284.
- Glatigny M, Moriceau S, Rivagorda M, et al. Autophagy is required for memory formation and reverses age-related memory decline. Curr Biol. 2019;29:435–48 e8.
- Gomez-Sanchez JA, Carty L, Iruarrizaga-Lejarreta M, et al. Schwann cell autophagy, myelinophagy, initiates myelin clearance from injured nerves. J Cell Biol. 2015;210:153–168.
- Jang SY, Shin YK, Park SY, et al. Autophagic myelin destruction by schwann cells during wallerian degeneration and segmental demyelination. Glia. 2016;64:730–742.
- Ries M, Sastre M. Mechanisms of abeta clearance and degradation by glial cells. Front Aging Neurosci. 2016;8:160.
- Lucin KM, O’Brien CE, Bieri G, et al. Microglial beclin 1 regulates retromer trafficking and phagocytosis and is impaired in Alzheimer’s disease. Neuron. 2013;79:873–886.
- Cho MH, Cho K, Kang HJ, et al. Autophagy in microglia degrades extracellular beta-amyloid fibrils and regulates the NLRP3 inflammasome. Autophagy. 2014;10:1761–1775.
- Maday S, Wallace KE, Holzbaur EL. Autophagosomes initiate distally and mature during transport toward the cell soma in primary neurons. J Cell Biol. 2012;196:407–417.
- Maday S, Holzbaur EL. Autophagosome biogenesis in primary neurons follows an ordered and spatially regulated pathway. Dev Cell. 2014;30:71–85.
- Maday S, Holzbaur EL. Compartment-specific regulation of autophagy in primary neurons. J Neurosci. 2016;36:5933–5945.
- Mizushima N, Yamamoto A, Matsui M, et al. In vivo analysis of autophagy in response to nutrient starvation using transgenic mice expressing a fluorescent autophagosome marker. Mol Biol Cell. 2004;15:1101–1111.
- Kabeya Y, Mizushima N, Ueno T, et al. LC3, a mammalian homologue of yeast Apg8p, is localized in autophagosome membranes after processing. Embo J. 2000;19:5720–5728.
- Sofroniew MV, Vinters HV. Astrocytes: biology and pathology. Acta Neuropathol. 2010;119:7–35.
- Thoreen CC, Kang SA, Chang JW, et al. An ATP-competitive mammalian target of rapamycin inhibitor reveals rapamycin-resistant functions of mTORC1. J Biol Chem. 2009;284:8023–8032.
- Pankiv S, Clausen TH, Lamark T, et al. p62/SQSTM1 binds directly to Atg8/LC3 to facilitate degradation of ubiquitinated protein aggregates by autophagy. J Biol Chem. 2007;282:24131–24145.
- Laplante M, Sabatini DM. mTOR signaling at a glance. J Cell Sci. 2009;122:3589–3594.
- Saxton RA, Sabatini DM. mTOR signaling in growth, metabolism, and disease. Cell. 2017;168:960–976.
- Kochl R, Hu XW, Chan EY, et al. Microtubules facilitate autophagosome formation and fusion of autophagosomes with endosomes. Traffic. 2006;7:129–145.
- Sahani MH, Itakura E, Mizushima N. Expression of the autophagy substrate SQSTM1/p62 is restored during prolonged starvation depending on transcriptional upregulation and autophagy-derived amino acids. Autophagy. 2014;10:431–441.
- Yu L, Chen Y, Tooze SA. Autophagy pathway: cellular and molecular mechanisms. Autophagy. 2018;14:207–215.
- Kim J, Kundu M, Viollet B, et al. AMPK and mTOR regulate autophagy through direct phosphorylation of Ulk1. Nat Cell Biol. 2011;13:132–141.
- Hare WA, Owen WG. Effects of bicarbonate versus HEPES buffering on measured properties of neurons in the salamander retina. Vis Neurosci. 1998;15:263–271.
- Walton ZE, Patel CH, Brooks RC, et al. Acid suspends the circadian clock in hypoxia through inhibition of mTOR. Cell. 2018;174:72–87 e32.
- Xu T, Su H, Ganapathy S, et al. Modulation of autophagic activity by extracellular pH. Autophagy. 2011;7:1316–1322.
- Mejlvang J, Olsvik H, Svenning S, et al. Starvation induces rapid degradation of selective autophagy receptors by endosomal microautophagy. J Cell Biol. 2018;217:3640–3655.
- Zheng X, Boyer L, Jin M, et al. Metabolic reprogramming during neuronal differentiation from aerobic glycolysis to neuronal oxidative phosphorylation. ELife. 2016;5: e13374.
- Saab AS, Tzvetanova ID, Nave KA. The role of myelin and oligodendrocytes in axonal energy metabolism. Curr Opin Neurobiol. 2013;23:1065–1072.
- Belanger M, Allaman I, Magistretti PJ. Brain energy metabolism: focus on astrocyte-neuron metabolic cooperation. Cell Metab. 2011;14:724–738.
- Lee Y, Morrison BM, Li Y, et al. Oligodendroglia metabolically support axons and contribute to neurodegeneration. Nature. 2012;487:443–448.
- Dorrbaum AR, Kochen L, Langer JD, et al. Local and global influences on protein turnover in neurons and glia. ELife. 2018;7:e34202.
- Nikoletopoulou V, Sidiropoulou K, Kallergi E, et al. Modulation of autophagy by BDNF underlies synaptic plasticity. Cell Metab. 2017;26:230–42 e5.
- Pamenter ME, Perkins GA, McGinness AK, et al. Autophagy and apoptosis are differentially induced in neurons and astrocytes treated with an in vitro mimic of the ischemic penumbra. PLoS One. 2012;7:e51469.
- Pla A, Pascual M, Guerri C. Autophagy constitutes a protective mechanism against ethanol toxicity in mouse astrocytes and neurons. PLoS One. 2016;11:e0153097.
- Bordi M, Berg MJ, Mohan PS, et al. Autophagy flux in CA1 neurons of Alzheimer hippocampus: increased induction overburdens failing lysosomes to propel neuritic dystrophy. Autophagy. 2016;12:2467–2483.
- Ferguson CJ, Lenk GM, Meisler MH. Defective autophagy in neurons and astrocytes from mice deficient in PI(3,5)P2. Hum Mol Genet. 2009;18:4868–4878.
- Moruno-Manchon JF, Uzor NE, Ambati CR, et al. Sphingosine kinase 1-associated autophagy differs between neurons and astrocytes. Cell Death Dis. 2018;9:521.
- Tydlacka S, Wang CE, Wang X, et al. Differential activities of the ubiquitin-proteasome system in neurons versus glia may account for the preferential accumulation of misfolded proteins in neurons. J Neurosci. 2008;28:13285–13295.
- Davis CH, Kim KY, Bushong EA, et al. Transcellular degradation of axonal mitochondria. Proc Natl Acad Sci U S A. 2014;111:9633–9638.
- Spiller KJ, Restrepo CR, Khan T, et al. Microglia-mediated recovery from ALS-relevant motor neuron degeneration in a mouse model of TDP-43 proteinopathy. Nat Neurosci. 2018;21:329–340.
- Barmada SJ, Serio A, Arjun A, et al. Autophagy induction enhances TDP43 turnover and survival in neuronal ALS models. Nat Chem Biol. 2014;10:677–685.
- Dong A, Kulkarni VV, Maday S. Methods for imaging autophagosome dynamics in primary neurons. Methods Mol Biol. 2019;1880:243–256.