
ABSTRACT
Dysregulation of macroautophagy/autophagy is implicated in obesity and insulin resistance. However, it remains poorly defined how autophagy regulates adipocyte development. Using adipose-specific rptor/raptor knockout (KO), atg7 KO and atg7 rptor double-KO mice, we show that inhibiting MTORC1 by RPTOR deficiency led to autophagic sequestration of lipid droplets, formation of LD-containing lysosomes, and elevation of basal and isoproterenol-induced lipolysis in vivo and in primary adipocytes. Despite normal differentiation at an early phase, progressive degradation and shrinkage of cellular LDs and downregulation of adipogenic markers PPARG and PLIN1 occurred in terminal differentiation of rptor KO adipocytes, which was rescued by inhibiting lipolysis or lysosome. In contrast, inactivating autophagy by depletion of ATG7 protected adipocytes against RPTOR deficiency-induced formation of LD-containing lysosomes, LD degradation, and downregulation of adipogenic markers in vitro. Ultimately, atg7 rptor double-KO mice displayed decreased lipolysis, restored adipose tissue development, and upregulated thermogenic gene expression in brown and inguinal adipose tissue compared to RPTOR-deficient mice in vivo. Collectively, our study demonstrates that autophagy plays an important role in regulating adipocyte maturation via a lipophagy and lipolysis-dependent mechanism.
Abbreviations
ATG7: autophagy related 7; BAT: brown adipose tissue; CEBPB/C/EBPβ: CCAAT enhancer binding protein beta; DGAT1: diacylglycerol O-acyltransferase 1; eWAT: epididymal white adipose tissue; iWAT: inguinal white adipose tissue; KO: knockout; LD: lipid droplet; MAP1LC3/LC3: microtubule-associated protein 1 light chain 3; MTOR: mechanistic target of rapamycin kinase; MTORC1: mechanistic target of rapamycin kinase complex 1; PLIN1: perepilin 1; PNPLA2/ATGL: patatin-like phospholipase domain containing 2; PPARG/PPARγ: peroxisome proliferator activated receptor gamma; RPTOR: regulatory associated protein of MTOR complex1; TG: triglyceride; ULK1: unc-51 like kinase 1; UCP1: uncoupling protein 1; WAT: white adipose tissue
Introduction
Adipose tissue is a fuel reservoir that conserves body heat and stores energy in the form of triglycerides (TGs) [Citation1,Citation2]. It plays a pivotal role in buffering fluxes of free fatty acids and regulating clearance of plasma TGs, preventing them from being deposited in other tissues [Citation3]. Therefore, the capacity of lipid storage in adipose tissue is a determinant of lipid infiltration into other tissues such as liver and muscle, and its dysfunction can contribute to systemic insulin resistance. White adipocytes, a principal cell type for energy storage, have a large unilocular lipid droplet (LD) [Citation4], yet the mechanisms underlying LD turnover, as well as adipogenesis regulation, remain incompletely understood.
Macroautophay/autophagy, a catabolic process induced by nutrient deprivation, eliminates and recycles damaged cytosolic organelles through degradation. Cytosolic organelles are sequestered inside double-membrane vesicles termed autophagosomes, which fuse with lysosomes to degrade their contents [Citation5]. One form of autophagy termed ‘lipophagy’, in which double-membrane autophagy vesicles engulf portions of cytoplasmic LDs, has been shown to drive the lysosomal degradation of LD-stored TGs in hepatocytes and the liver [Citation6,Citation7]. In addition, autophagy has been found to regulate both cytoplasmic, neutral lipolysis and lysosomal, acidic lipolysis in hepatocytes [Citation8]. On the other hand, autophagy promotes lipid biogenesis and reduces lipotoxicity through the endoplasmic reticulum-resident DGAT1 (diacylglycerol O-acyltransferase) enzyme during prolonged periods of nutrient deprivation in hepatocytes [Citation9]. Although the accumulated evidence demonstrates the involvement of autophagy in lipid metabolism in hepatocytes, the role of autophagy in LD expansion and turnover in adipocytes remains largely unknown. Autophagy has been shown to facilitate lipolysis through the interaction of the autophagic component MAP1LC3/LC3 (microtubule-associated protein 1 light chain 3) with PNPLA2 (patatin-like phospholipase domain containing 2) on the surface of LDs in brown adipocytes in response to cold stress [Citation10]. Autophagy ablation, contrastingly, suppresses white adipocyte differentiation and induces a metabolically favorable phenotype with massive accumulation of mitochondria in adipocytes [Citation5,Citation11,Citation12]. Despite this knowledge, it is not understood how autophagy is involved in the development of obesity, although it has been shown that obesity upregulates autophagy in adipose tissue [Citation13,Citation14] and that disruption of adipocyte autophagy is linked to excess lipids and low-grade chronic inflammation [Citation15]. Therefore, more studies are needed to clarify how autophagy modulates adipocyte maturation and lipid droplet dynamics in the context of obesity development.
MTOR (mechanistic target of rapamycin kinase) is a master regulator of autophagy and serves as an intracellular energy sensor that integrates distinct signals such as hormones, nutrients, and stress. MTOR exists in two distinct complexes, MTORC1 (MTOR complex 1) and MTOR complex 2 (MTORC2), which differ in subunit compositions and biological function [Citation16]. MTORC1 plays an important role in regulating multiple cellular processes including protein translation, lipid metabolism, cell growth and survival [Citation17]. RPTOR (regulatory associated protein of MTOR complex 1) is a regulatory protein subunit of the MTOR complex 1 that binds to and mediates MTORC1 action [Citation18]. Loss of RPTOR eliminates MTORC1 activity irrespective of feeding status [Citation19]. Inhibition of MTORC1 activates autophagy by phosphorylation of ULK1 (unc-51 kinase like 1) at Ser757 [Citation20]. Interestingly, both MTORC1 and autophagy pathways promote adipogenesis in vivo and in vitro [Citation5,Citation12,Citation21], implying that these two pathways may be uncoupled at certain stages during adipose tissue development. In addition, both MTORC1 and autophagy are implicated in obesity and insulin resistance [Citation7,Citation13,Citation14,Citation22,Citation23]. However, whether MTORC1 and autophagy cooperate to control adipocyte development remains unclear.
Our present study showed that RPTOR deficiency induced autophagic sequestration of LDs and increased basal and adrenoceptor-induced lipolysis, leading to impaired fat development in vivo. In addition, despite no significant effect on adipocyte differentiation at an early stage, RPTOR deficient adipocytes displayed increased degradation of LDs in the terminal differentiation, an effect that was rescued by inhibition of lipolysis or lysosomes. Inhibition of autophagy partially reversed the increased lipolysis, LD shrinkage and fat loss in rptor KO adipocytes and rptor KO adipose tissue. Our study reveals that MTORC1 signaling promotes adipocyte development through inhibition of lipophagy and suppression of lipolysis.
Results
RPTOR deficiency promoted autophagic sequestration of lipid droplets in adipocytes in vivo and in vitro
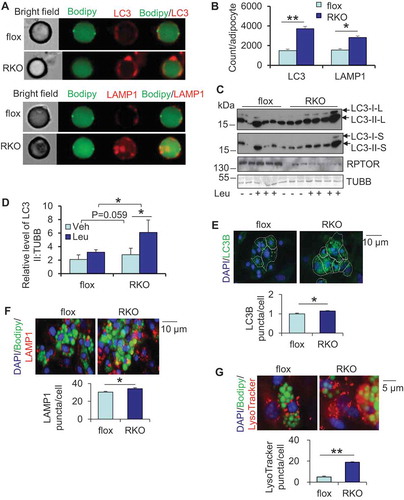
Although autophagy is downstream of MTORC1 signaling, it remains unclear whether MTORC1 and autophagy cooperate in regulating adipogenesis. To address this question, using Amnis Imaging Flow Cytometer, we analyzed the localization of the autophagy marker LC3 and lysosome marker LAMP1 (lysosomal-associated membrane protein 1) in primary adipocytes of adipose-specific rptor (KO) mice, a mouse model in which MTORC1 is inhibited in adipose tissue as we described previously [Citation24]. We found that RPTOR deficient mice displayed a significant increase in the staining of LC3 and LAMP1 and co-localization of LC3 and LAMP1 with LDs in isolated primary adipocytes from white adipose tissue (WAT), demonstrating lysosome expansion and autophagosome sequestration of LDs in MTORC1-inhibited adipocytes (,). We also analyzed autophagic flux by administering a lysosomal degradation inhibitor, leupeptin, in adipose-specific rptor KO and control mice. RPTOR deficiency enhanced autophagic flux in isolated primary adipocytes in WAT (,), suggesting that MTORC1 inhibition induced lipophagy in adipocytes. Moreover, RPTOR depletion suppressed phosphorylation of RPS6KB1 (ribosomal protein S6 kinase, polypeptide 1) and enhanced basal levels of LC3-II in WAT despite the downregulation of total LC3 in leupeptin-treated KO WAT (Figure S1A,B). In support of this, isolated LDs of rptor KO adipocytes in WAT also displayed increased LC3-II flux compared to control cells (,). Consistent with the in vivo data, RPTOR deficiency or rapamycin treatment significantly elevated LC3B puncta in primary differentiated adipocytes and preadipocytes respectively ( and S1C). In addition, differentiated rptor KO adipocytes showed an increase in staining of LAMP1 () and LysoTracker (). Taken together, the results suggest that RPTOR deficiency leads to activation of autophagy and lipophagy in adipocytes.
Figure 1. Inhibiting MTORC1 promotes autophagosome sequestration of LDs in adipocytes in vivo and in vitro. (A) Staining of LC3 and LAMP1 and colocalization of LC3 and LAMP1 with LDs was significantly increased in isolated RPTOR-deficient primary adipocytes. Adipocytes were isolated from WAT, stained and analyzed using Amnis Imaging Flow Cytometer. RKO, rptor KO. (B) The levels of LC3 and LAMP1 in isolated adipocytes in Figure 1A were quantified. (C) RPTOR deficiency induced LC3 flux in isolated primary adipocytes of WAT. The mice were administered with leupeptin (40 mg/kg body weight) by IP injection for 2 h, and tissue samples were collected for western blot. Leu, leupeptin; LC3-I/II-L, LC3-I/II with long exposure; LC3-I/II-S, LC3-I/II with short exposure. (D) The levels of LC3-II in Figure 1C were quantified. (E) RPTOR deficiency significantly elevated LC3B puncta in primary differentiated adipocytes. After differentiation, adipocytes were cultured in the fresh regular medium for 24 h. Veh, vehicle. Staining of LAMP1 (F) and LysoTracker (G) was upregulated by RPTOR deficiency in primary adipocytes. After differentiation, adipocytes were cultured in the fresh regular medium for 24 h. LC3B, LAMP1 puncta and LysoTracker Red puncta (target objects) were computer-identified after staining, and 2,000 primary objects were counted per well. The data in Figure 1B,D–G are presented as the mean ± S.E.M. *p < 0.05, **p < 0.01.
RPTOR deficiency led to the degradation of cellular LDs in adipocyte terminal differentiation, which was rescued by inhibition of lysosomes
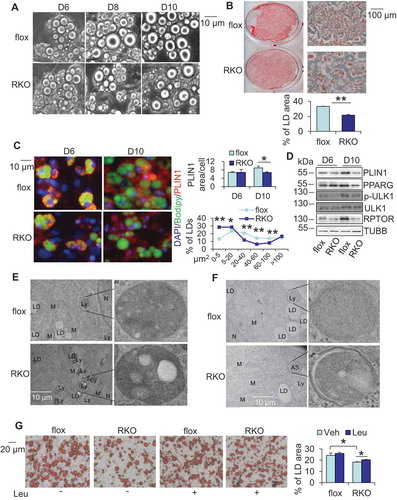
To dissect the role of MTORC1 inhibition-induced autophagy in adipocyte differentiation, we performed primary culture and differentiation of rptor KO and control adipocytes. We did not observe significant differences between rptor KO and control cells in adipocyte differentiation from day 1 to day 6 (). However, rptor KO adipocytes appeared to display a gradual degradation and shrinkage of LDs on day 8 and day 10 (). Accordingly, PLIN1 (perilipin 1) staining and Oil red O staining were significantly decreased on day 10 of differentiation in rptor KO adipocytes compared to control cells. We also quantified the area of individual LDs in adipocytes using the high content imaging and found that the percentage of mid-size but not large LD was decreased accompanied with an increase of small LDs in rptor KO adipocytes compared with control cells (,). Moreover, the expression levels of adipogenic markers, such as PPARG/PPARγ (peroxisome proliferator activated receptor gamma) and PLIN1, were dramatically downregulated on day 10 of differentiation but not on day 6, suggesting that MTORC1 plays an important role in adipocyte maturation as well as adipogenesis (). Despite no significant difference in phosphorylation of TFEB (transcription factor EB) at Ser142 and expression of TFEB and FASN (fatty acid synthase); phosphorylation of ULK1 at Ser757 and ACACA (acetyl-Coenzyme A carboxylase alpha) at Ser79 was decreased in rptor KO adipocytes compared to control cells on day 6 ( and S1D), implying that autophagy activation occurred before lipid droplet degradation in rptor KO cells. Consistent with this, electron microscopy analysis showed that LD-enriched lysosome structures, as well as autophagosomes, were readily detected in rptor KO adipocytes (, and S1E). The number of mitochondria was not significantly affected by RPTOR deficiency (Figure S1F). Treatment with the lysosome degradation inhibitor leupeptin suppressed degradation of LDs in differentiated rptor KO adipocytes on day 10 (), suggesting that the autophagosome mediates MTORC1 inhibition-induced degradation of LDs in adipocytes.
Figure 2. Inhibiting MTORC1 lead to the degradation of LDs, which was rescued by inhibiting lysosome function. The stromal vascular fraction was isolated from white adipose tissue, cultured and differentiated into adipocytes. After differentiation, adipocytes were cultured in the regular medium that was changed every two days for up to 6 days for the following studies. (A) The number of large LDs decreased 8 days post differentiation. D6, day 6; D8, day 8; D10, day 10. (B) Oil red O staining on day 10 of differentiated rptor KO and control adipocytes. 5 representative bright-field images were taken for each well under microscope and the results from 3 individual experiments were used for quantification with Image J software. (C) Fluorescence staining of Bodipy and PLIN1 of day 6 and day 10 differentiated rptor KO and control adipocytes. The area of LDs was analyzed by Cellomic Image System. (D) Expression of P-ULK1757, ULK1 and adipogenic markers PLIN1, PPARG on day 6 and day 10 differentiated rptor KO and control adipocytes. Representative electron microscopy images for lysosomes (E) and autophagosomes (F) on day 6 differentiated rptor KO and control adipocytes. LD, Lipid droplet; Ly, lysosome; M, mitochondria; N, nucleus; AS, autophagosome. (G) Inhibiting lysosomes rescued RPTOR deficiency-suppressed LD maturation during primary adipogenesis. Day 6 differentiated rptor KO and control adipocytes were treated by 10 µM leupeptin for 4 days. The data in Figure 2B–G are presented as the mean ± S.E.M. *p < 0.05, **p < 0.01.
RPTOR deficiency increased LD degradation through lipolysis in adipocytes
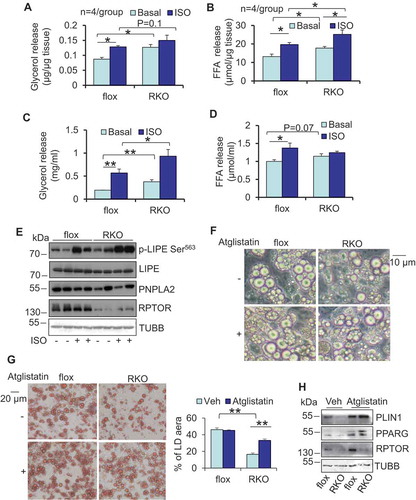
Given the role of autophagy in regulating lipolysis in hepatocytes [Citation5,Citation6,Citation25], we examined lipolysis in rptor KO adipose tissue and adipocytes. The data from lipolytic assays show that RPTOR deficiency leads to a significant increase in basal secretion of glycerol and free fatty acids, as well as an increase in isoproterenol-induced lipolysis in WAT (,). In support of this, basal glycerol in circulation was also increased in rptor KO mice compared to control mice when normalized by fat mass, and the inducing effect of isoproterenol administration on glycerol circulation was eliminated by RPTOR deficiency in vivo (Figure S1G,H). We also performed a lipolytic assay in primary adipocytes. An increase in both basal and isoproterenol-induced lipolysis was observed on day 6 of differentiated rptor KO adipocytes compared to the control cells (,). Furthermore, phosphorylation levels of LIPE (lipase E, hormone sensitive type) hormone sensitive lipase at Ser563 under basal and isoproterenol-treatment were enhanced by RPTOR deficiency in adipocytes (). However, rptor KO had no significant effect on the protein levels of PNPLA2 and LIPE as well as mRNA levels of monoglyceride lipase (Mgll) and Abhd5/Cgi-58 (abhydrolase domain containing 5) in primary adipocytes ( and S1I). To address whether increased lipolysis is involved in LD degradation in rptor KO adipocytes, we treated cells with or without 5 µM atglistatin, a lipolysis inhibitor, on day 6 after adipocyte differentiation for 4 days. Down-regulation of adipogenic markers, such as PPARG and PLIN1, was rescued by inhibition of lipolysis in rptor KO adipocytes on day 10 (–), indicating that increased lipolysis mediates MTORC1 inhibition-induced LD degradation in adipocytes.
Figure 3. RPTOR deficiency-induced LD degradation was reversed by inhibiting lipolysis in primary adipocytes. RPTOR deficiency increased basal and isoproterenol-induced release of glycerol (A) and free fatty acids (B) from WAT. Dissected fat tissue samples were cultured in 2% FFA-free BSA media in the presence or absence of 10 μM isoproterenol for 2 h, and the media was collected for ELISA analysis. ISO, isoproterenol. RPTOR depletion enhanced basal and isoproterenol-induced release of glycerol (C) and free fatty acids (D) in primary adipocytes. Cells were washed with PBS and incubated in 2% BSA medium in the presence or absence of 10 μM isoproterenol for 2 h, and the media was collected for the ELISA analysis. (E) The basal and isoproterenol-induced phosphorylation of LIPE at Ser563 was enhanced by RPTOR deficiency in primary adipocytes. (F) Treatment with lipolysis inhibitor Atglistatin suppressed RPTOR deficiency-induced LD degradation during adipogenesis. Day 6 differentiated adipocytes were treated with or without 5 µM Atglistatin for 4 days. (G) Oil red O staining of cells with or without lipolysis inhibitor, Atglistatin, in rptor KO and control adipocytes. (H) Treatment with lipolysis inhibitor, Atglistatin, restored adipogenic markers downregulated by RPTOR deficiency during adipogenesis. Figure 3E–H were the representative data from three individual experiments. The data in Figure 3A–D,G are presented as the mean ± S.E.M. *p < 0.05, **p < 0.01.
ATG7 depletion suppressed isoproterenol-induced lipolysis and protected against rapamycin-induced degradation of LDs in primary cells
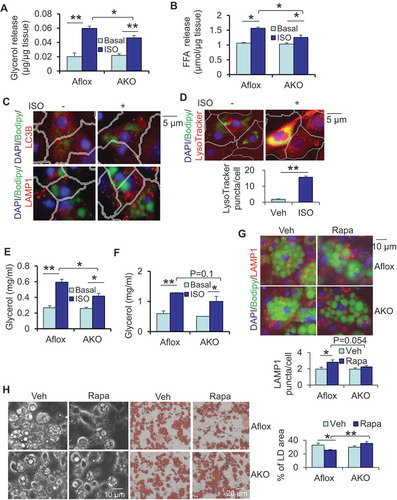
Given the effect of rptor KO on LD maturation and the fact that inhibition of MTORC1 activates autophagy, we then asked whether autophagy is implicated in lipolysis and adipocyte maturation. To address this question, we generated adipocyte-specific atg7 (autophagy related 7) KO mice using adipoq (adiponectin, C1Q and collagen domain containing) promoter-driven cre mice (Figure S2A). ATG7 deficiency had no significant effect on fat mass, lean mass and body mass, while it decreased cold-induced O2 consumption without effects on food intake and activity (Figure S2B–G). The results of ex vivo lipolysis assays showed that in contrast to rptor KO mice, atg7 KO mice displayed decreased isoproterenol-stimulated release of glycerol and free fatty acids in WAT, despite no significant changes in basal conditions (,). Consistent with this, isoproterenol treatment induced LC3, LAMP1 and LysoTracker puncta in primary differentiated adipocytes (, and S2H). The results suggest that autophagy/lysosomes might be involved in adrenergic receptor-driven lipolysis in adipocytes. Consistent with previous findings [Citation11], the number of mitochondria was increased by ATG7 depletion in adipocytes (Figure S2L). Moreover, ATG7 depletion decreased isoproterenol-stimulated secretion of glycerol circulation in vivo (). In line with this, isoproterenol-stimulated lipolysis was decreased in atg7 KO primary adipocytes or 3-methyladenine treated adipocytes compared to the control cells (, S2I,J). ATG7 deficiency had no significant effect on basal or isoproterenol-increased basal phosphorylation of LIPE in primary adipocytes (Figure S2K), suggesting that autophagy-mediated lipolysis is LIPE-independent. When the differentiated atg7 KO and control adipocytes were treated with or without 5 nM rapamycin on day 6 for 24 h, we observed that ATG7 deficiency protected against MTORC1 inhibition-driven biogenesis of lysosomes, degradation of LDs and impairment of adipocyte maturation, with little effect on the staining of the lysosome marker LAMP1 (–). The results suggest that autophagy is required for adrenoceptor-induced lipolysis and favors adipocyte development.
Figure 4. ATG7 deficiency suppressed lipolysis and protected against rapamycin-induced LD degradation in primary adipocytes. ATG7 deficiency decreased isoproterenol-induced release of glycerol (A) and free fatty acids (B) of WAT. Dissected fat tissue samples were cultured in 2% FFA-free BSA media in the presence or absence of 10 μM isoproterenol for 4 h, and the media was collected for ELISA analysis. Aflox, atg7 floxed; AKO, atg7 KO. Treatment of isoproterenol increased puncta LC3B, LAMP1 (C) and LysoTracker (D) in primary differentiated adipocytes. (E) ATG7 depletion suppressed isoproterenol-induced release of glycerol in circulation in vivo. Fasted mice were administered with an isoproterenol (10 mg/kg body weight) for 15 min. (F) Isoproterenol-induced release of glycerol was decreased in atg7 KO primary adipocytes compared to the control cells. Cells were washed with PBS and incubated in 2% BSA medium in the presence or absence of 10 μM isoproterenol for 2 h, and the media was collected for the ELISA analysis. The Bodipy and LAMP1 staining (G), Brightfield image and Oil red O staining (H) of differentiated atg7 KO and control adipocytes treated with or without rapamycin. Rapa, rapamycin. The differentiated atg7 KO and control adipocytes were treated with or without 5 nM rapamycin on day 6 for 24 h. The data in Figure 4A–H are presented as the mean ± S.E.M. *p < 0.05, **p < 0.01.
ATG7 depletion restored adipose tissue mass in rptor KO mice
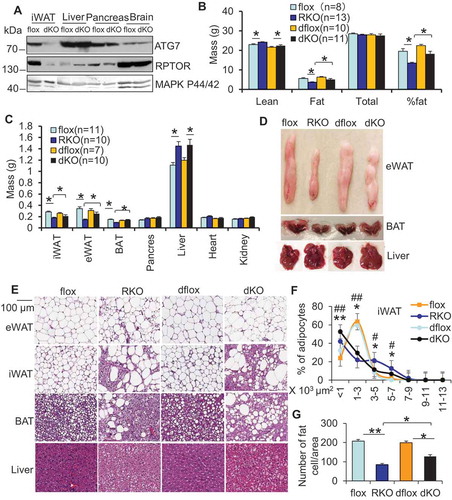
To further investigate if autophagy is involved in suppression of adipose tissue development via MTORC1 inhibition, we generated adipose-specific atg7 rptor double-KO mice by crossing adipose-specific rptor KO mice with atg7 flox mice (). Although ATG7 deficient mice had similar body mass, fat mass, lean mass, and liver mass compared with the control mice (Figures S2A–D), ATG7 deficiency partially restored fat mass and increased body mass in rptor KO mice (), suggesting that activation of autophagy mediates RPTOR deficiency-induced fat loss. Moreover, ATG7 deficiency differentially restored loss of fat mass in rptor KO mice, resulting in the increase of 55.5%, 28.3%, and 91.4% in epidydimal, inguinal, and brown fat respectively (, and S3A). RPTOR deficient mice displayed large LDs in brown adipose tissue (BAT), referred to as whitening of BAT, which was consistent with the atg7 rptor double-KO mice phenotype (,), suggesting that MTORC1 signaling and the autophagy pathway are coordinated in regulating BAT development. In addition, RPTOR deficiency-induced supersized adipocytes in inguinal WAT (iWAT) were minimally affected by autophagy inhibition (,), while the number of fat cells was partially rescued by autophagy deficiency in rptor KO iWAT (). These results suggest that activation of autophagy contributes to RPTOR deficiency-driven fat loss, while autophagy is dispensable for polarization of adipocytes induced by MTORC1 inhibition.
Figure 5. ATG7 depletion improved adipocyte development in rptor KO mice. 10-week old male mice were used for the following studies (A) The expression levels of ATG7 and RPTOR were dramatically suppressed in atg7 rptor double-KO (dKO) adipose tissue, while they were minimally affected in other types of tissue. (B) ATG7 deficiency partially restored fat mass, while having no significant effect on lean mass in rptor KO mice. Lean mass, fat mass, total mass and fat percentage were determined by DEXA scanning. dflox: atg7 rptor double-flox; dKO: atg7 rptor double-KO. (C) ATG7 deficiency differentially restored loss of mass in epidydimal WAT, inguinal WAT, and BAT without significant effect on liver, heart, pancreas and kidney in rptor KO mice. The mass of organs or fat pads were weighed after mice were euthanized. (D) The representative image of eWAT, BAT and liver in rptor flox, rptor KO, atg7 rptor double-flox and atg7 rptor double-KO mice. (E) H&E staining of iWAT, eWAT, BAT, and liver in rptor flox, rptor KO, atg7 rptor double-flox and atg7 rptor double-KO mice. Quantification of adipocyte size (F) and adipocyte number/area (G) in iWAT of rptor KO, atg7 rptor double-KO and control mice from Figure 5E. Five sections per animal were stained. Eight representative images per section were used to determine adipocyte size, and at least three 20× fields of three mice per genotype were used for quantification of adipocyte number. Size of adipocytes were determined with ImageJ Analysis of H&E stained tissues. Figure 5A,D,E were the representative data from three individual experiments. The data in Figure 5B,C,F,G are presented as the mean ± S.E.M. * p < 0.05. For Figure 5F, *p < 0.05, **p < 0.01, flox vs RKO; # p < 0.05, ##p < 0.01, dflox vs dKO.
ATG7 depletion decreased lipolysis and rescued adipocyte maturation in rptor KO mice
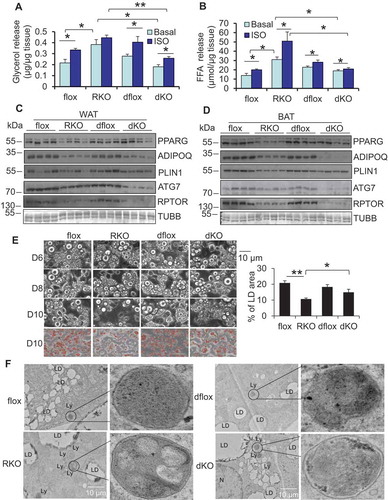
Because MTORC1 signaling is known to inhibit autophagy, we then asked if inhibiting autophagy eliminates the rptor KO-induced increase of lipolysis and LD degradation. Lipolysis assays showed that basal and isoproterenol-induced release of glycerol and free fatty acids were suppressed by ATG7 depletion in rptor KO WAT compared to control samples (,). Autophagy deficiency also improved the basal and isoproterenol-induced release of glycerol in rptor KO adipocytes (Figure S3B). Consistent with this, there was improvement of adipose tissue development in atg7 rptor double-KO mice compared to rptor single KO mice (). RPTOR deficiency-induced downregulation of adipogenesis markers PPARG and PLIN1 was partially reversed by autophagy inactivation in WAT and BAT (,). This restoring effect of autophagy inactivation on the expression of PPARG and PLIN1, as well as fat mass, was greater in BAT than that in WAT ( and ). Consistently, we found that ATG7 deficiency partially restored degradation of LDs and Oil red O staining on day 10 of differentiation in rptor KO adipocytes (). However, the increase in LD-containing lysosome structures was reversed by ATG7 depletion in rptor KO adipocytes, although the total number of lysosomes was only slightly decreased by atg7 KO ( and S1E). Consistent with the previous study [Citation5,Citation11], ATG7 deficiency significantly increased the number of mitochondria in rptor KO cells (Figure S1F). These results suggest that autophagy suppresses adipocyte maturation by regulating lipophagy and subsequent lipolysis.
Figure 6. ATG7 depletion decreased lipolysis and rescued adipocyte maturation in rptor KO mice. ATG7 deficiency reversed the increase in basal and isoproterenol-induced release of glycerol (A) and free fatty acids (B) of WAT in rptor KO mice. Epididymal fat pads were collected from the fasting mice and used for ex vivo lipolysis assay. ATG7 deficiency upregulated expression levels of adipogenic markers PPARG and PLIN1 in rptor KO WAT (C) and BAT (D) despite no significant effect on ADIPOQ levels. (E) ATG7 deficiency partially restored LD degradation in rptor KO adipocytes on day 10 of differentiation. Five representative bright-field or Oil red O staining images were taken for each well under microscope and the results from 3 individual experiments were used for quantification with Image J software. (F) Representative electron microscopy images for lysosomes, on Day 6 differentiated rptor KO, atg7 rptor double-KO and control adipocytes. LD, lipid droplet; Ly, lysosome; N, nucleus; Figure 6E,F were the representative data from three individual experiments. The data in Figure 6A,B,E are presented as the mean ± S.E.M. *p < 0.05, **p < 0.01.
ATG7 depletion improved thermogenic gene expression in BAT in rptor KO mice
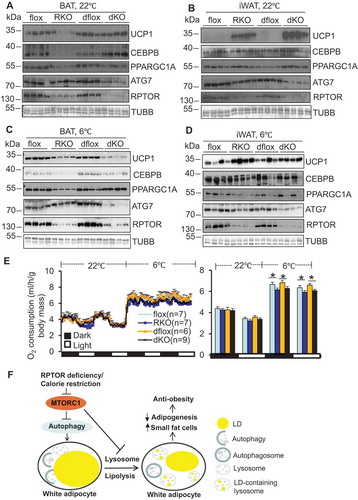
Because autophagy inhibition restored fat mass in RPTOR deficient mice, we asked if autophagy inhibition improves thermogenic capacity of rptor KO BAT and iWAT. As expected, RPTOR deficiency suppressed phosphorylation of ULK1 at Ser757, and this effect was not significantly affected by ATG7 depletion in BAT and iWAT (,, S3C and S3D). However, despite no significant effect on phosphorylation of TFEB, protein levels of ULK1 and TFEB were downregulated by RPTOR deficiency and this effect was reversed in double-KO BAT and iWAT (,, S3C and S3D). Although whitening of brown fat was detected in both atg7 rptor double-KO and rptor KO mice, compared with control mice (), double-KO mice displayed upregulation of UCP1 (uncoupling protein 1) and CEBPB/C/EBPβ (CCAAT enhancer binding protein beta), as well as an increase of BAT mass compared to rptor KO at room temperature conditions (, – and S3E). RPTOR-induced UCP1 expression was further enhanced by ATG7 ablation in iWAT ( and S3E). These results suggest that autophagy inactivation reverses RPTOR deficiency-suppressed fat development and thermogenic gene expression in BAT and iWAT. However, the induction of thermogenic gene expression in BAT and iWAT in double-KO mice disappeared under cold stress conditions (6°C) (, and S3F), indicating that autophagy is required for cold-induced thermogenesis. The expression level of UCP1 was even significantly lower in double KO mice compared to rptor KO mice under cold stress conditions ( and S3F). Despite no significant differences in energy expenditure as well as food intake and activity between atg7 rptor double-KO and rptor KO mice at room temperature, rptor KO mice as well as double-KO mice displayed significantly decreased O2 consumption under cold stress conditions, again suggesting the important role of autophagy in cold adaptation ( and S2E). This phenomenon was corroborated by the decrease of cold-induced O2 consumption but not food intake and activity in atg7 KO mice compared to the control animals (Figure S3G-H). These data suggest that MTORC1 cooperates with autophagy to regulate brown adipose development and thermogenesis, such that relatively lower activity of autophagy and higher activity of MTORC1 favor adipose tissue development.
Figure 7. ATG7 depletion restored thermogenic gene expression in rptor KO BAT. For the following studies, mice were individually housed in the metabolic cages coupled with a chamber at room temperature (22°C) for 72 h or at room temperature (22°C) for 24 h followed by cold exposure (6°C) for 48 h. (A) ATG7 deficiency restored expression levels of UCP1 and CEBPB, but not PPARGC1A in rptor KO BAT at room temperature. (B) ATG7 deficiency further upregulated expression levels of UCP1 in rptor KO iWAT at room temperature. (C) ATG7 deficiency further suppressed cold-induced expression levels of UCP1 despite the upregulation of CEBPB and PPARGC1A in rptor KO BAT under cold stress conditions. (D) ATG7 deficiency had no significant effect on the expression levels of UCP1 in rptor KO iWAT under cold stress condition. (E) O2 consumption in rptor flox, rptor KO, atg7 rptor double-flox and atg7 rptor double-KO under 22°C and 6°C. (F) A working model summarizing autophagy-mediated lipolysis that leads to impaired adipocyte maturation and adipogenesis. The average O2 consumption was normalized to whole-body mass and analyzed using Student’s t-test. The data in Figure 7E are presented as the mean ± S.E.M. *p < 0.05.
Discussion
Autophagy has been shown to play a vital role in regulating lipid biogenesis and lipolysis in hepatocytes and the liver [Citation6–Citation9]. However, while autophagy is implicated in adipose tissue development and adipocyte differentiation [Citation5,Citation11,Citation12], it remains largely unknown how autophagy regulates LD maturation and degradation. Our present study shows that autophagy played a critical role in regulating LD turnover and substantial adipocyte maturation. In addition, autophagy mediated MTORC1 inhibition-induced lipolysis, fat loss and downregulation of BAT thermogenic capacity in vivo. The results collectively demonstrate that MTORC1 signaling cooperated with autophagy to control adipocyte development through regulation of lipolysis.
Both MTORC1 and autophagy pathways are implicated in adipose tissue development and lipid metabolism [Citation7,Citation13,Citation14,Citation22,Citation23]. However, little is known whether autophagy interplays with MTORC1 in regulation of adipocyte development. We observed that RPTOR deficiency promoted autophagosome sequestration of LDs as well as lysosome accumulation, in adipocytes and adipose tissue, providing a model for exploring the role of autophagy in regulating LD formation and expansion in adipocytes (). Our present study also demonstrates that autophagy played a critical role in regulating LD turnover and adipocyte maturation and mediated MTORC1 inhibition-induced LD degradation through lipophagy and lipolysis in adipocytes. In addition, autophagy-mediated lipolysis or lipophagy not only suppressed adipocyte maturation but also subsequently downregulated PPARG, a master regulator of adipogenesis (, and ). On the other hand, lysosomes might also be involved in MTORC1 inhibition-induced LD degradation in adipocytes via an autophagy-independent mechanism, as is evidenced by little effect of autophagy deficiency on the increased number of lysosomes in rptor KO adipocytes (). In support of this, inhibiting autophagy only partially restored fat loss, and had no effect on the polarization of adipocytes in rptor KO WAT (). This is also supported by accumulated evidence linking lysosome biogenesis gene alteration to obesity, hepatic steatosis and insulin resistance independent of autophagy [Citation26–Citation29]. Future studies will be needed to clarify whether lysosomal activity independent of autophagy is involved in MTORC1 regulation of adipocyte development.
Our study demonstrates that autophagy played multifaceted roles in regulating fat metabolism at different developmental stages. Although autophagy deficiency driven by the adipoq promoter had no significant effect on adipose tissue development, it partially rescued the fat loss induced by MTORC1 inhibition (, and S2). Autophagy deficiency has been shown to suppress white adipocyte differentiation, promote browning of WAT, and protect against diet-induced obesity and insulin resistance [Citation5,Citation11]. It’s possible that in comparison with fabp4/aP2 (fatty acid binding protein 4) promoter [Citation5,Citation11], adipoq promoter-driven depletion of ATG7 might affect adipocyte maturation rather than the early phase of differentiation (). On the other hand, the fabp4-cre model has been shown to target other cell types, such as macrophages and neurons, in addition to adipocytes [Citation30]. Although the inhibitory effects of autophagy deficiency on adipose tissue development and browning of WAT became mild when depletion of ATG7 was driven by the adipoq promoter, the accumulation of mitochondria in atg7 KO adipocytes was consistent with fabp4-cre model (Figure S2L) [Citation5,Citation11]. A smaller increase in the number of mitochondria might be related to the decrease of lipolysis in adipocytes given that lipolysis promotes transcriptional regulation of mitochondria function through PPARGC1A/PGC1α (PPARG coactivator 1 alpha)/sirtuin 1 (SIRT1) pathway () [Citation31]. In addition, it has been shown that cold stress promotes the sequestration of LDs within autophagosomes [Citation6]. Along with this, autophagy was required for the facilitation of lipid droplet turnover (), a process that is associated with uncoupling in response to cold stress. In agreement with this, autophagy promoted cold adaptation through regulating cold-induced thermogenesis and energy expenditure ( and S2). Therefore, autophagy is a key player in lipid metabolism and adipocyte development.
MTORC1 is an upstream protein complex of the autophagy pathway and plays a pivotal role in regulating adipose function. Previous studies show that inhibition of MTORC1 by fabp4-driven ablation of RPS6KB or RPTOR enhances thermogenesis and energy expenditure, leading to protection against diet-induced obesity and glucose intolerance [Citation21,Citation32]. Although the basal expression levels of thermogenic genes are elevated in RPTOR or MTOR-deficient WAT when adipoq cre is used, MTORC1 inhibition leads to fat loss lipodystrophy and insulin resistance [Citation24,Citation33–Citation35]. In addition, severe fat loss and decreased thermogenic gene expression are observed in MTORC1-inhibited BAT [Citation24,Citation33–Citation35]. More recent studies show that inactivation of MTORC1 by rapamycin or RPTOR deficiency in fat suppresses thermogenesis by interacting with PKA (protein kinase cAMP-dependent) signaling [Citation35,Citation36]. We show that inactivating autophagy improved adipose tissue development and subsequently ameliorated thermogenic function in BAT and iWAT in MTORC1-deficient mice (–). In support of this, autophagy mediated the suppressing effect of MTORC1 on lipolysis and LD maturation in adipocytes (). Future studies should include an inducible model to clarify whether MTORC1 regulation of thermogenesis and lipid metabolism is secondary to impaired adipocyte maturation.
In response to PKA activation, autophagy was activated and cooperated with the LIPE pathway to regulate lipolysis and adipocyte maturation based on our following observations: 1) Activation of autophagy/lysosomes by treatment of adrenergic receptor agonist (, and S2H); 2) Suppression of isoproterenol-induced lipolysis by ATG7 deficiency in vitro and in vivo ( and ) LD-containing lysosomes reversed by ATG7 deficiency with little effect on LIPE activity in rptor KO cells (, S1E and S2K). Autophagy-mediated lipolysis or lipophagy is understudied, although this study suggests it may be associated with lysosomes. The precise mechanisms underlying how autophagy facilitates lysosome interaction with LDs to uptake lipids remains to be further investigated. Our data also suggests that PKA may act as an effector downstream of MTORC1 and mediate the inhibitory effect of MTORC1 on autophagy in adipocytes. This is supported by a previous finding that the RAS type GTPase family (RAS)/cyclic AMP (cAMP) pathway is required for TOR inhibition-driven activation of autophagy in yeast [Citation37]. However, it’s unclear whether MTORC1 signaling inactivates autophagy via a PKA-dependent pathway. Given that RPTOR deficiency increases ULK1 phosphorylation in adipocytes (), it’s possible that MTORC1 suppresses autophagy through both ULK1 and PKA pathways. Future studies will also be needed to address whether the autophagy pathway regulates ADRB3 (adrenergic receptor, beta 3)-mediated thermogenesis via a cell-autonomous mechanism. Whereas the basal levels of LC3-II were enhanced in rptor KO WAT compared to the control sample, leupeptin treatment downregulated levels of LC3-II in rptor KO WAT (Figure S1A). These data suggest that lysosomes may somehow modulate autophagy in adipocytes. In support of this, lysosome damage and repositioning have been shown to play critical roles in regulating the autophagy pathway [Citation38,Citation39].
In summary, our present study demonstrates that MTORC1 inhibition suppresses adipocyte development by activating lipophagy, increasing lipolysis, and facilitating LD degradation and polarization. Inactivating autophagy reduces lipolysis and restores fat mass in MTORC1-inhibited adipose tissue despite no significant effect on adipocyte polarization. Our results reveal that relatively lower levels of autophagy favor adipocyte development and LD maturation.
Materials and methods
Materials
Antibodies against PNPLA2/ATGL (2439S), LIPE/HSL (4107S), phospho-LIPE/HSL at Ser563 (4139S), MAPK/ERK p44/42 (9102S), phospho-RPS6KB/S6K at Thr389 (9205L), RPTOR (2280S), ATG7 (8558S), PPARG/PPARγ (2443S), phospho-ACACA/ACC at Ser79 (3661S), ACACA/ACC (3662S), phospho-ULK1 at Ser757 (6888S), ULK1 (8054S), and FASN (4233S) were from Cell Signaling Technology. Anti-RPS6KB/S6K (CG1396-100) was from Cell Applications. Polyclonal antibodies to ADIPOQ/adiponectin were generated as described previously [Citation4]. Anti-UCP1 (ab23841) and anti-PLIN1 (ab61682) were from Abcam. Anti- PPARGC1A/PGC1α (ST1204-100UL) and phospho-TFEB at Ser142 (ABE1971-I-100UL) were purchased from MilliporeSigma. Anti-CEBPB/C/EBPβ (sc-150) was from Santa Cruz Biotechnology. Anti-LC3 (PM036) was from MBL International Corporation for Immunofluorescence staining. Anti-LAMP1 (1D4B) was from Developmental Studies Hybridoma Bank. Anti-TFEB (PA1-31552), LysoTracker Red DND-99 (L7528), leupeptin (L6543), DAPI (4ʹ,6-Diamidino-2-Phenylindole, Dilactate) (D3571), BODIPY® 493/503 (D3922), Prestained Protein Ladder (26616), goat anti-rat IgG (H + L) secondary antibody (31470), Alexa Fluor® 647 conjugate (A-21247), rabbit anti-goat IgG (H + L) secondary antibody, goat anti-rabbit IgG (H + L) secondary antibody, Alexa Fluor® 488 (A-11008)/568 (A11036)/647 (A-21244) conjugate were from Thermo Fisher Scientific. atglistatin was from Cayman (15284). Isoproterenol (I6504-500MG), rapamycin (R8781) and anti- LC3(L7543-200UL) were from Sigma-Aldrich. Anti-TUBB (tubulin beta class 1) was from Sigma-Aldrich (T8328).
Generation of adipose specific-rptor and atg7 double knockout (double-kO) mice
Adipose-specific rptor KO mice were generated by crossing rptor floxed and adipoq cre mice as described in our previous study [Citation24]. A similar approach was used to generate adipose-specific atg7 KO mice using atg7 floxed mice that were kindly provided by Dr. Vojo Deretic (University of New Mexico). Adipose-specific atg7 rptor double-KO mice were generated by crossing rptor KO mice with atg7 floxed mice. The knockout efficiency was detected in adipose tissue and other types of tissue by western blots using anti-RPTOR and anti-ATG7 antibodies. 10-week old male mice were used for the studies unless it was specified differently. All animals were housed in a pathogen-free barrier facility with a 12 h light/12 h dark cycle with food and water ad libitum. All animal experimental protocols were reviewed and approved by the Animal Care Committee of the University of New Mexico Health Sciences Center.
Autophagic flux assay
For in vivo autophagic flux assay, 10-week old mice were administered 40 mg/kg leupeptin for 4 h through i.p. injection. Epididymal white adipose tissue (eWAT) was harvested. Primary adipocytes were isolated from adipose tissue and lysed for western blot analysis of LC3. In the meantime, tissue samples were also directly homogenized for the analysis of LC3. Net LC3-II flux was determined by subtracting the densitometric value of inhibitor-untreated LC3-II from corresponding inhibitor-treated LC3-II values. In the meantime, adipose tissue samples were dissected, minced, digested with collagenase A (Roche, 11088793001), and filtered with a 70-μm cell strainer (Falcon). Dispersed cells were centrifuged, and the free-floating adipocyte fraction was collected and lysed for western blot analysis of LC3-II. For the measurement of LC3 puncta in adipocytes, automated epifluorescence image collection was performed in 96‐well plates as described previously [Citation40]. Epifluorescence images were machine‐collected and machine‐analyzed using predetermined scanning parameters and object mask definitions. DAPI staining was used for automatic focusing and cellular outlining, based on background staining of the cytoplasm, and the mean count of LC3 puncta per cell was determined. High content imaging analysis was performed using a Cellomics VTI HCS scanner and iDEV software (Thermo Fisher Scientific).
Immunofluorescence staining
For cell studies, primary differentiated adipocytes were seeded in 96 well plates and fixed with 4% paraformaldehyde. Cells were then permeabilized with 0.1% saponin (Sigma-Aldrich, 47036) in 3% bovine serum albumin (BSA; Fisher Scientific, BP1605-100) for 30 min followed by incubation with primary antibodies to LC3, LAMP1 or PLIN1 for 2 h, then secondary antibodies for 1 h. High content microscopy with automated image acquisition and quantification was carried out using a Cellomics HCS scanner and iDEV software. Automated epifluorescence image collection was performed using a minimum of 2000 cells per well. Epifluorescence images were machine analyzed using preset scanning parameters and object mask definitions. DAPI staining was used for autofocusing and to automatically define cellular outlines based on background staining of the cytoplasm. Within primary objects, defined as cells, regions of interest (ROI) or targets were algorithm-defined for shape/segmentation, maximum/minimum average intensity, total area, and total intensity minima and maxima limits, to automatically identify puncta or other profiles within valid primary objects. All data collection, processing (object, ROI, and target mask assignments), and analyzes were performed by software, independently of human operators, as described previously [Citation38].
Amnis analysis
In vivo studies, adipose tissue samples from 10-week old mice were dissected, minced, digested with collagenase A, and filtered with a 70 μm cell strainer (Falcon, 10199–656). The underlying pellets (stromal vascular fraction [SVF]) and media were removed, and the upper fat layers were washed with phosphate-buffered saline (PBS; containing 137 mM NaCl, 2.7 mM KCl, 8 mM Na2HPO4, 2 mM KH2PO4, pH 7.4) and fixed with 4% paraformaldehyde at 4℃ for 15 min. Fixed cells were washed and blocked with 5% BSA solution in PBS. The cells were permeabilized and stained with anti-LC3 or anti-LAMP1, followed by staining with Fluor® 647 conjugated secondary antibodies [Citation41]. Colocalization in primary cells was analyzed using Amnis Imaging Flow Cytometer. Locating cells at optimal focus was accomplished by using the gradient root mean square (RMS) feature and drawing a region on events with high gradient values. DAPI was used as a main point of reference to determine the optimal focus of cells and ensure sharp images that produced a high gradient value. Events positive for one or more fluorochromes can be identified using an intensity plot, and the negative, single positive, and double positive populations were distinguished using regions drawn on the plot. The relative brightness of a given fluorochrome on a cell was quantified and calculated by taking the sum of the pixel intensities within a given channel mask normalized for camera dark-current. A total of 3,502 rptor KO adipocytes and 2,354 control adipocytes were used for all subsequent analysis. Representative images from this region were displayed.
Staining with LysoTracker
Primary differentiated rptor KO and control adipocytes were cultured in the fresh medium of DMEM with 10% FBS, and treated with 2 µM LysoTracker for 4 h. For the treatment of isopropanol, cells were treated with or without 10 µM isopropanol for 4 h in the presence of 2 µM LysoTracker. The acidified organelles were assessed by quantifying LysoTracker Red DND-99 puncta using automated high-content imaging and analysis. The average LysoTracker Red puncta was identified and counted by the system, and 2000 primary objects were counted per well.
Transmission electron microscopy
Day 6-differentiated primary adipocytes on the coverslip were fixed in 0.1 M sodium cacodylate buffer containing 3% formaldehyde and 2% glutaraldehyde for 1 h. Cells were washed with cacodylate buffer followed by secondary fixation in 1% osmium-1.5% potassium ferricyanide at room temperature (RT) for 1 h. Cells were then washed, stained in 1% uranyl acetate at RT for 1 h, and dehydrated in a graded series of ethanol. Cell sample was then infiltrated with Epon-Araldite resin, embedded and heat-cured. The coverslips were removed from the cured resin blocks, and the pieces from the resin blocks were re-mounted for en face sectioning. Thin sections (~80 nm) were mounted on Cu grids, post-stained with uranyl acetate and Reynold’s lead citrate, and examined in a Hitachi HT7700 TEM at 80 kV. Images were captured with an AMT XR-81 CCD camera, and a total of 25 cells/slide underwent imaging, and 3 images/cell were taken. For the quantification, we counted the total number of mitochondria, lysosomes in the defined areas (272475 µm2)/cell and used the average number in each area for the statistical analysis. The number of mitochondria and lysosomes was expressed as the number of mitochondria and lysosomes per nucleus as described previously [Citation11].
Body composition
To check body composition, 10-week old mice were anesthetized by intraperitoneal injection with 0.1 ml/10 grams animal body weight Ketamine/Xylazine (10 mg/ml Ketamine and 1 mg/ml Xylazine). Bone mineral density, fat mass, lean mass, and percentage of fat were determined using dual-energy X-ray absorptiometry (DEXA) (GE Medical Systems, Madison, WI).
Hematoxylin and eosin, oil red o staining and immunohistochemical analysis
For hematoxylin and eosin (H&E) staining, adipose tissues from 10-week old mice were fixed with 4% formalin for 48 h and embedded in paraffin. Tissue sections (6-μm thick) were stained with H&E according to standard protocols then analyzed using the NIH ImageJ software. Immunohistochemistry was performed as described in our previous study [Citation42]. For Oil Red O staining, differentiated primary adipocytes were fixed with 10% formalin for 5 min and stained with Oil Red O in 60% isopropanol for 20 min [Citation42,Citation43]. Confocal images were taken using EVOS FL Cell Imaging System.
Energy expenditure
The 10-week-old mice were individually housed in eight separate Promethion Metabolic Phenotyping Systems (Sable Systems International) coupled with a temperature controllable chamber. Oxygen consumption (VO2), carbon dioxide release (VCO2), food intake, water intake, and the activity of each animal were monitored at room temperature (22°C) for 72 h, then in cold stress conditions (6°C) for 48 h. The data was analyzed using the ExpeData software associated with the system. Oxygen consumption was normalized by body weight as we described previously [Citation24,Citation44].
Primary culture and differentiation of adipocytes
Primary SVFs from inguinal fat depots of 3-week-old rptor KO, atg7 KO, atg7 rptor double-KO and their related control mice were isolated and cultured as described previously [Citation45]. Differentiation of adipocytes was performed as described previously [Citation46]. In brief, the isolated SVFs from iWAT for all primary culture experiments. The SVF were cultured in DMEM with 20% FBS overnight, and the floating and dead cells were washed away with PBS for 2 times. Adherent cells were cultured and split for 3 passages. Cells were seeded in a 12 well plate and started to be differentiated by adding induction medium of DMEM with 10% FBS containing 1 µM dexamethasone and 0.5 mM IBMX (company, catalog number), and 10 µg/ml insulin (company, catalog number) for 72 h. Medium will be changed into differentiation medium of DMEM with 10% FBS containing 10 µg/ml insulin for 48 h. Cells were then maintained in the regular medium of DMEM with 10% FBS for 24 h. Cells were then cultured in a fresh regular medium and treated with or without 5 µM lipolysis inhibitor atglistatin or 10 µM lysosome inhibitor leupeptin for additional 4 days.
Lipolysis assay in vitro, in vivo, and ex vivo
For the in vitro assay, day 6 differentiated primary adipocytes were washed with PBS and incubated in 2% BSA medium, in the presence or absence of 10 μM isoproterenol, for 2 h. The media was collected for the measurement of glycerol and free fatty acids (FFA) as described previously [Citation46,Citation47]. For the ex vivo lipolysis, 10-week old mice were fasted for 4 h, and epididymal fat pads were collected and cut into about 10 mg fat pads. Fat tissue samples were distributed into 48-well plates containing 0.25 ml DMEM–2% FFA-free BSA media in the presence or absence of 10 μM isoproterenol for 2 h at 37°C in a humidified atmosphere (95% O2, 5% CO2). The medium was then collected for the measurement of glycerol and FFA levels. The levels of glycerol and FFA were normalized with the wet weight of tissue sample (mg). For in vivo lipolysis, 10-week old mice were fasted for 4 h and treated with an intraperitoneal injection of 10 mg/kg body weight isoproterenol. Blood was collected before and 15 min after injection for the measurement of glycerol levels. Data were normalized with total fat mass determined by the Dual Energy X-ray Absorptiometry.
Analysis of adipocyte size and number
For in vivo analysis, H&E staining was performed on tissues from 10-week old mice. Stained tissues were visualized with NanoZoomer Slide Scanner. Five sections per animal were stained. Eight representative images per section were used to determine adipocyte size. Size of adipocytes were determined with ImageJ Analysis of H&E stained tissues [Citation24]. Number of adipocytes per area was determined by manual counting cells on H&E slides from at least three 20× fields of three mice per genotype as we previously described [Citation5,Citation46]. For in vitro analysis, the area of LD in BODIPY staining was analyzed using Cellomic Image System. 1000 individual LD area for each well was determined by software. The average LD area in the bright field image and Oil red O staining was analyzed using NIH ImageJ software, and 5 images per well were taken for quantification. Three independent experiments were performed for in vitro analysis.
Statistical analysis
Statistical analysis of the data was performed using a two-tailed Student’s t test between two groups or one-way ANOVA among three different groups. For the cell study, we performed three independent experiments and quantified the data. All results are presented as the mean ± SEM, and a P value of <0.05 was considered to be statistically significant.
Supplemental Material
Download Zip (5.3 MB)Acknowledgments
We would like to acknowledge the National Institute of Diabetes and Digestive Kidney Diseases, the National Institute of General Medical Science, the American Diabetes Association, the American Heart Association, and the University of New Mexico Health Sciences Center (UNMHSC) for funding support. We thank the Autophagy, Inflammation and Metabolism (AIM) Center at UNMHSC for providing the Aminis Imaging Flow Cytometer and the Cellomics HCS scanner for our present study. The AIM center is supported by NIH grant P20GM121176 from NIGMS. We thank Dr. Feng Liu at the University of Texas Health at San Antonio for providing us with the ADIPOQ antibody. We also thank Dr. Curt Hines at UNMHSC for providing EVOS FL Cell Imaging System for the immunofluorescence staining. In addition, we thank Chaselyn Ruffaner-Hanson for editing this manuscript.
Disclosure statement
No potential conflict of interest was reported by the authors.
Supplementary material
The supplementary data for this article can be accessed here.
Additional information
Funding
Related Research Data
References
- Luo L, Liu M. Adipose tissue in control of metabolism. J Endocrinol. 2016;231:R77–R99.
- Sethi JK, Vidal-Puig AJ. Thematic review series: adipocyte biology. Adipose tissue function and plasticity orchestrate nutritional adaptation. J Lipid Res. 2007;48:1253–1262.
- Frayn KN. Adipose tissue as a buffer for daily lipid flux. Diabetologia. 2002;45:1201–1210.
- Alsted TJ, Nybo L, Schweiger M, et al. Adipose triglyceride lipase in human skeletal muscle is upregulated by exercise training. Am J Physiol Endocrinol Metab. 2009;296:E445–E453.
- Singh R, Xiang Y, Wang Y, et al. Autophagy regulates adipose mass and differentiation in mice. J Clin Invest. 2009;119:3329–3339.
- Singh R, Kaushik S, Wang Y, et al. Autophagy regulates lipid metabolism. Nature. 2009;458:1131–1135.
- Yang L, Li P, Fu S, et al. Defective hepatic autophagy in obesity promotes ER stress and causes insulin resistance. Cell Metab. 2010;11:467–478.
- Kaushik S, Cuervo AM. Degradation of lipid droplet-associated proteins by chaperone-mediated autophagy facilitates lipolysis. Nat Cell Biol. 2015;17:759–770.
- Nguyen TB, Louie SM, Daniele JR, et al. DGAT1-dependent lipid droplet biogenesis protects mitochondrial function during starvation-induced autophagy. Dev Cell. 2017;42(9–21):e25.
- Martinez-Lopez N, Garcia-Macia M, Sahu S, et al. Autophagy in the CNS and periphery coordinate lipophagy and lipolysis in the brown adipose tissue and liver. Cell Metab. 2016;23:113–127.
- Zhang Y, Goldman S, Baerga R, et al. Adipose-specific deletion of autophagy-related gene 7 (atg7) in mice reveals a role in adipogenesis. Proc Natl Acad Sci U S A. 2009;106:19860–19865.
- Baerga R, Zhang Y, Chen PH, et al. Targeted deletion of autophagy-related 5 (atg5) impairs adipogenesis in a cellular model and in mice. Autophagy. 2009;5:1118–1130.
- Nunez CE, Rodrigues VS, Gomes FS, et al. Defective regulation of adipose tissue autophagy in obesity. Int J Obes (Lond). 2013;37:1473–1480.
- Kovsan J, Blüher M, Tarnovscki T, et al. Altered autophagy in human adipose tissues in obesity. J Clin Endocrinol Metab. 2011;96:E268–E277.
- Soussi H, Clement K, Dugail I. Adipose tissue autophagy status in obesity: expression and flux–two faces of the picture. Autophagy. 2016;12:588–589.
- Loewith R, Jacinto E, Wullschleger S, et al. Two TOR complexes, only one of which is rapamycin sensitive, have distinct roles in cell growth control. Mol Cell. 2002;10:457–468.
- Wullschleger S, Loewith R, Hall MN. TOR signaling in growth and metabolism. Cell. 2006;124:471–484.
- Hara K, Maruki Y, Long X, et al. Raptor, a binding partner of target of rapamycin (TOR), mediates TOR action. Cell. 2002;110:177–189.
- Sengupta S, Peterson TR, Laplante M, et al. mTORC1 controls fasting-induced ketogenesis and its modulation by ageing. Nature. 2010;468:1100–1104.
- Chan EY. mTORC1 phosphorylates the ULK1-mAtg13-FIP200 autophagy regulatory complex. Sci Signal. 2009;2:pe51.
- Polak P, Cybulski N, Feige JN, et al. Adipose-specific knockout of raptor results in lean mice with enhanced mitochondrial respiration. Cell Metab. 2008;8:399–410.
- Khamzina L, Veilleux A, Bergeron S, et al. Increased activation of the mammalian target of rapamycin pathway in liver and skeletal muscle of obese rats: possible involvement in obesity-linked insulin resistance. Endocrinology. 2005;146:1473–1481.
- Tremblay F, Jacques H, Marette A. Modulation of insulin action by dietary proteins and amino acids: role of the mammalian target of rapamycin nutrient sensing pathway. Curr Opin Clin Nutr Metab Care. 2005;8:457–462.
- Zhang X, Luo Y, Wang C, et al. Adipose mTORC1 suppresses prostaglandin signaling and beige adipogenesis via the CRTC2-COX-2 pathway. Cell Rep. 2018;24:3180–3193.
- Shibata M, Yoshimura K, Tamura H, et al. LC3, a microtubule-associated protein1A/B light chain3, is involved in cytoplasmic lipid droplet formation. Biochem Biophys Res Commun. 2010;393:274–279.
- Xu X, Grijalva A, Skowronski A, et al. Obesity activates a program of lysosomal-dependent lipid metabolism in adipose tissue macrophages independently of classic activation. Cell Metab. 2013;18:816–830.
- Chao X, Wang S, Zhao K, et al. Impaired TFEB-mediated lysosome biogenesis and autophagy promote chronic ethanol-induced liver injury and steatosis in mice. Gastroenterology. 2018;155(3):e812.
- Gornicka A, Fettig J, Eguchi A, et al. Adipocyte hypertrophy is associated with lysosomal permeability both in vivo and in vitro: role in adipose tissue inflammation. Am J Physiol Endocrinol Metab. 2012;303:E597–E606.
- Mizunoe Y, Sudo Y, Okita N, et al. Involvement of lysosomal dysfunction in autophagosome accumulation and early pathologies in adipose tissue of obese mice. Autophagy. 2017;13:642–653.
- Lee KY, Russell SJ, Ussar S, et al. Lessons on conditional gene targeting in mouse adipose tissue. Diabetes. 2013;62:864–874.
- Gallardo-Montejano VI, Saxena G, Kusminski CM, et al. Nuclear Perilipin 5 integrates lipid droplet lipolysis with PGC-1alpha/SIRT1-dependent transcriptional regulation of mitochondrial function. Nat Commun. 2016;7:12723.
- Um SH, Frigerio F, Watanabe M, et al. Absence of S6K1 protects against age- and diet-induced obesity while enhancing insulin sensitivity. Nature. 2004;431:200–205.
- Lee PL, Tang Y, Li H, et al. Raptor/mTORC1 loss in adipocytes causes progressive lipodystrophy and fatty liver disease. Mol Metab. 2016;5:422–432.
- Shan T, Zhang P, Jiang Q, et al. Adipocyte-specific deletion of mTOR inhibits adipose tissue development and causes insulin resistance in mice. Diabetologia. 2016;59:1995–2004.
- Tran CM, Mukherjee S, Ye L, et al. Rapamycin blocks induction of the thermogenic program in white adipose tissue. Diabetes. 2016;65:927–941.
- Liu D, Bordicchia M, Zhang C, et al. Activation of mTORC1 is essential for beta-adrenergic stimulation of adipose browning. J Clin Invest. 2016;126:1704–1716.
- Schmelzle T, Beck T, Martin DE, et al. Activation of the RAS/cyclic AMP pathway suppresses a TOR deficiency in yeast. Mol Cell Biol. 2004;24:338–351.
- Jia J, Abudu YP, Claude-Taupin A, et al. Galectins control mTOR in response to endomembrane damage. Mol Cell. 2018;70(1):e128.
- Tapia D, Jiménez T, Zamora C, et al. KDEL receptor regulates secretion by lysosome relocation- and autophagy-dependent modulation of lipid-droplet turnover. Nat Commun. 2019;10:735.
- Kimura T, Jia J, Kumar S, et al. Dedicated SNAREs and specialized TRIM cargo receptors mediate secretory autophagy. Embo J. 2017;36:42–60.
- Hagberg CE, Li Q, Kutschke M, et al. Flow cytometry of mouse and human adipocytes for the analysis of browning and cellular heterogeneity. Cell Rep. 2018;24(10):e2745.
- Bhattacharya M, et al. IQGAP1-dependent scaffold suppresses RhoA and inhibits airway smooth muscle contraction. J Clin Invest. 2014;124:4895–4898.
- Liu M, Xiang R, Wilk SA, et al. Fat-specific DsbA-L overexpression promotes adiponectin multimerization and protects mice from diet-induced obesity and insulin resistance. Diabetes. 2012;61:2776–2786.
- Luo Y, Liu B, Yang X, et al. Myeloid adrenergic signaling via CaMKII forms a feedforward loop of catecholamine biosynthesis. J Mol Cell Biol. 2017;9:422–434.
- Ding X, et al. IL-33-driven ILC2/eosinophil axis in fat is induced by sympathetic tone and suppressed by obesity. J Endocrinol. 2016;231:35–48.
- Liu M, Bai J, He S, et al. Grb10 promotes lipolysis and thermogenesis by phosphorylation-dependent feedback inhibition of mTORC1. Cell Metab. 2014;19:967–980.
- Chen W, et al. Berardinelli-seip congenital lipodystrophy 2/seipin is a cell-autonomous regulator of lipolysis essential for adipocyte differentiation. Mol Cell Biol. 2012;32:1099–1111.