
ABSTRACT
While constant basal levels of macroautophagy/autophagy are a prerequisite to preserve long-lived podocytes at the filtration barrier, MTOR regulates at the same time podocyte size and compensatory hypertrophy. Since MTOR is known to generally suppress autophagy, the apparently independent regulation of these two key pathways of glomerular maintenance remained puzzling. We now report that long-term genetic manipulation of MTOR activity does in fact not influence high basal levels of autophagy in podocytes either in vitro or in vivo. Instead we present data showing that autophagy in podocytes is mainly controlled by AMP-activated protein kinase (AMPK) and ULK1 (unc-51 like kinase 1). Pharmacological inhibition of MTOR further shows that the uncoupling of MTOR activity and autophagy is time dependent. Together, our data reveal a novel and unexpected cell-specific mechanism, which permits concurrent MTOR activity as well as high basal autophagy rates in podocytes. Thus, these data indicate manipulation of the AMPK-ULK1 axis rather than inhibition of MTOR as a promising therapeutic intervention to enhance autophagy and preserve podocyte homeostasis in glomerular diseases.
Abbreviations: AICAR: 5-aminoimidazole-4-carboxamide ribonucleotide; AMPK: AMP-activated protein kinase; ATG: autophagy related; BW: body weight; Cq: chloroquine; ER: endoplasmic reticulum; ESRD: end stage renal disease; FACS: fluorescence activated cell sorting; GFP: green fluorescent protein; i.p.: intra peritoneal; MAP1LC3/LC3: microtubule-associated protein 1 light chain 3; MTOR: mechanistic target of rapamycin kinase; NPHS1: nephrosis 1, nephrin; NPHS2: nephrosis 2, podocin; PLA: proximity-ligation assay; PRKAA: 5ʹ-AMP-activated protein kinase catalytic subunit alpha; RPTOR/RAPTOR: regulatory associated protein of MTOR, complex 1; RFP: red fluorescent protein; TSC1: tuberous sclerosis 1; ULK1: unc-51 like kinase 1
Introduction
Worldwide, glomerular diseases are the leading cause for end-stage renal disease (ESRD) requiring hemodialysis treatment [Citation1]. Due to the increase of ESRD prevalence, understanding glomerular biology is critical for future targeted pharmacological treatments to maintain the glomerular filtration barrier – a unique structure characterized by a complex three-layered composition of podocytes, glomerular basement membrane and endothelial cells [Citation1,Citation2]. Podocytes are highly specialized epithelial cells with long interdigitating foot processes enclosing the glomerular capillaries and their progressive loss is associated with proteinuria and renal failure [Citation2,Citation3].
Diminution in podocyte number due to cellular or tissue insult cannot be reconstituted by existing cells due to their post-mitotic nature. Their ability to survive depends on their capacity to endure cellular stress. Macroautophagy (later referred to as autophagy) has been implicated as the major cellular maintenance mechanism of podocytes characterized by removal of dysfunctional organelles and misfolded proteins by enclosure within double membrane vesicles called autophagosomes and their subsequent lysosomal fusion and degradation [Citation4–8]. In brief, autophagy is initiated at an endoplasmic reticulum subdomain called the omegasome – a membrane compartment rich in phosphatidylinositol-3-phosphate [Citation9]. After nucleation the phagophore, an isolation membrane and autophagosome precursor, is elongated using a lipid supply from various cellular membrane compartments [Citation10,Citation11]. At the same time, cytosolic MAP1LC3/LC3 (microtubule-associated protein 1 light chain 3)-I is conjugated to phosphatidylethanolamine and integrated into the phagophore membrane (the lipidated form referred to as LC3-II, a key biochemical marker for autophagy) [Citation12,Citation13]. Further phagophore elongation is driven by a complex interplay of WIPI (WD repeat domain, phosphoinositide interacting) proteins as well as the Atg8-family proteins and ATG12 (autophagy related 12) conjugation systems [Citation14–20].
Phagophore initiation, and thereby the initial step of autophagosome formation, is promoted by 2 complexes – the ULK1 (unc-51 like kinase 1) complex and the BECN1-containing class III phosphatidylinositol 3-kinase (PtdIns3K) complex. In particular, the ULK1 complex serves as a hub integrating upstream signals to regulate autophagic activity [Citation21–25].
In podocytes, autophagy block by cell-specific deletion of Atg5 (coding for a protein important for phagophore membrane elongation) leads to proteinuria and features of accelerated aging as well as massively increased glomerular disease susceptibility (see ref [Citation5].) e.g. toward diabetic nephropathy (DN) and focal segmental glomerulosclerosis (FSGS) [Citation4,Citation26,Citation27]. Furthermore, podocyte maintenance is safeguarded by MTOR (mechanistic target of rapamycin kinase) pathway known to inhibit autophagy [Citation23,Citation24,Citation28]. Podocytes utilize MTOR signaling for programs of cellular hypertrophy in response to cellular stress as observed in DN [Citation29]. Both, impaired as well as hyperactive MTOR signaling results in proteinuria and podocyte loss [Citation28,Citation30,Citation31].
MTOR is a PtdIns3K-like serine/threonine protein kinase that is evolutionarily highly conserved and functions in two multiprotein complexes. MTOR complex 1 (MTORC1) mediates most of the known functions of the pathway like cellular growth and proliferation via substrates that include p-RPS6KB/p70S6k (ribosomal protein S6 kinase) and EIF4EBP1 (eukaryotic translation initiation factor 4E binding protein 1). Moreover, MTORC1 is the best characterized repressor of autophagy (see ref [Citation32].), inhibiting this process by phosphorylating ULK1 [Citation24].
That podocytes use both pathways – high basal autophagy levels as well as fluctuating MTOR activity – at the same time, appears to be paradox in the light of the known inhibitory function of MTOR on autophagy. To investigate podocyte-specific regulation of autophagy we applied in our present study genetic and pharmacological in vitro and in vivo models to comprehensively determine the impact of MTOR on podocyte autophagy and to elucidate time-dependent effects of MTOR kinase inhibition on autophagy regulation.
Results
Podocytes exhibit high levels of basal autophagy and autophagic flux
To assess basal autophagy, we analyzed autophagosome formation in vivo in adult (4-month-old) Gfp-Lc3 transgenic mice using LC3 as a marker of autophagy. High numbers of autophagosomes were found in the glomeruli but were rarely found in the tubular compartment (). Intravital two-photon microscopy confirmed high numbers of autophagosomes in podocytes under in vivo conditions (). Tandem fluorescent protein tagged LC3 (RFP-GFP-LC3) allows monitoring autophagic flux based on differential pH stability of RFP and GFP [Citation33]. To determine the amount of de novo formed autophagosomes and the flux toward lysosomal degradation, we analyzed autophagosomes in vivo in 4-month-old transgenic Rfp-Gfp-Lc3 mice [Citation34]. Higher numbers of GFP+ RFP+ and RFP+ puncta could be detected in podocytes compared to tubular cells (, and S1A). The number of RFP+ puncta was comparable with that found in liver tissue (Figure S1B,C), also known for high basal activity in autophagy (for reviews, see refs [Citation35]. and [Citation36]). Autophagic flux in Gfp-Lc3 mice was additionally determined by quantifying autophagosome numbers in the presence of inhibitors of lysosomal degradation [Citation37,Citation38]. In vivo assessment of autophagosomes revealed autophagosome accumulation in response to chloroquine indicating high autophagic flux toward lysosomal degradation and high levels of de novo autophagosome formation in podocytes compared to tubular cells (). Furthermore, autophagic flux in podocytes was found to be even higher than in liver tissue (Figure S1D,E). In vitro podocytes showed higher levels of autophagy as compared to tubular cells indicated by higher levels of LC3-II and lower levels of the autophagy substrate SQSTM1 (,). Also, autophagic flux was higher in podocytes than in tubular cells (Figures S1F,G). Interestingly, the activity of MTORC1 was significantly elevated in podocytes as determined by phosphorylation of the p-RPS6KB/p70S6k substrate RPS6/S6 (ribosomal protein S6) and phosphorylated EIF4EBP1 (,). Together, these results indicate that podocyte exhibit an unusual concomitant autophagic flux and elevated MTORC1 activity.
Figure 1. Podocytes exhibit high levels of basal autophagy and autophagic flux. (A) Representative images obtained from cryosections of 4-month old Gfp-Lc3 mice stained for the basement membrane marker NID1/nidogen-1/entactin (red) and GFP-LC3 (green). (B) Two-photon images of glomeruli from Gfp-Lc3 mice perfused with dextran as a marker for glomerular capillaries (in red) displaying autophagosomes in vivo (in green, marked with arrow). (C) Representative images obtained from cryosections of 4-month-old Rfp-Gfp-Lc3 mice stained for NID1 (purple). RFP-LC3 and GFP-LC3 fluorescence is endogenous. (D) Quantification of (C) out of 30 glomeruli from 3 mice each with surrounding tubular cells (** ≤ 0.01, * ≤ 0.05). (E) Cryosections displaying glomeruli (upper panel) and tubular system (lower panel) stained for NID1 (red) and GFP-LC3 (anti-GFP antibody, green) in 4-month-old WT mice with and without chloroquine (4 h after chloroquine [Cq] administration i.p. 100 mg Cq/kg BW). (F) Western blot from immortalized human podocyte cell line and proximal tubular cell line (HK2) for MTORC1 downstream targets and LC3 abundance. (G) Densitometry obtained from (F) (** ≤ 0.01)
![Figure 1. Podocytes exhibit high levels of basal autophagy and autophagic flux. (A) Representative images obtained from cryosections of 4-month old Gfp-Lc3 mice stained for the basement membrane marker NID1/nidogen-1/entactin (red) and GFP-LC3 (green). (B) Two-photon images of glomeruli from Gfp-Lc3 mice perfused with dextran as a marker for glomerular capillaries (in red) displaying autophagosomes in vivo (in green, marked with arrow). (C) Representative images obtained from cryosections of 4-month-old Rfp-Gfp-Lc3 mice stained for NID1 (purple). RFP-LC3 and GFP-LC3 fluorescence is endogenous. (D) Quantification of (C) out of 30 glomeruli from 3 mice each with surrounding tubular cells (** ≤ 0.01, * ≤ 0.05). (E) Cryosections displaying glomeruli (upper panel) and tubular system (lower panel) stained for NID1 (red) and GFP-LC3 (anti-GFP antibody, green) in 4-month-old WT mice with and without chloroquine (4 h after chloroquine [Cq] administration i.p. 100 mg Cq/kg BW). (F) Western blot from immortalized human podocyte cell line and proximal tubular cell line (HK2) for MTORC1 downstream targets and LC3 abundance. (G) Densitometry obtained from (F) (** ≤ 0.01)](/cms/asset/4347df5b-dc05-4e75-9fca-9709c9de6611/kaup_a_1705007_f0001_c.jpg)
Basal autophagy is independent of MTOR activity in podocytes
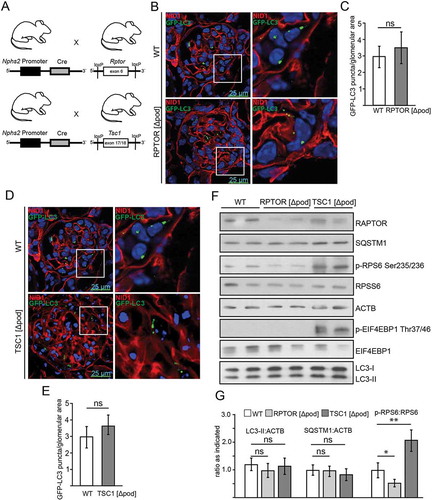
We next determined levels of autophagy in podocyte-specific genetic models of MTORC1 hypo- and hyperactivation. We generated mice bearing a podocyte-specific knockout for the gene coding for the regulatory-associated protein of MTOR, Rptor/Raptor, an essential component of MTORC1, by mating Rptor-floxed mice (Rptorfl/fl) with mice expressing Cre recombinase under the control of the Nphs2/Podocin promoter () [Citation28,Citation39]. To hyperactivate MTORC1 in podocytes, we generated mice lacking Tsc1 (tuberous sclerosis 1; coding for an upstream repressor of MTORC1) by using the same podocyte-specific deletion line (). To monitor autophagosome formation, we crossed these mice to a Gfp-Lc3 reporter strain (Figure S2A) [Citation40]. Surprisingly, the two genetic models of MTORC1 hypo- and hyperactivation showed no difference in the number of autophagosomes compared to WT (-). Next we assessed LC3-II and SQSTM1 levels in glomeruli harvested from these models using magnetic bead perfusion for high purity (,). There was no significant difference in LC3-II or SQSTM1 levels indicating similar levels of basal autophagy in Rptor- or Tsc1-deficient podocytes. The podocyte-specific knockout for Rptor was confirmed in these glomerular lysates (). Since podocytes count for approximately 40% of all glomerular cells the low remaining levels of RPTOR are caused neighboring mesangial cells not affected by Nphs2-Cre-mediated Rptor deletion [Citation41,Citation42]. As expected, Rptor deficiency lowered MTORC1 activity, which was indicated by lower levels of p-RPS6 and lower levels p-EIF4EBP1 (,). Staining for p-RPS6 revealed podocyte-specific inhibition of MTORC1 (Figure S2B). Correspondingly, MTORC1 hyperactivation due to deletion of Tsc1 was indicated by increased phosphorylation of MTORC1 downstream targets RPS6 and EIF4EBP1 (,).
Figure 2. Basal autophagy is independent of MTOR activity in podocytes in vivo. (A) Schematic of generating podocyte-specific deletion of Rptor or Tsc1 using Nphs2-Cre mice and Cre-Lox technique. (B) Cryosections from 2-week-old mice bearing podocyte-specific knockout for Rptor and transgenic for Gfp-Lc3 compared to Gfp-Lc3 WT mice (NID1 in red, GFP-LC3 in green). (C) Quantification of GFP-LC3 autophagosomes per glomerular area out of 30 glomeruli each from 3 mice (ns, not significant). (D) Cryosections from 2-week-old mice bearing podocyte-specific knockout for Tsc1 and transgenic for Gfp-Lc3 compared to Gfp-Lc3 WT mice (NID1 in red, GFP-LC3 in green). (E) Quantification of GFP-LC3 autophagosomes per glomerular area out of 30 glomeruli each from 3 mice (ns, not significant). (F) Western blot out of glomerular lysates obtained from 2-week-old mice for MTORC1 downstream targets and LC3 and SQSTM1 abundance. (G) Densitometry for LC3-II, SQSTM1 and p-RPS6 obtained from 3 WT glomerular lysates and 3 glomerular lysates obtained from 2-week-old mice bearing a podocyte-specific deletion of Rptor or Tsc1, respectively (** ≤ 0.01, * ≤ 0.05, ns, not significant)
Assessment of autophagic flux in glomeruli obtained from mice with podocyte-specific Rptor or Tsc1 deletion with and without chloroquine treatment revealed no difference compared to WT (Figure S2C). To exclude developmental effects of Rptor deficiency on podocyte autophagy, we assessed autophagy in an inducible model of podocyte-specific Rptor deletion by crossing Rptorfl/fl mice to mice harboring a transgenic construct containing Cre recombinase under the control of a tetracycline-responsive regulatory element including a tetracyline operator sequence (tetO) and a second transgenic construct coding for a reverse tetracycline-controlled transactivator (rtTA) under the control of the Nphs2 promoter (Nphs2-rtTA; tetO-Cre mice) (Figure S2D). After induction of podocyte-specific Rptor deletion, we confirmed the knockout and determined LC3-II. Again, WT and Rptor-deficient glomeruli showed no significant difference in LC3-II (Figure S2E,F).
For primary podocyte analysis, we crossed Rptor-floxed mice (Rptorfl/fl) and Tsc1-floxed mice (Tsc1fl/fl) with podocyte-specific Cre expression to a Tomato-EGFP reporter strain (,). This permits the isolation of primary podocytes by fluorescence activated cell sorting (FACS) for in vitro culture (Figure S2G). Due to the suppression of MTORC1, primary Rptor-deficient podocytes showed almost no proliferative capacity; however, they displayed comparable numbers of LC3 puncta in comparison to WT podocytes (,). Profiling of key molecules that regulate autophagy through western blotting was not possible due the paucity of Rptor-deficient podocytes. Instead we applied the proximity ligation assay technique to monitor autophagy. Herein we assessed the association between LC3 and SQSTM1 which is critical to the formation of the autophagosome (see ref [Citation43].) (). Again, there was no detectable difference in autophagosome number between Rptor-deficient cells and their control counterparts (,), indicating no activation of autophagy despite MTORC1 suppression.
Figure 3. Basal autophagy is independent of MTOR activity in podocytes in vitro. (A) Schematic of generating mice with a podocyte-specific knockout for Tsc1 additionally harboring a Tomato-EGFP allele for primary cell isolation. (B) Schematic of generating mice with a podocyte-specific knockout for Rptor additionally harboring a Tomato-EGFP allele for primary cell isolation. (C) Primary podocytes with and without Rptor-deficiency are stained for LC3 in red (green: endogenous fluorescence due to Tomato-EGFP reporter and Nphs2-Cre). (D) Quantification of LC3 signal out of 30 primary podocytes from 3 mice each (ns, not significant). (E) Schematic illustrating proximity-ligation assay (PLA) for SQSTM1 and LC3. (F) Representative image of primary podocytes with and without Rptor and LC3-SQSTM1-PLA signal in red (green: endogenous fluorescence due to Tomato-EGFP reporter and NHPS2-Cre). (G) Quantification of PLA signal from 30 podocytes obtained from 3 mice each (ns, not significant). (H) Primary podocytes with and without Tsc1-deficiency stained for LC3 in red (green: endogenous fluorescence due to Tomato-EGFP reporter and Nphs2-Cre). (I) Quantification of LC3 signal out of 30 primary podocytes from 3 mice each (ns, not significant). (J) Western blot from primary podocytes for abundance of LC3, SQSTM1 and MTORC1 downstream targets. (K) Densitometry from (I) (** ≤ 0.01, ns, not significant)
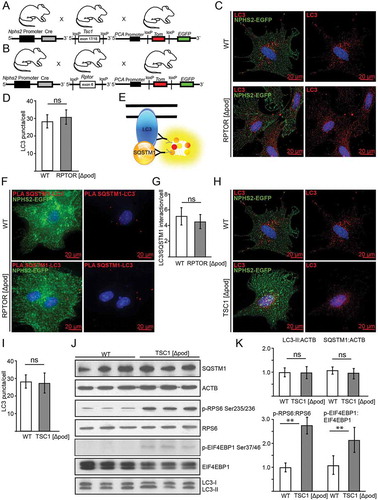
Primary podocytes with MTORC1 hyperactivation due to Tsc1 deficiency showed similar numbers of LC3 puncta (,) and no difference in LC3-II or SQSTM1 levels compared to WT despite high MTORC1 activity (indicated by increased p-RPS6:RPS6 ratio and p-EIF4EBP1:EIF4EBP1 ratio) (,). Autophagic flux was also comparable in WT versus Tsc1-deficient podocytes (Figure S2H–J).
AMPK controls autophagy in podocytes
To investigate AMPK activity in podocytes we first assessed phosphorylation of its subunit 5ʹ-AMP-activated protein kinase catalytic subunit alpha at Thr172 (p-PRKAA Thr172) and of its substrate ACACA (acetyl-Coenzyme A carboxylase alpha) at Ser79 (p-ACACA Ser79). In tissue sections, the highest levels of p-ACACA were found in glomeruli of mice with podocyte-specific deletion of Tsc1, whereas Rptor- deficient podocytes displayed low p-ACACA levels (, quantification in S3A). Accordingly, significantly increased levels of phosphorylated PRKAA and p-PRKAA:PRKAA ratio were found in glomerular lysates obtained from mice with podocyte-specific Tsc1 knockout (,). Impaired MTORC1 formation (due to Rptor deficiency), however, was associated with significantly decreased p-PRKAA levels and lower p-PRKAA:PRKAA ratio compared to WT (,).
Figure 4. AMPK controls autophagy in podocytes. (A) Representative sections from 2-week-old mice bearing podocyte-specific deletion of Rptor or Tsc1 and controls stained for phosphorylated acetyl-CoA carboxylase Ser79 (p-ACACA) in red and NPHS1 (green). (B) Western blot out of glomerular lysates obtained from 2-week-old mice (genotype as indicated) for PRKAA and ULK1 and respective phosphorylation sites. (C) Densitometry for p-PRKAA Thr172 obtained from 3 WT glomerular lysates and 3 glomerular lysates obtained from 2-week-old mice bearing a podocyte-specific deletion of Rptor or Tsc1, respectively (** ≤ 0.01, * ≤ 0.05). (D) Densitometry for p-ULK1 Ser757, p-ULK1 Ser555 and p-ULK1 Ser317 obtained from 3 WT glomerular lysates and 3 glomerular lysates obtained from 2-week-old mice bearing a podocyte-specific deletion of Rptor or Tsc1, respectively (** ≤ 0.01, * ≤ 0.05). (E) Western blot from primary podocytes treated with AICAR (1 mM) for the time indicated (12 h or 24 h) to assess the abundance of p-ULK1 Ser555, p-PRKAA Thr172 and p-RPS6 Ser235/236. (F-H) Densitometry from (E) (** ≤ 0.01, * ≤ 0.05)
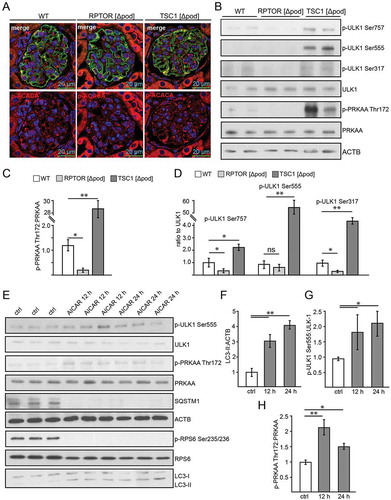
Next we assessed phosphorylation of the key autophagy regulator ULK1 by AMPK and MTORC1. While Ser757 is a target site of MTORC1 inhibiting ULK1 activity, Ser555 and Ser317 are target sites of AMPK with an activating effect on ULK1 and autophagy [Citation44–46]. Glomeruli with podocyte-specific Tsc1 deficiency displayed the highest p-ULK1 Ser757:ULK1 ratio, whereas impaired MTORC1 formation resulted in a significantly decreased p-ULK1 Ser757:ULK1 ratio compared to WT (,). p-ULK1 Ser757:ULK1 ratio indicated enhanced or decreased MTORC1 activity, respectively, and was in line with our findings on p-RPS6 and p-EIF4EBP1 (). AMPK-driven phosphorylation of ULK1 was significantly increased upon MTORC1 hyperactivity (p-ULK1 Ser555, p-ULK1 Ser317), whereas p-ULK1 Ser317 was decreased in Rptor-deficient podocytes compared to WT ().
To test if AMPK sustains autophagy in podocytes, autophagy was assessed in vitro in primary cultured podocytes treated with the AMPK activators 5-aminoimidazole-4-carboxamide ribonucleotide (AICAR) and metformin. Both treatments enhanced autophagy as indicated by increased LC3-II and decreased SQSTM1 abundance (,, Figure S3B). Administration of chloroquine revealed an increase in autophagic flux (Figure S3C,D). As expected, AICAR activated AMPK, as assessed by p-PRKAA Thr172 and ULK1 phosphorylation at the PRKAA target site 555 (,,). Yet, MTORC1 activity was also suppressed by AICAR, as shown by decreased phosphorylation of RPS6. MTORC1 inhibition might contribute to enhanced autophagy in AICAR-treated podocytes.
AMPK stimulates autophagy independently of MTORC1 activity
To further test the role of MTORC1 in AMPK-induced autophagy, primary podocytes lacking Tsc1 and corresponding WT podocytes were treated with AICAR in vitro. AICAR increased autophagy as determined by increased LC3-II and decreased SQSTM1 (,). Chloroquine administration revealed increased autophagic flux (Figure S3D,E). Autophagy induction due to AICAR was comparable in Tsc1-deficient and WT conditions (,, S3D,E). Compared to WT, Tsc1-deficient podocytes treated with vehicle showed at baseline higher levels of AMPK activation as indicated by increased p-PRKAA:PRKAA ratio (,). AICAR enhanced PRKAA phosphorylation at Thr172, and ULK1 was phosphorylated at the known PRKAA phosphorylation sites Ser317 and Ser555 (,). The MTORC1-dependent inhibitory phosphorylation site Ser757 slightly decreased due to AICAR exposure in WT and Tsc1 deficiency and MTORC1 activity was reduced as indicated by decreased levels of phosphorylated RPS6 ().
Figure 5. Activation of AMPK stimulates autophagy independently of MTORC1 activity. (A) Western blot from Tsc1-deficient podocytes and corresponding WT controls with and without AICAR treatment (1 mM, 24 h) to assess the abundance of phosphorylated forms of ULK1 and PRKAA as indicated. (B) Densitometry from (A) (** ≤ 0.01, * ≤ 0.05). (C) Representative section from 2-week-old mice bearing podocyte-specific deletion of Rptor with and without AICAR treatment (500 mg/kg BW 24 h and 4 h before harvest) stained with LC3 (red) and NPHS1/nephrin in green. (D) Representative section from 2-week-old mice bearing podocyte-specific deletion of Rptor with and without AICAR treatment (500 mg/kg BW 24 h and 4 h before harvest) stained with SQSTM1 (red) and NPHS1/nephrin in green. (E) Quantification of LC3 puncta per glomerular area (n = 3 each, 30 glomeruli counted per mouse, * ≤ 0.05). (F) Quantification of SQSTM1 puncta per glomerular area (n = 3 each, 30 glomeruli counted per mouse, * ≤ 0.05). (G) Western blot from glomerular lysates from 2-week-old mice bearing podocyte-specific deletion of Rptor with and without AICAR treatment (500 mg/kg BW 24 h and 4 h before harvest) to assess the abundance of LC3-II. (H) Densitometry from (G) (* ≤ 0.05)
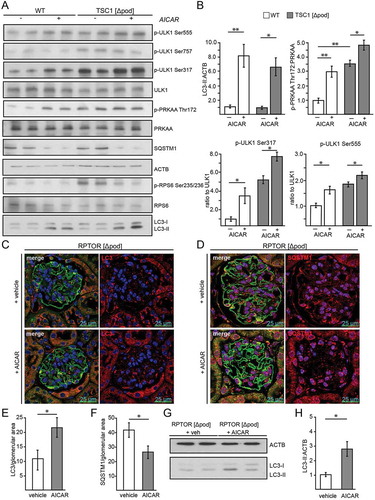
Due to the limited proliferative capacity of Rptor-deficient primary podocytes in vitro, we chose an in vivo approach to test for MTORC1-independent effects of AICAR on autophagy. Therefore, we performed AICAR treatment on mice with a podocyte-specific deletion of Rptor. Liver lysates revealed systemic AMPK activation (Figure S3F). In contrast to WT controls, where p-RPS6 slightly decreased after AICAR administration, in Rptor-deficient podocytes MTORC1 activity could not be further suppressed by AICAR (Figure S3G). Of note, when MTORC1 was inhibited by Rptor knockout, AICAR was able to enhance autophagy, as demonstrated by increased LC3 puncta formation (,) and reduced SQSTM1 abundance (,). Furthermore, glomerular lysates of Rptor-deficient mice showed increased levels of LC3 conversion compared to untreated mice (,). We conclude that in podocytes AMPK can enhance autophagy when MTORC1 is inhibited.
To determine whether AMPK can also enhance autophagy under conditions of MTORC1 hyperactivation in vivo we performed AICAR treatment in mice with podocyte-specific deletion of Tsc1. AICAR induced autophagy indicated by increased glomerular LC3 signal and decreased SQSTM1 (Figure S4A,B, quantification in S5A and S5B). AMPK activation by AICAR was confirmed by glomerular p-ACACA staining and p-ACACA:ACACA ratio obtained from glomerular lysates showing the highest p-ACACA levels in Tsc1 deficiency (Figure S5C–E). Autophagy induction by AICAR was comparable in mice with podocyte-specific Rptor or Tsc1 deficiency and WT controls as indicated by LC3 and SQSTM1 (Figure S4A,B, quantification in S5B). Thus, we conclude that AMPK enhances autophagy under conditions of MTORC1 inhibition or hyperactivation. Therefore, autophagy induction by AMPK is MTORC1-independent in podocytes.
To further confirm the role of AMPK on podocyte autophagy AMPK was inhibited using compound C (also known as 6-[4-{2-Piperidin-1-ylethoxy} phenyl]-3-pyridin-4-ylpyrazolo [1,5-a] pyrimidine), a selective and reversible AMPK inhibitor. Compound C inhibited autophagy and autophagic flux in WT and Tsc1 deficiency (Figure S6A, B). Pharmacological inhibition of ULK1/2 by MRT68,921 (as described in ref [Citation47]) decreased podocyte autophagic flux indicating an important role for ULK1 in maintaining podocyte autophagy (Figure S6C,D).
Effects of acute and long-term pharmacological inhibition of MTORC1 on autophagy
Since the independence of autophagy from genetic manipulation of MTORC1 activity was an unexpected finding and most previous data linking MTORC1 and autophagy have been based on pharmacological inhibition of MTORC1, we aimed next to compare short-term pharmacological effects to constitutive long-term genetic manipulation of MTORC1 activity. To investigate the short-term effect of pharmacological suppression of MTORC1, we treated transgenic Gfp-Lc3 mice with rapamycin () and assessed autophagosome number. Hereby, autophagy levels were increased, indicated by increased numbers of GFP-LC3 puncta (,), higher levels of LC3-II and a decrease in SQSTM1 (,). Expectedly, RPS6 phosphorylation and p-ULK1 Ser757:ULK1 ratio were reduced (,). AMPK was activated as determined by increased p-ULK Ser555 (,). To control the robustness of our experimental readout, mice with podocyte-specific Atg5-deficiency underwent the same treatment regimen with rapamycin without showing any change in autophagy markers (Figure S6E). Also, in MTORC1 hyperactive conditions (podocyte-specific Tsc1 deletion) short-term treatment with rapamycin induced autophagy (Figure S6F) and increased autophagy flux (Figure S6G,H), demonstrating the impact of MTOR signaling pathway in short-term regulation of autophagy. In vivo treatment of Tsc1-deficient mice with rapamycin reduced glomerular p-RPS6 levels (Figure S7A) and activated autophagy (Figure S7B, quantified in Figure S8A,B). The effect of rapamycin on autophagy was slightly but not significantly lower in Tsc1 deficiency compared to WT potentially due to incomplete MTORC1 inhibition.
Figure 6. Effects of acute and long-term pharmacological inhibition of MTORC1 activity on autophagy. (A) Schematic of the short-term treatment regimen (rapamycin vs. vehicle, n = 5 each, rapamycin dose: 10 mg/kg BW i.p. for 3 d). (B) Quantification of GFP-LC3 autophagosomes per glomerular area out of 30 glomeruli each from 5 mice per group (vehicle vs. rapamycin). (C) Representative cryosections from 16-week-old mice transgenic for GFP-LC3 with and without rapamycin treatment (NID1 in red, GFP-LC3 in green, rapamycin dose: 10 mg/kg BW i.p. for 3 d). (D) Representative western blot from glomerular lysates from rapamycin and vehicle treated mice (WT mice, n = 3 each, rapamycin dose: 10 mg/kg BW i.p. for 3 d). (E) Densitometric quantification of (D) (** ≤ 0.01, * ≤ 0.05). (F) Schematic of the long-term treatment regimen (rapamycin dose: 4 mg/kg BW i.p. for 3 weeks). (G) Quantification of serum levels of rapamycin (n = 6 each) (*** ≤ 0.001). (H) Representative western blot from glomerular lysates from rapamycin long-term, short-term and vehicle treated mice. (I) Densitometry from 3 glomerular lysates of each treatment and vehicle controls for LC3-II, SQSTM1 and p-RPS6 Ser235/236 (** ≤ 0.01, ns, not significant). LT, long-term; ST, short-term
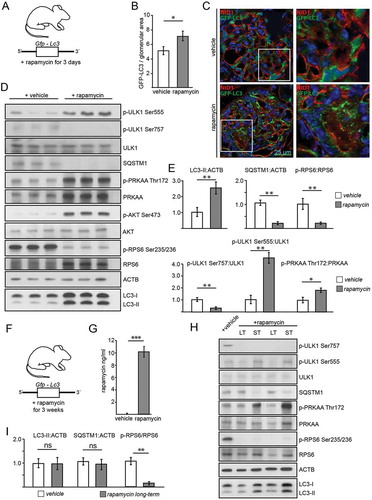
To determine the effects of pharmacological long-term MTORC1 inhibition by rapamycin, we treated Gfp-Lc3 mice with rapamycin for 3 weeks (). We confirmed the efficacy of the treatment through evidencing elevated serum levels of rapamycin in treated animals (). But when autophagy was assessed in glomerular lysates and compared to vehicle or short-term treatment, we found that long-term treatment exhibited no effect on LC3-II or SQSTM1 levels (,). Furthermore, neither autophagosome number (Figure S8C,D) nor SQSTM1 accumulation differed among the long-term treatment group and untreated controls (Figure S8E,F). Additionally, analysis of autophagosomes after lysosomal inhibition with chloroquine did not reveal any difference among the groups with regards to autophagosome number (Figure S9A,B) or SQSTM1 accumulation (Figure S9C,D). Direct comparison of LC3 obtained from glomerular lysates of short-term and long-term treated mice with and without chloroquine revealed increased autophagic flux after short-term treatment but no change after long-term treatment compared to vehicle (Figure S9E–G). Of note, long-term and short-term treatment with rapamycin showed different impact on AMPK activation. AMPK was highly activated in the short-term regimen, whereas after long-term treatment AMPK activity was lowered compared short-term treated mice or to vehicle treated controls ( and S9H). MTORC1 inhibition decreased p-ULK Ser757 levels in both treatment regimens. Activating phosphorylation of ULK1 at Ser555, however, was highly abundant after short-term treatment and lowest after long-term treatment ( and S9H).
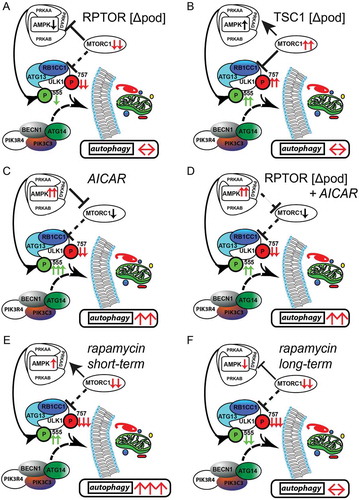
To further compare time-dependent effects of AMPK activation and MTORC1 inhibition on autophagy short-term and long-term treatments with AICAR and rapamycin were performed and analyzed head to head. Comparison of LC3-II and SQSTM1 in glomerular lysates after 3 d of AICAR and rapamycin treatment, respectively, revealed increased autophagy in both treatment conditions (Figure S10A,B). In vitro, AICAR and rapamycin treated primary murine podocytes showed active autophagy and increased autophagic flux after 3 d of treatment (Figure S10C). Long-term administration of rapamycin, however, failed to activate autophagy and autophagic flux whereas AICAR maintained its pro-autophagic effect independent of treatment duration (Figure S10D). Following rapamycin exposure AMPK activity increased after 3 d, however, then decreased in a time-dependent manner in primary podocytes whereas MTORC1 signaling remains suppressed (Figure S10E,F). Long-term pretreatment with rapamycin and AICAR, respectively, followed by short-term AICAR or rapamycin exposure demonstrated maintained pro-autophagic effects of active AMPK signaling independent from MTORC1 activation state corresponding to our findings in Rptor- or Tsc1-deficient podocytes treated with AICAR (Figure S11A–C). In conclusion, we propose that autophagy induction by short-term rapamycin treatment is mediated by both MTORC1 inhibition and AMPK activation. Both pathways synergistically activate ULK1 and thereby induce autophagy (). After long-term rapamycin treatment, however, AMPK is inactive and counteracts the activating signals of MTORC1. Autophagy levels remain unchanged (). Our data demonstrate that the impact of MTORC1 on podocyte autophagy is limited to short-term adaptive response and can be overridden by AMPK activity at any time suggesting AMPK-ULK1 signaling axis as the higher-ranking signaling network for podocyte autophagy control.
Figure 7. Activation of AMPK stimulates autophagy independently of MTOR activity. (A) AMPK activity is reduced if MTORC1 signaling is genetically impaired (activating phosphorylation sites at ULK1 are displayed in green, inhibitory sites are in red). (B) Inhibitory signals on ULK1 by genetically induced MTORC1 hyperactivity are compensated by active AMPK signaling. (C) Pharmacological activation of AMPK is able to induce autophagy in podocytes by activating ULK1. (D) MTORC1 can be bypassed in autophagy regulation as it occurs in the genetic model of MTORC1 inhibition by direct phosphorylation of ULK1 by AMPK. (E) Short-term treatment with rapamycin inhibits MTORC1 activity and activates AMPK leading to increased levels of autophagy. (F) Long-term treatment with rapamycin is compensated by reduced AMPK signaling in regard to autophagy regulation
Discussion
ESRD is a global burden affecting over 2 million people worldwide relying on dialysis treatment or undergoing renal transplantation [Citation48,Citation49]. Glomerular diseases and diabetic nephropathy (DN) are the leading cause for ESRD in developed countries, indicating the importance of intact glomeruli and podocytes for maintaining renal integrity [Citation50]. Autophagy has emerged as the key maintenance mechanism in podocytes as evidenced in various experimental and human proteinuric kidney diseases such as diabetic nephropathy, APOL1 (apolipoprotein L1)-associated focal segmental glomerulosclerosis (FSGS), membranous nephropathy, IgA nephropathy and M. Fabry [Citation4,Citation5,Citation27,Citation51,Citation52]. While basal autophagy levels are already high [Citation5], it appears that further pharmacological activation of autophagy can provide additional beneficial effects, e.g. as short term treatment in situations of severe podocyte stress in acute inflammatory glomerular diseases. Safety concerns regarding further elevation of already high levels of autophagy in podocytes seem to be a minor issue because none of the published experimental models of constitutively upregulated autophagy exhibited a renal phenotype under basal conditions [Citation53,Citation54]; however, a critical first step is to develop an understanding of the signaling cascades that regulate this process in podocytes.
The MTOR signaling pathway is recognized as the major regulator of autophagy, as demonstrated in yeast, drosophila and mammalians [Citation23–25,Citation55,Citation56]. MTORC1 inhibits autophagy-initiating ULK1 complex by phosphorylating among others ULK1 at Ser757 in mice (Ser758 of human ULK1) leading to reduced ULK1 kinase activity and suppressed autophagy induction [Citation23–25,Citation44,Citation57]. Since stress response of podocytes as observed in glomerular disease includes both upregulation of autophagy and increased MTORC1 activity, this indicates an uncoupling of MTOR and autophagy in these cells [Citation5,Citation28]. In line, we observed similar levels of autophagy in genetic models of podocyte-specific MTORC1 hypo- and hyperactivation and under long-term pharmacological inhibition of MTORC1 formation, suggesting the existence of an additional signaling layer for regulating this important pathway for cellular maintenance. Previous studies propose different mechanisms allowing for this uncoupling of autophagy and MTORC1 activity or rapamycin action e.g. spatial coupling of MTOR and autophagy (see ref [Citation58].) or increased MTORC1 stabilization counteracting rapamycin effects under long-term exposure [Citation59]; however, in podocytes, we identified the AMPK signaling pathway directly regulating ULK1 activity as a key regulatory axis governing autophagy in podocytes independent of MTORC1 activity and provide first in vivo evidence for this recently proposed mechanism [Citation44–46].
Crosstalk of AMPK and MTOR occurs at different levels of autophagy regulation (for reviews, see ref [Citation60–63].). AMPK signaling is proposed to act upstream of MTORC1 with low nutrient supply activating AMPK which then activates the TSC complex leading to MTORC1 inhibition and autophagy activation (for a review, see [Citation64]). Additionally, AMPK can directly inhibit MTORC1 activity by phosphorylating RPTOR [Citation65]. More downstream, ULK1 acts as a signaling hub orchestrating signaling inputs from MTORC1 and AMPK. In response to starvation, ULK1 is rapidly dephosphorylated, in particular at the Ser757 MTORC1 target site, leading to autophagy induction [Citation44,Citation57]. Furthermore, phosphorylation of ULK1 at Ser317 and Ser777 by AMPK activates autophagy [Citation44]. Besides initiating autophagy, the role of ULK1 is even more complex. In a feedback loop ULK1 is able to phosphorylate RPTOR and thereby maintains inhibition of MTORC1 if nutrient availability is reduced and autophagy is activated [Citation66]. Furthermore, ULK1/2 is able to phosphorylate all three subunits of AMPK inhibiting its activity and thereby acting as a negative feedback regulation of autophagy [Citation67]. To unravel this complex interplay of AMPK, MTORC1 and ULK1 we combined genetic and pharmacological approaches to identify the major regulatory signaling axis for podocyte autophagy regulation.
In our genetic models, AMPK counteracts MTORC1 function in regard to autophagy regulation leading to maintained levels of basal autophagy (, ). In MTORC1 hypoactivation AMPK activity is found to be decreased (). Reduced inhibitory phosphorylation at ULK1 at Ser757 due to abolished MTORC1 formation is outbalanced by reduced activating signal at Ser555 and autophagy levels are maintained. These maintained levels of autophagy seem to be in contrast to previous studies describing impaired autophagy due to disturbed autophagolysosomal reformation in podocytes lacking MTOR [Citation68,Citation69]. Complete deletion of MTOR as performed in these studies additionally impacts MTORC2 which then might further disturb cellular lysosome homeostasis [Citation70,Citation71]. In our genetic models, however, lysosomal inhibition by chloroquine did not uncover differences in autophagic flux compared to WT suggesting limited differential impact of MTORC1 on lysosomal function and no critical effect on autophagy refreshment due to MTORC1 in podocytes.
In MTORC1 hyperactivation, AMPK is activated thereby driving autophagy (). AMPK activation might potentially occur due to changes in the cellular metabolic state affecting AMP:ATP ratio if Tsc1 is lacking as it has been reported in Tsc1-deficient macrophages [Citation72]. Activating phosphorylation of ULK1 by AMPK compensate for inhibitory MTORC1 signal and levels of autophagy finally remain unaffected.
The impact of AMPK on podocyte autophagy becomes most apparent when AMPK is activated by AICAR. Activating sites of ULK1 at Ser317 and Ser555 are phosphorylated and active AMPK concomitantly inhibits MTORC1 activity leading to high levels of autophagy (). Interestingly, this concomitant MTORC1 inhibition turned out to be dispensable for autophagy activation as demonstrated in mice bearing a podocyte-specific deletion of Rptor (). Although autophagy activation by AMPK-dependent phosphorylation of ULK1 at Ser317 and Ser555 has been described in vitro (see ref [Citation44–46]), our data now provide the first in vivo evidence and point to the important role of ULK1 for autophagy regulation.
Furthermore, our findings in genetic models of MTORC1 hypo- and hypoactivation reflect a time dependent impact of MTORC1 on autophagy regulation (,). In contrast to short-term MTORC1 inhibition, long-term treatment with rapamycin failed to induce sustained autophagy activation due to reduced activating signals on ULK1 by AMPK as observed in mice with podocyte-specific deletion of Rptor. Again, AMPK counteracts MTORC1 function in regard to autophagy regulation.
Thus, our data highlight a tight control by upstream signaling events (i.e. MTORC1 and AMPK signaling) leading to persistent basal autophagy levels in podocytes. Seen at the level of cellular evolution this unique mode of autophagy regulation seems to be crucial for the establishment of the particularly highly differentiated and long-lived structures of the kidney filter. Next to the detailed genetic manipulation of MTOR future studies also including a genetic – and not only pharmacological interference of AMPK signaling – would further deepen the understanding of the role of AMPK in this system independent from issues of compound specificity of AICAR or compound C or duration of treatment.
Inducing autophagy in podocytes might be a potential treatment approach to cure or at least prevent renal disease. MTOR inhibitors have known autophagy-inducing properties; however, there are several concerns about these compounds from a renal perspective. Beside severe systemic effects on the immune system and fertility, MTOR inhibitors suppress MTORC1-driven adaptive hypertrophy in podocytes and thereby lead to podocyte loss and proteinuria and in some cases even to FSGS [Citation73–78]. Furthermore, our genetic models and different treatment regimens showed that short-term effects targeting MTORC1 in podocytes failed to induce a sustained activation of autophagy. Instead we suggest that AMPK activating agents might provide an alternative treatment rationale to prevent podocyte disease, as they are effective in inducing autophagy even if MTOR signaling is impaired.
Due to the tight crosstalk of AMPK and MTORC1 activity in podocytes under physiological conditions, targeting downstream molecules like ULK1 might be a promising approach to induce autophagy to counteract various glomerular diseases without disturbing podocyte cell homeostasis.
Materials and methods
Mice
Mice bearing Tsc1 flox (exons 17 and 18) or Rptor flox alleles (exon 6) have been previously reported [Citation30,Citation79,Citation80]. Nphs2/Podocin-Cre+ mice were provided by L. Holzman (Renal, Electrolyte and Hypertension Division, University of Pennsylvania School of Medicine, Philadelphia, PA, USA) [Citation39]. Rptor-floxed mice (Rptorfl/fl) and Tsc1-floxed mice (Tsc1fl/fl) were crossed with Nphs2-Cre+ mice to generate podocyte-specific rptor or tsc1 knockout mice (Rptorfl/fl;Nphs2-Cre+, RPTOR [Δpod], Tsc1fl/fl;Nphs2-Cre+, TSC1 [Δpod], respectively). WT;Nphs2-Cre+ and Tsc1fl/fl;Nphs2-Cre− or Rptorfl/fl;Nphs2-Cre− littermates served as controls. TSC1 [Δpod] mice and RPTOR [Δpod] mice were subsequently crossed to Gfp-Lc3 transgenic mice, which have been previously reported [Citation40]. All mice were crossed on a pure C57BL/6 background which is known to be relatively resistant to kidney injury. To focus on signaling effects on autophagy in intact podocytes RPTOR [Δpod], TSC1 [Δpod] and WT mice were harvested at the age of 2 weeks, i.e. a time point prior to the development of proteinuria to avoid other severe phenotypic effects due to Rptor or Tsc1 knockout secondarily affecting autophagy.
Nphs2-rtTA;tetO-Cre+ mice were provided by S. Quaggin (Samuel Lunenfeld Research Institute, Mount Sinai Hospital, University of Toronto, Canada) [Citation81]. To generate doxycycline-inducible podocyte-specific Rptor knockout mice (Rptorfl/fl;Nphs2-rtTA;tetO-Cre+) Rptor-floxed mice (Rptorfl/fl) were crossed with Nphs2-rtTA;tetO-Cre+ mice. TetO-Cre− littermates served as a control. For the induction of Rptor deletion, 12-week-old Rptorfl/fl;Nphs2-rtTA;tetO-Cre+ mice received doxycycline (Sigma-Aldrich, D9891) via drinking water (2 mg/ml with 5% sucrose, protected from light) for a total of 14 d.
Mice bearing an Atg5 flox allele (flanked exon 3) have been previously reported [Citation82]. Atg5fl/fl mice were crossed with Nphs2-Cre+ mice to generate podocyte-specific Atg5 knockout mice (Atg5fl/fl;Nphs2-Cre+, ATG5 [Δpod]). WT;Nphs2-Cre+ and Atg5 fl/fl;Nphs2-Cre− littermates served as controls.
To monitor autophagic flux, Rfp-Gfp-Lc3 mice were sacrificed after 16 weeks. For a review, see ref [Citation34]. To assess autophagic flux in vivo, Gfp-Lc3 mice were harvested 4 h after chloroquine (Cq) administration i.p. 100 mg Cq/kg body weight (BW) (Sigma-Aldrich, C6628).
AICAR treatments have been performed with 500 mg/kg BW 24 h and 4 h before harvest (see ref [Citation83]). For rapamycin treatment mice received either 4 or 10 mg/kg BW for long term (3 weeks) or short term (3 d) treatment, respectively. Different doses were used due to pharmacokinetics (loading dose for short term use) [Citation84]. Treatments have been performed in Tsc1fl/fl;Nphs2-Cre+, Rptorfl/fl,Nphs2-Cre+ and Atg5fl/fl;Nphs2-Cre+ mice and corresponding controls at the age of 2 weeks (no further phenotype at this time point). Gfp-Lc3 and Rfp-Gfp-Lc3 mice were 4 months old if not mentioned otherwise. Rapamycin and AICAR were purchased from Sigma Aldrich (Sigma Aldrich, 553210) and Santa Cruz Biotechnology (Santa Cruz Biotechnology, sc-200659), respectively, and both administered i.p.
To isolate primary podocytes Rptorfl/fl;Nphs2-Cre+ and Tsc1fl/fl;Nphs2-Cre+ were further crossed to Tomato-EGFP reporter mice. Gt(ROSA)26Sortm4(ACTB-td-,-EGFP)Luo/J mice were purchased from Jackson Laboratory (Bar Harbor, ME). Raptorfl/fl;Tomato-EGFP;Nphs2-Cre+ and Tsc1fl/fl;Tomato-EGFP;Nphs2-Cre+ and WT;Tomato-EGFP; Nphs2-Cre+ were chosen for primary cell isolation. All animal studies were approved by the Committee on Research Animal Care Regierungspraesidium Freiburg and by INSERM according to the French veterinary guidelines respectively.
Primary cell isolation and cultivation
Isolation of primary podocytes was performed as recently described [Citation85]. To specifically label podocytes, conditional mouse lines were crossed to a well-established reporter mouse strain [Citation86]. Expression of Cre-recombinase results in specific activation of EGFP in targeted cell populations.
To generate primary podocytes, first glomeruli were isolated from non-proteinuric 12–14 d-old pups and cultivated in standard podocyte culture medium RPMI 1640 (Thermo Fisher Scientific, 2187034) supplemented with 10% fetal calf serum, penicillin-streptomycin (Thermo Fisher Scientific, 15140122) and insulin/transferrin/selenite (Roche, 11074547001). After 5 d of expansion, cells were trypsinized and transferred to Hanks Buffered Salt Solution (Gibco Life Technologies/Invitrogen, 14025092) supplemented with 0.1% bovine serum albumin (BSA; Serva, 11930). Cell suspension was then sorted using FACS (MoFloTM cell sorter, Beckmann Coulter) and only EGFP-positive cells were further cultivated. Cultivation was performed using standard podocyte culture medium and cells were plated on COL4/collagen IV (Sigma-Aldrich, C6745)-coated flasks or dishes (Corning, 3000 and 353003).
Primary podocytes were treated with AICAR (1 mM) for 24 h. To inhibit MTORC1 in vitro podocytes were treated with rapamycin 1 µM for 6 h. Compound C (Sigma-Aldrich, P5499) was applied at a dose of 5 µM for 2 h. ULK1/2 inhibition was achieved by using MRT 68921 (Tocris, 5780) at 10 µM for 12 h (see ref [Citation47]).
Staining of primary podocytes
After FACS procedure, cells were seeded on collagen-coated cover slips. 24 h later cells were fixed with paraformaldehyde and stained with mouse anti-LC3 (MBL, mAb M152-3).
Immunofluorescence staining
Kidneys frozen in Tissue-Tek OCTTM (Sakura, SA62550-01) were cyrosectioned at 5 μm (Leica Kryostat). Sections were fixed with 4% paraformaldehyde. Nonspecific protein binding was blocked with phosphate-buffered saline (PBS; Thermo Scientific, 10010023) containing 5% BSA. Sections were incubated for 1 h with primary antibodies (rat anti-NID1/nidogen-1/entactin [Novus, NBP1-977001], rabbit anti-GFP [Biozol/MBL, 598]). After washing with PBS, fluorophore-conjugated secondary antibodies (Invitrogen, A-21434 and A-11008) were applied for 30 min.
For paraffin sections, kidneys were fixed in 4% paraformaldehyde, embedded in paraffin, and cut in 3 μm. After dehydration, antigen heat retrieval was performed at pH 6. Blocking was performed using PBS containing 5% BSA. Sections were incubated for 1 h with primary antibodies rabbit anti-LC3B (Cell Signaling Technology, 2775), guinea pig anti-SQSTM1 (Progen, GP62-C), rabbit anti-pRPS6 Ser235/236 (Cell Signaling Technology, 4857), rabbit anti-p-ACAC/acetyl-CoA carboxylase Ser79 (Cell Signaling Technology, 3661), rabbit anti-NPHS2/podocin (Sigma, P0372), guinea pig anti-NPHS1/nephrin (Progen, GP-N2). After washing with PBS, fluorophore-conjugated secondary antibodies (Invitrogen A-21428, A-11008 or A-21435) were applied for 30 min. Images were taken using a Zeiss laser scan microscope or a Zeiss fluorescence microscope equipped with a 20 × and a 63 × water immersion objective. Signal was quantified using ImageJ (NIH) out of 30 glomeruli per mouse if not mentioned otherwise. For the assessment of p-ACACA signal integrated density was normalized to the intensity observed in WT glomeruli.
In vivo two-photon assessment of autophagy
Four-month-old GFP-LC3 mice were anaesthetized with ketamine (100 mg/kg) and xylazine (10 mg/kg). After placing a tracheal tube and cannulating the jugular vein 70 kDa Texas Red dextran (Thermo Fisher Scientific, D1830) was injected to label the vasculature. The left kidney was exposed by a flank incision and the animal then further placed on the microscope stage as described [Citation87,Citation88]. Images have been acquired using inverted Zeiss LSM710 NLO multiphoton confocal fluorescence microscope.
Glomerular isolation and antibodies used for western blot
Glomeruli of non-proteinuric 12- to 14-d-old mice were isolated using DynabeadTM perfusion (Thermo Fisher Scientific, 14203; described in refs [Citation89,Citation90]) and were glass-glass homogenized in lysis buffer (RIPA buffer, composition: 50 mM TRIS hydrochloride pH7.5, 1 mM EGTA, 1 mM EDTA, 1% Triton X-100, 0.1% SDS, 50 mM NaF, 150 mM NaCl, 0.5% Sodium deoxycholate, 0.1% mercaptoethanol, 1mM sodium orthovanadate) [Citation91]. After centrifugation (15,000 g for 15 min at 4°C), protein concentration was determined by BCA-Assay (Pierce, 23225). Equal amounts of protein were separated by SDS-PAGE. Following antibodies were used for western blot: mouse anti-ACTB/β-actin (Sigma-Aldrich, A5441), rabbit anti-ULK1 (Cell Signaling Technology, 8054), rabbit anti-p-ULK1 Ser757 (Cell Signaling Technology, 6888), rabbit anti-p-ULK1 Ser555 (Cell Signaling Technology, 5869), rabbit anti-p-ULK1 Ser317 (Cell Signaling Technology, 6887; discontinued), rabbit anti-PRKAA/AMPKα (Cell Signaling Technology, 2532), rabbit anti-p-PRKAA/AMPKα Thr172 (Cell Signaling Technology, 4188), guinea pig anti-SQSTM1 (Progen, GP62-C), rabbit anti-LC3B (Cell Signaling Technology, 2775), rabbit anti-RPS6 (Cell Signaling Technology, 2217), rabbit anti-p-RPS6 Ser235/236 (Cell Signaling Technology, 4857), rabbit anti-RPTOR/Raptor (Cell Signaling Technology, 2280), rabbit anti-p-ACAC/acetyl-CoA carboxylase Ser79 (Cell Signaling Technology, 3661), rabbit anti-EIF4EBP1/4E-BP1 (Cell Signaling Technology, 9452), rabbit anti-p-EIF4EBP1/4E-BP1 Thr37/46 (Cell Signaling Technology, 2855).
Immortalized human podocytes
Podocytes were kindly provided by Moin Saleem (Bristol Medical School, University of Bristol, Bristol, UK) and transduced to stably express GFP-LC3 via lentiviral expression vector (kind gift of Noboru Mizushima, Department of Biochemistry and Molecular Biology, University of Tokyo, Japan). Podocytes were cultured as previously described (see ref [Citation92]) and seeded in RPMI 1640 (Thermo Fisher Scientific, 2187034) supplemented with 10% fetal calf serum, insulin/transferrin/selenite, penicillin/streptomycin (Roche, 11074547001), pyruvate, 100x minimal essential medium and HEPES (4-[2-hydroxyethyl]-1-piperazineethanesulfonic acid) buffer (all Life technologies, 11360070, 11140050 and 15630080, respectively). When cells had grown to 60% confluence differentiation was induced at 37°C for 10–14 d. Cultured human podocytes were fully differentiated before any treatment.
Immortalized human proximal tubular cells
HK 2 cells were purchased from ATCC and transduced to stably express GFP-LC3 via lentiviral expression vector (kind gift of Noboru Mizushima, University of Tokyo). Cells were cultured as described [Citation93].
Proximity-ligation assay
Proximity-ligation assay (PLA) was performed following the manufacturer`s instructions (Olink Bioscience). In brief, primary podocytes were seeded on COL4/collagen IV-coated diagnostic microscope slides (8 well, 6 mm, Thermo Scientific 10609251). After 24 h cells were fixed with paraformaldehyde and stained with anti LC3 (MBL, mouse, M152-3) and SQSTM1 (Santa Cruz Biotechnology,5114). PLA was performed using Duolink® In Situ PLA Probe Anti-Mouse PLUS and using Duolink® In Situ PLA® Probe Anti-Rabbit MINUS following the manufacturer`s instructions (Sigma, 92001 and 92005). Imaging was performed using a Zeiss Axiovert 200M microscope, equipped with AxioCam MRc5 digital video camera and ApoTome immunofluorescence apparatus (Carl Zeiss SpA, Arese, Italy). Images were recorded using AxioVision software 4.3 and analyzed by ImageJ. Signal of 40 cells were analyzed per experiment; 3 experiments were performed.
Sirolimus serum levels
Serum levels of sirolimus (rapamycin) were obtained using LC-MS/MS. Analysis was kindly performed by Division of Clinical Chemistry, Department of Medicine, University Medical Center Freiburg.
Statistical analysis
Data were expressed as the mean ± standard deviation (SD). All experiments were performed at least 3 times. Statistical comparisons were performed with the program Excel using 2-tailed Student`s t test and with Graphpad Prism for ANOVA (Figure S5F, Figure S7A,B, Figure S8F,G), respectively. Differences with p ≤ 0.05 were considered significant and marked as *, p ≤ 0.01 was marked as **.
Correction Statement
This article has been republished with minor changes. These changes do not impact the academic content of the article.
Supplemental Material
Download Zip (23.6 MB)Acknowledgments
The authors thank Professor Noboru Mizushima (Department of Biochemistry and Molecular Biology, University of Tokyo) for sharing the transgenic Gfp-Lc3 and Atg5 flox mouse strains. This study was funded by the Deutsche Forschungsgemeinschaft (DFG, German Research Foundation) collaborative research centers (CRC/SFB) 1140 (project number 246781735 to T.B.H.), CRC 1192 (to T.B.H.) and CRC 992 (to T.B.H.), Heisenberg program (T.B.H.), HU 1016/5-1 and HU 1016/8-2 (to T.B.H.); by the European Research Council (ERC grant to T.B.H.), and by the H2020-IMI2 consortium Biomarker Enterprise to Attack Diabetic Kidney Disease (BEAt-DKD) and this Joint Undertaking receives support from the European Union’s Horizon 2020 research and innovation programme and EFPIA with JDRF (115974; to TBH); by the Bundesministerium für Bildung und Forschung, STOP Fokale Segmentale Glomerulosklerose (BMBF-STOP-FSGS) (T.B.H.); by the Excellence Initiative of the German Federal and State Governments (BIOSS, T.B.H.; and the Freiburg Institute for Advanced Studies FRIAS, T.B.H. and P.L.T.), by the Alexander von Humboldt Foundation and the Uehara Memorial Foundation (to K.Y.), by the National Natural Science Foundation of China (81470912 to W.L.), by an EFSD award supported by Novartis (OL), by the Berta Ottenstein Programm (C.S.) and by the Else Kröner Fresenius Stiftung, Nierenfunktionsstörungen als Komplikation von Systemerkrankungen (NAKSYS) (T.B., C.S. and T.B.H.). K.T. acknowledges support from the BMBF e:Med initiatives GlioPATH (01ZX1402B) and MAPTor-NET (031A426B); the German TS Foundation (call 2017); the Stichting TSC Fonds (calls 2015 and 2017); the German Research Foundation (TH 1358/3-1); the MESI-STRAT project (grant agreement No. 754688) and the PoLiMeR Innovative Training Network (Marie Skłodowska-Curie grant agreement No. 812616) which both have received funding from the European Union’s Horizon 2020 research and innovation programme. K.T. is recipient of a Rosalind-Franklin-Fellowship of the University of Groningen, and of the TSC Research Award 2017 of the German TS Foundation.
Disclosure statement
No potential conflict of interest was reported by the authors.
Supplemenatry material
Supplementary data for this article can be accessed here.
Additional information
Funding
References
- Hill NR, Fatoba ST, Oke JL, et al. Global prevalence of chronic kidney disease - a systematic review and meta-analysis. PLoS One. 2016;11(7):e0158765.
- Miner JH. Focusing on the glomerular slit diaphragm: podocin enters the picture. Am J Pathol. 2002;160(1):3–5.
- Wanner N, Hartleben B, Herbach N, et al. Unraveling the role of podocyte turnover in glomerular aging and injury. J Am Soc Nephrol. 2014;25(4):707–716.
- Kawakami T, Gomez IG, Ren S, et al. Deficient autophagy results in mitochondrial dysfunction and FSGS. J Am Soc Nephrol. 2015;26(5):1040–1052.
- Hartleben B, Godel M, Meyer-Schwesinger C, et al. Autophagy influences glomerular disease susceptibility and maintains podocyte homeostasis in aging mice. J Clin Invest. 2010;120(4):1084–1096.
- Choi AM, Ryter SW, Levine B. Autophagy in human health and disease. N Engl J Med. 2013;368(7):651–662.
- Noda NN, Inagaki F. Mechanisms of autophagy. Annu Rev Biophys. 2015;44:101–122.
- Boya P, Reggiori F, Codogno P. Emerging regulation and functions of autophagy. Nat Cell Biol. 2013;15(7):713–720.
- Axe EL, Walker SA, Manifava M, et al. Autophagosome formation from membrane compartments enriched in phosphatidylinositol 3-phosphate and dynamically connected to the endoplasmic reticulum. J Cell Biol. 2008;182(4):685–701.
- Lamb CA, Yoshimori T, Tooze SA. The autophagosome: origins unknown, biogenesis complex. Nat Rev Mol Cell Biol. 2013;14(12):759–774.
- Ge L, Schekman R. The ER-Golgi intermediate compartment feeds the phagophore membrane. Autophagy. 2014;10(1):170–172.
- Kabeya Y, Mizushima N, Ueno T, et al. LC3, a mammalian homologue of yeast Apg8p, is localized in autophagosome membranes after processing. Embo J. 2000;19(21):5720–5728.
- Klionsky DJ, Abdelmohsen K, Abe A, et al. Guidelines for the use and interpretation of assays for monitoring autophagy (3rd edition). Autophagy. 2016;12(1):1–222.
- Hurley JH, Young LN. Mechanisms of autophagy initiation. Annu Rev Biochem. 2017;86:225–244.
- Mizushima N, Noda T, Yoshimori T, et al. A protein conjugation system essential for autophagy. Nature. 1998;395(6700):395–398.
- Mizushima N, Yoshimori T, Ohsumi Y. Mouse Apg10 as an Apg12-conjugating enzyme: analysis by the conjugation-mediated yeast two-hybrid method. FEBS Lett. 2002;532(3):450–454.
- Proikas-Cezanne T, Waddell S, Gaugel A, et al. WIPI-1alpha (WIPI49), a member of the novel 7-bladed WIPI protein family, is aberrantly expressed in human cancer and is linked to starvation-induced autophagy. Oncogene. 2004;23(58):9314–9325.
- Schaaf MB, Keulers TG, Vooijs MA, et al. LC3/GABARAP family proteins: autophagy-(un)related functions. Faseb J. 2016;30(12):3961–3978.
- Popelka H, Klionsky DJ. Analysis of the native conformation of the LIR/AIM motif in the Atg8/LC3/GABARAP-binding proteins. Autophagy. 2015;11(12):2153–2159.
- Joachim J, Jefferies HB, Razi M, et al. Activation of ULK kinase and autophagy by GABARAP trafficking from the centrosome is regulated by WAC and GM130. Mol Cell. 2015;60(6):899–913.
- Wong PM, Puente C, Ganley IG, et al. The ULK1 complex: sensing nutrient signals for autophagy activation. Autophagy. 2013;9(2):124–137.
- Mizushima N. The role of the Atg1/ULK1 complex in autophagy regulation. Curr Opin Cell Biol. 2010;22(2):132–139.
- Jung CH, Jun CB, Ro SH, et al. ULK-Atg13-FIP200 complexes mediate mTOR signaling to the autophagy machinery. Mol Biol Cell. 2009;20(7):1992–2003.
- Ganley IG, Lam Du H, Wang J, et al. ULK1.ATG13.FIP200 complex mediates mTOR signaling and is essential for autophagy. J Biol Chem. 2009;284(18):12297–12305.
- Hosokawa N, Hara T, Kaizuka T, et al. Nutrient-dependent mTORC1 association with the ULK1-Atg13-FIP200 complex required for autophagy. Mol Biol Cell. 2009;20(7):1981–1991.
- Tagawa A, Yasuda M, Kume S, et al. Impaired podocyte autophagy exacerbates proteinuria in diabetic nephropathy. Diabetes. 2016;65(3):755–767.
- Lenoir O, Jasiek M, Henique C, et al. Endothelial cell and podocyte autophagy synergistically protect from diabetes-induced glomerulosclerosis. Autophagy. 2015;11(7):1130–1145.
- Godel M, Hartleben B, Herbach N, et al. Role of mTOR in podocyte function and diabetic nephropathy in humans and mice. J Clin Invest. 2011;121(6):2197–2209.
- Huber TB, Edelstein CL, Hartleben B, et al. Emerging role of autophagy in kidney function, diseases and aging. Autophagy. 2012;8(7):1009–1031.
- Inoki K, Mori H, Wang J, et al. mTORC1 activation in podocytes is a critical step in the development of diabetic nephropathy in mice. J Clin Invest. 2011;121(6):2181–2196.
- Zschiedrich S, Bork T, Liang W, et al. Targeting mTOR signaling can prevent the progression of FSGS. J Am Soc Nephrol. 2017. DOI:10.1681/asn.2016050519.
- Laplante M, Sabatini DM. mTOR signaling in growth control and disease. Cell. 2012;149(2):274–293.
- Kimura S, Noda T, Yoshimori T. Dissection of the autophagosome maturation process by a novel reporter protein, tandem fluorescent-tagged LC3. Autophagy. 2007;3(5):452–460.
- Li L, Wang ZV, Hill JA, et al. New autophagy reporter mice reveal dynamics of proximal tubular autophagy. J Am Soc Nephrol. 2014;25(2):305–315.
- Codogno P, Meijer AJ. Autophagy in the liver. J Hepatol. 2013;59(2):389–391.
- Cursio R, Colosetti P, Codogno P, et al. The role of autophagy in liver diseases: mechanisms and potential therapeutic targets. Biomed Res Int. 2015;2015:480508.
- Mizushima N, Yoshimori T, Levine B. Methods in mammalian autophagy research. Cell. 2010;140(3):313–326.
- Klionsky DJ, Abdalla FC, Abeliovich H, et al. Guidelines for the use and interpretation of assays for monitoring autophagy. Autophagy. 2012;8(4):445–544.
- Moeller MJ, Sanden SK, Soofi A, et al. Podocyte-specific expression of cre recombinase in transgenic mice. Genesis. 2003;35(1):39–42.
- Mizushima N, Yamamoto A, Matsui M, et al. In vivo analysis of autophagy in response to nutrient starvation using transgenic mice expressing a fluorescent autophagosome marker. Mol Biol Cell. 2004;15(3):1101–1111.
- Wiggins JE, Goyal M, Sanden SK, et al. Podocyte hypertrophy, “adaptation,” and “decompensation” associated with glomerular enlargement and glomerulosclerosis in the aging rat: prevention by calorie restriction. J Am Soc Nephrol. 2005;16(10):2953–2966.
- Dey N, Ghosh-Choudhury N, Das F, et al. PRAS40 acts as a nodal regulator of high glucose-induced TORC1 activation in glomerular mesangial cell hypertrophy. J Cell Physiol. 2010;225(1):27–41.
- Bjorkoy G, Lamark T, Brech A, et al. p62/SQSTM1 forms protein aggregates degraded by autophagy and has a protective effect on huntingtin-induced cell death. J Cell Biol. 2005;171(4):603–614.
- Kim J, Kundu M, Viollet B, et al. AMPK and mTOR regulate autophagy through direct phosphorylation of Ulk1. Nat Cell Biol. 2011;13(2):132–141.
- Egan DF, Shackelford DB, Mihaylova MM, et al. Phosphorylation of ULK1 (hATG1) by AMP-activated protein kinase connects energy sensing to mitophagy. Science. 2011;331(6016):456–461.
- Egan D, Kim J, Shaw RJ, et al. The autophagy initiating kinase ULK1 is regulated via opposing phosphorylation by AMPK and mTOR. Autophagy. 2011;7(6):643–644.
- Petherick KJ, Conway OJ, Mpamhanga C, et al. Pharmacological inhibition of ULK1 kinase blocks mammalian target of rapamycin (mTOR)-dependent autophagy. J Biol Chem. 2015;290(18):11376–11383.
- Couser WG, Remuzzi G, Mendis S, et al. The contribution of chronic kidney disease to the global burden of major noncommunicable diseases. Kidney Int. 2011;80(12):1258–1270.
- Eggers PW. Has the incidence of end-stage renal disease in the USA and other countries stabilized? Curr Opin Nephrol Hypertens. 2011;20(3):241–245.
- Bommer J. Prevalence and socio-economic aspects of chronic kidney disease. Nephrol Dial Transplant. 2002;17(Suppl 11):8–12.
- Beckerman P, Bi-Karchin J, Park AS, et al. Transgenic expression of human APOL1 risk variants in podocytes induces kidney disease in mice. Nat Med. 2017;23(4):429–438.
- Chevrier M, Brakch N, Celine L, et al. Autophagosome maturation is impaired in Fabry disease. Autophagy. 2010;6(5):589–599.
- Fernandez AF, Sebti S, Wei Y, et al. Disruption of the beclin 1-BCL2 autophagy regulatory complex promotes longevity in mice. Nature. 2018;558(7708):136–140.
- Pyo JO, Yoo SM, Ahn HH, et al. Overexpression of Atg5 in mice activates autophagy and extends lifespan. Nat Commun. 2013;4:2300.
- Noda T, Ohsumi Y. Tor, a phosphatidylinositol kinase homologue, controls autophagy in yeast. J Biol Chem. 1998;273(7):3963–3966.
- Scott RC, Schuldiner O, Neufeld TP. Role and regulation of starvation-induced autophagy in the Drosophila fat body. Dev Cell. 2004;7(2):167–178.
- Shang L, Chen S, Du F, et al. Nutrient starvation elicits an acute autophagic response mediated by Ulk1 dephosphorylation and its subsequent dissociation from AMPK. Proc Natl Acad Sci U S A. 2011;108(12):4788–4793.
- Narita M, Young AR, Arakawa S, et al. Spatial coupling of mTOR and autophagy augments secretory phenotypes. Science. 2011;332(6032):966–970.
- Nyfeler B, Bergman P, Triantafellow E, et al. Relieving autophagy and 4EBP1 from rapamycin resistance. Mol Cell Biol. 2011;31(14):2867–2876.
- Alers S, Loffler AS, Wesselborg S, et al. Role of AMPK-mTOR-Ulk1/2 in the regulation of autophagy: cross talk, shortcuts, and feedbacks. Mol Cell Biol. 2012;32(1):2–11.
- Kim YC, Guan KL. mTOR: a pharmacologic target for autophagy regulation. J Clin Invest. 2015;125(1):25–32.
- Roach PJ. AMPK -> ULK1 -> autophagy. Mol Cell Biol. 2011;31(15):3082–3084.
- Dunlop EA, Tee AR. mTOR and autophagy: a dynamic relationship governed by nutrients and energy. Semin Cell Dev Biol. 2014;36:121–129.
- Mihaylova MM, Shaw RJ. The AMPK signalling pathway coordinates cell growth, autophagy and metabolism. Nat Cell Biol. 2011;13(9):1016–1023.
- Gwinn DM, Shackelford DB, Egan DF, et al. AMPK phosphorylation of raptor mediates a metabolic checkpoint. Mol Cell. 2008;30(2):214–226.
- Dunlop EA, Hunt DK, Acosta-Jaquez HA, et al. ULK1 inhibits mTORC1 signaling, promotes multisite Raptor phosphorylation and hinders substrate binding. Autophagy. 2011;7(7):737–747.
- Loffler AS, Alers S, Dieterle AM, et al. Ulk1-mediated phosphorylation of AMPK constitutes a negative regulatory feedback loop. Autophagy. 2011;7(7):696–706.
- Cina DP, Onay T, Paltoo A, et al. Inhibition of MTOR disrupts autophagic flux in podocytes. J Am Soc Nephrol. 2012;23(3):412–420.
- Cina DP, Onay T, Paltoo A, et al. MTOR regulates autophagic flux in the glomerulus. Autophagy. 2012;8(4):696–698.
- Arias E, Koga H, Diaz A, et al. Lysosomal mTORC2/PHLPP1/Akt regulate chaperone-mediated autophagy. Mol Cell. 2015;59(2):270–284.
- Berchtold D, Piccolis M, Chiaruttini N, et al. Plasma membrane stress induces relocalization of Slm proteins and activation of TORC2 to promote sphingolipid synthesis. Nat Cell Biol. 2012;14(5):542–547.
- Pan H, Zhong XP, Lee S. Sustained activation of mTORC1 in macrophages increases AMPKalpha-dependent autophagy to maintain cellular homeostasis. BMC Biochem. 2016;17(1):14.
- Schell C, Kretz O, Liang W, et al. The rapamycin-sensitive complex of mammalian target of rapamycin is essential to maintain male fertility. Am J Pathol. 2016;186(2):324–336.
- Pinheiro HS, Amaro TA, Braga AM, et al. Post-rapamycin proteinuria: incidence, evolution, and therapeutic handling at a single center. Transplant Proc. 2006;38(10):3476–3478.
- Izzedine H, Brocheriou I, Frances C. Post-transplantation proteinuria and sirolimus. N Engl J Med. 2005;353(19):2088–2089.
- Perlman AS, Kim EH, Kallakury B, et al. Clinically significant proteinuria following the administration of sirolimus to renal transplant recipients. Drug Metab Lett. 2007;1(4):267–271.
- Pallet N, Legendre C. Adverse events associated with mTOR inhibitors. Expert Opin Drug Saf. 2013;12(2):177–186.
- Letavernier E, Bruneval P, Mandet C, et al. High sirolimus levels may induce focal segmental glomerulosclerosis de novo. Clin J Am Soc Nephrol. 2007;2(2):326–333.
- Polak P, Cybulski N, Feige JN, et al. Adipose-specific knockout of raptor results in lean mice with enhanced mitochondrial respiration. Cell Metab. 2008;8(5):399–410.
- Mori H, Inoki K, Munzberg H, et al. Critical role for hypothalamic mTOR activity in energy balance. Cell Metab. 2009;9(4):362–374.
- Eremina V, Jefferson JA, Kowalewska J, et al. VEGF inhibition and renal thrombotic microangiopathy. N Engl J Med. 2008;358(11):1129–1136.
- Hara T, Nakamura K, Matsui M, et al. Suppression of basal autophagy in neural cells causes neurodegenerative disease in mice. Nature. 2006;441(7095):885–889.
- Buzzai M, Jones RG, Amaravadi RK, et al. Systemic treatment with the antidiabetic drug metformin selectively impairs p53-deficient tumor cell growth. Cancer Res. 2007;67(14):6745–6752.
- Mahalati K, Kahan BD. Clinical pharmacokinetics of sirolimus. Clin Pharmacokinet. 2001;40(8):573–585.
- Schell C, Baumhakl L, Salou S, et al. N-wasp is required for stabilization of podocyte foot processes. J Am Soc Nephrol. 2013;24(5):713–721.
- Muzumdar MD, Tasic B, Miyamichi K, et al. A global double-fluorescent Cre reporter mouse. Genesis. 2007;45(9):593–605.
- Kang JJ, Toma I, Sipos A, et al. Quantitative imaging of basic functions in renal (patho)physiology. Am J Physiol Renal Physiol. 2006;291(2):F495–502.
- Hackl MJ, Burford JL, Villanueva K, et al. Tracking the fate of glomerular epithelial cells in vivo using serial multiphoton imaging in new mouse models with fluorescent lineage tags. Nat Med. 2013;19(12):1661–1666.
- Takemoto M, He L, Norlin J, et al. Large-scale identification of genes implicated in kidney glomerulus development and function. Embo J. 2006;25(5):1160–1174.
- Boerries M, Grahammer F, Eiselein S, et al. Molecular fingerprinting of the podocyte reveals novel gene and protein regulatory networks. Kidney Int. 2013;83(6):1052–1064.
- Takemoto M, Asker N, Gerhardt H, et al. A new method for large scale isolation of kidney glomeruli from mice. Am J Pathol. 2002;161(3):799–805.
- Saleem MA, O’Hare MJ, Reiser J, et al. A conditionally immortalized human podocyte cell line demonstrating nephrin and podocin expression. J Am Soc Nephrol. 2002;13(3):630–638.
- Ryan MJ, Johnson G, Kirk J, et al. HK-2: an immortalized proximal tubule epithelial cell line from normal adult human kidney. Kidney Int. 1994;45(1):48–57.