
ABSTRACT
Although macroautophagy/autophagy is involved in hepatocellular carcinoma (HCC) initiation and development and has been identified as a mechanism of HCC therapy resistance, the role of ULK1 (unc-51 like autophagy activating kinase 1) in HCC remains unclear. Here, we report that both knockdown and knockout of ULK1 inhibited human HCC cell proliferation and invasion, and Ulk1 deletion abrogated tumor growth in a xenograft mouse model. Furthermore, ULK1 ablation in combination with sorafenib significantly inhibited HCC progression compared with sorafenib treatment alone or vehicle control. To identify candidate ULK1 inhibitors, we used a structure-based virtual docking approach to screen 3428 compounds. Among these compounds, XST-14 showed the highest affinity for the ULK1 protein and specifically blocked ULK1 kinase activity. Moreover, the Lys46, Tyr94 and Asp165 amino acid residues of ULK1 were required for its binding to XST-14 according to molecular docking and mutagenesis experiments. Functional assays revealed that XST-14 blocked autophagy and subsequently induced apoptosis and inhibited growth in HCC cells. More importantly, XST-14 acted synergistically with sorafenib to attenuate HCC progression by inhibiting sorafenib-induced autophagy activation both in vitro and in vivo. In addition, XST-14 was well tolerated and exhibited favorable drug metabolism and pharmacokinetic properties and low toxicity in mice. In summary, our study determined that ULK1 may represent a new therapeutic target for HCC and that targeting ULK1 in combination with sorafenib treatment may serve as a promising interventional strategy for treating HCC.
Abbreviations: 3MA: 3-methyladenine; ADV: AutoDock Vina; ATP: adenosine triphosphate; EdU: 5-ethynyl-2′-deoxyuridine; ESI: electrospray ionization; HCC: hepatocellular carcinoma; IC50: half maximal inhibitory concentration; KD: kinase domain; q.o.d., every other day; SDS-PAGE, sodium dodecyl sulfate-polyacrylamide gel electrophoresis; SPR, surface plasmon resonance.
Introduction
Primary liver cancer is the fifth most common cancer worldwide and the third most common cause of cancer-related mortality [Citation1]. Hepatocellular carcinoma (HCC) is the most common primary liver malignancy. Although hepatic resection and liver transplantation may offer a cure or prolonged life span, the prognosis of HCC patients is extremely poor due to high recurrence, metastasis, and chemoresistance rates [Citation2,Citation3]. Sorafenib, a receptor tyrosine kinase inhibitor that targets RAF isoforms, KDR/VEGFR (kinase insert domain receptor), and PDGFR (platelet derived growth factor receptor), was approved as the standard therapy for advanced, unresectable HCC [Citation4]. However, sorafenib provides only modest beneficial effects, prolonging survival in HCC patients for a median of 7.9–10.7 months [Citation5]. Thus, developing new effective therapies and identifying novel diagnostic and prognostic biomarkers for HCC are necessary.
Autophagy is a conserved intracellular degradation process in which cellular organelles, proteins, and invading microbes are degraded by lysosomes. Induced autophagy has been recently identified as a resistance mechanism to HCC therapy [Citation6–Citation8], indicating that targeting autophagy is a promising therapeutic strategy in HCC patients. The protein ULK1 (unc-51 like autophagy activating kinase 1) acts as a key regulator of autophagy. ULK1 has been reported to improve the prognostic assessment of HCC [Citation9]; however, its role in autophagy and HCC progression and treatment remain unclear. Moreover, there are few chemical reagents available for disrupting ULK1, and none have been pursued for clinical translation. Given that ULK1 activation initiates autophagy and that autophagy induction is a cell survival mechanism for many tumors, the inhibition of ULK1 kinase activity and subsequent decrease in autophagic activity may present an additional HCC therapy alternative.
Under sorafenib stress, autophagy is activated in HCC cells upon autophagosome accumulation and mechanistic target of rapamycin kinase complex 1 (MTORC1) pathway inhibition [Citation10,Citation11]. However, autophagy activation confers a survival advantage to HCC cells undergoing sorafenib treatment and may be an attractive strategy for HCC treatment [Citation12]. Although ULK1-mediated autophagy activation was reported to confer resistance to bromodomain and extra-terminal motif (BET) inhibitors in acute myeloid leukemia stem cells [Citation13], prior studies targeting autophagy have focused on lysosomal inhibitors that may have nonspecific effects. The definite role of ULK1 in sorafenib or multidrug resistance in HCC has not been demonstrated, indicating that ULK1 may participate in the mechanism of acquired resistance to anti-HCC therapy.
In this study, we thus proposed that ULK1 acts as a biomarker of HCC progression. First, we investigated the effects of ULK1 depletion on the proliferation and invasion of HCC cells and the combined effects of ULK1 depletion and sorafenib in HCC both in vitro and in vivo. We then used a structure-based virtual docking approach to screen a compound library and identified XST-14 as a highly selective ULK1 inhibitor; we next evaluated its role in autophagy and HCC progression. Our study highlights that targeting ULK1 could be an effective therapeutic strategy for combating drug resistance in HCC and other types of cancer.
Results
Loss of ULK1 suppresses HCC progression and increases HCC sensitivity to sorafenib
To explore the role of ULK1 in HCC, we first silenced ULK1 expression with siRNAs in HCC cell lines (Hep3B) and primary human HCC cells. The gene knockdown efficiency of the ULK1-siRNAs was detected, and the ULK1 protein levels in cells transfected with ULK1-siRNAs were clearly decreased (). Silencing ULK1 inhibited the proliferation activities of these two cell types (). Furthermore, ULK1 knockout was induced in HCC cells using the CRISPR/Cas9 system, and ULK1 deletion inhibited the proliferation and invasion of HepG2 cells compared with the control conditions (). We then wondered whether ULK1 was important for the tumorigenicity of HCC cells in vivo. HepG2 cells with or without ULK1 deletion were injected subcutaneously into nude mice, and the tumor volumes and weights were examined. The tumor weights were substantially lower in nude mice inoculated with ULK1 [Cas9] cells () than in nude mice inoculated with ULK1 [Con] cells. ULK1 knockout also suppressed the tumor growth of HepG2 cells in nude mice but did not reduce their body weights (). These data indicated that targeting ULK1 may produce anti-HCC effects.
Figure 1. ULK1 depletion suppresses HCC progression in vitro and in vivo. (A) ULK1 depletion in HCC cells. Hep3B and primary HCC cells were transfected with the indicated siRNAs. After 24 h of transfection, the cell lysates were detected by western blotting with the indicated antibodies. (B) ULK1 silencing inhibited HCC cell proliferation. Hep3B and primary HCC cells were transfected with the indicated siRNAs, and proliferation activity was evaluated via EdU assays. (C, D) ULK1 knockout inhibited the proliferation and invasion of HCC cells. The proliferation and invasion activities of ULK1 [Con] and ULK1 [Cas9] HepG2 cells were evaluated via CCK-8 (C) and transwell (D) assays. (E-H) ULK1 deletion inhibited HCC growth in vivo. The data represent the quantified tumor weight (E), tumor growth curves (F), fluorescence area (G), and body weight (H) of the indicated groups. For panels a-d, the data are presented as representative and/or means ± s.e.m. of three independent assays. An unpaired two-sided Student’s t-test was used to compare two groups. **p < 0.01, ***p < 0.001.
![Figure 1. ULK1 depletion suppresses HCC progression in vitro and in vivo. (A) ULK1 depletion in HCC cells. Hep3B and primary HCC cells were transfected with the indicated siRNAs. After 24 h of transfection, the cell lysates were detected by western blotting with the indicated antibodies. (B) ULK1 silencing inhibited HCC cell proliferation. Hep3B and primary HCC cells were transfected with the indicated siRNAs, and proliferation activity was evaluated via EdU assays. (C, D) ULK1 knockout inhibited the proliferation and invasion of HCC cells. The proliferation and invasion activities of ULK1 [Con] and ULK1 [Cas9] HepG2 cells were evaluated via CCK-8 (C) and transwell (D) assays. (E-H) ULK1 deletion inhibited HCC growth in vivo. The data represent the quantified tumor weight (E), tumor growth curves (F), fluorescence area (G), and body weight (H) of the indicated groups. For panels a-d, the data are presented as representative and/or means ± s.e.m. of three independent assays. An unpaired two-sided Student’s t-test was used to compare two groups. **p < 0.01, ***p < 0.001.](/cms/asset/8f169881-a34b-4637-bc69-99c190af46ef/kaup_a_1709762_f0001_c.jpg)
Sorafenib-induced autophagy activation confers a survival advantage to HCC [Citation10]. We found that sorafenib treatment indeed induced autophagy activation in HCC cells, as indicated by the increased number of autophagic vacuoles (). We further tested the effects of the autophagy inhibitor 3-methyladenine (3-MA) alone, sorafenib alone, and 3-MA + sorafenib on LC3-II levels and invasion in HepG2 cells. Sorafenib treatment increased LC3-II levels in HCC cells, whereas the combination of 3-MA and sorafenib minimized this effect (). Moreover, the combination of 3-MA and sorafenib increased the anti-invasion effects of sorafenib (), indicating that autophagy inhibition plus sorafenib may constitute an attractive strategy for HCC treatment. Similarly, EdU incorporation assays showed that ULK1 depletion also increased the antiproliferation effects of sorafenib in Hep3B and primary HCC cells (). Moreover, CCK-8 and transwell assays were used to analyze the antiproliferation and anti-invasion effects of sorafenib in ULK1 [Con] HepG2 cells and ULK1 [Cas9] HepG2 cells. Sorafenib obviously suppressed the proliferation and invasion of ULK1 [Cas9] HepG2 cells compared with that of ULK1 [Con] HepG2 cells (). These data suggested that ULK1 ablation increased sorafenib sensitivity in HCC.
Figure 2. ULK1 depletion increases the therapeutic effects of sorafenib in vitro and in vivo. (A) Sorafenib induced autophagy in HepG2 cells. HepG2 cells were treated with sorafenib (5 μM) for 12 h. The data are representative TEM images of three independent assays. The arrows indicate Avd. The ratio of autophagic vacuole area to the cytoplasmic area was determined by morphometric analysis. (B) The effects of 3-MA (2 mM), sorafenib (5 μM), 3-MA (2 mM) + sorafenib (5 μM) on the LC3-II levels in HepG2 cells. (C) Autophagy inhibition increased the anti-invasion effects of sorafenib in HepG2 cells. HepG2 cells were evaluated via transwell assays with the indicated treatments (sorafenib: 5 μM; 3-MA: 2 mM) for 24 h. (D, E) ULK1 silencing increased the antiproliferation effects of sorafenib. Hep3B and primary HCC cells were transfected with the indicated siRNAs. After 24 h of transfection, the cells were treated with sorafenib for 24 h, and proliferation activity was evaluated via EdU assays. (F, G) ULK1 depletion increased the therapeutic effects of sorafenib in vitro. ULK1 [Con] and ULK1 [Cas9] HepG2 cells were treated with sorafenib (5 μM) for 24 h, and proliferation and invasion activities were evaluated via CCK-8 (F) and transwell (G) assays. (H-K) ULK1 depletion increased the therapeutic effects of sorafenib in vivo. The data represent the body weight growth (H), quantified tumor weight (I), tumor growth curves (J), and fluorescence area and photographs of representative tumors (K). For panel A-G, the data are presented as representative and/or means ± s.e.m. of three independent assays. For panel H-K, the data are the mean ± s.e.m. (n = 10 per group). For panel A, an unpaired two-sided Student’s t-test was used to compare two groups. For panels B, C, D, E, F, G, H, I, J, and K, one-way ANOVA was used to compare multiple groups. *p < 0.05, **p < 0.01, ***p < 0.001.
![Figure 2. ULK1 depletion increases the therapeutic effects of sorafenib in vitro and in vivo. (A) Sorafenib induced autophagy in HepG2 cells. HepG2 cells were treated with sorafenib (5 μM) for 12 h. The data are representative TEM images of three independent assays. The arrows indicate Avd. The ratio of autophagic vacuole area to the cytoplasmic area was determined by morphometric analysis. (B) The effects of 3-MA (2 mM), sorafenib (5 μM), 3-MA (2 mM) + sorafenib (5 μM) on the LC3-II levels in HepG2 cells. (C) Autophagy inhibition increased the anti-invasion effects of sorafenib in HepG2 cells. HepG2 cells were evaluated via transwell assays with the indicated treatments (sorafenib: 5 μM; 3-MA: 2 mM) for 24 h. (D, E) ULK1 silencing increased the antiproliferation effects of sorafenib. Hep3B and primary HCC cells were transfected with the indicated siRNAs. After 24 h of transfection, the cells were treated with sorafenib for 24 h, and proliferation activity was evaluated via EdU assays. (F, G) ULK1 depletion increased the therapeutic effects of sorafenib in vitro. ULK1 [Con] and ULK1 [Cas9] HepG2 cells were treated with sorafenib (5 μM) for 24 h, and proliferation and invasion activities were evaluated via CCK-8 (F) and transwell (G) assays. (H-K) ULK1 depletion increased the therapeutic effects of sorafenib in vivo. The data represent the body weight growth (H), quantified tumor weight (I), tumor growth curves (J), and fluorescence area and photographs of representative tumors (K). For panel A-G, the data are presented as representative and/or means ± s.e.m. of three independent assays. For panel H-K, the data are the mean ± s.e.m. (n = 10 per group). For panel A, an unpaired two-sided Student’s t-test was used to compare two groups. For panels B, C, D, E, F, G, H, I, J, and K, one-way ANOVA was used to compare multiple groups. *p < 0.05, **p < 0.01, ***p < 0.001.](/cms/asset/ec5145ae-9557-47e0-8084-6dbe7aedf201/kaup_a_1709762_f0002_c.jpg)
Furthermore, we investigated the effects of ULK1 deletion on sorafenib-induced HCC growth inhibition in vivo. Consistent with a previous study, sorafenib reduced HepG2 tumor weights and growth compared to control vehicle treatment (). In addition, no significant loss in body weight was observed in the ULK1 [Cas9] and ULK1 [Con] groups receiving sorafenib treatment (). The tumor growth of the ULK1 [Cas9] HepG2 cells was further inhibited by sorafenib treatment (). These data indicated that ULK1 deletion increases the antiproliferation effects of sorafenib and that targeting ULK1 in combination with sorafenib may produce anti-HCC effects.
Discovery of small molecules for ULK1 inhibition
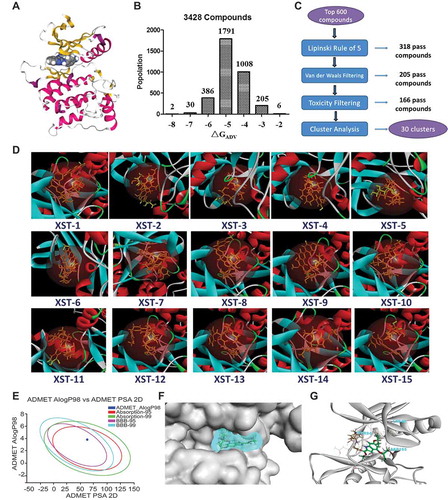
As ULK1 is an attractive target for small molecule modulation and has potential roles in HCC progression, we sought to identify specific small molecule inhibitors of this kinase () by using a structure-based virtual docking approach to screen a compound library of our group and the National Cancer Institute Diversity Set 2. A total of 3428 compounds docked to ULK1 according to AutoDock Vina (ADV). The virtual screening results were sorted based on the predicted binding free energies (ΔGADV), which ranged from −2.8 to −8.1 kcal/mol. Of these compounds, 12.2% had energies < −6.0 kcal/mol (). The 600 top-scoring compounds were filtered using Lipinski’s rule of five, resulting in 282 rejected poses. Van der Waals filtering was applied to remove compounds with steric clashes. The remaining 205 compounds were subjected to toxicity filtering, and the resulting 166 compounds were grouped via hierarchical clustering using a simple matching coefficient, Ward’s clustering linkage, and a distance of 0.8. This resulted in 30 clusters (). Approximately 2–5 compounds per cluster were selected by visual inspection based on (1) important ligand interactions with key residues of the binding site and (2) the toxicity and pharmacokinetic prediction of the compound by absorption, distribution, metabolism, and excretion (ADMET) Alog98, Absorption-95, Absorption-99, BBB-95, and BBB-99 (). Subsequently, 15 compounds were selected for in vitro assay testing ( and S1).
Figure 3. Structure-based virtual screening for the discovery of ULK1 inhibitors. (A) The overall structure of ULK1. The key features are the phosphorylated threonine in the activation loop, the inhibitor, and the interlobe loop. (B) Results from virtual screening (using AutoDock Vina) of a compound library of our group and the National Cancer Institute Diversity Set 2 against ULK1. The bars represent the numbers of the diversity set compounds with predicted free energies of binding in the indicated 1 kcal/mol bins. (C) Workflow for candidate drug compound selection. (D) Surface view of the 15 selected compounds bound to ULK1. The compound is shown in yellow. (E) Toxicity and pharmacokinetics of XST-14 (as an example) according to ADMET Alog98, Absorption-95, Absorption-99, BBB-95, and BBB-99. (F) Surface view of XST-14 (as an example) bound to ULK1. The compound is shown in blue with a spherical rendering. (G) Close-up view of XST-14 bound to ULK1. The electron density is from a Fo − Fc difference map contoured at 3σ. The key residues that contact the inhibitor are labeled. XST-14 is shown in green.
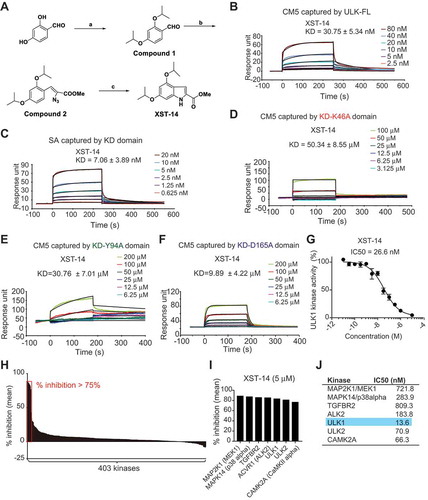
We chemically synthesized or commercially purchased these 15 compounds. Among these compounds, a new compound, XST-14, showed the highest affinity for the full-length ULK1 protein according to a Biacore assay (). The synthesis method for XST-14 is shown in . We further found that XST-14 specifically bound to the KD of ULK1 () at the nanomolar level. A detailed examination of the predicted binding sites of XST-14 with ULK1 showed that XST-14 might form H-bonds with Lys46, Tyr94, and Asp165 of ULK1 (the docking pose is shown in ). Hydrogen bond formation might occur because Lys46 and Tyr94 are electron acceptors, and Asp165 is an electron donor (the docking pose is shown in Figure S2). To assess the contribution of these amino acid sites to ULK1-XST-14 binding, the predicted ULK1 binding sites were substituted with alanine. We found that mutating the Lys46, Tyr94, and Asp165 residues obviously abolished or diminished ULK1 binding to XST-14, indicating that these sites are critical for selective binding to the ULK1 kinase (). To test the ability of XST-14 to block ULK1 kinase activity, we performed an in vitro ULK1 kinase activity assay and found that XST-14 inhibited ULK1 kinase activity in a concentration-dependent manner (). In addition, the specificity of XST-14 was examined in a competition-binding assay using SelectScreen Kinase Profiling Services ( and Table S1). XST-14 (5 μM) inhibited 6 out of 403 kinases by at least 75%, including ULK1 (). Notably, all the kinases inhibited by XST-14 (MAP2K1/MEK1, MAPK14/p38 alpha, TGFBR2, ACVR1/ALK2, ULK1, ULK2 and CAMK2A) were serine/threonine-specific protein kinases. Moreover, the only known functional ULK1 homolog in mammals, ULK2, was inhibited almost as well as ULK1 in this assay (). Indeed, the 10-point titration results from SelectScreen Kinase Profiling Services revealed that the IC50 value of XST-14 toward ULK1 was 13.6 nM, whereas the corresponding IC50 values of XST-14 toward MAP2K1/MEK1, MAPK14/p38 alpha, TGFBR2, ACVR1/ALK2, ULK2 and CAMK2A were 721.8, 283.9, 809.3, 183.8, 70.9, and 66.3 nM, respectively (). Collectively, these data indicate that XST-14 is a novel, potent and highly selective ULK1 inhibitor.
Figure 4. XST-14 is a potent ULK1 kinase inhibitor that binds to the KD of ULK1. (A) Chemical structure and chemical synthesis route of XST-14, a ULK1 competitive kinase inhibitor. (B) The kinetic interactions of XST-14 and the ULK1 protein were determined by surface plasmon resonance (SPR) analyses. The indicated concentrations of XST-14 were passed over immobilized ULK1 on CM5 sensor chips. The affinity constants were evaluated using BIAevaluation software. (C) The kinetic interactions of XST-14 and the KD truncation of the ULK1 protein were determined by SPR analyses. The indicated concentrations of XST-14 were passed over immobilized KD on streptavidin (SA) sensor chips. The affinity constants were evaluated using BIAevaluation software. (D-F) The kinetic interactions of the mutated KD and XST-14 were determined by SPR analyses. The indicated concentrations of XST-14 were passed over the immobilized mutants of the KD on CM5 sensor chips. The affinity constants were evaluated using BIAevaluation software. (G) The half maximal inhibitory concentration (IC50) for XST-14 against ULK1 was determined using an in vitro kinase assay. XST-14 was tested in triplicate in a 12-dose IC50 mode with a starting dose of 100 μM. The data are the means ± SEM. (H, I) The kinase selectivity profile for XST-14 was determined using SelectScreen Kinase Profiling Services. Briefly, XST-14 was screened at a 5 μM dose for its ability to impair the binding of a panel of 403 kinases to the substrate in an in vitro binding assay. The red box indicates >75% inhibition. (J) The summary of IC50 measurements for each kinase is presented in this table.
XST-14 suppresses HCC progression by inhibiting autophagy
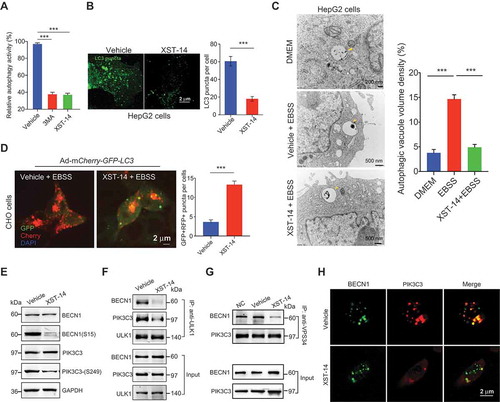
To test the ability of XST-14 to block autophagy, CHO cells stably expressing GFP-LC3 were first used to monitor autophagy activity. We found that XST-14 strongly inhibited the conversion of LC3-I to LC3-II (). The number of GFP-LC3 puncta in HepG2 cells was dramatically decreased by XST-14 treatment (). XST-14 treatment decreased autophagosome formation () and blocked autophagosome/lysosome fusion (). Considering that activated ULK1 phosphorylates BECN1/Beclin 1 and thus enhances the activity of ATG14-containing PIK3C3/VPS34 complexes following amino acid starvation or MTOR inhibition [Citation14], we further confirmed that 5 μM XST-14 inhibited the Ser249 phosphorylation of PIK3C3 and Ser15 phosphorylation of BECN1 (). Furthermore, XST-14 reduced the interaction between ULK1 and its downstream targets PIK3C3 and BECN1 () and destabilized the PIK3C3 and BECN1 protein complex upon starvation-induced autophagy, as revealed by co-IP and colocalization experiments (). These data suggested that XST-14 inhibits autophagy by reducing ULK1 kinase activity.
Figure 5. XST-14 induces autophagy inhibition by reducing the phosphorylation of the ULK1 downstream substrate. (A) XST-14 deceased LC3-I conversion to LC3-II. CHO cells stably expressing GFP-LC3 were incubated with XST-14 (5 μM) or 3-MA (2 mM) for 12 h and analyzed by flow cytometry. The fluorescence intensity is directly correlated with LC3-II levels. (B) Representative images of HepG2 cells infected with GFP-LC3 adenovirus with or without the presence of XST-14 (5 μM) for 12 h. (C) TEM images showing the autophagic vacuoles (arrows) observed in HepG2 cells that were starved with Earle’s balanced salt solution (EBSS) for 4 h and treated with or without XST-14 (5 μM) for 12 h. The ratio of the autophagic vacuole area to the cytoplasmic area was determined by morphometric analysis. (D) The effect of XST-14 on autophagic flux. The microscopy images show red-colored autolysosomes or red/green double-colored autophagosomes. (E) XST-14 decreased the phosphorylation of BECN1 and PIK3C3. HepG2 cells were treated with XST-14 (5 μM) for 12 h, and the cell lysates were analyzed by immunoblotting. (F) XST-14 decreased the interaction between ULK1 and its downstream targets PIK3C3 and BECN1. HepG2 cells were starved with EBSS for 4 h and treated with XST-14 (5 μM) for 12 h, and the cell lysates were immunoprecipitated (IP) with anti-ULK1 and analyzed by immunoblotting with the indicated Ab. (G) XST-14 decreased the interaction of BECN1 and PIK3C3. HepG2 cells were starved with EBSS for 4 h and treated with XST-14 (5 μM) for 12 h, and the cell lysates were IP with anti-PIK3C3 and analyzed by immunoblotting with an anti-BECN1 Ab. (H) XST-14 decreased the colocalization of BECN1 (green) and PIK3C3 (red). The colocalization of BECN1 and PIK3C3 was detected in HepG2 cells (scale bar, 2 μm) with immunostaining. For panels B, C, D and H, the figures are representative of more than 10 images, and 10–20 cells were counted in each group. The data are presented as representative and/or means ± s.e.m. of three independent assays. For panels B and D, an unpaired two-sided Student’s t-test was used to compare two groups. For panels A and C, one-way ANOVA was used to compare multiple groups. ***p < 0.001.
We next investigated the effects of XST-14 or the synergistic effects of XST-14 and sorafenib on HCC cell proliferation and invasion. The exposure of HepG2 cells to various concentrations of XST-14 led to a decrease in cell proliferation activity (). Moreover, XST-14 decreased the cell invasion activity of HepG2 cells, primary HCC cells freshly isolated from patient tumors, and Hep3B cells (). Similarly, XST-14 induced apoptosis in HepG2 and human primary HCC cells (). However, ULK1 deletion obviously impaired the effects of XST-14 on autophagy (Figure S3A), cell death (Figure S3B) and proliferation (Figure S3C) in HCC cells, suggesting that the suppression of ULK1 activity is essential for the anti-HCC effects of XST-14 and that XST-14 has high specificity for ULK1.
Figure 6. XST-14 acts synergistically with sorafenib to suppress HCC in vitro. (A) XST-14 inhibited HepG2 cell proliferation. HepG2 cells were treated with vehicle or the indicated concentration of XST-14 for 24 h, and cell proliferation was evaluated via EdU assays. (B, C) XST-14 inhibited the invasion of HCC cells. HepG2, Hep3B, and human primary HCC cells were treated with vehicle or XST-14 (5 μM). After treatment for 24 h, cell invasion activity was evaluated via transwell assays. (D, E) XST-14 induced HCC cell apoptosis. HepG2 and human primary cells were treated with vehicle or XST-14 (5 μM). After treatment for 24 h, apoptotic cells were evaluated via ANXA5/propidium iodide staining. (F) XST-14 inhibited sorafenib-induced autophagy in HepG2 cells. The arrows indicate Avd. The ratio of the autophagic vacuole area to the cytoplasmic area was determined by morphometric analysis. (G, H) XST-14 increased the therapeutic effects of sorafenib in vitro. HepG2 cells were treated with XST-14 (5 μM) or a combination of XST-14 (5 μM) and sorafenib (5 μM) for 24 h, and proliferation and invasion activities were evaluated via EdU (G) and transwell (H) assays. The data are presented as representative and/or means ± s.e.m. of three independent assays. For panels A, B, C, D, and E, an unpaired two-sided Student’s t-test was used to compare two groups. For panels F, G, and H, one-way ANOVA was used to compare multiple groups. *p < 0.05, **p < 0.01, ***p < 0.001.
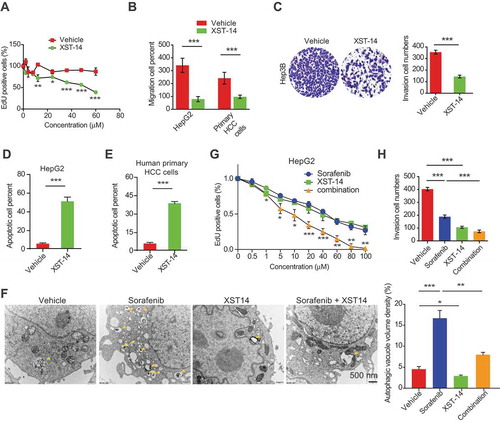
Additionally, XST-14 impeded the autophagy activation induced by sorafenib (), and the combination of sorafenib and XST-14 enhanced the therapeutic efficacy of sorafenib in HCC cells (). Sorafenib is a multikinase inhibitor with activity against RAF kinase and several receptor tyrosine (Tyr) kinases. We next examined whether sorafenib inhibits ULK1 and ULK2 kinase activities by using SelectScreen Kinase Profiling Services. The data showed that 5 μM sorafenib had no effect on the kinase activities of ULK1 and ULK2 (% inhibition < 4%, Figure S4), revealing that the combined anticancer effects of XST-14 and sorafenib were produced by their respective ULK1 and Tyr kinase inhibition.
The combination of XST-14 and sorafenib tosylate eradicates HCC
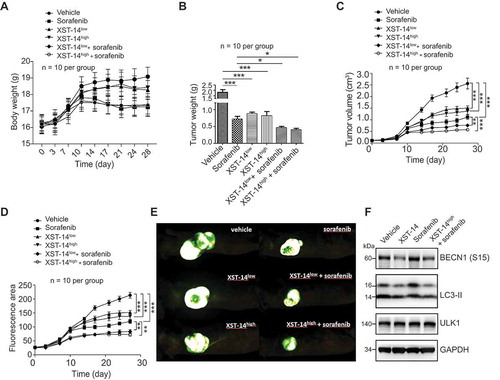
We next examined the antitumor activity of XST-14 in nude mice bearing HepG2 tumor xenografts. As shown in , neither low-dose/high-dose (XST-14low/XST-14high) XST-14 nor their combination with sorafenib induced a decrease in the body weights of tumor-bearing nude mice compared to sorafenib treatment alone. XST-14low and XST-14high displayed in vivo anti-HCC efficacies similar to that of sorafenib, resulting in decreased tumor weights () and suppressed tumor growth of HCC cells in nude mice (). Notably, the combination of XST-14 and sorafenib significantly reduced tumor growth, suggesting that XST-14 could enhance the therapeutic efficacy of sorafenib in nude mice inoculated with HepG2 cells (). In addition, we found that the combination of XST-14 and sorafenib decreased the activation of autophagy induced by sorafenib alone, which was indicated by lower expression of phosphorylated BECN1 and LC3-II in the combination treatment group than in the sorafenib alone treatment group (). Overall, these data verify that ULK1 plays a critical role in HCC progression and that the combination of ULK1 inhibition plus sorafenib therapy produces potent anti-HCC effects.
Figure 7. XST-14 acts synergistically with sorafenib to suppress HCC tumor growth. Nude mice were injected subcutaneously with HepG2 cells. When the tumor volume reached approximately 100 mm3, the mice were treated with vehicle, low-dose XST-14 (XST-14low), high-dose XST-14 (XST-14high) or a combination of sorafenib and XST-14low or XST-14high for 4 weeks. The data represent the quantified body weight (A), tumor weight (B), tumor growth curves (C), fluorescence area (D), and photographs of representative tumors (E). (F) The effects of XST-14 and/or sorafenib on the phosphorylation of BECN1, LC3-II and ULK1 in tumor tissues. Fresh tumor tissue lysates were analyzed by immunoblotting. The data are representative and/or mean ± s.e.m. (n = 10 per group). One-way ANOVA was used to compare multiple groups. *p < 0.05, ***p < 0.001.
XST-14 exhibits a favorable plasma pharmacokinetic profile and no obvious toxicity in mice
We further evaluated the stability of XST-14 in plasma and liver microsomes. As the methyl ester of XST-14 is easily hydrolyzed to carboxylic acid by esterase in vivo, the plasma concentration of its carboxyl metabolite was also detected. We chemically synthesized the XST-14 metabolite for calibration () and confirmed the presence of the XST-14 metabolite in previous pharmacodynamic experiments by mass spectrometry (Figure S5A). Although XST-14 metabolized faster, the XST-14 metabolite was retained longer (). In particular, the XST-14 metabolite represents a new compound first reported in this study. Considering that XST-14 metabolizes rapidly and that it is difficult to assess its pharmacokinetics using Sprague-Dawley rats, the pharmacokinetics of IP/IV injection of the XST-14 metabolite were evaluated in vivo and showed good metabolite bioavailability ().
Figure 8. XST-14 exhibits favorable drug metabolism and pharmacokinetic (DMPK) properties and no obvious toxicity against liver/kidney function or body weight. (A) Chemical structure and chemical synthesis route of the XST-14 metabolite for a pharmacokinetic test calibration. (B) Rat liver microsome assay results for XST-14. Column: Kinetex-C18. Mobile phase: mobile phase A, 0.1% formic acid in water; mobile phase B, 0.1% formic acid in acetonitrile. Flow: 0.4 mL/min. Column temperature: room temperature. Injection volume: 7 μL. Run time: 4 min. (C) C57 mouse blood stability results for XST-14 and the XST-14 metabolite. Column: Kinetex-C18. Mobile phase: mobile phase A, 0.1% formic acid in water; mobile phase B, 0.1% formic acid in acetonitrile. Flow: 0.4 mL/min. Column temperature: room temperature. Injection volume: 7 μL. Run time: 4 min. (D) Summary of Sprague-Dawley rat pharmacokinetics (PK) for the XST-14 metabolite administered IV or IP. (E-H) BALB/c mice were treated with vehicle, XST-14 (30 mg/kg, IP, every other day [q.o.d.]), sorafenib (30 mg/kg, P.O., q.o.d.), or a combination of sorafenib (30 mg/kg, P.O., q.o.d.) and XST-14 (30 mg/kg, IP, q.o.d.) for 2 weeks. After the study, the mice were sacrificed, and their body weights were measured; serum was collected for biochemical assays. (E) Hematoxylin and eosin staining results for livers and kidneys (100×). (F) Serum alanine transaminase (ALT) and aspartate transaminase (AST) levels of the indicated mice were detected to evaluate liver function (n = 8 per group). (G) Serum urea and creatinine levels of the indicated mice were detected to evaluate renal function (n = 8 per group). (H) Body weights of the indicated mice were determined twice a week (n = 8 per group). One-way ANOVA was used to compare multiple groups. ***p < 0.001.
![Figure 8. XST-14 exhibits favorable drug metabolism and pharmacokinetic (DMPK) properties and no obvious toxicity against liver/kidney function or body weight. (A) Chemical structure and chemical synthesis route of the XST-14 metabolite for a pharmacokinetic test calibration. (B) Rat liver microsome assay results for XST-14. Column: Kinetex-C18. Mobile phase: mobile phase A, 0.1% formic acid in water; mobile phase B, 0.1% formic acid in acetonitrile. Flow: 0.4 mL/min. Column temperature: room temperature. Injection volume: 7 μL. Run time: 4 min. (C) C57 mouse blood stability results for XST-14 and the XST-14 metabolite. Column: Kinetex-C18. Mobile phase: mobile phase A, 0.1% formic acid in water; mobile phase B, 0.1% formic acid in acetonitrile. Flow: 0.4 mL/min. Column temperature: room temperature. Injection volume: 7 μL. Run time: 4 min. (D) Summary of Sprague-Dawley rat pharmacokinetics (PK) for the XST-14 metabolite administered IV or IP. (E-H) BALB/c mice were treated with vehicle, XST-14 (30 mg/kg, IP, every other day [q.o.d.]), sorafenib (30 mg/kg, P.O., q.o.d.), or a combination of sorafenib (30 mg/kg, P.O., q.o.d.) and XST-14 (30 mg/kg, IP, q.o.d.) for 2 weeks. After the study, the mice were sacrificed, and their body weights were measured; serum was collected for biochemical assays. (E) Hematoxylin and eosin staining results for livers and kidneys (100×). (F) Serum alanine transaminase (ALT) and aspartate transaminase (AST) levels of the indicated mice were detected to evaluate liver function (n = 8 per group). (G) Serum urea and creatinine levels of the indicated mice were detected to evaluate renal function (n = 8 per group). (H) Body weights of the indicated mice were determined twice a week (n = 8 per group). One-way ANOVA was used to compare multiple groups. ***p < 0.001.](/cms/asset/82099b9a-c93e-425f-b494-adacb73a4006/kaup_a_1709762_f0008_c.jpg)
We further performed histology on various tissues from mice that received treatment for 14 d with XST-14, sorafenib, or their combination. Tissues including kidney and liver from XST-14-, sorafenib-, or combination-treated mice showed normal morphology similar to the vehicle-treated mice (). We noted obvious increases in the levels of alanine aminotransferase (ALT) in sorafenib- and XST-14+ sorafenib-treated mice (). XST-14 treatment also significantly increased the amount of urea in mice (). However, the serum ALT, aspartate transaminase (AST), urea, and Cre levels of XST-14-, sorafenib-, and combination-treated mice were still in the normal range (). All tested animals exhibited normal body weights compared with the vehicle-treated animals throughout the 14 d observation period (). Collectively, these results show that XST-14 is well tolerated in mice and exhibits favorable pharmacokinetic profiles and no obvious toxicity, suggesting that ULK1 might represent a therapeutic target for HCC.
Discussion
Approximately 70% of patients with HCC have an extremely poor prognosis because of high recurrence and HCC therapy chemoresistance rates [Citation15]. Therefore, understanding the molecular mechanisms involved in the pathogenesis and chemoresistance of HCC may lead to improved clinical outcomes. Additionally, there is an urgent need for the development of more effective therapies for HCC. Here, we demonstrated that loss of the essential autophagy kinase ULK1 suppressed tumor growth and enhanced sorafenib sensitivity, suggesting that ULK1 is an attractive target for anti-HCC therapy. Our study further identified a ULK1 small molecule inhibitor (XST-14) that attenuated autophagy, impaired proliferation and induced apoptosis in HCC cells. This ULK1 inhibitor was strongly synergistic with sorafenib in the inhibition of HCC progression. Thus, targeting the ULK1 kinase could provide a novel therapeutic approach for the treatment of HCC.
Autophagy activation is considered to be responsible for the development of sorafenib resistance [Citation7,Citation16,Citation17]. Moreover, accumulating evidence shows that modulating the level of autophagy may be useful as a therapeutic strategy to enhance the efficacy of several antitumor agents, including cisplatin, doxycycline (Dox) and sorafenib [Citation18,Citation19]. Consistently, we found that inhibiting autophagy by 3-MA indeed sensitized HCC cells to sorafenib-induced invasion suppression, suggesting that a highly selective autophagy inhibitor may have promise for treating HCC. As ULK1 is a potentially druggable serine/threonine kinase representing one of the first biochemical steps of autophagy, it therefore represents an attractive target for small molecule modulation [Citation20]. Several other groups have also shown that high expression of ULK1 is associated with poor prognosis in several types of cancer, including breast cancer, colorectal cancer, esophageal squamous cell carcinoma and HCC, but the role of ULK1 in cancer, especially in HCC, has remained largely unknown. In this study, we found that sorafenib treatment induced autophagy and that knockdown of ULK1 significantly impaired the viability of HCC cells and increased the number of apoptotic cells following sorafenib treatment. The results indicated that ULK1 may confer sorafenib resistance and that loss of ULK1 may increase sorafenib sensitivity in HCC cells by inhibiting autophagy. These results showed an underlying association between ULK1 and sorafenib resistance and may provide a strong rationale for the combined use of a ULK1 inhibitor and sorafenib in the clinic.
Recently, Lazarus et al. reported the first structures of ULK1 in complex with multiple potent inhibitors [Citation21]. However, the small molecule inhibitors developed in that study are not yet selective enough for cellular use. Egan et al. identified a selective ULK1 inhibitor (SBI-0206965) suitable for cell studies [Citation22]. However, we found that 100 μM SBI-0206965 treatment induced apoptosis in 60–80% of both nutrient-starved human HCC cells and normal human liver cells (L02). The cytotoxic effect of SBI-0206965 in normal human liver cells may greatly limit its clinical application. Other ULK1 inhibitors, MRT68921 and ULK-101, have recently been reported to suppress autophagy induction and autophagic flux in cells [Citation23,Citation24]. However, the use of these compounds in animal models of cancer and other diseases has been less studied. In our study, we screened XST-14, a highly selective ULK1 kinase inhibitor, to block autophagy and induce apoptosis in HCC cells. XST-14 significantly synergized with sorafenib to suppress HCC progression both in vitro and in vivo. Interestingly, 100 μM XST-14 treatment induced apoptosis in 60–70% of HepG2 cells and in only 20–30% of normal cells (Figure S12). The differential roles of XST-14 in HCC and normal cells are still unclear in this study, which requires further investigation in the next study.
In this study, XST-14 had good pharmacokinetic properties and appeared to be tolerable in mice. In addition, the effects of the XST-14 metabolite (XST-14Metab) on autophagy and ULK1 activities were further evaluated. We found that XST-14Metab has similar autophagy and ULK1 inhibitory properties as XST-14 in vitro. XST-14Metab also suppressed tumor cell proliferation in vitro (Figure S5B–E). Hence, the antitumor effects of XST-14 in animal studies may be produced by XST-14 itself and/or its metabolite due to the short half-life of XST-14. Further efforts will be needed to explore the use of XST-14Metab in animal models of HCC. In summary, this study confirmed that ULK1 could be a therapeutic target for HCC. XST-14, a novel ULK1 inhibitor, exerts anti-HCC effects and is a good candidate for future investigation. Moreover, ULK1 inhibitor coadministration with sorafenib may become a promising interventional strategy for HCC and other types of cancer treatment.
Materials and methods
Cell lines and primary cultures
Hep3B, HepG2 and L02 cells were purchased from Shanghai Bioleaf Biotech Co., Ltd., where they were recently authenticated by short tandem repeat profiling and subjected to mycoplasma and cell vitality testing. Primary human HCC cells were purchased from iCell Bioscience Inc. (Shanghai, China) and maintained in an iCell Primary Melanin Cell Culture System (iCell Bioscience Inc., PriMed-iCell-024) under 5% carbon dioxide.
To generate cells stably expressing ULK1 [Con] and ULK1 [Cas9], lentiviral particles (Beijing SyngenTech Co., pHS-ACR-LJ046) were used to infect HepG2 cells. After 24 h of infection, stable cells were selected in medium containing 1 μg/mL puromycin (Thermo Fisher Scientific, A1113808) for 14 d. After 2 to 3 passages in the presence of puromycin, the cultured cells were used for experiments without cloning.
Antibodies and reagents
Anti-LC3-I/II (ABC929) and anti-SQSTM1/p62 (P0068) antibodies were purchased from Sigma-Aldrich. Anti-GAPDH antibodies were purchased from Kangchen Bio-tech (KC-5G5). A p-BECN1 (S15) antibody was purchased from Abbiotec Inc. (254515), and p-PIK3C3/VPS34 (S249) was purchased from Cell Signaling Technology (13857). Saponin was purchased from Sigma-Aldrich (S7900). 3MA (3-methyladenine) was purchased from Selleck (S2767). Lipofectamine transfection reagents were purchased from Thermo Fisher (1668-019).
Flow cytometry
Total cellular levels of autophagosome-associated LC3-II were detected following the method reported by KE Eng et al. [Citation25]. CHO cells (Shanghai Bioleaf Biotech Co., Ltd.) stably expressed LC3-GFP were starved of amino acids for 4 h and then incubated either with or without treatment for 12 h. Then, the cells were washed briefly with 0.05% saponin (Merck, 47036) in phosphate-buffered saline (PBS; meilunbio, MA0008) and analyzed by flow cytometry for total GFP fluorescence. The data were acquired using a FACSCanto II flow cytometer (BD). FCS EXPRESS software (De Novo software) was used for data analysis.
Autophagy flux assay
CHO cells were infected with the mCherry-GFP-LC3 adenovirus (Beyotime, C3012). After 12 h, the cells were starved in Earle’s balanced salt solution (EBSS, Thermo Fisher Scientific, 14155063) for 4 h and treated with or without XST-14 (5 μM) for 12 h. Then, the autophagic flux rate was detected by live cell imaging microscopy.
ULK1 kinase assays
ULK1 kinase, its substrate, ATP and XST-14 were diluted in kinase buffer (40 mM Tris, pH 7.5, 20 mM MgCl2, 0.1 mg mL−1 BSA [Sigma-Aldrich, B2064], 50 μM DTT). Then, 2 μL of XST-14, 4 μL of ULK1 kinase enzyme, and 4 μL of myelin basic protein (MBP; MedChemExpress, HY-P1821) (0.1 μg μL−1)/ATP (10 μM; Roche, 10519979001) were added and incubated at room temperature for 60 min, and 10 μL of ADP-Glo™ reagent was added. The plates were incubated at room temperature for 40 min, and then 20 μL of kinase detection reagent was added. After incubation at room temperature for 30 min, the luminescence was recorded. The ADP formed from the kinase reactions was measured using an ADP-Glo Kinase Assay Kit (Promega, V9101) following the manufacturer’s instructions as previously described [Citation26,Citation27]. The IC50 values were calculated using a nonlinear regression with normalized dose-response fitting using Prism software (GraphPad Software, Prism 8).
EdU assays
HCC cells (5 × 10⁴ cells per well) were plated onto 12-well plates. After 24 h, the cells were treated with 5 μM XST-14, 5 μM sorafenib (Selleck, S7393), or a combination of XST-14 (5 μM) and sorafenib (5 μM). After incubation for 24 h, the cell culture medium in each well was replaced with 1 mL of EdU medium (50 μM) and incubated for 2 h. The cells were harvested by trypsinization, and cell proliferation activities were determined using a Cell-Light™ EdU Apollo® 488 In Vitro Flow Cytometry Kit (20T) (RiboBio, C10338-3).
CCK-8 assay
For the Cell Counting Kit-8 (CCK-8) assay, ULK1 [Con] and ULK1 [Cas9] HepG2 cells were seeded in 96-well plates at a density of 1000 cells/well. Cells were cultured for 1, 3, 5, 7, 9 or 11 d. For sorafenib treatment, ULK1 [Con] and ULK1 [Cas9] HepG2 cells were seeded in 96-well plates at a density of 2000 cells/well. Vehicle (DMSO, Merck, D2650)- or sorafenib (5 μM)-treated cells were cultured for 1, 3, 5, 7, 9 or 11 d. Subsequently, 100 µL of complete medium supplemented with 10 µL of CCK-8 solution (Dojindo, CK04) was added to each well, and the plates were incubated for 2 h. Finally, the absorbance was measured at 450 nm.
Transmission Electron Microscopy (TEM)
For TEM, cells were immediately fixed with 2.0% glutaraldehyde in 0.1 M sodium cacodylate buffer, pH 7.4, and then postfixed in 1% osmium tetroxide, dehydrated in ethanol, and embedded in Epon (Sigma-Aldrich, 45359). Ultrathin sections of HCC cells were collected on formvar-coated grids (Polysciences, Inc., 24915) and stained with uranyl acetate and lead citrate. The samples were examined using a HITACHI H600 Transmission Electron Microscope operated at 80 kV.
Mouse models for tumor growth
To generate mouse models for tumor growth, 2 × 10⁶ HepG2 cells per mouse in 100 μL of PBS solution were injected subcutaneously into the right flanks of 5- to 6-week-old male nude mice. Tumor volumes were determined every 3 d using the formula TV = W2 × L × 0.5. All animal studies were approved by the Animal Experimentation Ethics Committee of the Chinese Academy of Medical Sciences, and all procedures were conducted in accordance with the guidelines of the Institutional Animal Care and Use Committees of the Chinese Academy of Medical Sciences. For sorafenib treatment alone in vivo, the tumors were allowed to grow for 7 d (designated as day 0), and sorafenib treatment was then administered. At that time, the tumor volume reached approximately 40 mm3. The mice received vehicle (PBS, 100 μl, per os [P.O.]) or sorafenib (30 mg/kg, P.O., every other day [q.o.d.]) for 4 consecutive weeks. For XST-14 treatment or sorafenib and XST-14 combination treatment in vivo, when the tumor volume reached approximately 100 mm3 (designated as day 0), the treatments were administered. The mice received vehicle (PBS, 100 μL, intraperitoneal [IP]), sorafenib (30 mg/kg, P.O., daily), XST-14low (15 mg/kg, IP, daily), XST-14high (30 mg/kg, IP, daily), XST-14low and sorafenib (15 mg/kg, IP, daily for XST-14low; 30 mg/kg, P.O., daily for sorafenib), or XST-14high and sorafenib (30 mg/kg, IP, daily for XST-14high; 30 mg/kg, P.O., daily for sorafenib) for 4 consecutive weeks. After 4 weeks, all mice were sacrificed, and necropsies were performed. The tumors were excised and analyzed by western blot analysis for protein expression.
Invasion assays
Invasion assays were performed using Transwell chambers with filter membranes with an 8 µm pore size (Millipore, SCWP04700). The chambers were precoated with 10 μg/mL FN1 (fibronectin 1; MERCK, F0635) on the lower surface, and the polycarbonate filters were coated with Matrigel (40 μL per well; BD Matrigel Matrix, 354230). Thereafter, the chambers were inserted into 24-well culture plates. Single-cell suspensions were seeded into the upper chamber (5 × 10⁴ cells per well in 0.4% fetal bovine serum (Thermo Fisher Scientific, 10099) in Dulbecco’s modified Eagle’s medium). After 24 h, the noninvaded cells on the upper side of the filter were removed with a cotton swab. The invaded cells were fixed with 4% paraformaldehyde in PBS, stained with 0.5% toluidine in 2% Na2CO3, and counted in 8 random fields using brightfield microscopy.
Immunoprecipitation, immunoblotting, and immunostaining
A coimmunoprecipitation (co-IP) experiment was performed as described previously [Citation28]. Cells were harvested and lysed in co-IP buffer supplemented with a complete protease inhibitor (Cell Signaling Technology, 5817), 1 mM trichostatin A (Selleck, S1045), and 5 mM nicotinamide (MedChemExpress, HY-B0150). Soluble lysates were incubated with BECN1 or IgG antibodies (Cell Signaling Technology, 3738) at 4°C overnight, followed by incubation with Protein A/G Plus-Agarose (Santa Cruz Biotechnology, sc-2003) at 4°C for 2 h. The complexes that separated from the beads were boiled for 10 min. The precipitated proteins were then subjected to SDS-PAGE and blotted with the corresponding antibody. Immunoblotting and immunostaining assays were performed as described previously [Citation29].
Surface plasmon resonance analysis
Recombinant His-tagged wild-type ULK1, as well as K46A, Y94A and D165A kinase domain (KD) truncation mutants, were expressed in 293F cells (Thermo Fisher, R79007), purified, and eluted from a Ni column (Thermo Fisher, R90101). The binding kinetics between XST-14 and ULK1 or the ULK1 mutants were measured by a surface plasmon resonance assay using a Biacore T200 instrument (GE Healthcare, Pittsburgh, PA, USA). The dissociation constant (KD) was calculated according to BIAevaluation software.
ULK kinase selectivity panels
Kinase panel testing was performed to determine the potency of XST-14 toward 403 different kinases using SelectScreen™ Kinase Profiling Services (Madison, WI, USA). XST-14 was evaluated at a concentration of 5 μM in kinase-specific assay conditions, and the data analyzes are described on the company’s website (services/services/custom-services/screening-and-profiling-services/selectscreen-profiling-service/selectscreen-kinase-profiling-service.html). All tests were run in duplicate.
siRNA sequences
siRNA sequences against human ULK1 were purchased from Santa Cruz Biotechnology (sc-44182), and a pool of three different siRNA duplexes was used: siRNA1 (sense, 5’-CAGCAAAGACUCCUGUGACACUtt-3’; antisense, 5’-ACACUACACA GCAGGCUAAUCt-3’), siRNA2 (sense, 5’-CUCCACGGAGUCUGACUGGUCtt-3’; antisense, 5’-GACGAGUAACCAAGGCTUAACGtt-3’), and siRNA3 (sense, 5’-CUACGCCAAGAAGGACACUCGUtt-3’; antisense, 5’-AUCUCCGUGAGGAGG UUCTCtt-3’). Transient transfections were performed in 6-well plates using Lipofectamine® RNAiMAX Reagent (Thermo Fisher, 13778150) according to the manufacturer’s instructions.
Molecular docking
The X-ray crystal structure of ULK1 (Protein Data Bank code 4WNO) was used for the docking studies. 4WNO was selected for electrospray ionization (ESI). 4WNO was processed using the protein preparation protocol in Sybyl-X2.0. First, the ligand was extracted from the complex to determine the active site’s location. Second, the backbones and sidechains of the protein were repaired. Third, all hydrogen atoms were added, and the protein was protonated at pH 7.4. Fourth, an Amber7 FF99 force field was applied to the biopolymer. A Surflex-Dock Control File containing information about the protein and active site was then defined with a 0.5 threshold value. The maximum number of poses per ligand was set to 10. The ligand in the crystal structure was defined as the reference molecule. All other parameters were set at their default values. Finally, structure-based docking was carried out using the Surflex-Dock Geom mode of Sybyl-X2.0.
Synthesis and characterization
General
All reagents and solvents were purchased from commercial sources. All reactions were carried out in flame-dried glassware and monitored by thin layer chromatography using an aluminum TLC plate 60F254D (Merck Millipore, 1.05554.0001). 1H NMR and 13C NMR spectra were recorded in DMSO-d6 using a Varian Inova 600 MHz spectrometer (Varian, San Francisco, CA, USA). Chemical shifts are reported in parts per million relative to tetramethylsilane as an internal standard. The mass spectra (MS) were recorded on a Thermo Scientific LTQ ORBITRAP instrument with an ESI mass selective detector. Melting points were determined using an X6 microscope melting point apparatus and are uncorrected. Flash column chromatography was performed with silica gel (200–300 mesh; Qingdao Haiyang Chemical Co. Ltd., 3).
2,4-Diisopropoxybenzaldehyde (1)
2,4-Dihydroxybenzaldehyde (6.9 g, 50 mmol; Shanghai Haohong Pharmaceutical Co., Ltd., 1047188) was dissolved in anhydrous dimethylformamide (500 mL; j&k chemical, 966438), followed by the addition of anhydrous K2CO3 (13.8 g, 100 mmol; j&k chemical, 212583) and isopropyl bromide (18.5 g, 150 mmol; j&k chemical, 390997). The mixture was heated to 40°C for 4 h, and the reaction mixture was cooled to room temperature and filtered. The filtrate was concentrated in vacuo, and the resulting residue was recrystallized from ethyl acetate and petroleum ether to yield the target compound 1. Finally, 7.5 g of solid was obtained. ESI-MS (m/z): 223.1 [M + H]+.
Methyl 4,6-diisopropoxy-1H-indole-2-carboxylate (XST-14)
Compound 1 (4.4 g, 20 mmol) and methyl 2-azidoacetate (100 mmol; Shanghai Haohong Pharmaceutical Co., Ltd., 1052719) in anhydrous tetrahydrofuran (40 mL; j&k chemical, 315353) at −20°C were added to a solution of NaOMe (30 mmol; j&k chemical, 478445) in MeOH (80 mL), and the mixture was stirred for 1 h. Subsequently, the reaction was quenched by adding a saturated ammonium chloride solution and extracted with ethyl acetate. The combined organic layer was washed with brine (j&k chemical, 957400), dried over anhydrous Na2SO4, filtered, and concentrated. The residue was triturated with MeOH to render intermediate compound 2, a white solid. The crude compound 2 was dissolved in xylene and heated under reflux for 2 h. After cooling, a white solid was crystallized. Filtration yielded the target XST-14 under the following conditions. Finally, 4.9 g of solid was obtained. m.p. 121–122°C. 1H NMR (600 MHz, DMSO-d6) δ11.58 (s, 1H), 6.98 (d, J = 1.80 Hz, 1H), 6.44 (s, 1H), 6.15 (d, J = 1.20 Hz, 1H), 4.71–4.65 (m, 1H), 4.58–4.51 (m, 1H), 3.82 (s, 3H), 1.31 (d, J = 6.01 Hz, 6H), and 1.28 (d, J = 6.06 Hz, 6H). δ13C NMR (151 MHz, DMSO) δ 161.45, 157.18, 152.38, 139.36, 124.33, 113.75, 105.77, 95.31, 88.80, 69.52, 69.49, 51.41, 21.86, and 21.81. HRMS (ESI) m/z calcd for [C16H22N O4 + H]+, 292.1543; found, 292.1538 (Figures S6–S8).
4,6-Diisopropoxy-1H-indole-2-carboxylic acid (XST-14 metabolite)
XST-14 (2.9 g, 10 mmol) was dissolved in 30 mL of THF (j&k chemical, 315353):H2O = 3:1, and 8.0 mL of 1 N LiOH (j&k chemical, 500019) was added. The solution initially became turbid but clarified upon completion of the reaction after 2 h. THF was removed by distillation under reduced pressure, and the remaining product was dissolved in water. The solution was mixed with dichloromethane; after stratification, the organic phase was discarded, and the aqueous phase was adjusted to pH = 3 with 10% HCl. The precipitate was collected and recrystallized in dry methanol. Finally, 2.4 g of solid was obtained. m.p. 149–150°C. 1H NMR (600 MHz, DMSO-d6) δ12.50 (s, 1H), 11.41 (s, 1H), 6.91 (dd, J1 = 0.68 Hz, J2 = 2.23 Hz, 1H), 6.43 (s, 1H), 6.13 (d, J = 1.65 Hz, 1H), 4.71–4.64 (m, 1H), 4.57–4.50 (m, 1H), 1.31 (d, J = 6.05 Hz, 6H), and 1.28 (d, J = 6.05 Hz, 6H). 13C NMR (151 MHz, DMSO) δ 162.49, 156.85, 152.30, 139.15, 125.63, 113.76, 105.25, 95.16, 88.90, 69.47, 69.46, 21.89, and 21.84. HRMS (ESI) m/z calcd for [C15H20N O4 + H]+, 278.1387; found, 278.1385 (Figures S9–S11).
Determination of pharmacokinetic profiles
Specific-pathogen-free (SPF) female Sprague-Dawley rats (Beijing Huakangkang Biotechnology Co., Ltd.) weighing 180–220 g were used in the pharmacokinetic study. The rats were fasted overnight before dosing. Every treatment group contained 3 rats. The rats were dosed with the tested compound suspension at 2 mg/kg (intravenous [IV]) or 10 mg/kg (IP). The compounds were suspended in 0.5% CMC (j&k chemical, C3896) for oral administration. Blood was collected from the jugular vein of each animal at the following times after drug administration: 0.25, 0.5, 1, 2, 4, 6, 8 and 24 h after a single oral dosing. All blood samples were centrifuged at 2500 g for 10 min to obtain serum, which was then stored at −20°C. Then, 150 μL of serum was added to 500 μL of acetonitrile, and the mixture was centrifuged at 10,000 g for 10 min to remove the proteins. The supernatant was dried and dissolved in 100 μL of acetonitrile, and the solution was centrifuged at 10,000 g for 10 min. The supernatant was placed in a sample bottle for HPLC analysis. The total area under the concentration time curve (AUC), the elimination half-time (t1/2), the peak concentration (Cmax) and the time to reach the peak concentration (Tmax) of the samples were determined directly from the experimental data using WinNonlin V6.2.1.
Determination of metabolic stability in pooled rat liver microsomes
Liver microsomes were prepared with 5 mmol/L K2HPO4 buffer (pH 7.4). Then, 100 μL of 40 μmol/L drug was mixed with 80 μL of the above incubation solution and preincubated in a 37°C water bath for 5 min. Next, 20 μL of NADPH solution (10 mmol/L; j&k chemical, 445507) was added to initiate the reaction. The microsomal protein content in the reaction system was 0.5 g/L, and the final drug concentration was 20 μmol/L. The incubation solution was incubated in a 37°C water bath and sampled at different time points. Then, 400 μL of acetonitrile-methanol (1:1) solution was immediately added to stop the reaction, and 200 μL of internal standard (0.5 ng/mL) was added after mixing. The incubated samples were swirled for 2 min and centrifuged at 10,000 g for 15 min at 4°C. The supernatant was concentrated to 100 μL in a centrifugal concentrator and analyzed by HPLC to determine the remainder of the drug.
Determination of C57 mouse blood stability
One hundred microliters of rat plasma was collected and added to 100 μL of drug (40 μmol/L). The mixture was incubated in a 37°C water bath with a final concentration of 20 μmol/L. Samples were taken at different time points. Then, 400 μL of acetonitrile-methanol (1:1) solution was added immediately to terminate the reaction, and 200 μL of internal standard (500 ng/mL) was added after mixing. The incubated samples were swirled for 2 min and centrifuged at 10,000 g for 15 min at 4°C. The supernatant was concentrated to 100 μL with a centrifugal concentrator, and the remaining drug was detected by HPLC.
Statistical analysis
The data are representative and/or the means ± SEM of three assays. An unpaired two-sided Student’s t-test was used to compare two groups, and a one-way ANOVA was used to compare multiple groups. The sample number (n) indicates the number of independent biological samples in each experiment. Generally, all experiments were performed with n ≥ 3 biological replicates. P < 0.05 was considered statistically significant. Analyzes were performed using SigmaPlot 13 or GraphPad Prism 6.0 software.
Supplemental Material
Download MS Word (21.4 KB)Supplemental Material
Download PDF (1.7 MB)Disclosure statement
No potential conflict of interest was reported by the authors.
Supplementary material
Supplemental data for this article can be accessed here.
Additional information
Funding
References
- Yang JD, Roberts LR. Hepatocellular carcinoma: a global view. Nat Rev Gastroenterol Hepatol. 2010;7:448–458.
- Moon DB, Lee SG. Liver transplantation. Gut Liver. 2009;3:145–165.
- Shukla PJ, Barreto SG. Surgery for malignant liver tumors. J Cancer Res Ther. 2009;5:154–160.
- Wilhelm S, Carter C, Lynch M, et al. Discovery and development of sorafenib: a multikinase inhibitor for treating cancer. Nat Rev Drug Discov. 2006;5:835–844.
- Zhang X, Yang XR, Huang XW, et al. Sorafenib in treatment of patients with advanced hepatocellular carcinoma: a systematic review. Hepatobiliary Pancreat Dis Int. 2012;11:458–466.
- Fu XT, Song K, Zhou J, et al. Tumor-associated macrophages modulate resistance to oxaliplatin via inducing autophagy in hepatocellular carcinoma. Cancer Cell Int. 2019;19:71.
- Luo T, Fu J, Xu A, et al. PSMD10/gankyrin induces autophagy to promote tumor progression through cytoplasmic interaction with ATG7 and nuclear transactivation of ATG7 expression. Autophagy. 2016;12:1355–1371.
- Lu S, Yao Y, Xu G, et al. CD24 regulates sorafenib resistance via activating autophagy in hepatocellular carcinoma. Cell Death Dis. 2018;9:646.
- Wu DH, Wang TT, Ruan DY, et al. Combination of ULK1 and LC3B improve prognosis assessment of hepatocellular carcinoma. Biomed Pharmacother. 2018;97:195–202.
- Shimizu S, Takehara T, Hikita H, et al. Inhibition of autophagy potentiates the antitumor effect of the multikinase inhibitor sorafenib in hepatocellular carcinoma. Int J Cancer. 2012;131:548–557.
- Shi YH, Ding ZB, Zhou J, et al. Targeting autophagy enhances sorafenib lethality for hepatocellular carcinoma via ER stress-related apoptosis. Autophagy. 2011;7:1159–1172.
- Wang Z, Han W, Sui X, et al. Autophagy: a novel therapeutic target for hepatocarcinoma (Review). Oncol Lett. 2014;7:1345–1351.
- Jang JE, Eom JI, Jeung HK, et al. AMPK-ULK1-mediated autophagy confers resistance to BET inhibitor JQ1 in acute myeloid leukemia stem cells. Clin Cancer Res. 2017;23:2781–2794.
- Russell RC, Tian Y, Yuan H, et al. ULK1 induces autophagy by phosphorylating Beclin-1 and activating VPS34 lipid kinase. Nat Cell Biol. 2013;15:741–750.
- Forner A, Llovet J, Bruix J. Hepatocellular carcinoma. Lancet. 2012;379:1245–1255.
- Zhai B, Hu F, Jiang X, et al. Inhibition of Akt reverses the acquired resistance to sorafenib by switching protective autophagy to autophagic cell death in hepatocellular carcinoma. Mol Cancer Ther. 2014;13:1589–1598.
- Fischer TD, Wang JH, Vlada A, et al. Role of autophagy in differential sensitivity of hepatocarcinoma cells to sorafenib. World J Hepatol. 2014;6:752–758.
- Yang ZJ, Chee CE, Huang S, et al. The role of autophagy in cancer: therapeutic implications. Mol Cancer Ther. 2011;10:1533–1541.
- Zou Z, Wu L, Ding H, et al. MicroRNA-30a sensitizes tumor cells to cis-platinum via suppressing Beclin 1-mediated autophagy. J Biol Chem. 2012;287:4148–4156.
- Jiang X, Overholtzer M, Thompson CB. Autophagy in cellular metabolism and cancer. J Clin Invest. 2015;125:47–54.
- Lazarus MB, Novotny CJ, Shokat KM. Structure of the human autophagy initiating kinase ULK1 in complex with potent inhibitors. ACS Chem Biol. 2015;10:257–261.
- Egan DF, Chun MG, Vamos M, et al. Small molecule inhibition of the autophagy kinase ULK1 and identification of ULK1 substrates. Mol Cell. 2015;59:285–297.
- Petherick KJ, Conway OJ, Mpamhanga C, et al. Pharmacological inhibition of ULK1 kinase blocks mammalian target of rapamycin (mTOR)-dependent autophagy. J Biol Chem. 2015;290:11376–11383.
- Martin KR, Celano SL, Solitro AR, et al. A potent and selective ULK1 inhibitor suppresses autophagy and sensitizes cancer cells to nutrient stress. iScience. 2018;8:74–84.
- Eng KE, Panas MD, Hedestam GBK, et al. A novel quantitative flow cytometry-based assay for autophagy. Autophagy. 2010;6:634–641.
- Zhang L, Fu L, Zhang S, et al. Discovery of a small molecule targeting ULK1-modulated cell death of triple negative breast cancer in vitro and in vivo. Chem Sci. 2017;8:2687–2701.
- Balzano D, Santaguida S, Musacchio A, et al. A general framework for inhibitor resistance in protein kinases. Chem Biol. 2011;18:966–975.
- Wang J, Park JS, Wei Y, et al. TRIB2 acts downstream of Wnt/TCF in liver cancer cells to regulate YAP and C/EBPα function. Mol Cell. 2013;51:211–225.
- Klionsky DJ, Abdelmohsen K, Abe A, et al. Guidelines for the use and interpretation of assays for monitoring autophagy (3rd edition). Autophagy. 2016;12:1–222.