
ABSTRACT
Macroautophagy/autophagy is a central component of the cytoprotective cellular stress response. To enlighten stress-induced autophagy signaling, we screened a human kinome siRNA library for regulators of autophagic flux in MCF7 human breast carcinoma cells and identified the catalytic subunit of DNA-dependent protein kinase PRKDC/DNA-PKcs as a positive regulator of basal and DNA damage-induced autophagy. Analysis of autophagy-regulating signaling cascades placed PRKDC upstream of the AMP-dependent protein kinase (AMPK) complex and ULK1 kinase. In normal culture conditions, PRKDC interacted with the AMPK complex and phosphorylated its nucleotide-sensing γ1 subunit PRKAG1/AMPKγ1 at Ser192 and Thr284, both events being significantly reduced upon the activation of the AMPK complex. Alanine substitutions of PRKDC phosphorylation sites in PRKAG1 reduced AMPK complex activation without affecting its nucleotide sensing capacity. Instead, the disturbance of PRKDC-mediated phosphorylation of PRKAG1 inhibited the lysosomal localization of the AMPK complex and its starvation-induced association with STK11 (serine/threonine kinase 11). Taken together, our data suggest that PRKDC-mediated phosphorylation of PRKAG1 primes AMPK complex to the lysosomal activation by STK11 in cancer cells thereby linking DNA damage response to autophagy and cellular metabolism.
Abbreviations: AXIN1: axin 1; 3-MA: 3-methyladenine; 5-FU: 5-fluorouracil; AA mutant: double alanine mutant (S192A, T284A) of PRKAG1; ACACA: acetyl-CoA carboxylase alpha; AICAR: 5-Aminoimidazole-4-carboxamide ribonucleotide; AMPK: AMP-activated protein kinase; ATG: autophagy-related; ATM: ataxia telangiectasia mutated; ATR: ATM serine/threonine kinase; AV: autophagic vacuole; AVd: degradative autophagic vacuole; AVi: initial autophagic vacuole; BECN1: beclin 1; BSA: bovine serum albumin; CBS: cystathionine beta-synthase; CDK7: cyclin dependent kinase 7; CDKN1A: cyclin dependent kinase inhibitor 1A; EGFP: enhanced green fluorescent protein; GAPDH: glyceraldehyde-3-phosphate dehydrogenase; GST: glutathione S transferase; H2AX/H2AFX: H2A.X variant histone; HBSS: Hanks balanced salt solution; IP: immunopurification; IR: ionizing radiation; MAP1LC3/LC3: microtubule associated protein 1 light chain 3; MAP3K9: mitogen-activated protein kinase kinase kinase 9; mRFP: monomeric red fluorescent protein; mCh: mCherry; MCM7: minichromosome maintenance complex component 7; MTORC1: mechanistic target of rapamycin kinase complex 1; NHEJ: non-homologous end joining; NRBP2: nuclear receptor binding protein 2; NTC: non-targeting control; NUAK1: NUAK family kinase 1; PBS: phosphate-buffered saline; PIK3AP1: phosphoinositide-3-kinase adaptor protein 1; PIK3CA: phosphatidylinositol-4,5-biphosphate 3-kinase catalytic subunit alpha; PIKK: phosphatidylinositol 3-kinase-related kinase; PRKAA: protein kinase AMP-activated catalytic subunit alpha; PRKAB: protein kinase AMP-activated non-catalytic subunit beta; PRKAG: protein kinase AMP-activated non-catalytic subunit gamma; PRKDC: protein kinase, DNA-activated, catalytic subunit; RLuc: Renilla luciferase; RPS6KB1: ribosomal protein S6 kinase B1; SQSTM1: sequestosome 1; STK11/LKB1: serine/threonine kinase 11; TP53: tumor protein p53; TSKS: testis specific serine kinase substrate; ULK1: unc-51 like autophagy activating kinase 1; WIPI2: WD repeat domain, phosphoinositide interacting 2; WT: wild type.
Introduction
Macroautophagy (hereafter referred to as autophagy) is a central component of the integrated stress response in all eukaryotic cells [Citation1 Citation2–Citation3]. It ensures the degradation of damaged or obsolete organelles, long-lived macromolecules and protein aggregates, thereby promoting the survival of starved and stressed cells. During autophagy, an phagophore engulfs cargo by forming a double membrane vesicle called the autophagosome, which then fuses with a lysosome to form an autolysosome where the engulfed material is degraded and recycled [Citation4,Citation5]. Autophagy initiation is under tight control of at least four multiprotein kinase complexes; the AMP-activated protein kinase (AMPK) complex, mechanistic target of rapamycin kinase complex 1 (MTORC1), ULK1 (unc-51 like autophagy activating kinase 1) complex and PIK3C3/Vps34-containing phosphatidylinositol 3-kinase (PtdIns3K)-BECN1 complex [Citation6]. The AMPK and MTORC1 complexes sense the energy and nutrient status of the cell and dictate whether the cell will favor catabolic (e.g. autophagy) or anabolic (e.g. macromolecule synthesis) processes, respectively [Citation7]. Signals from AMPK and MTORC1 are integrated by the ULK1 complex that forwards the autophagy activating signals by phosphorylating a number of downstream targets, while limiting the over-activation of the pathway by suppressing the AMPK complex activity [Citation6]. In parallel, PIK3C3-induced formation of phosphoinositol-3-phosphate results in the recruitment of proteins that assist autophagosome formation. While the composition of the autophagy-regulating kinase complexes is emerging, our understanding of the reciprocal control of their activity and crosstalk with other cellular pathways is, as yet, limited. Recent results suggest, however, that much of this regulation takes place at the surface of the lysosome and is regulated by the availability of amino acids and glucose [Citation7 Citation9–Citation10].
A wide range of DNA damaging insults continuously challenge the genome integrity. Such insults include errors encountered during DNA replication as well as physical and chemical stresses that damage the DNA directly (e.g. irradiation and DNA damaging chemotherapeutic drugs) or indirectly via increased production of reactive oxygen species (e.g. nutrient starvation and hypoxia [Citation11]. To counteract the deleterious consequences of genotoxic stress, all organisms have evolved a network of genome surveillance mechanisms designed to maintain the genomic integrity or to eliminate hazardous cells when DNA damage is beyond repair [Citation12 Citation13–Citation14]. Recent discoveries have identified autophagy as an integrated part of the genome surveillance network that helps cells to cope with DNA damage, possibly by regulating the turnover of key proteins of DNA damage response or by supplying dNTPs essential for DNA synthesis during repair [Citation15]. Ataxia telangiectasia mutated (ATM), the major apical kinase in homologous recombination repair of double-strand DNA breaks, is one of the putative links in this crosstalk. It can enhance autophagy by activating an AMPK complex-activating STK11/LKB1 (serine/threonine kinase 11) or by stabilizing TP53 (tumor protein p53), which in turn enhances the expression of several autophagy-related (ATG) genes and their positive regulators while suppressing the expression of autophagy-inhibiting proteins [Citation15 Citation16–Citation17]. Contrary to ATM, the highly related catalytic subunit of DNA-dependent protein kinase PRKDC/DNA-PKcs, which is the major apical kinase in DNA repair by non-homologous end joining (NHEJ), has been identified as a negative regulator of radiation-induced autophagy [Citation18].
In spite of the intense research in the cross talk between autophagy signaling and the genome surveillance network, several questions remain open. In order to enlighten how cells transduce the nuclear DNA damage signal to the autophagy machinery in the cytosol, we screened a human genome-wide kinase siRNA library targeting 710 known and putative kinases for regulators of DNA damage induced autophagy employing a Renilla luciferase (RLuc)-based reporter assay for autophagy-specific turnover of MAP1LC3B (microtubule associated protein 1 light chain 3B) in untreated and etoposide-treated MCF7 breast cancer cells [Citation19]. Among several candidates, PRKDC siRNA emerged as the statistically strongest inhibitor of etoposide-induced autophagy as well as a statistically significant inhibitor of constitutive autophagy. We focused our further studies on molecular mechanisms by which PRKDC, being a well-characterized mediator of DNA damage response, engages the autophagy machinery. Employing co-immunoprecipitation and in vitro kinase assays, we identified PRKAG1/AMPKγ1 (protein kinase AMP-activated non-catalytic subunit gamma 1) as a PRKDC substrate, and its predicted PRKDC phosphorylation sites as essential regulators of the activation of the AMPK complex by STK11 on the lysosomal surface. These data reveal a new cytosolic function for the PRKDC in the control of cellular energy metabolism.
Results
siRNA screen for kinases that regulate DNA damage-induced autophagic flux
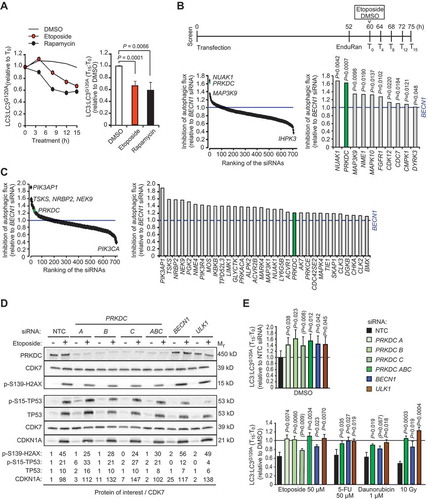
In order to find optimal conditions to screen the siRNA kinome library for regulators of DNA damage-induced autophagy, we performed a mini-screen of clinically relevant DNA-damaging treatments for their ability to activate autophagy in MCF breast cancer cells without inducing cell death. Autophagic flux was analyzed by a 15 h live cell assay based on a pair of MCF7 cell lines stably expressing Renilla Luciferase (Rluc) fused to WT LC3B (Rluc-LC3), which is degraded by autophagy, or to LC3G120A (Rluc-LC3G120A), which is not specifically degraded by autophagy [Citation19]. DNA damage induced by ionizing radiation (IR), etoposide, daunorubicin, doxorubicin, hydroxyurea and 5-fluorouracil (5-FU) was associated with a significant decrease in the Rluc-LC3/Rluc-LC3G120A ratio reflecting increased autophagic flux (Figure S1A). Etoposide was chosen as the autophagy inducer for the screen based on its potent and reproducible ability to induce autophagic flux ().
We then screened a genome-wide kinome siRNA library targeting 710 known and putative human kinases or kinase-related genes (3 siRNAs/gene at 6 nM) in parallel with non-targeting control (NTC, negative control) and BECN1 (positive control) siRNAs (18 nM) according to the timeline outlined in . Seventy-four siRNAs inhibited etoposide-induced autophagy to the same or greater extent than BECN1 siRNA (Table S1), and in ten cases the inhibition was significantly stronger than by BECN1 siRNA when comparing inhibition kinetics (inhibition per time unit) and tested by means of Wald tests ( and Table S1). In normal growth conditions, 32 siRNAs inhibited autophagy significantly better than BECN1 siRNA ().
PRKDC siRNA emerged as the statistically most significant inhibitor of etoposide-induced autophagy with 1.6-fold stronger inhibitory effect than BECN1 siRNA ( and Table S1). It also inhibited basal autophagy significantly better than BECN1 siRNA (). PRKDC, which plays an essential role in DNA repair by NHEJ, belongs to the phosphatidylinositol 3-kinase-related kinase (PIKK) family, whose other members include two other well characterized DNA damage response kinases, ATM and ATR (ATR serine/threonine kinase), as well as autophagy-regulating MTOR [Citation20]. Notably, ATR and ATM siRNAs were also among the candidate inhibitors of the etoposide-induced autophagy in our screen (Table S1).
Figure 1. siRNA screens for kinases that regulate basal and etoposide-induced autophagy. (A) MCF7-RLuc-LC3 and MCF-RLuc-LC3G120A cells were treated in parallel with vehicle (DMSO), 50 µM etoposide or 10 nM rapamycin (positive control) for 15 h. Left, kinetics of autophagic flux (reduction of LC3/LC3G120A relative to T0) in one representative experiment. Right, mean ratios +SD of (LC3/LC3G120A at T15):(LC3/LC3G120A at T0) of three independent triplicate experiments. (B and C) MCF7-RLuc-LC3 and – LC3G120A cells transfected with siRNA pools targeting 710 human kinases, BECN1 siRNA (positive control) or non-targeting control siRNA (NTC) were treated in triplicate with 50 µM etoposide (B) or DMSO (C) for 15 h and analyzed for autophagic flux (reduction of LC3/LC3G120A) as outlined in the timeline (B, top). Ranking of all siRNAs (left) and siRNAs with statistically significantly stronger effect than BECN1 siRNA (right) are shown. (D) Representative immunoblots of indicated DNA damage response proteins in lysates of MCF7 cell transfected with indicated siRNAs for 75 h and treated with DMSO (-) or 50 µM etoposide (+) for the last 15 h. CDK7 served as a loading control. Values, densitometric quantifications of indicated protein/CDK7 ratios relative to control samples. <, unspecific ULK1-independent band. (E) MCF7-RLuc-LC3 and – LC3G120A cells were transfected with indicated siRNAs, treated as indicated for 15 h and analyzed for autophagic flux as in (b). Values represent means +SD of ≥ 3 independent triplicate experiments. P-values were calculated by 2-tailed, homoscedastic student’s t-test (a, c and e) or by a linear regression model and Wald test of autophagy inhibition over time (b).
PRKDC depletion inhibits basal and stress-induced autophagic flux
Prompted by its strong effect on etoposide-induced autophagy, known involvement in DNA damage signaling pathways, and relatively high mRNA expression in MCF7 cells as compared to ATM and ATR (Figure S1B), we focused our further studies on PRKDC. First, we validated its role in autophagy by transfecting MCF7-RLuc-LC3 and MCF7-RLuc-LC3G120A reporter cells with three individual PRKDC siRNAs (6 nM), all of which effectively decreased PRKDC protein levels and activity as judged by reduced etoposide-induced phosphorylation of its substrate, H2AX/H2AFX (H2A.X variant histone) (). Two out of three individual siRNAs inhibited both the basal and etoposide-induced autophagic flux statistically significantly, while the third siRNA showed a similar inhibitory tendency without reaching statistical significance (). In addition to etoposide-induced autophagic flux, PRKDC siRNA pool inhibited that induced by 5-FU, daunorubicin and ionizing radiation in MCF7-RLuc-LC3 reporter cells (). In U2OS osteosarcoma RLuc-LC reporter cells, PRKDC siRNA pool had similar statistically significant inhibitory activity toward both constitutive and DNA damage-induced autophagy, whereas in HeLa cervix carcinoma RLuc-LC3 reporter cells, it significantly inhibited the constitutive autophagic flux and had an inhibitory tendency against etoposide-induced autophagy (Figure S1C).
Due to the essential role of PRKDC in the DNA damage response, the autophagy inhibition observed upon its depletion may be caused by defects in DNA repair. PRKDC siRNA affected, however, neither the etoposide-induced cell cycle arrest (Figure S1D) nor the activation of TP53 pathway as analyzed by the level and phosphorylation of TP53 and the level of the transcriptional target of TP53, CDKN1A/p21CIP1A (cyclin dependent kinase inhibitor 1A) (). Furthermore, siRNA targeting XRCC5/KU80 (X-ray repair cross complementing 5), a regulatory subunit of the PRKDC complex, which is essential for the function of PRKDC in NHEJ [Citation21], had no effect on etoposide-induced autophagic flux (Figure S1E). These data suggest that PRKDC regulates autophagy in a manner independent of its role in the DNA damage repair.
PRKDC depletion inhibits the formation of autophagosomes
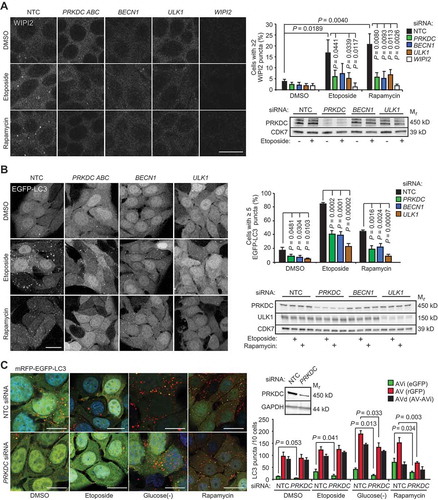
Having established PRKDC as a regulator of autophagic flux, we sought to uncover molecular mechanisms involved in this process. PRKDC siRNA inhibited etoposide-induced formation of WIPI2 (WD repeat domain phosphoinositide-interacting protein 2)-positive and enhanced green fluorescence protein-LC3B (EGFP-LC3)-positive initial autophagic membranes as effectively as BECN1 siRNA (). These data suggest that PRKDC regulates signaling pathways leading to the autophagy initiation rather than those regulating autophagosome maturation and degradation. Thus, we investigated whether this regulation involved MTORC1, the major negative regulator of autophagy initiation, by using an MTORC1 inhibitor rapamycin to induce autophagy in MCF7 cells. The significant reduction in the abundance of rapamycin-induced early WIPI2- and EGFP-LC3-positive autophagic puncta by PRKDC siRNA as well as the inhibition of rapamycin-induced autophagic flux and LC3-lipidation by NU7441 ( and Figure S2A), an ATP competitive inhibitor of PRKDC [Citation22], suggested that PRKDC regulated autophagy in an MTORC1-independent manner. Accordingly, PRKDC depletion neither increased basal MTORC1 activity nor its inhibition by etoposide as analyzed by the phosphorylation status of an MTORC1 substrate, Thr389 of RPS6KB1/p70S6K1 (ribosomal protein S6 kinase B1) (Figure S2B). Next, we challenged the role of PRKDC as a regulator of early autophagic events further by using MCF7 cells expressing mRFP-EGFP-LC3 fusion protein. The green fluorescence emitted by this construct is effectively quenched in acidic autolysosomes allowing the differentiation between initial (AVi; green and red) and degradative (AVd; only red) autophagic vacuoles [Citation23,Citation24]. Depletion of PRKDC in mRFP-EGFP-LC3-expressing MCF7 cells effectively inhibited the accumulation of AVi both in normal growth conditions and following autophagy induction by etoposide, rapamycin or glucose starvation ( and Figure S2C). The accumulation of AVd was moderately inhibited after short-term (2 h) induction of autophagy by rapamycin or glucose starvation but not following longer (24 h) treatment with etoposide ( and Figure S2C). Notably, PRKDC depletion by either transient transfection of PRKDC siRNA or stable expression of PRKDC shRNA inhibited etoposide-, glucose starvation- and rapamycin-induced accumulation of autophagic membranes also in U2OS cells (Figure S2D,E). Taken together, these data strongly support the notion that PRKDC regulates autophagy upstream of the formation of autophagic membranes and independently of MTORC1.
Figure 2. PRKDC depletion inhibits phagophore formation independent of MTORC1. (A) MCF7 cells transfected with indicated siRNAs for 75 h were treated with DMSO or 50 µM etoposide for the last 15 h or 10 nM rapamycin for the last 2 h. Representative confocal images of WIPI2 puncta (left), mean percentages of cells with ≥ 2 WIPI2 puncta (right, top), and immunoblots of indicated proteins (right, bottom) are shown. (B) MCF7-EGFP-LC3 cells were transfected and treated as in (a). Representative confocal images of EGFP puncta (left), mean percentages of cells with ≥ 5 EGFP-LC3 puncta (right, top), and immunoblots of indicated proteins (right, bottom) are shown. (C) MCF7-mRFP-EGFP-LC3 cells transfected with indicated siRNAs for 72 h were treated with DMSO or 50 µM etoposide for the last 15 h, or starved for glucose or treated with 100 nM rapamycin for the last 2 h. Representative confocal images (left) and quantification of initial (AVi), all (AV) and degradative (AVd) autophagic membranes (right) are show. For single-channel confocal images, see Figure S2C. Error bars, SD of ≥ 3 independent experiments with > 50 randomly chosen cells analyzed in each sample. P-values were calculated by 2-tailed, homoscedastic student’s t-test. Scale bars: 10 µm.
PRKDC regulates AMPK-ULK1 signaling pathway
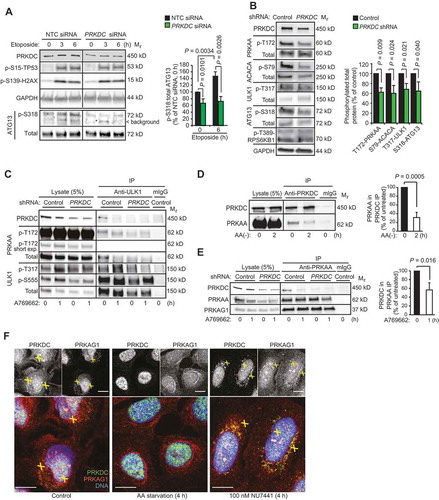
To identify autophagy-regulating signaling pathways controlled by PRKDC, we turned our attention to the autophagy-promoting AMPK-ULK1 pathway [Citation6]. Analyzes of the phosphorylation status of an autophagy relevant ULK1 substrate, Ser318 in ATG13 (autophagy related 13), in control and PRKDC-depleted MCF7 and U2OS cells revealed that both basal and etoposide-induced activities of the AMPK-ULK1 pathway were partially dependent on PRKDC ( and Figure S2E, right panel). The ability of PRKDC to enhance the activity of this pathway was further supported by significantly reduced basal phosphorylation levels of several components of the signaling cascade, i.e. Thr172 in the activation site of PRKAA/AMPKα (protein kinase AMP-activated catalytic subunit alpha), Ser79 in ACACA (acetyl-CoA carboxylase alpha) and Thr317 in ULK1, in PRKDC-depleted cells (). We could not detect the etoposide-induced phosphorylation of AMPK reproducibly, possibly due to its transient and unsynchronized nature. Thus, we studied its activation using two compounds that trigger a faster and stronger AMPK activation, i.e. A769,662 that activates AMPK allosterically and by inhibiting the dephosphorylation of Thr172-PRKAA [Citation25], and 5-aminoimidazole-4-carboxamide ribonucleotide (AICAR) that mimics the effect of AMP on AMPK [Citation26]. PRKDC depletion clearly reduced the ability of the AMPK activators to trigger the phosphorylation of Thr172-PRKAA and its immediate substrates (Thr317-ULK1, Ser555-ULK1 and Ser79-ACACA) (, left panel and Figure S3A). Furthermore, the strong AMPK activation induced by glucose starvation was effectively inhibited by NU7441 treatment in both MCF7 and U2OS cells (Figure S3B,C). Taken together, these data suggest that PRKDC regulates autophagy by enhancing both the constitutive and stimulus-induced activity of the AMPK complex.
Figure 3. PRKDC regulates AMPK-ULK1 signaling pathway. (A) Representative immunoblots (left) and densitometric quantification of indicated proteins (right) in lysates of MCF7 cell transfected with indicated siRNAs for 75 h and treated with 50 µM etoposide for the 0–6 h. (B) Representative immunoblots of indicated proteins from lysates of U2OS-control and U2OS-PRKDC shRNA cells (left) and densitometric quantification of indicated phospho-protein/total protein ratios (right). (C) Immunoprecipitation (IP) of endogenous ULK1 complexes from lysates of control and PRKDC shRNA-infected U2OS cells treated with DMSO (0) or 1 µM A769662 for 1 h (1). (D) Representative immunoblots of IPs of endogenous PRKDC complexes from lysates of U2OS cells grown in complete media (0) or starved for amino acids for 2 h (2) (left) and densitometric quantification of co-precipitating PRKAA1 (right). (E) Representative immunoblots of IPs of PRKAA1 complexes from lysates of control and PRKDC shRNA-infected U2OS cells treated with DMSO (0) or 769662 for 1 h (1) (left) and densitometric quantification of co-precipitating PRKDC (right). (F) Representative confocal images of MCF7 cells grown in complete medium, starved for amino acids or treated with 100 nM NU7441 for 4 h, fixed with paraformaldehyde and stained for endogenous PRKDC (green), PRKAG1 (red) and DNA (Hoechst, blue). Yellow crosses indicate co-localization of the proteins in the cytoplasm and nucleus, respectively. Scale bar: 10 µm. Error bars, SD of ≥ 3 independent experiments. P-values were calculated by 2-tailed, homoscedastic student’s t-test.
PRKDC associates with the AMPK-ULK1 complex
Prompted by the observed PRKDC-dependent activity of the AMPK-ULK1 pathway, we next searched for putative associations between these kinases by immunoblot analyzes of proteins co-precipitating with endogenous PRKDC, AMPK complex (PRKAA1 or PRKAG1) or ULK1. Under normal growth conditions, PRKDC had a relatively strong association with AMPK complex and ULK1, both of which dissociated from PRKDC upon AMPK activation by amino acid starvation (), A769662 ( and Figure S3C), glucose starvation (Figure S3D) or etoposide (Figure S3E). Notably, the shRNA-mediated depletion of PRKDC did not affect the stability of the AMPK complex (), but clearly reduced its association with ULK1 and the AMPK-mediated phosphorylation of ULK1 as mentioned above (). The stability of the AMPK complex was also insensitive to the AMPK-activating A769662 and amino acid starvation ( and Figure S3F). These data suggest that PRKDC interacts with AMPK-ULK1 complex in normal growth conditions and regulates its activation by various stimuli, which eventually trigger the dissociation of PRKDC from the complex. Supporting this model, immunocytochemical analyzes revealed a dynamic co-localization of PRKDC and AMPK complex in MCF7 cells. Akin to the in vitro analyzes of AMPK complexes, their partial co-localization with PRKDC observed in the cytoplasm and nuclei of untreated cells was abolished by amino acid starvation, which triggered a perinuclear accumulation of PRKAG1 and mainly nuclear localization of PRKDC (). On the other hand, inhibition of PRKDC activity by NU7441 increased the co-localization of PRKDC and PRKAG1 in the perinuclear area (). Taken together, our biochemical and immunocytochemical analyzes suggest that a subset of PRKDC associates with the AMPK complex in normal growth conditions to prime it for activation, and that the activation of the AMPK complex results in the dissociation of PRKDC from the AMPK complex in a PRKDC activity-dependent manner.
PRKDC phosphorylates PRKAG1
In order to test whether PRKDC is capable of phosphorylating the AMPK complex, we performed an in vitro kinase assay with immunopurified PRKDC and AMPK complexes. Mixing of the two kinases resulted in an NU7441-sensitive phosphorylation of a 37 kD protein suggesting that PRKDC phosphorylates the PRKAG subunit with a matching predicted molecular weight (). This assumption is supported by a previous study that has identified the association between PRKAG and PRKDC employing yeast 2-hybrid method [Citation27]. We performed an unbiased prediction of putative phosphorylation sites in PRKAG1 using Scansite motif prediction platform [Citation28], which provided two possible recognition motifs for the PIKK family kinases located in the third (Ser192, predicted ATM site) and fourth (Thr284, predicted PRKDC and ATM site) cystathionine-b-synthase (CBS) tandem repeat domains (). These domains act as sensors of cellular AMP:ATP and ADP:ATP ratios [Citation29]. According to the available crystal structure of the holo-AMPK complex [Citation30], the predicted phosphorylation sites are in the close proximity of each other and accessible for kinases on the surface of the protein (). These sites are also highly conserved in evolution from zebrafish and chicken to human and similar ATM and PRKDC/ATM consensus recognition sequences were found in PRKAG3/AMPKγ3, the main PRKAG-subunit in skeletal muscle (Figure S4A,B). Recognition motif comparison by PhophoSitePlus® online resource [Citation31] favored, however, PRKAG1 as a PRKDC and ATM substrate over PRKAG3.
Figure 4. PRKDC phosphorylates PRKAG1. (A) In vitro PRKDC kinase assay with recombinant PRKDC (+) and PRKAG1 immunoprecipitated from MCF7 cells in stringent conditions. When indicated 100 nM NU7441 was added to the reaction. (B) Predicted PRKDC/ATM and ATM phosphorylation sites in PRKAG1. Left, crystal structure of holo-AMPK complex consisting of PRKAA1, PRKAB2 and PRKAG1 [Citation30]. Ser192 and Thr284 are highlighted with yellow. Right, domain structure of PRKAG1 with CBS domains 1–4 and predicted phosphorylation sites highlighted. (C) In vitro PRKDC kinase assay with indicated PRKAG1 peptides as substrates. Radioactivity was analyzed by FUJI phospho-imager plate and spots were quantitated with FujiFilm MultiGauge version 3.2. (D) In vitro PRKDC kinase assay with WT PRKAG1-Ch-Flag or its S192A, T284A and S192A,T284A mutants immunopurified from U2OS cells as substrates. (E) Representative immunoblots of indicated proteins from MCF7 cells transfected with non-targeting control (NTC) or PRKDC siRNA for 60 h and starved for glucose for the last 12 h when indicated (12). (F) Representative immunoblots of indicated proteins from MCF7 cells left untreated or starved for glucose for 12 h with or without 1 h recovery. When indicated cells were retreated with 100 nM NU7441 for indicated times. (G) Representative Immunoblots of indicated proteins from U2OS cells left untreated or starved for glucose for indicated times. (H) Representative immunoblots of indicated proteins from control and PRKDC shRNA-infected U2OS cells left untreated, starved for glucose or treated with 5 µM compound C as indicated. (I) Representative immunoblots of indicated proteins from MCF7 cells and BJ fibroblasts left untreated or starved for glucose for 6 h.
![Figure 4. PRKDC phosphorylates PRKAG1. (A) In vitro PRKDC kinase assay with recombinant PRKDC (+) and PRKAG1 immunoprecipitated from MCF7 cells in stringent conditions. When indicated 100 nM NU7441 was added to the reaction. (B) Predicted PRKDC/ATM and ATM phosphorylation sites in PRKAG1. Left, crystal structure of holo-AMPK complex consisting of PRKAA1, PRKAB2 and PRKAG1 [Citation30]. Ser192 and Thr284 are highlighted with yellow. Right, domain structure of PRKAG1 with CBS domains 1–4 and predicted phosphorylation sites highlighted. (C) In vitro PRKDC kinase assay with indicated PRKAG1 peptides as substrates. Radioactivity was analyzed by FUJI phospho-imager plate and spots were quantitated with FujiFilm MultiGauge version 3.2. (D) In vitro PRKDC kinase assay with WT PRKAG1-Ch-Flag or its S192A, T284A and S192A,T284A mutants immunopurified from U2OS cells as substrates. (E) Representative immunoblots of indicated proteins from MCF7 cells transfected with non-targeting control (NTC) or PRKDC siRNA for 60 h and starved for glucose for the last 12 h when indicated (12). (F) Representative immunoblots of indicated proteins from MCF7 cells left untreated or starved for glucose for 12 h with or without 1 h recovery. When indicated cells were retreated with 100 nM NU7441 for indicated times. (G) Representative Immunoblots of indicated proteins from U2OS cells left untreated or starved for glucose for indicated times. (H) Representative immunoblots of indicated proteins from control and PRKDC shRNA-infected U2OS cells left untreated, starved for glucose or treated with 5 µM compound C as indicated. (I) Representative immunoblots of indicated proteins from MCF7 cells and BJ fibroblasts left untreated or starved for glucose for 6 h.](/cms/asset/1015e476-972d-448d-a10a-0c7c023fada7/kaup_a_1710430_f0004_c.jpg)
Based on the above and the relatively high expression of PRKAG1 in MCF7 cells (Figure S1B), we focused our further studies on PRKAG1. First, we verified the ability of PRKDC to phosphorylate the predicted sites by using short peptide sequences surrounding them (PEFMSK-Ser192-LEELQIGC and KCYLHE-Thr284-LETIINRLC) in an in vitro kinase assay. Both WT peptides were effectively phosphorylated by PRKDC, while their phosphorylated counterparts were not (). Moreover, an in vitro kinase assay using immunopurified full length proteins as substrates showed a strong reduction in the PRKDC-mediated phosphorylation of PRKAG1 when Ser192 or Thr284 alone or together (AA) were mutated to alanine, confirming them as accessible PRKDC substrates in vitro ().
In order to study the phosphorylation of these sites in living cells, we raised phosphor-specific antibodies against them (Figure S4C). The phosphorylation of PRKAG1 Thr284 was clearly reduced by RNAi-mediated depletion of PRKDC, pharmacological inhibition of PRKDC kinase activity by NU7441, glucose starvation and etoposide treatment in MCF7 cells, whereas that of PRKAG1 Ser192 was less affected ( and Figure S4D). Akin to MCF7 cells, the phosphorylation of PRKAG1 Thr284 but not that of PRKAG1 Ser192, was clearly reduced in U2OS cells upon glucose starvation and PRKDC depletion (). Supporting the role of PRKDC as the principal PRKAG1 Thr284 kinase, pharmacological inhibitors of other PIKK family members, i.e. ATM (KU55933) or MTOR (Torin), or closely related phosphatidylinostide 3-kinases (LY294002) did not affect the phosphorylation status of PRKAG1 Thr284 to the same extent as PRKDC inhibition by NU7441 or NU7026 (Figure S4F). Furthermore, phosphorylation of this site was not reduced by the compound c-mediated inhibition of the catalytic activity of the AMPK complex itself (). Notably, the reduced phosphorylation of PRKAG1 Thr284 upon inhibition of PRKDC activity was associated with reduced activation of the AMPK complex both in MCF7 and U2OS cells as analyzed by the phosphorylation status of PRKAA Thr172 (). These data suggest that in cancer cells studied here, constitutive PRKDC activity keeps PRKAG1 Thr284 phosphorylated thereby promoting the activation of the AMPK complex. Indeed, the two autophosphorylation sites in PRKDC, Ser2056 and Thr2609, that reflect the PRKDC kinase activity [Citation32], were phosphorylated in MCF7 cells in optimal growth conditions, and their phosphorylation was not markedly altered by glucose starvation (, left). On the other hand, neither PRKDC Ser2056/Thr2609 nor PRKAG1Thr284 was phosphorylated in primary fibroblasts whether grown in complete medium or starved for glucose (, right). The lack of PRKDC-PRKAG1 pathway activation in these primary cells was accompanied by the lack of AMPK complex activation (phosphorylation of PRKAA Thr172) in optimal growth conditions and only a very weak activation upon glucose starvation (). Thus, the constitutive activity of PRKDC in cancer cells may enhance the basal activity and stimulus-dependent activation of the AMPK complex via phosphorylation of Thr284 in the PRKAG1 subunit.
Phosphorylation of PRKAG1 regulates AMPK localization and activity
Having established Ser192 and Thr284 as relevant PRKAG1 phosphorylation sites in cancer cells, we studied their putative role in AMPK activation and signaling. Because these sites are localized in the CBS repeats responsible for sensing intracellular AMP:ATP and ADP:ATP ratios, we first investigated whether their phosphorylation status affected the ability of AMP to activate the AMPK complex. For this purpose, we expressed heterotrimeric α2β1γ1 AMPK complex consisting of GST-PRKAA2, PRKAB1-Flag and either WT or phosphorylation-deficient mutants (Ser192Ala or Thr284Ala) of HA-PRKAG1 in COS7 human kidney epithelial cell, and purified the complexes using anti-Flag affinity agarose gel. Supporting the idea that PRKAG1 phosphorylation promotes AMPK activity, PRKAA2 Thr172 was 61% and 43% more phosphorylated when in complex with the WT PRKAG1 than when in the complex with Ser192Ala (PRKAG1S192A) and Thr284Ala (PRKAG1T284A) mutants of PRKAG1, respectively (). The mutant PRKAG1 proteins formed, however, heterotrimeric AMPK complexes as efficiently as the WT protein (). In an in vitro kinase assay, the WT and mutant AMPK complexes had similar basal kinase activities, all of which were effectively stimulated by AMP (). The AMP-induced activation of the PRKAG1T284A containing complex was similar to that of the WT complex, whereas that of the PRKAG1S192A containing complex was even more efficient than the WT complex (). Thus, the phosphorylation of PRKAG1 at Ser192 and Thr284 promotes the AMPK activity in cells without enhancing the formation of heterotrimeric AMPK complexes or the ability of AMP to bind PRKAG1 and activate the AMPK complex.
Figure 5. PRKDC regulates PRKAG1 localization and activity. (A) Representative immunoblots of indicated proteins from COS7 cells transfected with GST- PRKAA2, PRKAB1-Flag and either WT HA-PRKAG1 or its phosphorylation-deficient Ser192 and Thr284 mutants (S192A or T284A). (B) In vitro kinase activity assay of AMPK complexes immunopurified with anti-Flag agarose gel from COS7 cells transfected as in (a) and left untreated or treated with 100 µM AMP (left). Error bars, SEM of 4 independent experiments. Right, representative immunoblots of indicated proteins from total cell lysates and anti-Flag IPs. (C) Representative images of MCF7-shPRKAG1 cells transiently transfected with WT or PRKAG1S192A,T284A-mCherry-Flag (left), and quantification of the subcellular localization of the transfected proteins (right). Values represent means +SD of three independent experiments with ≥ 50 randomly chosen cells analyzed in each sample. Crosses mark cells with nuclear/diffuse (white) and mainly cytoplasmic (green) localization of PRKAG1-mCherry-Flag. Scale bars: 10 µM. (D) IP of AMPK complexes with anti-Flag antibodies from lysates of MCF7 cells transiently transfected with either WT or PRKAG1S192A,T284A-mCherry-Flag. Left, representative immunoblots of indicated proteins in IPs and lysates. Right, quantification of co-precipitating PRKDC from three independent experiments +SD. (E) IP of AMPK complexes with anti-Flag antibodies from lysates of MCF7-shPRKAG1 and -shNTC cells transiently transfected with WT or PRKAG1S192A,T284A-mCherry-Flag. (F) LC3 puncta in MCF7-shPRKAG1 cells transiently transfected with WT or PRKAG1S192A,T284A-mCherry-Flag. Error bars, SEM of ≥ 7 samples with 10–30 cells analyzed in each. P-values were calculated by 2-tailed, homoscedastic student’s t-test.
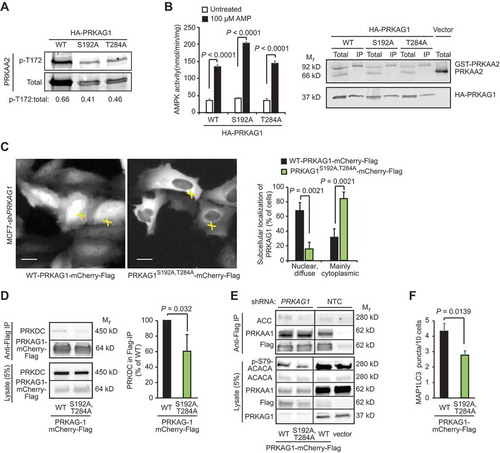
In order to study the role of PRKAG1 phosphorylation in living cells, we generated stable PRKAG1-depleted MCF7 cells by lentiviral infection of PRKAG1 shRNA (MCF7-shPRKAG1). As expected, the depletion of PRKAG1 resulted in the destabilization of the AMPK complex as evidenced by the disappearance of the PRKAA1 subunit (Figure S5A), as well as reduced growth rate and stressed appearance of the cells. Interestingly, the depletion of the AMPK complex also resulted in reduced phosphorylation of T2609-PRKDC (Figure S5B), suggesting that AMPK may regulate the activation of PRKDC. We then reconstituted the PRKAG1-depleted cells with either WT or a phosphorylation defective double mutant PRKAG1S192A,T284A fused to mCherry and Flag (PRKAG1-mCh-Flag). Microscopic analysis of transiently expressed proteins revealed that contrary to the primarily nuclear localization of the WT PRKAG1-mCh-Flag, its phosphorylation defective PRKAG1S192A,T284A mutant was predominantly in the cytoplasm of MCF7-shPRKAG1 cells (). Notably, the PRKAG1S192A,T284A formed a perinuclear rim resembling that observed for the endogenous PRKAG1 upon PRKDC inhibition ( and ). Similar differences between the localization of WT and PRKAG1S192A,T284A-mCherry-Flag were observed in U2OS cells expressing the endogenous PRKAG1 (Figure S5C). Immunoprecipitation of the AMPK complexes from transiently transfected MCF7 cells, revealed that complexes containing the PRKAG1S192A,T284A had reduced affinity to PRKDC and ACACA and reduced capacity to phosphorylate Ser79-ACACA, while its affinity to PRKAA1 was unchanged (,). In line with the reduced AMPK activity, MCF7-shPRKAG1 cells transfected with the PRKAG1S192A,T284A had significantly fewer LC3-positive autophagic vesicles than cells transfected with the WT protein (). Taken together, these data suggest that PRKDC primes AMPK for the activation by upstream kinases, and that phosphorylation of Ser192 and/or Thr284 in PRKAG1 is responsible for this effect.
Phosphorylation of PRKAG1 enhances lysosomal localization of AMPK and STK11
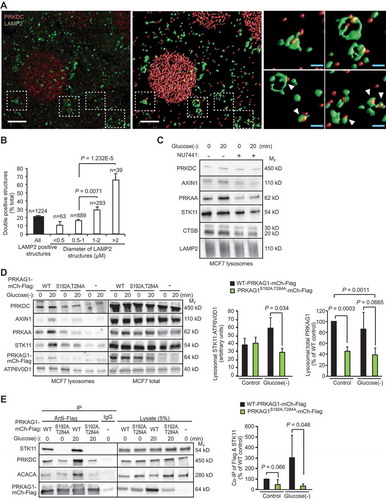
Outer membranes of late endosomes and lysosomes (hereafter referred to as lysosomes) have recently emerged as important signaling platforms for major metabolic kinases, including AMPK and MTORC1 [Citation7]. Immunocytochemistry combined with deconvolution analysis revealed that PRKDC co-localized with over 20% of the LAMP2-positive endolysosomal membranes with a preference to the larger structures with over 1 µm diameter, some of which may represent autolysosomes (). The physical association of PRKDC with the endolysosomal compartment was further confirmed by detection of PRKDC in the lysates of iron-dextran-purified LAMP2- and ATP6V0D-positive lysosomes (). Therefore, we investigated whether PRKDC regulated the lysosomal localization of the AMPK complex, its activating kinase STK11 or AXIN1, a scaffold protein necessary for the STK11-mediated activation of AMPK on lysosomal membranes [Citation7,Citation33]. PRKAA1, STK11 and AXIN1 were detected in lysosomal fractions of unstimulated MCF7 cells and their lysosomal association was further increased upon short glucose starvation (). This increase was completely abolished upon inhibition of PRKDC activity by NU7441 (). To test whether the glucose starvation-induced and PRKDC-dependent lysosomal recruitment of AMPK and STK11 complexes required the phosphorylation of Ser192 and/or Thr284 residues of PRKAG1, we analyzed the lysosomal localization of these complexes in MCF7 cells transfected with either the WT PRKAG1-mCherry-Flag or its phosphorylation defective PRKAG1S192A,T284A. Immunoblot analyzes of purified lysosomes from transfected cells revealed a reduction in the lysosomal recruitment of PRKAG1S192A,T284A both in control condition and upon glucose starvation (). Similar amounts of STK11 and AXIN1 were found in the lysosomal fractions of unstimulated MCF7 cells expressing PRKAG1-mCherry-Flag constructs, but their further recruitment to lysosomes in response to glucose starvation was inhibited by the PRKAG1S192A,T284A as compared to the WT protein (). The reduction in their lysosomal recruitment was associated with significantly reduced association of the PRKAG1S192A,T284A-mCherry-Flag with STK11 ( and Figure S6A). The PRKAG1S192A,T284A failed also to enhance the AMPK activation upon glucose starvation as analyzed by the phosphorylation of PRKAA Thr172 and association with ACACA ( and Figure S6A). Based on these data, we conclude that the PRKDC-mediated phosphorylation of PRKAG1 plays a critical role in the lysosomal activation of AMPK through the regulation of the lysosomal localization of the AMPK complex and its subsequent association with STK11.
Figure 6. PRKDC regulates the lysosomal localization and STK11 association of the AMPK complex. (A) Representative laser scanning confocal images of MCF7 cells fixed with methanol and stained for PRKDC and LAMP2. A representative cross-sectional image (z: 100nm) (left) and surface-rendered de-convoluted z-stacks (middle and right) are shown. Insets show representative PRKDC- and LAMP2-positive structures marked with white arrowheads (right). Scale bars, 5 µm (white) and 1 µm (blue). (B) Percentage of PRKDC- and LAMP2-double positive structures of all LAMP2-positive structures in MCF7 cells visualized as in (a). Values represent means + SEM of 12 randomly chosen cells with a total of 1224 LAMP2-positve structures analyzed. (C) Representative immunoblots of indicated proteins from lysosomes purified from MCF7 cells starved for glucose for indicated times. When indicated (+), cells were pre-treated with 1 µM NU7441 for 16 h. (D) Representative immunoblots of indicated proteins from lysosomes and total cell lysates of MCF7 cells transiently transfected with WT PRKAG1S192A,T284A-mCherry-Flag or an empty vector (-) and starved for glucose for indicated times (left), and densitometry quantification of STK11/ATP6V0D1 and lysosomal/total PRKAG1-mCherry-Flag ratios in lysosome samples (right). Error bars, SD of ≥ 3 independent experiments. (E) IP of AMPK complexes with anti-Flag antibodies from lysates of MCF7 cells transiently transfected with either WT or PRKAG1S192A,T284A-mCherry-Flag and starved for glucose for indicated times (left), and densitometric quantification of STK11 in anti-Flag IPs (right). Error bars, SD of ≥ 3 independent experiments. P-values were calculated by 2-tailed, homoscedastic student’s t-test.
Discussion
By exploiting RNAi technology and a luciferase-based live cell reporter assay for autophagic LC3 turnover in MCF7 breast cancer cells, we have here identified multiple genes encoding for kinases and kinase-related proteins as putative regulators of basal and etoposide-induced autophagic flux. Validating our screening approach, bona fide autophagy genes, phosphoinositide-3-kinase regulatory subunit 4 (PIK3R4) and ULK1 as well as several previously reported autophagy regulators, e.g. GSK3A (glycogen synthase kinase 3 alpha) and GSK3B, inhibitor of IKBKB (nuclear factor kappa B kinase subunit beta) and ATM, are among the candidate genes, whose depletion inhibits autophagic flux [Citation34 Citation35 Citation36–Citation37]. On the other hand, the roles of the majority of the identified genes, including the three strongest candidates for regulators of either etoposide-induced or basal autophagic flux, i.e. PRKDC, NUAK1 (NUAK family kinase 1), MAP3K9 (mitogen-activated protein kinase kinase kinase 9), PIK3AP1 (phosphoinositide-3-kinase adaptor protein 1), TSKS (testis specific serine kinase substrate) and NRBP2 (nuclear receptor binding protein 2), have not been addressed at all, or are as yet controversial. It should be noted that further validation is needed to define our candidates as true regulators of autophagy.
PRKDC siRNA targeting PRKDC was statistically the strongest inhibitor of etoposide-induced autophagic flux and scored also as a significantly better inhibitor of basal autophagic flux than BECN1 siRNA in our screen. Our validation enforced the requirement of PRKDC for basal autophagy in MCF7, U2OS and HeLa cells as well as for that induced by etoposide, 5-FU, daunorubicin and irradiation in MCF7 and U2OS cells. Importantly, our data strongly suggest that PRKDC regulates autophagy independent of its well-defined role in DNA repair as the effect of XRCC5 siRNA-mediated depletion of KU80, which is essential for PRKDC-mediated DNA repair [Citation21], failed to inhibit etoposide-induced autophagy, and PRKDC depletion had no major effect on etoposide-induced DNA damage response as analyzed by the cell cycle profile and the phosphorylation of TP53. The role of PRKDC in autophagy has been previously addressed in only few studies with somewhat controversial results [Citation18,Citation38]. Based on the comparison of PRKDC expressing, radiation resistant M059K cells and PRKDC deficient, radiation sensitive M059J cells derived from the same malignant glioma specimen, Daido and coworkers have suggested that PRKDC inhibits autophagy and protects glioma cells against radiation-induced autophagy-dependent cell death [Citation38]. On the contrary and in line with our results, Yoon and coworkers have reported more autophagic vesicles in PRKDC expressing M059K cells than in PRKDC deficient M059J cells upon capsaicin treatment [Citation39]. These discrepancies could be caused by cell or stimulus specific differences. Alternatively, the observed difference in radiation-induced autophagy between M059J and M059K cells observed by Daido and coworkers could be due to other changes than PRKDC expression levels. Supporting this view, PRKDC deficient M059J cells highly upregulated levels of ULK1 (Figure S6B), which could compensate for their lack of PRKDC and explain their enhanced radiation-induced autophagy. Further supporting the autophagy-stimulating function of PRKDC, Zhen and coworkers have recently reported that pharmacological inhibitors, PRKDC shRNA and PRKDC-targeting MIR101 inhibit salinomycin-induced cytoprotective autophagy in osteosarcoma cells [Citation38].
The data presented above demonstrate that PRKDC associates with the AMPK complex and regulates its subcellular localization and association with the major AMPK kinase, STK11, by phosphorylating the PRKAG1 subunit of the AMPK complex. Interestingly, these data also suggest that this regulation occurs, at least partially, on the lysosomal membrane, which is emerging as the major site for the coordination of cellular metabolism [Citation7,Citation40 Citation41–Citation42]. Supporting our findings, the association between PRKDC and AMPK complex has been identified by two previous studies. Amatya and coworkers have demonstrated an interaction between PRKDC and PRKAG1 using yeast two-hybrid method and co-immunoprecipitation from mammalian cells [Citation27], while Lu and coworkers have verified this interaction in mammalian cells by co-immunoprecipitation and immunocytochemistry [Citation43]. In line with our data, these studies have also identified PRKDC as a positive regulator of AMPK complex activity, however, without addressing the underlying mechanism. Here, we identified Ser192 and Thr284 residues of PRKAG1 as PRKDC substrates and confirmed their necessity for PRKDC-mediated activation of AMPK complex by site-specific mutagenesis. The AMPK complex containing the mutant of PRKAG1S192A,T284A were not only defective in stress-induced activation but showed also a dramatically altered subcellular localization, being predominantly cytoplasmic contrary to the primarily nuclear localization of the WT protein. Supporting the role for PRKDC in subcellular localization of the AMPK complex, the localization of the complex containing the mutant of PRKAG1S192A,T284A was similar to that observed in cells where PRKDC activity is inhibited by Ebstein-Barr virus latent membrane protein 1 (LMP1) [Citation43].
Lysosomal membrane has been recently recognized as an important site for the activation of AMPK [Citation7,Citation44]. In the absence of glucose, STK11 and scaffold protein AXIN1 translocate to the lysosomal membrane, where they form a large complex with AMPK, vacuolar H+-ATPase and Ragulator complexes [Citation7]. This super complex, referred to as the AXIN1-based AMPK activation complex [Citation8], serves as the site for STK11-mediated phosphorylation and activation of PRKAA1 [Citation7]. Our data showing that both genetic and pharmacological disturbance of PRKDC-mediated phosphorylation of PRKAG1 inhibits the lysosomal recruitment of the AMPK complex, STK11 and AXIN1 strongly suggest that this phosphorylation enhances the activation of the complex by promoting the formation of the AXIN1-containing AMPK activation complex. The constitutive nature of both the PRKDC-PRKAG1 association and the PRKAG1 Ser192 and Thr284 phosphorylation together with their decline upon AMPK activating stimuli suggest that PRKDC-mediated phosphorylation of PRKAG1 serves as a priming signal for the activation of AMPK complex while being dispensable for the maintenance of the kinase activity. Interestingly, the N-myristoylation of PRKAB subunits, which is necessary for the recruitment of the AMPK complex to the lysosomal membrane [Citation44], has been reported to serve a similar gatekeeper function, i.e. being necessary for the initial AMP-induced phosphorylation of PRKAA1 but not for the subsequent allosteric activation by AMP once PRKAA1 is phosphorylated [Citation45]. Thus, it is tempting to speculate that these two events are coordinated e.g. by PRKDC-mediated phosphorylation of PRKAG1 occurring only on the lysosomal membrane or PRKAG1 phosphorylation being a prerequisite for PRKAB myristoylation. In light of our present data showing that some PRKDC co-localizes with lysosomes and that the lysosomal recruitment of PRKAG1 is inhibited by the mutation of PRKDC phosphorylation sites, both scenarios remain possible.
The ability of PRKDC to regulate AMPK activation links PRKDC not only to the regulation of autophagy, but also to the regulation of cellular metabolism in a more general manner. Contrary to the activating effect of PRKDC on AMPK, aging-related increase in PRKDC activity has been reported to inhibit AMPK activity in aging muscle cells via phosphorylation-mediated inhibition of heat shock protein 90 chaperone activity toward PRKAA2, a muscle specific PRKAA isoform [Citation46]. Thus, the crosstalk between PRKDC and AMPK complex is likely to have several layers and depend on cellular context. Regarding the emerging role of PRKDC in the control of cellular metabolism, it is interesting to note that PRKDC itself is regulated by the metabolic state, fed conditions favoring its activation and fasting conditions inhibiting it [Citation47]. Furthermore, PRKDC can regulate metabolism in an AMPK independent manner by phosphorylating UTF1 (undifferentiated embryonic cell transcription factor 1), which activates the transcription of fatty acid synthase and triglyceride synthesis [Citation47].
Taken together, data presented here provide a molecular mechanism explaining how PRKDC enhances AMPK activation and autophagy, thereby linking DNA damage response not only to the regulation of autophagy but to the control of cellular metabolism in general.
Materials and methods
Cell culture, reagents and treatments
The MCF7 cell line used here is the S1 subclone of the human ductal breast carcinoma cell line MCF7 selected for high TNF sensitivity [Citation48]. Human HeLa cervix carcinoma, U2OS osteosarcoma (ATCC THB-96), M059J (ATCC CRL-2366) and M059K (ATCC CRL-2365 glioma cells as well as COS7 (ATCC CCL-70) kidney epithelial cells were obtained from ATCC. MCF7-EGFP-LC3, mRFP-EGFP-LC3, -RLuc-LC3 and -RLuc-LC3G120A and HeLa-RLuc-LC3 and -RLuc-LC3G120A have been described previously [Citation19,Citation24,Citation49]. U2OS-RLuc-LC3 and -RLuc-LC3G120A were created here as described for MCF7 cells previously [Citation19]. MCF7 cells were cultured in RPMI 1640 with Glutamax (Thermo Fisher Scientific [TFS], 61870–010) supplemented with 6% heat-inactivated fetal calf serum (TFS, 10270–106), penicillin and streptomycin (TFS, 15140–122). Other cells were cultured in DMEM (TFS, 31966–021) supplemented with 10% heat-inactivated fetal calf serum, penicillin and streptomycin. The cells were maintained in a humidified atmosphere at 37°C, 5% CO2. All cell lines were found negative for mycoplasma using Venor®GeM Classic PCR kit from Minerva Biolabs (11–1100). 3-methyladenine (3-MA; 189490), 5-fluorouracil (F6627), AICAR (A9978), camptothecin (208925), cisplatin (232120), compound c (P5499), daunorubicin (251800), doxorubicin (324380), hydroxyurea (400046), etoposide (341205), and rapamycin (R0395) were purchased from Sigma-Aldrich; NU7441 from Kudos Pharmaceuticals; Oligofectamine (12252 011) from Invitrogen; and coelenterazine (S2001), enduren (E6481), and 5x passive lysis buffer (E1941) from Promega. Amino acid and glucose starvations were performed in Hanks Balanced Salt Solution (HBSS; TFS, 14025–092) and glucose free DMEM with glutamate (Gibco, 11966025), respectively. Drugs were added simultaneously during co-treatments. Ionizing radiation was delivered by an X-ray generator (150 kV; 6 mA; 0.708 Gy/min dose rate, YXLON).
Transfections
Plasmids listed in were transfected to subconfluent cells with Fugene-HD (Invitrogen, E291A) and in the case of rescue experiments with Gene Juice (Novagen, 70967–3) transfection reagents according to manufacturers’ instructions. The medium was changed 16 h after the transfection and the experiments were performed 32 h later.
Table 1. Key Resources.
siRNA transfections were performed as reverse transfections using 5–20 nM siRNA and Oligofectamine transfection reagent (Promega, 12202–011) following manufacturer’s protocols. siRNA sequences are listed in . The Silencer® Select Human Kinase siRNA Library V4 (Ambion, 4397918) was used in the screen.
Validated Control, PRKAG1 and PRKDC shRNA lentiviral vectors (MISSION; Sigma-Aldrich) and a lentiviral vector encoding for shRNA-resistant PRKAG1 were amplified and infected according to standard protocols. Cells were selected with puromycin for a minimum of five passages and experiments were performed at passages 6–10. The downregulation of PRKDC (approximately 50% in passage 6) was controlled during each experiment and cells were discarded if it dropped below 30%.
Site-directed mutagenesis
Site-directed mutagenesis of the constructs was carried out using QuickChange Lightning mutagenesis kit (Agilent, 210518). Oligos for mutation PCR were designed by Agilent QuickChage Primer Design [Citation54], and they are listed in . Mutated constructs and all plasmids were confirmed by sequencing.
Autophagic flux assay and screen
The ratio of luciferase activity between Rluc-LC3 and Rluc-LC3G120A expressing cells was used as a measure for autophagic flux in living cells or cell extracts as described previously [Citation19]. The screen was performed by measuring autophagic flux in living cells. Briefly, cells were transfected with a pool consisting of 6 nM of each of the three unique siRNAs targeting each kinase. The control siRNAs, non-targeting control siRNA and BECN1 siRNA (positive control for autophagy inhibition) were used at 18 nM. The medium was changed 52 h after the transfection with medium containing 50 nM EnduRen, and cells were allowed 8 h to achieve equilibrium between intra- and extracellular EnduRen, before the first measurement of luciferase activity (referred to as T0) and treatment with etoposide (50 µM) or DMSO. Luciferase activity was subsequently measured 4, 8, 12 and 15 h after the treatment. Luminescence was measured using the Varioskan Flash plate-reader (Thermo Electron Corporation).
Detection of autophagic membranes
The puncta formation in MCF7-EGFP-LC3 and MCF7-mRFP-EGFP-LC3 cells was assessed after fixation in 3.7% formaldehyde (Sigma-Aldrich, 252549) applying Olympus IX-70 inverted microscope with a 20x Lucullan objective with numerical aperture of 0.45 or Zeiss LSM510 microscope with a 40x Plan-APOChromat with numerical aperture of 1.3/oil. LC3-puncta formation in other cells and WIPI2 puncta formation were analyzed after methanol permeabilization and appropriate antibody staining ().
Immunoblotting
Immunoblotting was performed using standard protocols described previously [Citation55]. Primary antibodies used are listed in . Secondary antibodies included HRP-conjugated rabbit anti-mouse IgG (DAKO, P0260),The signal was detected with Clarity Western ECL Substrate (Bio-Rad, 170–5061), and Luminescent Image Reader (LAS-1000Plus, Fujifilm, Tokyo, Japan), and quantified by densitometry with ImageJ software [Citation56].
Immunoprecipitation
Proteins from cell lysates were extracted with lysis buffer (25 mM Tris, pH 7, 150 mM NaCl, 5 mM MgCl2, 0.5% NP-40 (Sigma-Aldrich, 74385), 1 mM DTT (Sigma-Aldrich, D9779), 5% glycerol (Sigma-Aldrich, G5516), 1 mM phenylmethanesulfonyl fluoride (Sigma-Aldrich, P7626), 2 μg/ml pepstatin (Sigma-Aldrich, EI10), 2 μg/ml leupeptin (Chalbiochem, 108976), and 2 μg/ml aprotinin (Sigma-Aldrich, 616371)) in the presence of phosphatase inhibitors (Roche Applied Science, 04906837001) at 4°C. Cellular debris was removed by centrifugation at 13,000 × g for 10 min at 4°C. One milligram of protein from the cell lysates was immunoprecipitated for 4 hours at 4°C, using indicated antibodies listed in and protein G (Sigma-Aldrich, P3296) or protein A (GE Healthcare, 17-5138-01) agarose beads. After the last washing step, SDS-PAGE buffer was added (40 µl) and samples were heated at 95°C for 10 min. 15–30 μl of immunopurified proteins/lane were separated on a 4–15% polyacrylamide, precast Mini-PROTEAN TGS gel 4–15% (BIO-RAD, 456–10863) followed by transfer on Trans-Blot Turbo Transfect Pack (0.2 μm) nitrocellulose (BIO-RAD, 1704159), and immunoblotting with indicated antibodies listed in .
Immunocytochemistry and confocal microscopy
Cells grown on coverslips and fixed either in methanol (−20°C) for 2 min or in 4% paraformaldehyde (Sigma-Aldrich, G-5882) in phosphate-buffered saline (PBS; Gibco, 20012043) for 10 min were washed with PBS, quenched with 50 mM NH4Cl for 10 min, washed with PBS and blocked in buffer 1 (1% bovine serum albumin [BSA; Sigma-Aldrich, A9647], 0.3% Triton X-100 [Sigma-Aldrich, T9284], 5% goat serum [Dako, X090710] in PBS) for 20 min before incubation with the indicated primary antibodies () in buffer 1 for 16 h at 4°C. After three washes in buffer 3 (PBS, 0.05% Tween-20 [Sigma-Aldrich, P1379]), coverslips were incubated with appropriate secondary antibodies (Alexa Fluor® 488-conjgated donkey anti-mouse IgG or Alexa Fluor® 568-conjugated donkey anti-rabbit IgG from Promega [A-21202, A-10042]) for 1 h in buffer 2 (0.25% BSA, 0.1% Triton X-100, PBS), washed three times in buffer 2, mounted with Prolong antifade Gold with DAPI (Life Technologies, P36935) and dried for 24 h at 20°C. Cells were imaged with a Zeiss 700 laser scanning confocal microscope equipped with the Plan-Apochromat 63x/1.40 Oil DIC M27 objective and Zen 2010 software (Carl Zeiss, Jena, Germany).
Deconvolution and object-based colocalization analyzes
Cells were imaged with a Zeiss 700 laser scanning confocal microscope as above. Pinholes were set so that the section thickness was equal for all channels and acquisition settings were kept constant. 6–7 equidistant (0.1 µm) planes (z-stacks) were acquired at a resolution of 2048 × 2048 with a 2.0x numerical zoom to achieve the Nyquist criterion (41x41 nm per pixel, Scientific Volume Imaging Nyquist rate and PSF calculator). Image deconvolution and object-based colocalization were performed with Huygens Professional Software version 19.04 (Scientific Volume Imaging, The Netherlands [Citation57],) using a theoretical point-spread function. Deconvolution was performed by the Classic Maximum Likelihood Estimation algorithm with default settings: number of iterations 40, signal to noise ratio 20, quality threshold 0.05. For object-based colocalization analysis, regions of interest, i.e. cell contour were defined manually on 3D deconvoluted images excluding the PRKDC-positive nuclear staining. The garbage volume was set at 5 voxels (ca. 0.0008 μm3 – equivalent to 41 × 41 × 500 nm equal to volume of observed space on specimen), approximation of the Z resolution limit of the microscope. LAMP2-positive structures with a diameter less than 400 nm were excluded. 12 cells from two independent experiments were analyzed.
Generation of antibodies
Phosphorylation specific (p-Ser192 and p-Thr284) polyclonal PRKAG1/AMPKγ1 antibodies were produced in rabbit using a peptide synthesized by JPT Peptide Technologies GmbH (Germany) with sequences listed in . Prior to immunization peptides were coupled to Imject maleimide-activated Keyhole Limpet Hemocyanin (mcKLH, Pierce, 77605) by GenScript according to manufacturer’s protocol [Citation58]. Antibodies were purified from positive sera using peptide antigen affinity columns prepared with a standard protocol (sulfo-link immobilization columns, Pierce, 44999) with immobilized peptides against phosphorylated peptides following the manufacturer’s protocol. After low pH elution (50 mM glycine, pH 2.5), the antibodies were cleared for cross-reactivity on columns with synthetic peptides corresponding to the non-phosphorylated forms of Ser192 and Thr284 peptides immobilized to peptide antigen affinity columns (Pierce, 44999) and eluted with low pH (50 mM glycine, pH 2.5). Antibodies were stored as aliquots in PBS, 50% glycerol (Sigma-Aldrich, G5516), 5% BSA (Sigma-Aldrich, A4503), and sodium azide (Sigma-Aldrich, S8032) at −20°C. The specificity of antibodies was tested against phosphorylated peptides immobilized to nitrocellulose membranes (Bio-Rad, 456–10863) by dot blotting.
Protein purification and in vitro kinase activity assay
PRKAG1-mCherry-Flag proteins were purified from transiently transfected MCF7 cells with Anti-FLAG® M2 Affinity Gel (Sigma-Aldrich, A-2220) using RIPA lysis buffer (50 mM Tris, pH 7.5, 150 mM NaCl, 50 mM NaF (Sigma-Aldrich, 201154), 1 mM EDTA (Sigma-Aldrich, E6752), 1 mM EGTA (Sigma-Aldrich, E4378), 1% Triton X-100 (Sigma-Aldrich, T9284), 0.5% deoxycholate (Sigma-Aldrich, D6750), 0.05% SDS (Sigma-Aldrich, L3771)). The immune complexes were washed extensively with RIPA buffer and three times with PRKDC reaction buffer (50 mM HEPES, pH 7.5, 100 mM KCl, 10 mM MgCl2, 0.2 mM EGTA, 0.1 mM EDTA, 1 mM DTT, 5 μg calf thymys DNA). For the in vitro kinase reaction, the FLAG-purified proteins were either immobilized to FLAG-beads or released before kinase reaction by using excess amount of FLAG-peptide.
For the PRKDC kinase assay, indicated PRKAG1-Cherry-FLAG proteins were incubated at 33°C for 20 min in PRKDC reaction buffer supplemented with 0.2 mM ATP, 0.2 μg/ml BSA, 0.2 µl α-32P-ATP (3000 Ci/mmol) and 250 U purified PRKDC (Promega, V581A). Reaction was terminated by adding SDS sample buffer and subjected to SDS-PAGE following the blotting of the SDS-PAGE samples on to nitrocellulose filters. Incorporation of PRKDC-labeled phosphate on PRKAG1 was quantitated using an autoradiography with phosphoimager plates following plate read by Typhoon 9410 variable mode imager (Amersham Biosciences). Typhoon 9410 raw files were further quantitated by MultiGauge V3.0 (FujiFilm).
To test the PRKDC-mediated phosphorylation of peptides, 2 µg of non-phosphorylated (Ser192: amine-PEFMSKSLEELQIGC-amide; Thr284: amine-KCYLHETLETIINRLC-amide) or phosphorylated (p-Ser192: amine-PEFMSK-pS-LEELQIGC-amide; p-Thr284: amine-KCYLHE-pT-LETIINRLC-amide) PRKAG1 peptides (JPT peptide technologies GmbH) corresponding to predicted PRKDC phosphorylation sites were diluted in PRKDC reaction buffer (supplemented with 1 µM ATP, 0.2 μg/ml BSA, 10 µCi γ-32P-ATP [3000 Ci/mmol] (NEG002250UCSBF4) and 250 U purified PRKDC) and incubated at 34°C for 20 min, heated to 60°C and spotted to nitrocellulose membrane. Dried peptide-containing filters were fixed with glutaraldehyde (Sigma-Aldrich, G5882) (3%) in PBS at 20°C for 5 min, washed 3 × 5 min with PBS under vigorous agitation before the incorporation of labeled phosphate was quantified as above.
In vitro AMPK activity assay
Heterotrimeric AMPK complexes consisting of GST-PRKAA2, PRKAB1-FLAG and WT or mutated HA-PRKAG1 were immunoprecipitated from COS7 cells transfected with corresponding plasmids () using Anti-FLAG M2 affinity agarose gel and washed repeatedly with buffer A (50 mM HEPES, pH 7.4, 150 mM NaCl, 10% glycerol and 0.1% Tween-20) prior to activity assay. AMPK activity assays using radiolabeled [γ-32P]-ATP were conducted as described previously [Citation59,Citation60]. Assays were conducted in the presence of 100 µM SAMS peptide (NH2-HMRSAMSGLHLVKRR-COOH), 5 mM MgCl2, 200 µM [γ-32P]-ATP for 10 min at 30°C in the presence/absence of 100 µM AMP. Phosphotransferase activity was quenched by spotting onto P81 phosphocellulose paper (Whatman, GE Healthcare) followed by repeated washes in 1% phosphoric acid. 32P-transfer to the SAMS peptide was quantified by liquid scintillation counting (Perkin Elmer).
Purification of lysosomes
Subconfluent cells grown in 15 cm petri dishes in 20 mL complete medium were treated for 18 h with 0.2 mL iron dextran solution (53 mg/mL in deionized water; prepared essentially as described previously [Citation61], washed in medium without iron dextran, and cultured for additional 4 h in complete medium before the indicated treatments. After treatments, cells were scraped off in ice cold KPBS (136 mM KCl (Sigma-Aldrich, P9333), 10 mM PBS, pH 7.25 adjusted with KOH) and centrifuged at 1000x g for 2 min at 4°C. The pellet was dissolved in 950 µl of KPBS and homogenized with 10 strokes through a 25-gauge needle, and centrifuged at 1000 g for 2 min at 4°C. The supernatant was loaded to prewashed 3 ml MACS-magnetic columns (Miltenyi Biotech, 130-042-201) prewashed with KPBS and placed into MiniMacs magnetic separator (130-090-32) at 4°C. Loaded columns were washed 3x with 1 ml of KPBS and bound lysosomes were released from the matrix by removing the MACS-column from the magnetic field and applying 80 µL of KPBS buffer on the column. The eluted material was mixed with 80 µl of 2x SDS-PAGE buffer and analyzed for immunoblotting.
Cell cycle analysis
Cells were treated as indicated, fixed in methanol, and stained with propidium iodine (Sigma-Aldrich, P4170). Flow cytometry (FACSCalibur, BD Biosciences) was performed on 10,000 cells/sample and data were analyzed using the FlowJo software (www.flowjo.com).
Statistical analyzes
For statistical analyzis of the etoposide screen, we applied a linear regression model to study inhibition over time. siRNAs that inhibited etoposide-induced autophagic flux significantly better than BECN1 siRNA were identified by comparing slopes (inhibition per time unit) and tested by means of Wald tests. Differences in slopes that yielded a p-value < 0.05 were considered statistically significant. Other P-values were calculated by 2-tailed, homoscedastic student’s t-test.
Supplemental Material
Download MS Word (9.5 MB)Acknowledgments
We thank Jiri Bartek, Jay Brenman, Jiri Lukas, and Developmental Studies Hybridoma Bank (developed under auspices of the National Institute of Child Health and Human Resources and maintained by the University of Iowa) for valuable research reagents, and Tiina Naumanen Dietrich, Dianna Skousborg Larsen and Louise Vanderfox for technical assistance.
Disclosure statement
No potential conflict of interest was reported by the authors.
Supplementary material
Supplemental data for this article can be accessed here.
Additional information
Funding
References
- He C, Klionsky DJ. Regulation mechanisms and signaling pathways of autophagy. Annu Rev Genet. 2009;43:67–93.
- Weidberg H, Shvets E, Elazar Z. Biogenesis and cargo selectivity of autophagosomes. Annu Rev Biochem. 2011 Jun 7;80:125–156.
- Kroemer G, Marino G, Levine B. Autophagy and the integrated stress response. Mol Cell. 2010 Oct 22;40(2):280–293.
- Feng Y, He D, Yao Z, et al. The machinery of macroautophagy [Review]. Cell Res. 2014 Jan;24(1):24–41.
- Bento CF, Renna M, Ghislat G, et al. Mammalian autophagy: how does it work? Annu Rev Biochem. 2016 Jun 2;85:685–713.
- Wong PM, Puente C, Ganley IG, et al. The ULK1 complex: sensing nutrient signals for autophagy activation. Autophagy. 2013 Feb 1;9(2):124–137.
- Zhang CS, Jiang B, Li M, et al. The lysosomal v-ATPase-ragulator complex is a common activator for AMPK and mTORC1, acting as a switch between catabolism and anabolism. Cell Metab. 2014 Sep 2;20(3):526–540.
- Lin SC, Hardie DG. AMPK: sensing glucose as well as cellular energy status. Cell Metab. 2018 Feb 6;27(2):299–313.
- Dite TA, Ling NXY, Scott JW, et al. The autophagy initiator ULK1 sensitizes AMPK to allosteric drugs. Nat Commun. 2017 Sep 18;8(1):571.
- Colaco A, Jaattela M. Ragulator-a multifaceted regulator of lysosomal signaling and trafficking. J Cell Biol. 2017 Dec 4;216(12):3895–3898.
- Hoeijmakers JH. Genome maintenance mechanisms for preventing cancer. Nature. 2001 May 17;411(6835):366–374.
- Okada H, Mak TW. Pathways of apoptotic and non-apoptotic death in tumour cells. Nat Rev Cancer. 2004 Aug;4(8):592–603.
- Ciccia A, Elledge SJ. The DNA damage response: making it safe to play with knives. Mol Cell. 2010 Oct 22;40(2):179–204.
- Jackson SP, Bartek J. The DNA-damage response in human biology and disease. Nature. 2009 Oct 22;461(7267):1071–1078.
- Zhang SM, Shang ZF, Zhou PK. Autophagy as the effector and player in DNA damage response of cells to genotoxicants. Toxicol Res (Camb). 2015;4:613–622.
- Sica V, Galluzzi L, Bravo-San Pedro JM, et al. Organelle-specific initiation of autophagy. Mol Cell. 2015 Aug 20;59(4):522–539.
- Lee JH, Budanov AV, Karin M. Sestrins orchestrate cellular metabolism to attenuate aging. Cell Metab. 2013 Dec 3;18(6):792–801.
- Daido S, Yamamoto A, Fujiwara K, et al. Inhibition of the DNA-dependent protein kinase catalytic subunit radiosensitizes malignant glioma cells by inducing autophagy. Cancer Res. 2005 May 15;65(10):4368–4375.
- Farkas T, Høyer-Hansen M, Jäättelä M. Identification of novel autophagy regulators by a luciferase-based assay for the kinetics of autophagic flux. Autophagy. 2009 Oct;5(7):1018–1025.
- Abraham RT. PI 3-kinase related kinases: ‘big’ players in stress-induced signaling pathways. DNA Repair (Amst). 2004 Aug-Sep;3(8–9):883–887.
- Lees-Miller SP, Meek K. Repair of DNA double strand breaks by non-homologous end joining. Biochimie. 2003 Nov;85(11):1161–1173.
- Leahy JJ, Golding BT, Griffin RJ, et al. Identification of a highly potent and selective DNA-dependent protein kinase (DNA-PK) inhibitor (NU7441) by screening of chromenone libraries. Bioorg Med Chem Lett. 2004 Dec 20;14(24):6083–6087.
- Kimura S, Noda T, Yoshimori T. Dissection of the autophagosome maturation process by a novel reporter protein, tandem fluorescent-tagged LC3. Autophagy. 2007 Sep-Oct;3(5):452–460.
- Szyniarowski P, Corcelle-Termeau E, Farkas T, et al. A comprehensive siRNA screen for kinases that suppress macroautophagy in optimal growth conditions. Autophagy. 2011 Aug 1;7(8):892–903.
- Sanders MJ, Ali ZS, Hegarty BD, et al. Defining the mechanism of activation of AMP-activated protein kinase by the small molecule A-769662, a member of the thienopyridone family. J Biol Chem. 2007 Nov 09;282(45):32539–32548.
- Corton JM, Gillespie JG, Hawley SA, et al. 5-aminoimidazole-4-carboxamide ribonucleoside. A specific method for activating AMP-activated protein kinase in intact cells? Eur J Biochem. 1995 Apr 15;229(2):558–565.
- Amatya PN, Kim HB, Park SJ, et al. A role of DNA-dependent protein kinase for the activation of AMP-activated protein kinase in response to glucose deprivation. Biochim Biophys Acta. 2012 Dec;1823(12):2099–2108.
- Scansite 4.0 [|nternet]: scansite; cited 2017 Jun 15. Available from: https://scansite4.mit.edu/4.0/-home
- Hardie DG, Schaffer BE, Brunet A. AMPK: an energy-sensing pathway with multiple inputs and outputs. Trends Cell Biol. 2016 Mar;26(3):190–201.
- Li X, Wang L, Zhou XE, et al. Structural basis of AMPK regulation by adenine nucleotides and glycogen. Cell Res. 2015 Jan;25(1):50–66.
- Hornbeck PV, Zhang B, Murray B, et al. PhosphoSitePlus, 2014: mutations, PTMs and recalibrations. Nucleic Acids Res. 2015 Jan;43(Database issue):D512–20.
- Blackford AN, Jackson SPATM. ATR, and DNA-PK: the trinity at the heart of the DNA damage response. Mol Cell. 2017 Jun 15;66(6):801–817.
- Zhang YL, Guo H, Zhang CS, et al. AMP as a low-energy charge signal autonomously initiates assembly of AXIN-AMPK-LKB1 complex for AMPK activation. Cell Metab. 2013 Oct 1;18(4):546–555.
- Yang Z, Klionsky DJ. Mammalian autophagy: core molecular machinery and signaling regulation. Curr Opin Cell Biol. 2010 Apr;22(2):124–131.
- Lin SY, Li TY, Liu Q, et al. GSK3-TIP60-ULK1 signaling pathway links growth factor deprivation to autophagy. Science. 2012 Apr 27;336(6080):477–481.
- Criollo A, Senovilla L, Authier H, et al. The IKK complex contributes to the induction of autophagy. Embo J. 2010 Feb 3;29(3):619–631.
- Alexander A, Cai SL, Kim J, et al. ATM signals to TSC2 in the cytoplasm to regulate mTORC1 in response to ROS. Proc Natl Acad Sci USA. 2010 Mar 2;107(9):4153–4158.
- Zhen YF, Li ST, Zhu YR, et al. Identification of DNA-PKcs as a primary resistance factor of salinomycin in osteosarcoma cells. Oncotarget. 2016 Nov 29;7(48):79417–79427.
- Yoon JH, Ahn SG, Lee BH, et al. Role of autophagy in chemoresistance: regulation of the ATM-mediated DNA-damage signaling pathway through activation of DNA-PKcs and PARP-1. Biochem Pharmacol. 2012 Mar 15;83(6):747–757.
- Wunderlich W, Fialka I, Teis D, et al. A novel 14-kilodalton protein interacts with the mitogen-activated protein kinase scaffold mp1 on a late endosomal/lysosomal compartment. J Cell Biol. 2001 Feb 19;152(4):765–776.
- Bar-Peled L, Sabatini DM. Regulation of mTORC1 by amino acids. Trends Cell Biol. 2014 Jul;24(7):400–406.
- Liu B, Palmfeldt J, Lin L, et al. STAT3 associates with vacuolar H(+)-ATPase and regulates cytosolic and lysosomal pH. Cell Res. 2018 Oct;28(10):996–1012.
- Lu J, Tang M, Li H, et al. EBV-LMP1 suppresses the DNA damage response through DNA-PK/AMPK signaling to promote radioresistance in nasopharyngeal carcinoma. Cancer Lett. 2016 Sep 28;380(1):191–200.
- Zhang CS, Hawley SA, Zong Y, et al. Fructose-1,6-bisphosphate and aldolase mediate glucose sensing by AMPK. Nature. 2017 Aug 3;548(7665):112–116.
- Oakhill JS, Chen ZP, Scott JW, et al. beta-Subunit myristoylation is the gatekeeper for initiating metabolic stress sensing by AMP-activated protein kinase (AMPK). Proc Natl Acad Sci USA. 2010 Nov 9;107(45):19237–19241.
- Park SJ, Gavrilova O, Brown AL, et al. DNA-PK promotes the mitochondrial, metabolic, and physical decline that occurs during aging. Cell Metab. 2017 May 02;25(5):1135–1146 e7.
- Wong RH, Chang I, Hudak CS, et al. A role of DNA-PK for the metabolic gene regulation in response to insulin. Cell. 2009 Mar 20;136(6):1056–1072.
- Jäättelä M, Benedict M, Tewari M, et al. Bcl-x and Bcl-2 inhibit TNF and Fas-induced apoptosis and activation of phospholipase A2 in breast carcinoma cells. Oncogene. 1995;10:2297–2305.
- Høyer-Hansen M, Bastholm L, Szyniarowski P, et al. Control of macroautophagy by calcium, calmodulin-dependent kinase kinase-ß and Bcl-2. Mol Cell. 2007;25:193–205.
- Tassan JP, Schultz SJ, Bartek J, et al. Cell cycle analysis of the activity, subcellular localization, and subunit composition of human CAK (CDK-activating kinase). J Cell Biol. 1994 Oct;127(2):467–478.
- Sorensen CS, Lukas C, Kramer ER, et al. Nonperiodic activity of the human anaphase-promoting complex-Cdh1 ubiquitin ligase results in continuous DNA synthesis uncoupled from mitosis. Mol Cell Biol. 2000 Oct;20(20):7613–7623.
- Vojtesek B, Bartek J, Midgley CA, et al. An immunochemical analysis of the human nuclear phosphoprotein p53. New monoclonal antibodies and epitope mapping using recombinant p53. J Immunol Methods. 1992 Jul 6;151(1–2):237–244.
- Brenman JE. AMPK/LKB1 signaling in epithelial cell polarity and cell division. Cell Cycle. 2007 Aug;6(22):2755–2759.
- Agilent.com Internet: Agilent; cited 2017 Jan 15. Available from: https://www.agilent.com/en/products/genomics-agilent
- Corcelle-Termeau E, Vindelov SD, Hämälistö S, et al. Excess sphingomyelin disturbs ATG9A trafficking and autophagosome closure. Autophagy. 2016 May 3;12(5):833–849.
- ImageJ.net [Internet]: fiji; cited 2019 Mar 15. Available from: https://www.imagej.net/Fiji
- Svi.nl/homepage [|nternet]: scientific volume imaging; cited 2019 Jun 20. Available from: https://svi.nl/HomePage
- Genscript.com [internet]: genscript; cited 2017 Feb 1. Available from: https://www.genscript.com/
- Ngoei KRW, Langendorf CG, Ling NXY, et al. Structural determinants for small-molecule activation of skeletal muscle AMPK alpha2beta2gamma1 by the glucose importagog SC4. Cell Chem Biol. 2018 Jun 21;25(6):728–737 e9.
- Oakhill JS, Scott JW, Dite TA. Transient expression of AMPK heterotrimer complexes in mammalian cells. Methods Mol Biol. 2018;1732:159–169.
- Diettrich O, Mills K, Johnson AW, et al. Application of magnetic chromatography to the isolation of lysosomes from fibroblasts of patients with lysosomal storage disorders. FEBS Lett. 1998 Dec 28;441(3):369–372.