
ABSTRACT
Quality control of peroxisomes is essential for cellular homeostasis. However, the mechanism underlying pexophagy is largely unknown. In this study, we identified HSPA9 as a novel pexophagy regulator. Downregulation of HSPA9 increased macroautophagy/autophagy but decreased the number of peroxisomes in vitro and in vivo. The loss of peroxisomes by HSPA9 depletion was attenuated in SQSTM1-deficient cells. In HSPA9-deficient cells, the level of peroxisomal reactive oxygen species (ROS) increased, while inhibition of ROS blocked pexophagy in HeLa and SH-SY5Y cells. Importantly, reconstitution of HSPA9 mutants found in Parkinson disease failed to rescue the loss of peroxisomes, whereas reconstitution with wild type inhibited pexophagy in HSPA9-depleted cells. Knockdown of Hsc70-5 decreased peroxisomes in Drosophila, and the HSPA9 mutants failed to rescue the loss of peroxisomes in Hsc70-5-depleted flies. Taken together, our findings suggest that the loss of HSPA9 enhances peroxisomal degradation by pexophagy.
Introduction
Peroxisomes function as a metabolic platform for β-oxidation of very long chain fatty acids, bile acid and ether phospholipid synthesis, and purine catabolism [Citation1]. Peroxisomes and mitochondria are essential organelles for cellular redox regulation; peroxisomes serve dual functions in generating and elimination of reactive oxygen species (ROS) [Citation2]. Thus, peroxisomal biogenesis and degradation must be tightly controlled to prevent dysregulated metabolism and oxidative stresses [Citation1,Citation3]. The estimated half-life of a peroxisome is approximately few days in CHO cells, implying that peroxisome biogenesis and degradation are very dynamic processes [Citation4,Citation5]. Various peroxisomal proteins, known as peroxins (PEXs), regulate peroxisome biogenesis [Citation6,Citation7]. Proteins are imported into peroxisomes by a specific peroxisomal-targeting signal (PTS) motif, including PTS1 and PTS2, which are recognized by the receptors PEX5 and PEX7 [Citation7]. Several peroxisomal matrix proteins have a conserved tripeptide sequence (serine-lysine-leucine, known as the PTS1 motif) in the carboxyl-terminal end, whereas other proteins possess an amino-terminal or internal-nonapeptide PTS2 sequence [Citation7]. In matrix protein import, PEX5 is cyclically regulated in an ubiquitination-dependent manner [Citation8]. During biogenesis, peroxisome growth and division are mediated by components of elongation factors, such as PEX11B, and fission regulators, such as DNM1L, FIS1, and MFF [Citation9,Citation10]. Mutations in PEX genes lead to the development of a group of inheritable diseases known as peroxisomal-biogenesis disorders, which are characterized by multiple defects in peroxisome function [Citation11,Citation12]. However, recent findings suggest that many peroxisomal-biogenesis disorders are caused by dysregulated peroxisomal degradation, as well as a perturbation of peroxisome biogenesis [Citation13], suggesting that regulation of peroxisomal degrdation is important for peroxisomal homeostasis.
Autophagy is a highly conserved, catabolic process involved in removing cellular components and maintaining cellular homeostasis in stress responses [Citation14,Citation15]. During autophagy, the targeted cytosolic constituents are isolated within double-membrane vesicles called autophagosomes, which eventually fuse with lysosomes and become degraded [Citation14,Citation15]. The acidic pH in the lumen of lysosomes is optimal for lysosomal hydrolytic enzymes, which can degrade cellular components. Various autophagy-related (ATG) proteins, including ATG5 and ATG7, mediate autophagy. Pexophagy is a type of autophagy wherein peroxisomes are selectively degraded [Citation16]. Notably, recent studies with conditional atg7 knockout mice revealed that up to 80% of peroxisomes are removed by pexophagy [Citation17,Citation18]. Both Atg36 and Atg37 have been reported to be key regulators of pexophagy in yeast, and ACBD5 (acyl-CoA binding domain containing 5) has been suggested as a mammalian homolog for Atg37 [Citation19,Citation20].
Recent studies showed that the ubiquitination of membrane proteins in specific organelles is required for selective autophagy [Citation21–23]. It was proposed that an increased level of ROS induces pexophagy by activating ATM (ATM serine/threonine kinase), which phosphorylates PEX5, leading to its ubiquitination [Citation24]. In addition, pexophagy was induced by overexpression of SLC25A17/PMP34 ubiquitinated at its cytoplasmic tail [Citation25]. Several receptor proteins that regulate pexophagy have been identified. The SQSTM1 protein, which is a known substrate for autophagic degradation, functions as a selective autophagy receptor. Specifically, SQSTM1 binds to ubiquitinated targets and LC3 protein, which results in autophagic degradation of SQSTM1 as well as its binding targets [Citation26,Citation27]. Thus, ubiquitin (Ub) modifications and SQSTM1 binding cooperate to transport cargo substrates to autophagosomes. In addition to SQSTM1, NBR1 (NBR1 autophagy cargo receptor) proteins serve similar functions as pexophagy receptors [Citation28].
Although several regulators of pexophagy have been identified, the molecular mechanisms underlying pexophagy in mammals are poorly understood. In this study, we identified HSPA9 as a novel pexophagy regulator. Depletion of HSPA9 induced a loss of peroxisomes in vitro and in vivo. Scavenging of peroxisomal ROS suppressed pexophagy in HSPA9-depleted cells. In addition, ectopic expression of loss-of-function HSPA9 mutants did not rescue the loss of peroxisomes, whereas reconstitution with wild type HSPA9 inhibited pexophagy in HSPA9-depleted cells.
Results
Depletion of HSPA9 induces a loss of peroxisomes
To identify novel regulators of peroxisome degradation, we developed a cell-based image screening system using the peroxisome targeted fluorescent protein, turquoise2-PTS1. Targeting of turquoise2-PTS1 to peroxisomes in HeLa cells was confirmed by co-immunostaining with 2 peroxisomal proteins, ABCD3 and CAT (catalase), and a mitochondrial protein, TOMM20 (Fig. S1). We screened a small-interfering RNA (siRNA) library to study peroxisomal- and autophagy-related proteins in cells that stably express turquoise2-PTS1 (HeLa/Peroxi). After transfection with siRNAs, the fluorescence intensities were measured. Based on this screen, we selected HSPA9 as a potent, novel regulator of pexophagy (Fig. S2). Previously, it was reported that HSPA9 regulates the import of mitochondrial proteins such as ATPase components, thereby contributing to mitochondrial protein quality control [Citation29]. However, the role of HSPA9 in pexophagy has not been elucidated. Unlike most other heat shock proteins, HSPA9 is not induced by heat shock stress but is responsive to glucose deprivation, low-level radiation, and oxidative stress, all of which can activate autophagy [Citation29–31]. In addition, inhibition of HSPA9 function increased ROS production in hematopoietic stem cells and neuronal cells [Citation30,Citation32,Citation33]. To confirm the screening results, HeLa/Peroxi cells were transfected with a scrambled or siRNA against HSPA9, and then the peroxisomes were observed by confocal microscopy. 1ʹ10-phenanthroline, a previously identified pexophagy inducer [Citation34], was used as a control. Consistent with the screening results, depletion of HSPA9 strongly induced a loss of peroxisomes (,). Both peroxisomal membrane proteins (PEX1 and ABCD3) and a matrix protein (HSD17B4) are decreased in HSPA9-depleted cells ( and S3).
Figure 1. Depletion of HSPA9 induces loss of peroxisomes in HeLa cells. (A and B) HeLa cells stably expressing turquoise2-Peroxi (HeLa/Peroxi) were transfected with scrambled siRNA (Sc) or HSPA9 -targeting siRNA (siHSPA9). (A) After 5 d, the cells were stained with DRAQ5 dye and imaged by confocal microscopy, and (B) the number of peroxisomes per cell was counted. 1,10-phenanthroline (Phen, 50 μM) was used as a control for induction of pexophagy. (C) HeLa cells were transfected with scrambled siRNA (Sc) or 2 different HSPA9-targeting siRNAs (siHSPA9 #1 and #2). After 5 d, the cells were harvested and analyzed by western blotting with the indicated antibodies. (D) HeLa cells stably expressing turquoise2-Peroxi, mitochondria-YFP, turquoise2-ER, or turquoise2-Golgi were transfected with Sc or siHSPA9 for 5 d, stained with DRAQ5, and fixed. Cellular organelles were imaged by confocal microscopy. (E) HeLa cells transfected with Sc and siHSPA9 were assessed by western blotting with antibodies for protein marker of subcellular organelles (ABCD3, peroxisome; TOMM20, mitochondria; P4HB, endoplasmic reticulum; FTCD, Golgi). Data are presented as the mean ± SEM (n = 3, * p < 0.05). Scale bar: 5 µm
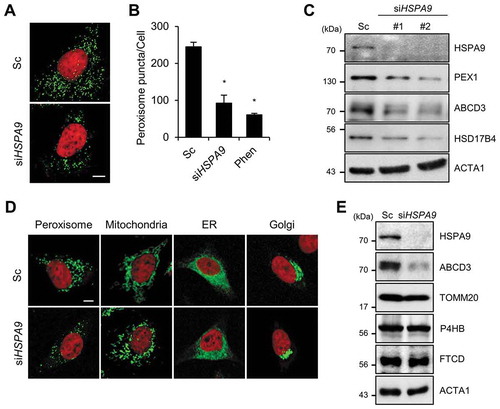
HSPA9 exists in multiple subcellular locations, including the endoplasmic reticulum, centrosomes, nucleus and mitochondria [Citation35–38]. Therefore, we further examined the subcellular localization of HSPA9 by immunostaining assays. Notably, we found that HSPA9 partially co-localizes with ABCD3, a peroxisome marker protein (Fig. S4). To further investigate whether depletion of HSPA9 selectively induces pexophagy, we observed other cellular organelles, including mitochondria, the ER, and the Golgi apparatus, in HSPA9-depleted cells. HeLa/Peroxi, HeLa/ER, HeLa/Golgi, and HeLa/Mitochondria cells were transfected with HSPA9-targeting siRNA (siHSPA9) and the organelles were monitored. Both confocal microscopy analysis and western blotting showed that the ER and Golgi apparatus are not notably affected in HSPA9-depleted cells, but the mitochondria is fragmented and slightly reduced (,, and S3).
We previously reported that downregulation of HSPA9 promotes mitochondrial fragmentation and dysfunction [Citation30]. To investigate the effect of mitochondrial dysfunction on pexophagy induced by loss of HSPA9, we examined pexophagy in response to the knockdown of DNM1L, which is a key player in mitochondrial fission. Knockdown of DNM1L recovered the mitochondrial fragmentation in HSPA9-knockdown cells (Fig. S5). However, the loss of peroxisomes was not notably affected by DNM1L in HSPA9-knockdown cells. In addition, we generated a mutant of HSPA9 by deletion of a mitochondrial targeting signal sequence (MTS), HSPA9 ∆MTS. Overexpression of wild type HSPA9 exhibited a tubular mitochondrial pattern, whereas overexpression of HSPA9 ∆MTS showed some punctate structures (Fig. S6). Interestingly, overexpression of either wild type or HSPA9 ∆MTS significantly reconstituted the loss of peroxisome in HSPA9-knockdown cells (Fig. S6). These results suggest that mitochondrial HSPA9 is not directly involved in the regulation of pexophagy.
Taken together, these results suggest that depletion of HSPA9 induces a loss of peroxisomes.
Depletion of HSPA9 increases pexophagy
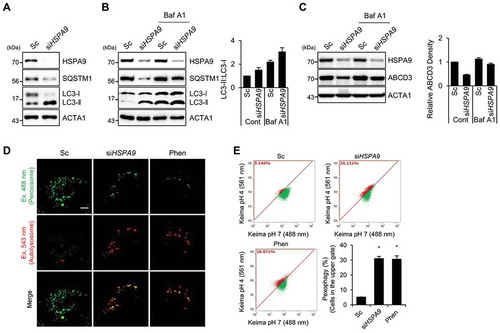
Autophagy is a major degradation pathway for cellular organelles, and we previously showed that autophagy is activated in dysfunctional peroxisomes [Citation34]. Therefore, we further investigated the role of autophagy in HSPA9-depleted cells. Downregulation of HSPA9 resulted in an increase of LC3-II protein but a decrease in SQSTM1, a substrate protein for autophagic degradation (). The level of LC3-II showed greater accumulation after co-treatment with a lysosome fusion inhibitor (bafilomycin A1) than was seen in control cells (). Moreover, we observed the level of ABCD3 is also recovered by bafilomycin A1 (), suggesting that the knockdown of HSPA9 increases autophagy and pexophagy flux. Because a decrease in peroxisome biogenesis and an increase in peroxisome degradation lead to a net loss of peroxisomes, we examined the effect of HSPA9-knockdown on peroxisome biogenesis. The peroxisome proliferator-activated receptors (PPARs) are a group of transcription factors that regulate the expression of genes that contribute to peroxisome biogenesis at the transcriptional level [Citation39,Citation40]. The transcriptional activity of PPARA and PPARD but not PPARG were slightly increased in HSPA9-knockdown HeLa cells (Fig. S7), indicating that the loss of peroxisome is not caused by a decrease in biogenesis. To confirm peroxisomal degradation by autophagy in HSPA9-depleted cells, we employed a vector encoding the Keima protein, which is a coral-derived protein. Keima has been used to evaluate the extent of autophagy because it exhibits a pH-dependent fluorescence, and is resistant to degradation within lysosomes [Citation41]. We also generated a vector encoding Pexo-Keima, which is a variant of the Keima protein that is tagged with a PTS1 motif. When pexophagy was induced, the green fluorescence signal of Pexo-Keima decreased, although its red fluorescence increased, indicating that it localized to an acidic compartment, such as autolysosomes and lysosomes. To confirm the effect of HSPA9 on pexophagy, HeLa cells stably expressing the Pexo-Keima protein (HeLa/Pexo-Keima) were transfected with HSPA9-targeting siRNA, and the ratiometric dual-excitation changes of Keima were measured using both confocal microscopy and flow cytometry. The intensity of green fluorescence of Pexo-Keima decreased but the red fluorescence intensity increased upon HSPA9 depletion (,), which is consistent with the screening results, providing additional support that downregulation of HSPA9 induces pexophagy.
Figure 2. Depletion of HSPA9 induces pexophagy in HeLa cells. (A) HeLa cells were transiently transfected with scrambled siRNA (Sc) or HSPA9-targeting siRNA (siHSPA9) for 5 d and then analyzed by western blotting with the indicated antibodies. (B and C) HSPA9-depleted HeLa cells were further incubated in the presence or absence of bafilomycin A1 (Baf A1), and then the level of LC3 conversion and ABCD3 were analyzed by western blotting. The ratio of LC3-II to LC3-I and ABCD3 expression were determined using a densitometer (bottom). (D and E) HeLa cells stably expressing dKeima-PTS1 (HeLa/Pexo-Keima) were transfected with scrambled siRNA (Sc) or HSPA9-targeting siRNA (siHSPA9) for 4 d or treated with 1,10-phenantholoine (Phen, 50 μM) for 2 d. Thereafter, the cells were fixed and imaged with a confocal microscopy by different excitation wave length (D), and analyzed by flow cytometry (E). Green fluorescence of Pexo-Keima cells represents peroxisomes in the cytosol, whereas red fluorescence reflects peroxisomes in lysosomes. The data are presented as the mean ± SEM (n = 3, * p < 0.05). Scale bar: 5 µm
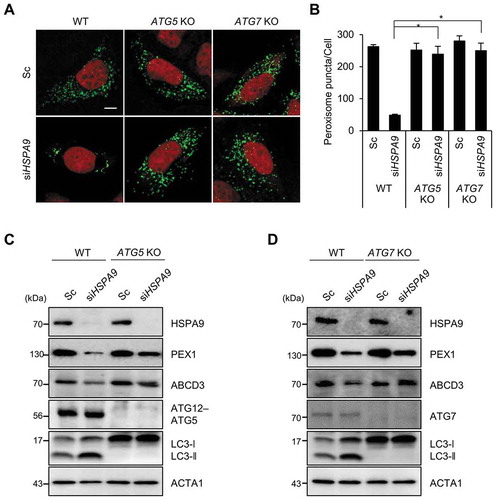
We next investigated the effects of autophagy inhibition on HSPA9-depleted cells. The loss of peroxisomes by HSPA9 knockdown was completely blocked in ATG5 and ATG7 knockout HeLa cells (,). Subsequently, we also examined the levels of peroxisomal proteins and observed that knockout of ATG5 or ATG7 efficiently blocked the decrease of peroxisomal proteins, such as PEX1 and ABCD3, in HSPA9-depleted cells (,). These results indicate that HSPA9 depletion induces pexophagy via an ATG5- and ATG7-dependent canonical autophagy pathway.
Figure 3. ATG5 and ATG7 mediate pexophagy induced by depletion of HSPA9. (A and B) HeLa cells (WT) and ATG5 and ATG7 knockout HeLa cells (ATG5 KO and ATG7 KO, respectively) expressing turquoise-Peroxi (green) were transfected with scrambled siRNA (Sc) or HSPA9-targeting siRNA (siHSPA9). (A) After 5 d, the cells were stained with DRAQ5 (red) and imaged. (B) Cells with a reduced number of peroxisomes were counted. (C and D) WT, ATG5 KO, and ATG7 KO HeLa cells were transfected with scrambled siRNA (Sc) or HSPA9-targeting siRNA (siHSPA9). After 5 d, the cells were harvested and analyzed by western blotting using the indicated antibodies. Data are presented as the mean ± SEM (n = 3, * p < 0.05). Scale bar: 10 µm
SQSTM1 is required for pexophagy in HSPA9-depleted cells
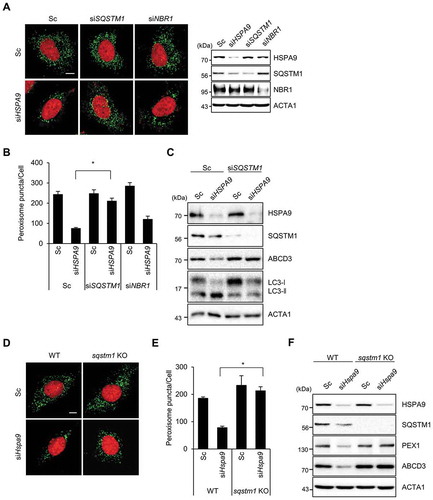
Both SQSTM1 and NBR1 act as autophagy receptor proteins in ubiquitination-mediated pexophagy under stress conditions [Citation16]. To investigate which receptor protein is involved in HSPA9-regulated pexophagy, we investigated how the knockdown of receptor proteins affect HSPA9-regulated pexophagy and found that SQSTM1 knockdown in conjunction with HSPA9 knockdown highly suppresses the loss of peroxisomes (,), suggesting that SQSTM1 mediates pexophagy in HSPA9-depleted cells. In addition, SQSTM1-knockdown restored the expression of peroxisomal membrane proteins ABCD3 and PEX1 (). We confirmed the effect of SQSTM1 on pexophagy in sqstm1-null mouse embryonic fibroblasts (MEFs). Consistently, the pexophagy induced by the loss of HSPA9 was substantially decreased in sqstm1-knockout MEFs (–F), indicating that the autophagy receptor SQSTM1 is required for pexophagy in HSPA9-depleted cells.
Figure 4. SQSTM1 mediates pexophagy in HSPA9-depleted cells. (A-C) HeLa cells were transfected with scrambled siRNA (Sc) or HSPA9-targeting siRNA (siHSPA9) in the presence or absence of siRNAs against the receptor proteins SQSTM1 and NBR1 (siSQSTM1 and siNBR1). (A) After 5 d, nuclei were stained with DRAQ5 and peroxisomes were stained with anti-ABCD3 antibody. Then the cells were imaged by confocal microscopy (left). The efficient knockdown by the siRNA was confirmed by western blotting (right). (B) The number of peroxisomes per cell was calculated by assessing approximately 100 cells. (C) Cells were further analyzed by western blotting with the indicated antibodies. (D-F) and sqstm1 knockout MEFs were transfected with scrambled siRNA (Sc) or Hspa9-targeting siRNA (siHspa9). (D) After 5 d, the cells were stained with DRAQ5 (red) and an anti-ABCD3 antibody (green) and imaged by confocal microscopy. (E) The number of cells exhibiting pexophagy was counted and the cells were analyzed by western blotting with the indicated antibodies (F). Data are presented as the mean ± SEM (n = 3, * p < 0.05). Scale bar: 5 µm
Levels of peroxisomal ROS increase in HSPA9-depleted cells
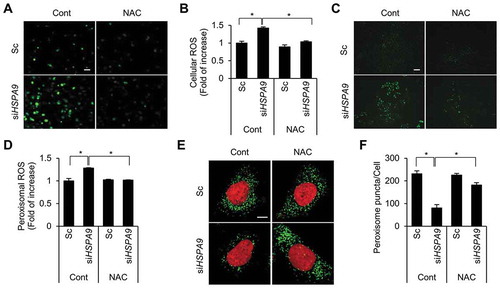
Pexophagy is induced by increased levels of ROS [Citation24] and that the loss of HSPA9 increases ROS generation in neuroblastoma cells [Citation30]. Therefore, we addressed the role of ROS in pexophagy in HSPA9-depleted cells. Consistent with previous reports, HSPA9 depletion increased ROS levels in HeLa cells, and this effect was blocked by treatment with N-acetylcysteine (NAC), a ROS scavenger (,). To further investigate whether HSPA9 depletion increases the level of peroxisomal hydrogen peroxide (H2O2), we employed HyPer, a genetically modified redox-sensitive fluorescent sensor protein that can detect cellular hydrogen peroxide [Citation32]. HeLa cells stably expressing peroxisome-targeted HyPer (HeLa/HyPer-PTS1) were transfected with HSPA9-targeting siRNA, and the fluorescence intensity of HyPer was monitored. Depletion of HSPA9 increased the fluorescence intensity of HyPer-PTS1 (,), suggesting that loss of HSPA9 increases peroxisomal ROS production. Next, we examined the effect of increased ROS levels on pexophagy. Scavenging peroxisomal ROS by treatment with NAC significantly suppressed the loss of peroxisomes in HSPA9-depleted cells (,). These results suggest that the loss of HSPA9 induces pexophagy by enhancing peroxisomal ROS levels.
Figure 5. Depletion of HSPA9 increases the level of peroxisomal ROS. (A and B) HeLa cells were transfected with scrambled siRNA (Sc) or HSPA9 siRNA (siHSPA9) for 4 d, treated with or without NAC (1 mM). Subsequently the cells were incubated with DCFH-DA to obtain fluorescence images (A) and the fluorescence intensity was measured using a microplate reader (B). (C and D) HeLa cells stably expressing HyPer-PTS1 (HeLa/HyPer-PTS1) were transfected with Sc or siHSPA9. After 3 d, the level of peroxisomal ROS was monitored under a fluorescence microscope in the presence or absence of NAC. Scale bar 20 µm. (E and F) HeLa cells were transfected with Sc or siHSPA9 for 4 d, treated with or without NAC (1 mM), stained with DRAQ5 (red) and anti-ABCD3 antibody (green), and imaged with a confocal microscope (E). (F) The number of peroxisomes per cell was calculated by assessing approximately 100 cells. Data are presented as the mean ± SEM (n = 3, * p < 0.05). Scale bar: 5 µm
Loss of HSPA9 induces pexophagy in neuroblastoma cells
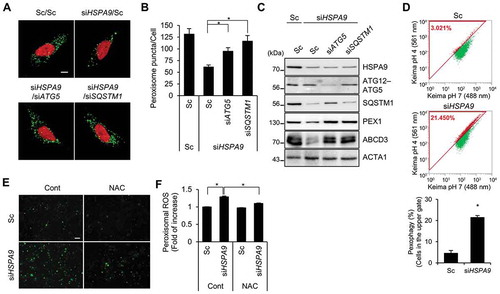
Our group and others have recently reported that decreased expression of HSPA9 is associated with neurodegenerative diseases, such as Alzheimer disease (AD) and Parkinson disease (PD) [Citation30,Citation32,Citation42]. Thus, we further investigated whether HSPA9 affects pexophagy in neuroblastoma cells. SH-SY5Y cells were co-transfected with HSPA9-targeting siRNA and ATG5- or SQSTM1-targeting siRNA, and then the peroxisomes were observed. Depletion of HSPA9 strongly reduced the number of peroxisomes in SH-SY5Y cells; however, this decrease was moderately blocked by additional depletion of ATG5 or SQSTM1 (–). Next, we confirmed our observations using the Pexo-Keima system. SH-SY5Y cells stably expressing Pexo-Keima (SY5Y/Pexo-Keima) were incubated with HSPA9-targeting siRNA, and fluorescence was analyzed by flow cytometry. Consistent with the results obtained in HeLa cells, the red fluorescence intensity increased significantly in HSPA9-depleted cells (), indicating that depletion of HSPA9 also induces pexophagy in SH-SY5Y neuroblastoma cells. We further examined the production of peroxisomal ROS in HSPA9-depleted SH-SY5Y cells. HSPA9 was depleted in SH-SY5Y cells stably expressing HyPer-PTS1 (SY5Y/HyPer-PTS1), and the fluorescence intensity was measured. The fluorescence increase seen in HSPA9-depleted SH-SY5Y cells decreased after treatment with the ROS scavenger NAC (,), suggesting that depleting HSPA9 induces pexophagy by increasing peroxisomal ROS levels in neuroblastoma cells.
Figure 6. Depletion of HSPA9 induces pexophagy in neuroblastoma cells. (A-C) SH-SY5Y cells were transfected with scrambled siRNA (Sc) or HSPA9-targeting siRNA (siHSPA9) in the presence or absence of ATG5- or SQSTM1-targeting siRNA (siATG5 and siSQSTM1, respectively). After 5 d, the cells were stained with DRAQ5 and anti-ABCD3 antibody to get images with confocal microscopy (A). The number of peroxisomes per cell was calculated (B). The cells were further analyzed by western blotting with indicated antibodies (C). (D) SH-SY5Y cells stably expressing dKeima-PTS1 (SY5Y/Pexo-Keima) were transfected with Sc or siHSPA9 for 4 d. The cells were analyzed by flow cytometry. (E and F) SH-SY5Y cells stably expressing HyPer-PTS1 (SY5Y/HyPer-PTS1) were transfected with Sc or siHSPA9 and treated with or without NAC (1 mM). After 3 d, peroxisomal ROS were imaged by fluorescence microscopy (E) and the fluorescence intensity was measured (F). Data are presented as the mean ± SEM (n = 3, * p < 0.05). Scale bar: 5 µm
HSPA9 mutants fail to rescue pexophagy in HSPA9-depleted cells
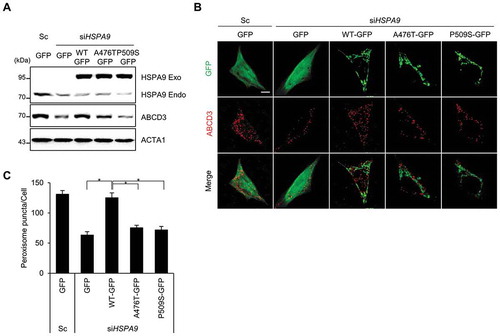
Amino acid substitution mutations in the ATPase domain (HSPA9R126W) and substrate-binding domain (HSPA9A476T and HSPA9P509S) of HSPA9 have been found in PD patients, indicating that the loss of HSPA9 could be associated with PD [Citation32]. However, the effects of these mutants on pexophagy have not been elucidated. To investigate this, wild type HSPA9 and its variants (HSPA9A476T and HSPA9P509S) were overexpressed in neuroblastoma cells following siRNA-mediated depletion of endogenous HSPA9 (). Notably, reconstitution with wild type HSPA9 rescued the loss of peroxisomes in HSPA9-depleted SH-SY5Y cells. However, reconstitution with the HSPA9 mutants did not rescue HSPA9-depleted SH-SY5Y cells from peroxisome loss (,). Taken together, these results indicate that loss-of-function mutations of HSPA9 are potentially associated with pexophagy.
Figure 7. HSPA9 mutants fail to rescue pexophagy in HSPA9-depleted neuroblastoma cells. (A-C) SH-SY5Y cells were transiently co-transfected with siRNA-resistant HSPA9 WT or HSPA9 mutants together with HSPA9-targeting siRNA (siHSPA9). (A) Protein expression of HSPA9 was analyzed by western blotting. (B) Cells were further stained with anti-ABCD3 antibody (red) and imaged by confocal microscopy. (C) Cells exhibiting pexophagy were counted. Data are presented as the mean ± SEM (n = 3, * p < 0.05). Scale bar: 5 µm
Loss of Hsc70-5, a Drosophila homolog of human HSPA9, induces pexophagy in Drosophila
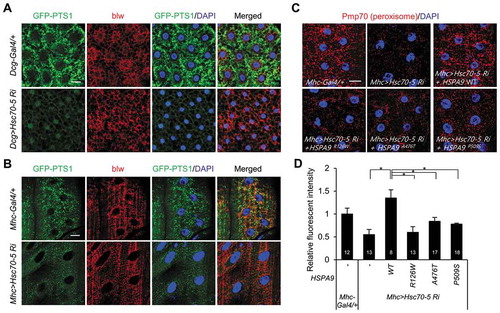
HSPA9 is a heat shock protein that is evolutionarily conserved from yeast to mammals. Hsc70-5 was identified as the Drosophila homolog of human HSPA9 and its protein sequence shows 84% similarity [Citation43]. To elucidate the effect of HSPA9 on pexophagy in Drosophila, Hsc70-5 was depleted in Drosophila fat and muscle tissues using the UAS/Gal4 system [Citation44]. In addition, we established Drosophila that expressed a peroxisome-localized green fluorescent protein (GFP-PTS1; i.e., GFP tagged with PTS1) in muscle or fat tissue to examine peroxisomal dynamics. In control flies, microscopic puncta counting GFP-PTS1 were uniformly distributed in the cytoplasmic region of both fat and muscle tissues (,). However, Hsc70-5 knockdown in fat tissue completely abolished peroxisome labeling with GFP (, S8 and S9). These results indicate that HSPA9 inhibition also induces pexophagy in Drosophila. The HSPA9 mutants did not rescue the loss of peroxisomes in HSPA9-depleted mammalian cells (). To confirm this result in in vivo system, we generated transgenic flies expressing either wild type human HSPA9 (HSPA9 WT) or HSPA9 mutants and investigated their abilities to rescue the loss of peroxisomes induced by Hsc70-5 knockdown. To analyze the peroxisomal dynamics by immunostaining, we generated antiserum against Pmp70, a well-known peroxisome marker (Fig. S8). Reconstitution by overexpressing HSPA9 WT efficiently rescued the loss of peroxisomes in Drosophila muscle tissue upon Hsc70-5 knockdown, whereas overexpression of HSPA9 mutants (HSPA9R126W, HSPA9A476T, or HSPA9P509S) did not (,, and S9). These results further suggest that HSPA9 mutants are associated with peroxisomal degradation in Drosophila and mammals.
Figure 8. Knockdown of Hsc70-5 induces loss of peroxisomes in Drosophila. Representative single-layer confocal images of larval tissues from larvae expressing GFP-PTS1 under the control of a tissue-specific Gal4 driver. (A) WT control flies (Dcg-Gal4/+;UAS-GFP-PTS1) and flies exhibiting Hsc70-5 knockdown in fat tissue (Dcg>Hsc70-5-Ri;UAS-GFP-PTS1). (B) WT control flies (Mhc-Gal4/+;UAS-GFP-PTS1) and flies exhibiting Hsc70-5 knockdown in muscle tissue (Mhc>Hsc70-5-Ri;UAS-GFP- PTS1). Third instar larval tissues were co-stained with DAPI (for nuclei, blue) and an anti-blw antibody (for mitochondria, red). This staining, together with GFP-PTS1 fluorescence (green), is shown in representative single-layer confocal images. (C and D) Rescue experiments in which HSPA9 WT or mutants (HSPA9R126W, HSPA9A476T, and HSPA9P509S) were expressed in flies exhibiting Hsc70-5 knockdown in muscle tissue (Mhc>Hsc70-5-Ri). Peroxisomes were stained with an anti-Pmp70 antibody (red) and imaged by confocal microscopy (C). (D) Quantification of the fluorescence intensity of peroxisome puncta. Data are presented as the mean ± SEM (* p < 0.05). N indicates the number of samples analyzed. Scale bar: 20 µm
Discussion
Peroxisomes are important for various cellular functions such as lipid metabolism, redox balance, and bile acid synthesis. The quality and quantity of peroxisomes are regulated by their biogenesis and degradation. Although the molecular mechanism underlying peroxisome biogenesis is relatively well studied, the mechanisms responsible for peroxisome degradation and elimination are poorly understood. In this study, we found that HSPA9 depletion induces peroxisome loss, both in vitro and in vivo.
HSPA9 is localized primarily in mitochondria; nonetheless, it also found in other subcellular organelles, including the endoplasmic reticulum, centrosomes and nucleus [Citation35–38]. In this study, we observed that HSPA9 is also partially co-localized with peroxisomal marker protein (Fig. S4), although how HSPA9 exists in peroxisomes is unclear. Some peroxisome proteins can localize in the peroxisome matrix without a PTS1 or PTS2 motif [Citation45]. For example, both SOD1 (Cu/Zn superoxide dismutase-1) and LDHB (lactate dehydrogenase B), which do not have typical PTS1 or PTS2 motif are found in the peroxisome matrix as well as in mitochondria and cytosol [Citation45]. They are targeted into peroxisome by interacting with partner protein as a shuttle. Although the binding protein of HSPA9 in peroxisome has not been identified, HSPA9 binds to various proteins as a chaperone protein [Citation46]. Therefore, further study on how HSPA9 exists in peroxisomes is needed.
It was reported that overexpression of a mutant mitochondrial DNA (mtDNA) helicase, which disrupt mtDNA replication increases mitochondrial dysfunction and mitophagy [Citation47]. In addition, loss of an ER lumen protein, P4HB (prolyl 4-hydroxylase subunit beta), which assist in the maturation and transport of unfolded secretory proteins induces ER stress and ER dysfunction [Citation48], suggesting that inhibition of matrix protein affects organelle function. As a multifunctional protein, HSPA9 plays a central role in the folding of mitochondrial matrix proteins. In addition, HSPA9 has many binding partners to act as a guardian against various stress conditions, including glucose-deprivation, low doses of ionizing radiation and calorie restriction [Citation49]. Therefore, it is possible that HSPA9 may have a key role to maintaining peroxisome function as a peroxisomal chaperone protein.
ROS serve as signaling messengers to mediate various physiological responses, and a disrupted redox balance is strongly associated with disease initiation and progression including neurodegenerative diseases. Although mitochondria generate the majority of endogenous ROS, peroxisomes also dynamically support ROS generation and scavenging [Citation2]. Notably, peroxisomes may function at the forefront for initiating the cellular response to oxidative damage [Citation42–44]. Deficiencies in peroxisome antioxidant proteins (e.g., CAT) perturb the mitochondrial redox potential [Citation50], with local peroxisome oxidative damage eventually causing mitochondrial dysfunction [Citation2], suggesting that peroxisomes may serve as upstream initiators of mitochondria ROS signaling. In addition, disruption of CAT (the most abundant antioxidant enzyme in peroxisomes) regulates autophagy, and a CAT inhibitor promotes peroxisome degradation by increasing ROS levels during starvation [Citation51,Citation52]. It was reported that depletion of HSPA9 enhances cellular ROS production [Citation30]. In order to detect mitochondrial and peroxisomal ROS, we developed mito-HyPer and HyPer-PTS1 system, which are targeted to mitochondria and peroxisome, respectively. Importantly, depletion of HSPA9 enhanced peroxisomal ROS levels and subsequent treatment with a ROS scavenger suppressed ROS levels and peroxisome loss in HSPA9-knockdown cells (). Nonetheless, the mitochondrial ROS was also increased by depletion of HSPA9 (Fig. S10), implicating that mitochondrial ROS may indirectly affect to the peroxisome loss in HSPA9-knockdown cells. Although further studies are necessary to explore how the loss of HSPA9 increases peroxisomal ROS, our findings suggest that HSPA9 serves a role in maintaining the quality and function of peroxisomes by properly regulating peroxisomal ROS levels.
During mitophagy, it was reported that damaged mitochondria form aggregates or perinuclear clusters [Citation21,Citation53]. The PINK1-PRKN/Parkin pathway primarily regulates ubiquitin-dependent mitophagy and mitochondria form aggregates in cells with decreased mitochondrial membrane potential in a SQSTM1-dependent manner, suggesting that SQSTM1 is also responsible for the mitochondrial clustering [Citation53]. Similarly, we found that many of the peroxisomes are also arranged in clusters, which co-localized with ubiquitin and SQSTM1 in HSPA9-knockdown cells (Fig. S11). Furthermore, depletion of SQSTM1 attenuated the loss of peroxisomes seen in HSPA9-knockdown cells (), suggesting that the aggregation or clustering of peroxisomes might be an important stage of pexophagy. Therefore, further investigations are needed to elucidate whether organelle clustering represents a distinct arrangement or is a preliminary stage of pexophagy.
In mitophagy, several mitochondrial receptors such as BNIP3L, BNIP3, and FUNDC1 as well as autophagy receptor proteins, including SQSTM1, OPTN, and CALCOCO2 regulate mitophagy in various mitophagy conditions [Citation54]. Likewise, both SQSTM1 and NBR1 function as autophagy receptors in pexophagy in a ubiquitin-dependent manner [Citation23,Citation27]. However, in the loss of peroxisomes in HSPA9-knockdown cells, SQSTM1 may have a more dominant effect than NBR1 (). Therefore, it is possible that NBR1 and SQSTM1 can regulate pexophagy independently in response to different pexophagy stimuli. Recently, Zhang et al. showed that oxidative stress induces pexophagy. In response to enhanced ROS generation, ATM phosphorylates PEX5 at Ser141, which promotes ubiquitination at Lys209 by peroxisomal E3 ligases, after which ubiquitinated PEX5 is recognized by the autophagy receptor protein SQSTM1 on peroxisomal membranes [Citation24]. In oxidative stress-induced pexophagy, peroxisomal proteins such as PEX1 were not reduced in SQSTM1-knockdown cells, suggesting that SQSTM1 contributes primarily to ROS-mediated pexophagy. Consistent with this hypothesis, we found that knockdown of HSPA9 increases the production of ROS and the activation of ATM (Fig. S12). Although additional studies are needed to elucidate the molecular mechanism of pexophagy in response to different stimuli, ROS-ATM-PEX5 and SQSTM1 may be involved in the loss of peroxisomes in HSPA9-knockdown cells.
As a regulatory center for oxidative stress, mitochondria are strongly associated with various neurodegenerative diseases. Hence, the quality control of mitochondria has been considered to be a promising therapeutic target for such diseases. Although peroxisomes also serve essential roles in terms of oxidative damage, cellular redox regulation, and lipid metabolism, their roles in the pathogenesis of PD are poorly understood. It was reported that the levels of oxidized lipids are increased in the substantia nigra of PD patients [Citation55]. And the plasma concentrations of plasmalogen produced in peroxisomes are lower in PD patients than in healthy controls [Citation56]. Impairment of the autophagy-lysosomal pathway is an important pathogenic phenomenon in neurodegenerative diseases. An increased number of autophagosomes caused by defective lysosome-mediated clearance has been detected in PD patients [Citation57]; similar observations are made in AD models. Mutations of ATP13A2, lysosomal ATPase, and GBA, lysosomal glucocerebrosidase, genes have been identified in PD patients [Citation58,Citation59]. In addition, lysosomal malfunction accompanies aggregation of mutant SNCA (synuclein alpha), which is a major component of Lewy bodies in PD, and accumulation of toxic SNCA may be a critical step in the pathogenesis of PD. SNCA is typically removed by chaperone-mediated autophagy (CMA), which directly delivers target proteins to lysosomes for degradation, whereas PD-associated SNCA mutants and dopamine-modified SNCA block CMA activity [Citation60,Citation61]. During CMA, SNCA binds to LAMP2 (lysosomal-associated membrane protein type 2); however, LAMP2 expression is decreased in dopaminergic neuronal cells in PD models [Citation53,Citation62]. In addition, Dehay et al. recently showed that oxidative injury disrupts lysosomal integrity by inducing abnormal permeabilization of lysosomal membranes [Citation57]. Aggregation of SNCA is increased in the brains of pex1 and pex13 knockout mice, and SNCA toxicity is correlated with altered lipid metabolism due to elevated concentrations of n-6 long-chain polyunsaturated fatty acids [Citation63]. These findings suggest that alteration of the autophagy pathway and peroxisomal dysfunction are important aspects of PD. Various mutations in PD-associated genes, such as PINK1, PRKN, and PARK7/DJ-1, impair mitophagy and cause the persistence of damaged mitochondria, which induces oxidative stress and cell death in PD [Citation64–68]. Notably, the loss of HSPA9 function might be associated with PD. Previous proteomic analysis indicated that HSPA9 expression is decreased in the brain tissue of PD patients and that HSPA9 directly interacts with PRKN and PINK1 [Citation42,Citation69–71]. Furthermore, several genetic variants (HSPA9R126W, HSPA9A476T, and HSPA9P509S) of HSPA9 were identified in PD patients [Citation32]. These HSPA9 mutants induces an impaired mitochondrial phenotype by increasing oxidative stress and mitochondrial dysfunction [Citation32,Citation72].
Consistent with the previous notion, we also found that wild type and its mutant (HSPA9A476T and HSPA9P509S) were primary co-localized with mitochondria. In addition, overexpression of wild type HSPA9 suppressed mitochondrial fission in HSPA9-depleted cells, whereas its mutants did not reverse the mitochondrial fragmentation compared with that of control wild type HSPA9 (Fig. S13). More importantly, we observed that the loss of peroxisomes caused by the loss of HSPA9 was rescued by overexpression of HSPA9 WT, but not by the HSPA9 mutants found in PD (). Downregulation of Hsc70-5, the Drosophila homolog of HSPA9, decreased ATP levels and fly viability and impaired locomotion, which are highly reminiscent of the defects observed in Drosophila expressing PD-associated PINK1and PRKN mutants [Citation66,Citation67]. We also demonstrated that the loss of Hsc70-5 induced embryonic lethality and led to loss of most peroxisomes in muscle and fat tissues (). Most studies on factors involved in the pathogenesis of PD have focused on mitophagy and mitochondrial dysfunction; however, dysfunctions of peroxisome biogenesis and peroxisome-mediated lipid metabolism have been recently proposed to contribute to age-related diseases, including PD [Citation72]. Our study suggests that deleterious mutations of HSPA9 are associated with peroxisomal dysfunction in both Drosophila and mammals (,).
Our group showed that HSPA9 expression was reduced in the brain tissue of AD patients as well as PD patients [Citation30,Citation42]. We found that ectopic expression of HSPA9 attenuated amyloid β-mediated oxidative stress and neurotoxicity, while suppression of HSPA9 promoted neuronal injury [Citation30]. Although the pathophysiological role of pexophagy in PD and AD remains unclear, previous studies and our current findings imply that pexophagy contributes to neuronal damage by removing damaged peroxisomes, which is similar to how mitophagy is affected in these diseases. Therefore, we speculate that further investigations of pexophagy at the molecular level will help elucidate the role of peroxisomes in the pathogenesis of neurodegenerative diseases. In conclusion, we demonstrated that the loss of HSPA9 led to peroxisomal dysfunction and pexophagy by increasing the levels of peroxisomal ROS.
Materials and methods
Reagents
The reagents 1ʹ-10-phenanthroline (33510), N-acetyl-cysteine (NAC) (A9165), and bafilomycin A1 (B1793) were purchased from Sigma-Aldrich. The dye DRAQ5 was obtained from Abcam (ab108410). The short interfering RNA (siRNA) targeting for HSPA9 (#1, 5′-GACUAUCGCUCCAUGCCAA-3′ and #2, 5′-AAACGCAAGUGGAAAUUAA-3′) were synthesized from Bioneer (Daejeon, Korea) and targeting ATG5 (5′-CAGGUAAGUCAAGCCUACAUU-3′), SQSTM1 (5′-GCAUUGAAGUUGAUAUCGAUUU-3′), NBR1 (5′-GAAGAGGUAUCCAUCAACAUU-3′), and DNM1L (5′-GAGGUUAUUGAACGACUCA-3′) as well as negative, scrambled siRNA (5-CCUACGCCACCAAUUUCGU-3) were synthesized by Genolution.
Plasmids
A HSPA9 expression plasmid was obtained from 21C Frontier Human Gene Bank (hMU005763) and the HSPA9 cDNA was subcloned into the pEGFP-N3 vector (Addgene, 6081–1; deposited by Vladislav Verkhusha). HSPA9 ∆MTS was generated by deletion of N-terminal MTS sequence of HSPA9 (1–153 bp). HSPA9 genetic variants (HSPA9R126W, HSPA9A476T, and HSPA9P509S), which are resistant to HSPA9 siRNA were generated using a Site-directed Mutagenesis kit (Intron Biotechnology, 15071). The pEGFP-SQSTM1 and mitochondrial-YFP (pMito-YFP) plasmid was kindly provided from L. Yu (Tsinghua University, China) and GS Yoon (Ajou University, Korea). The subcellular localization vectors, pmTurquoise2-ER, pmTurquoise2-Golgi, and pmTurquoise2-Peroxi, in which a cyan fluorescence protein (Turquoise) was fused with an ER, Golgi, or peroxisome targeting sequence respectively, were obtained from Addgene (36204, 36205 and 36203; deposited by Dorus Gadella). HA-tagged ubiquitin (pHA-Ub) was obtained from Addgene (18712; deposited by Edward Yeh). The pHyPer-Cyto and pHyPer-Mito vectors, expressing a fluorescent ratiometric hydrogen peroxide sensor (HyPer) were obtained from Evrogen (FP941 and FP942). The pHyPer-PTS1 vector was generated by modification of the pHyPer-Cyto vector. The peroxisome signal sequence, PTS1 (serine-lysine-leucine) was inserted at the C-terminus of pHyPer-Cyto. Peroxisomal localization of HyPer-PTS1 was confirmed under confocal or fluorescence microscopy.
Cell culture and establishment of stable cell lines
HeLa and SH-SY5Y cells were obtained from the American Type Culture Collection (CCL-2 and CRL-2266). Wild-type and sqstm1 knockout MEF cells were kindly provided by Y.K. Jung (Seoul National University, Seoul. Korea). ATG5 knockout HeLa cells and ATG7 knockout HeLa cells generated with the CRISPR/Cas9 system, were kindly provided by Dr. T. Kanki (Niigata University, Japan). All cells were cultured at 37°C in a 5% CO2 incubator and maintained in DMEM containing 10% FBS (Hyclone, SH30243.01 and SH30084.03) and 1% penicillin-streptomycin (Invitrogen, 15140122). To generate stable cell lines, HeLa cells were transfected with pmTurquoise2-Peroxi (HeLa/Peroxi), pmTurquoise2-Golgi (HeLa/Golgi), pmTurquoise2-ER (HeLa/ER), pHyPer-PTS1 (HeLa/HyPer-PTS1, SY5Y/HyPer-PTS1) or Pexo-Keima (HeLa/Pexo-Keima, SY5Y/Pexo-Keima) using Lipofectamine 2000 (Invitrogen, 11668019) according to the manufacturer’s protocol. Then, stable transfectants were selected by growth in selection medium containing 1 mg/ml of G418 for 7 d (Invitrogen, 10131035). After seeding individual cells, the stable clones were selected under a fluorescence microscope.
siRNA library screening
An arrayed siRNA library pool covering the vast majority of peroxisomal (150) and autophagy-related proteins (572) was used for primary screening (Dharmacon). Each pool consisted of 4 oligonucleotides targeting a different region of the same gene, and each assay plate included non-targeting siRNA as a control. HeLa/Peroxi cells were seeded into 96-well plates, transiently transfected with 50 pmol siRNA using Lipofectamine 2000 (Invitrogen, 11668019) in Opti-MEM (Thermo Fisher Scientific, 31985–070) for 4 h, and then incubated under standard culture conditions for 96 h. Thereafter, peroxisomes in the cells were monitored under a fluorescence microscope in a time-dependent manner (Olympus, IX71) and measured the fluorescence intensity by a microplate reader (PerkinElmer, Victor X3).
Determination of pexophagic cells
To quantify cells with pexophagy, HeLa/Peroxi, HeLa and SH-SY5Y were grown on a cover-glass and transfected with siRNA against HSPA9 for different time points. Then the cells were washed with PBS (WELGENE, LB 001–02) and fixed with 4% para-formaldehyde (Biosesang, P2031) for 20 min and stained with indicated dyes or antibodies. The number of punctate peroxisome structures was determined by using confocal microscopy. The number of peroxisomal structures (ABCD3) and the number of turquoise2-Peroxi puncta were quantified using ImageJ (NIH) and at least 3 trials were performed for each condition as indicated in each figure. The number of peroxisome was calculated by dividing the number of peroxisomal structures and volume of each cell. The same method was done for quantifying number of ABCD3 and Turquoise2-Peroxi puncta.
Pexophagy assay with the Keima system
The dimeric Keima-Red (dKeima) vector was obtained from MBL (AM-V0101M). The Keima protein has an emission spectrum that peaks at 620 nm and a bimodal excitation spectrum peaking at 440 and 586 nm corresponding to the neutral and ionized states of the chromophore’s phenolic hydroxyl moiety. To generate a pexophagy monitoring system, PTS1 sequence was inserted at the C-terminus of dKeima. The Pexo-Keima was constructed by digesting dimeric Keima inserted PTS1 (dKeima-PTS1) and then ligating the fragments of dKeima-PTS1 into similar sites in the pcDNA 3.1/MYC vector (Invitrogen, V85520). With the plasmid, we generated the HeLa/Pexo-Keima and SY5Y/Pexo-Keima cell lines. For cytometry analysis, HeLa/Pexo-Keima and SY5Y/Pexo-Keima cells were transfected with targeting siRNAs (siHSPA9) for 4 d or treated with reagents for 2 d. And the cells were resuspended in sorting buffer (Attune focusing fluid) and were analyzed by ATTune NxT Flow Cytometer (Thermo Fisher Scientific). Measurements of auto-lysosomal Pexo-Keima were made using dual-excitation ratiometric pH measurements at 488 (pH 7) and 561 (pH 4) nm lasers with 590/40 nm and 615/25 nm emission filter. For each sample, 10,000 events were collected and subsequently gated for Pexo-mKeima-positive cells. The data were analyzed using ATTune NxT software (Thermo Fisher Scientific).
Confocal microscopy
Stable cell lines were grown on a cover-glass and transfected with siRNA against HSPA9 for different time points were washed with PBS and fixed with 4% para-formaldehyde for 20 min. Then the fluorescence images of subcellular localization and morphology of peroxisomes were obtained by a confocal laser scanning microscope (Carl Zeiss, LSM 510). To monitoring the Pexo-Keima fluorescence, HeLa/Pexo-Keima cells were transfected with siRNA against HSPA9. After 4 d, the cells were excited using 2 filters (488 nm and 543 nm) and emission was studied using a 590 LP emission filter under a confocal laser scanning microscope.
Western blotting
All lysates were prepared with 2× Laemmli sample buffer (Bio-Rad, 1610737). Total protein quantity was measured using a Bradford solution (Bio-Rad, 5000001) according to the manufacture’s instruction. Then, the samples were separated by SDS-polyacrylamide gel electrophoresis, and transferred to PVDF membrane (Bio-Rad, 1620177). After blocking with 4% skim milk (BD Bioscience, 90002–594) in TBST (Tris base [GenDEPOT, T9200], NaCl [GenDEPOT, G0610], Tween® 20 [Sigma, P7949]), the membrane was incubated with indicated primary antibodies. Anti-PEX1 (ab107381), anti-HSD17B4 (ab110297), anti-ABCD3 (ab3421), anti-PEX13 (ab96841), anti-NBR1 (ab126175), anti-P4HB (ab2792), anti-FTCD (ab27043), anti-p-ATM (ab81292) and anti-ATG5 (ab54033) antibodies were purchased from Abcam; anti-LC3 (NB100-2220) antibody was purchased from NOVUS Biologicals; anti-SQSTM1 (5114) antibodies was purchased from Cell Signaling Technology; anti-HSPA9 (Sc-13967) and anti-TOMM20 (Sc-17764) were purchased from Santa Cruz Biotechnology; anti-ATM (GTX70103) was purchased from GeneTex; anti-ACTA1 (MAB1501) was purchased from Sigma. For protein detection, the membranes were incubated with HRP-conjugated secondary antibodies (Cell Signaling Technology, 7076S and 7074S).
ROS measurement
Cellular ROS levels were measured using a fluorescent dye, dichloro-dihydro-fluorescein diacetate (DCFH-DA), which was obtained from Thermo Fisher Scientific (C2938). Briefly, HeLa cells plated in a 96 well plate were transfected with siRNA in the presence or absence of NAC. After 4 d from transfection, the cells were incubated with DCFH-DA for 30 min. Then, the cells were detached and resuspended in sorting buffer and changes in fluorescence in the cell were analyzed by ATTune NxT flow cytometer (Thermo Fisher Scientific). Measurements of fluorescence were made using excitation at 488 nm lasers with 530/30 nm emission filter. For each sample, 10,000 cells were collected and subsequently gated for DCFH-DA-positive cells. The data were analyzed using ATTune NxT software (Thermo Fisher Scientific).
Peroxisomal ROS measurement
ROS levels in peroxisome were assessed using HyPer system. HeLa/HyPer-PTS1 or SY5Y/HyPer-PTS1 cells were transfected with siRNA in the presence or absence of NAC. Then, the cells were detached and resuspended in sorting buffer and changes in fluorescence in the cell were analyzed by ATTune NxT Flow Cytometer (Thermo Fisher Scientific). Measurements of fluorescence were made using excitation at 488-nm lasers with 530/30-nm emission filter. For each sample, 10,000 cells were collected and subsequently gated for HeLa/HyPer-PTS1 or SY5Y/HyPer-PTS1 positive cells. The data were analyzed using ATTune NxT software (Thermo Fisher Scientific).
PPAR (alpha, delta, gamma) transcription factor assay
PPAR alpha, delta, or gamma was detected by addition of specific primary antibodies directed against the individual PPARs. HeLa cells were transfected with siRNA. Then, nuclear extracts were prepared using Nuclear Extraction Kit from Abcam (ab113474). PPAR activity was assessed using the PPAR (A, D, and G) Transcription Factor Assay Kit Abcam (ab133113). A secondary antibody conjugated to HRP is added to provide a sensitive colorimetric readout at 450 nm using fluorescence plate reader (PerkinElmer, Victor X3)
Drosophila experiments
Drosophila melanogaster flies were housed at 25°C and fed a standard diet of cornmeal, yeast, sugar, and agar media. Mhc-Gal4 (BL#55133), UAS-GFP-PTS1 (BL#28881, BL#28882), and w1118 flies were obtained from the Bloomington Stock Center. Dcg-Gal4 flies were obtained from Dr. J. Graff (UT Southwestern, TX USA). The UAS-Hsc70-5-RNAi line (VDRC 106236) and UAS-Pex3-RNAi line (VDRC 11017) were obtained from the Vienna Drosophila Resource Center. UAS-GFP-PTS1 and UAS-Hsc70-5 RNAi were co-expressed under the control of a muscle-specific (Mhc-Gal4) or fat-specific (Dcg-Gal4) driver to analyze peroxisomal dynamics. To establish transgenic flies expressing human HSPA9, the coding sequences of HSPA9 WT and the mutants HSPA9R126W, HSPA9A476T and HSPA9P509S were subcloned into the pUAS vector (Drosophila Genomics Resource Center, 1000) to generate the pUAS-HSPA9-WT, pUAS-HSPA9R126W, pUAS-HSPA9A476T, and pUAS-HSPA9P509S constructs, respectively. Transgenic flies expressing human HSPA9 were obtained by P-element-mediated germ line transformation [Citation73]. Drosophila Pmp70 antiserum was generated by immunizing guinea pig with a synthetic peptide (QFDGRGSYEFATIDQDKDHFGS) corresponding to the C-terminal sequence (residues 634–665) of Pmp70 (Abfrontier custom service). For immunostaining, fat or muscle tissues from third instar larvae were dissected in phosphate-buffered saline (137 mM NaCl, 2 mM KCl, 10 mM Na2HPO4, 2 mM KH2PO4, pH 7.0), fixed in 4% paraformaldehyde, and blocked in 5% bovine serum albumin and 5% normal goat serum (Sigma, 821006 and S26). Thereafter, samples were incubated with an anti-blw primary antibody (Abcam, ab14748) overnight at 4°C followed by an Alexa Fluor 568-conjugated secondary antibody (Thermo Fisher Scientific, A10037) for 2 h at room temperature. Tissues were mounted in DABCO solution (70% glycerol and 2.5% DABCO; [Sigma, D2522]) and fluorescence images were acquired using a FluoView confocal microscope (Olympus).
Statistical analysis
Data were obtained from at least 3 independent experiments, and presented as means ± S.E.M. Statistical evaluation of the results was performed with one-way ANOVA. Data were considered significant at a value of *p < 0.05.
Abbreviations
| AD | = | Alzheimer disease |
| ATG | = | autophagy-related |
| ATM | = | ATM serine/threonine kinase |
| CMA | = | chaperone-mediated autophagy |
| DCFH-DA | = | dichloro-dihydro-fluorescein diacetate |
| MEF | = | mouse embryonic fibroblast |
| MTS | = | mitochondrial targeting signal sequence |
| NAC | = | N-acetyl-cysteine |
| PD | = | Parkinson disease |
| PEX | = | peroxisomal biogenesis factor |
| PPAR | = | peroxisome proliferator-activated receptor |
| PTS | = | peroxisomal-targeting signal |
| ROS | = | reactive oxygen species |
| SNCA | = | synuclein alpha |
| Ub | = | ubiquitin. |
Supplemental Material
Download Zip (43.7 MB)Disclosure statement
No potential conflict of interest was reported by the authors.
Supplementary material
Supplemental data for this article can be accessed here.
Additional information
Funding
References
- Waterham HR, Ferdinandusse S, Wanders RJ. Human disorders of peroxisome metabolism and biogenesis. Biochim Biophys Acta. 2016 May;1863(5):922–933.
- Fransen M, Nordgren M, Wang B, et al. Role of peroxisomes in ROS/RNS-metabolism: implications for human disease. Biochim Biophys Acta. 2012 Sept;1822(9):1363–1373.
- Honsho M, Yamashita S, Fujiki Y. Peroxisome homeostasis: mechanisms of division and selective degradation of peroxisomes in mammals. Biochim Biophys Acta. 2016 May;1863(5):984–991.
- Poole B, Leighton F, De Duve C. The synthesis and turnover of rat liver peroxisomes. II. Turnover of peroxisome proteins. J Cell Biol. 1969 May;41(2):536–546.
- Huybrechts SJ, Van Veldhoven PP, Brees C, et al. Peroxisome dynamics in cultured mammalian cells. Traffic. 2009 Nov;10(11):1722–1733.
- Fujiki Y, Okumoto K, Mukai S, et al. Peroxisome biogenesis in mammalian cells. Front Physiol. 2014;5:307.
- Kim PK, Hettema EH. Multiple pathways for protein transport to peroxisomes. J Mol Biol. 2015 Mar 27;427(6Pt A):1176–1190.
- Wang W, Subramani S. Role of PEX5 ubiquitination in maintaining peroxisome dynamics and homeostasis. Cell Cycle (Georgetown, Tex). 2017;16(21):2037–2045.
- Koch J, Pranjic K, Huber A, et al. PEX11 family members are membrane elongation factors that coordinate peroxisome proliferation and maintenance. J Cell Sci. 2010 Oct 1;123(Pt 19):3389–3400.
- Williams C, Opalinski L, Landgraf C, et al. The membrane remodeling protein Pex11p activates the GTPase Dnm1p during peroxisomal fission. Proc Natl Acad Sci U S A. 2015 May 19;112(20):6377–6382.
- Steinberg SJ, Dodt G, Raymond GV, et al. Peroxisome biogenesis disorders. Biochim Biophys Acta. 2006 Dec;1763(12):1733–1748.
- Braverman NE, Raymond GV, Rizzo WB, et al. Peroxisome biogenesis disorders in the Zellweger spectrum: an overview of current diagnosis, clinical manifestations, and treatment guidelines. Mol Genet Metab. 2016 Mar;117(3):313–321.
- Nazarko TY. Pexophagy is responsible for 65% of cases of peroxisome biogenesis disorders. Autophagy. 2017 May 4;13(5):991–994.
- Mizushima N, Levine B. Autophagy in mammalian development and differentiation. Nat Cell Biol. 2010 Sept;12(9):823–830.
- Mizushima N, Komatsu M. Autophagy: renovation of cells and tissues. Cell. 2011 Nov 11;147(4):728–741.
- Cho DH, Kim YS, Jo DS, et al. Pexophagy: molecular mechanisms and implications for health and diseases. Mol Cells. 2018 Jan 31;41(1):55–64.
- Komatsu M, Waguri S, Ueno T, et al. Impairment of starvation-induced and constitutive autophagy in Atg7-deficient mice. J Cell Biol. 2005 May 9;169(3):425–434.
- Iwata J, Ezaki J, Komatsu M, et al. Excess peroxisomes are degraded by autophagic machinery in mammals. J Biol Chem. 2006 Feb 17;281(7):4035–4041.
- Motley AM, Nuttall JM, Hettema EH. Atg36: the Saccharomyces cerevisiae receptor for pexophagy. Autophagy. 2012 Nov;8(11):1680–1681.
- Nazarko TY, Ozeki K, Till A, et al. Peroxisomal Atg37 binds Atg30 or palmitoyl-CoA to regulate phagophore formation during pexophagy. J Cell Biol. 2014 Feb 17;204(4):541–557.
- Vives-Bauza C, Zhou C, Huang Y, et al. PINK1-dependent recruitment of Parkin to mitochondria in mitophagy. Proc Natl Acad Sci U S A. 2010 Jan 5;107(1):378–383.
- Yamashita S, Abe K, Tatemichi Y, et al. The membrane peroxin PEX3 induces peroxisome-ubiquitination-linked pexophagy. Autophagy. 2014 Sept;10(9):1549–1564.
- Feng L, Zhang J, Zhu N, et al. Ubiquitin ligase SYVN1/HRD1 facilitates degradation of the SERPINA1 Z variant/alpha-1-antitrypsin Z variant via SQSTM1/p62-dependent selective autophagy. Autophagy. 2017 Apr 3;13(4):686–702.
- Zhang J, Tripathi DN, Jing J, et al. ATM functions at the peroxisome to induce pexophagy in response to ROS. Nat Cell Biol. 2015 Oct;17(10):1259–1269.
- Kim PK, Hailey DW, Mullen RT, et al. Ubiquitin signals autophagic degradation of cytosolic proteins and peroxisomes. Proc Natl Acad Sci U S A. 2008 Dec 30;105(52):20567–20574.
- Ichimura Y, Kumanomidou T, Sou YS, et al. Structural basis for sorting mechanism of p62 in selective autophagy. J Biol Chem. 2008 Aug 15;283(33):22847–22857.
- Kirkin V, Lamark T, Sou YS, et al. A role for NBR1 in autophagosomal degradation of ubiquitinated substrates. Mol Cell. 2009 Feb 27;33(4):505–516.
- Deosaran E, Larsen KB, Hua R, et al. NBR1 acts as an autophagy receptor for peroxisomes. J Cell Sci. 2013 Feb 15;126(Pt 4):939–952.
- Kampinga HH, Craig EA. The HSP70 chaperone machinery: J proteins as drivers of functional specificity. Nat Rev Mol Cell Biol. 2010 Aug;11(8):579–592.
- Park SJ, Shin JH, Jeong JI, et al. Down-regulation of mortalin exacerbates Abeta-mediated mitochondrial fragmentation and dysfunction. J Biol Chem. 2014 Jan 24;289(4):2195–2204.
- Deocaris CC, Widodo N, Shrestha BG, et al. Mortalin sensitizes human cancer cells to MKT-077-induced senescence. Cancer Lett. 2007 July 18;252(2):259–269.
- Burbulla LF, Schelling C, Kato H, et al. Dissecting the role of the mitochondrial chaperone mortalin in Parkinson’s disease: functional impact of disease-related variants on mitochondrial homeostasis. Hum Mol Genet. 2010 Nov 15;19(22):4437–4452.
- Tai-Nagara I, Matsuoka S, Ariga H, et al. Mortalin and DJ-1 coordinately regulate hematopoietic stem cell function through the control of oxidative stress. Blood. 2014 Jan 2;123(1):41–50.
- Jo DS, Bae DJ, Park SJ, et al. Pexophagy is induced by increasing peroxisomal reactive oxygen species in 1ʹ10-phenanthroline-treated cells. Biochem Biophys Res Commun. 2015 Nov 13;467(2):354–360.
- Ma Z, Izumi H, Kanai M, et al. Mortalin controls centrosome duplication via modulating centrosomal localization of p53. Oncogene. 2006 Aug 31;25(39):5377–5390.
- Kanai M, Ma Z, Izumi H, et al. Physical and functional interaction between mortalin and Mps1 kinase. Genes Cells. 2007 June;12(6):797–810.
- Ran Q, Wadhwa R, Kawai R, et al. Extramitochondrial localization of mortalin/mthsp70/PBP74/GRP75. Biochem Biophys Res Commun. 2000 Aug 18;275(1):174–179.
- Rozenberg P, Kocsis J, Saar M, et al. Elevated levels of mitochondrial mortalin and cytosolic HSP70 in blood as risk factors in patients with colorectal cancer. Int J Cancer. 2013 July 15;133(2):514–518.
- Issemann I, Green S. Activation of a member of the steroid hormone receptor superfamily by peroxisome proliferators. Nature. 1990 Oct 18;347(6294):645–650.
- DeLuca JG, Doebber TW, Kelly LJ, et al. Evidence for peroxisome proliferator-activated receptor (PPAR)alpha-independent peroxisome proliferation: effects of PPARgamma/delta-specific agonists in PPARalpha-null mice. Mol Pharmacol. 2000 Sept;58(3):470–476.
- Katayama H, Kogure T, Mizushima N, et al. A sensitive and quantitative technique for detecting autophagic events based on lysosomal delivery. Chem Biol. 2011 Aug 26;18(8):1042–1052.
- Cook TJ, Hoekstra JG, Eaton DL, et al. Mortalin is expressed by astrocytes and decreased in the midbrain of Parkinson’s disease patients. Brain Pathol. 2016 Jan;26(1):75–81.
- Zhu JY, Vereshchagina N, Sreekumar V, et al. Knockdown of Hsc70-5/mortalin induces loss of synaptic mitochondria in a Drosophila Parkinson’s disease model. PloS One. 2013;8(12):e83714.
- Brand AH, Perrimon N. Targeted gene expression as a means of altering cell fates and generating dominant phenotypes. Development. 1993 June;118(2):401–415.
- Islinger M, Li KW, Seitz J, et al. Hitchhiking of Cu/Zn superoxide dismutase to peroxisomes–evidence for a natural piggyback import mechanism in mammals. Traffic. 2009 Nov;10(11):1711–1721.
- Wadhwa R, Taira K, Kaul SC. An Hsp70 family chaperone, mortalin/mthsp70/PBP74/Grp75: what, when, and where? Cell Stress Chaperones. 2002 July;7(3):309–316.
- Suen DF, Narendra DP, Tanaka A, et al. Parkin overexpression selects against a deleterious mtDNA mutation in heteroplasmic cybrid cells. Proc Natl Acad Sci U S A. 2010;107:11835–11840.
- Perri ER, Thomas CJ, Parakh S, et al. The unfolded protein response and the role of protein disulfide isomerase in neurodegeneration. Front Cell Dev Biol. 2015;3:80.
- Kaul SC, Deocaris CC, Wadhwa R. Three faces of mortalin: a housekeeper, guardian and killer. Exp Gerontol. 2007;42:263–274.
- Hwang I, Lee J, Huh JY, et al. Catalase deficiency accelerates diabetic renal injury through peroxisomal dysfunction. Diabetes. 2012;61:728–738.
- Petersen M, Hofius D, Andersen SU. Signaling unmasked: autophagy and catalase promote programmed cell death. Autophagy. 2014;10:520–521.
- Lee JN, Dutta RK, Maharjan Y, et al. Catalase inhibition induces pexophagy through ROS accumulation. Biochem Biophys Res Commun. 2018;501:696–702.
- Narendra D, Kane LA, Hauser DN, et al. p62/SQSTM1 is required for Parkin-induced mitochondrial clustering but not mitophagy; VDAC1 is dispensable for both. Autophagy. 2010;6:1090–1106.
- Yoo SM, Jung YK. A molecular approach to mitophagy and mitochondrial dynamics. Mol Cells. 2018;41:18–26.
- Kaul SC, Aida S, Yaguchi T, et al. Activation of wild type p53 function by its mortalin-binding, cytoplasmically localizing carboxyl terminus peptides. J Biol Chem. 2005;280:39373–39379.
- Bosco DA, Fowler DM, Zhang Q, et al. Elevated levels of oxidized cholesterol metabolites in Lewy body disease brains accelerate alpha-synuclein fibrilization. Nat Chem Biol. 2006;2:249–253.
- Dehay B, Martinez-Vicente M, Caldwell GA, et al. Lysosomal impairment in Parkinson’s disease. Mov Disord. 2013;28:725–732.
- Ramirez A, Heimbach A, Grundemann J, et al. Hereditary parkinsonism with dementia is caused by mutations in ATP13A2, encoding a lysosomal type 5 P-type ATPase. Nat Genet. 2006;38:1184–1191.
- Aharon-Peretz J, Rosenbaum H, Gershoni-Baruch R. Mutations in the glucocerebrosidase gene and Parkinson’s disease in Ashkenazi Jews. N Engl J Med. 2004;351:1972–1977.
- Cuervo AM, Stefanis L, Fredenburg R, et al. Impaired degradation of mutant alpha-synuclein by chaperone-mediated autophagy. Science (New York, NY). 2004;305:1292–1295.
- Martinez-Vicente M, Talloczy Z, Kaushik S, et al. Dopamine-modified alpha-synuclein blocks chaperone-mediated autophagy. J Clin Invest. 2008;118:777–788.
- Wu G, Wang X, Feng X, et al. Altered expression of autophagic genes in the peripheral leukocytes of patients with sporadic Parkinson’s disease. Brain Res. 2011;1394:105–111.
- Joselin AP, Hewitt SJ, Callaghan SM, et al. ROS-dependent regulation of Parkin and DJ-1 localization during oxidative stress in neurons. Hum Mol Genet. 2012;21:4888–4903.
- Matsuda N, Sato S, Shiba K, et al. PINK1 stabilized by mitochondrial depolarization recruits Parkin to damaged mitochondria and activates latent Parkin for mitophagy. J Cell Biol. 2010;189:211–221.
- Jin SM, Youle RJ. PINK1- and Parkin-mediated mitophagy at a glance. J Cell Sci. 2012;125:795–799.
- Nguyen TN, Padman BS, Lazarou M. Deciphering the molecular signals of PINK1/Parkin mitophagy. Trends Cell Biol. 2016;26:733–744.
- Truban D, Hou X, Caulfield TR, et al. PINK1, Parkin, and mitochondrial quality control: what can we learn about Parkinson’s disease pathobiology? J Parkinsons Dis. 2017;7:13–29.
- Davison EJ, Pennington K, Hung CC, et al. Proteomic analysis of increased Parkin expression and its interactants provides evidence for a role in modulation of mitochondrial function. Proteomics. 2009;9:4284–4297.
- Rakovic A, Grunewald A, Voges L, et al. PINK1-interacting proteins: proteomic analysis of overexpressed PINK1. Parkinson’s Dis. 2011;2011:153979.
- Jin J, Hulette C, Wang Y, et al. Proteomic identification of a stress protein, mortalin/mthsp70/GRP75: relevance to Parkinson disease. Mol Cell Proteomics. 2006;5:1193–1204.
- Yang H, Zhou X, Liu X, et al. Mitochondrial dysfunction induced by knockdown of mortalin is rescued by Parkin. Biochem Biophys Res Commun. 2011;410:114–120.
- Cipolla CM, Lodhi IJ. Peroxisomal dysfunction in age-related diseases. Trends Endocrinol Metab. 2017;28:297–308.
- Rubin GM, Spradling AC. Genetic transformation of Drosophila with transposable element vectors. Science (New York, NY). 1982;218:348–353.